Article

Improving the Performance of Automated Rooftop Extraction through Geospatial Stratified and Optimized Sampling

1
The Key Laboratory of Virtual Geographic Environment (Ministry of Education of PRC), Nanjing Normal University, Nanjing 210023, China
2
The State Key Laboratory Cultivation Base of Geographical Environment Evolution, Nanjing 210023, China
3
The Jiangsu Center for Collaborative Innovation in Geographical Information Resource Development and Application, Nanjing 210023, China
4
The School of Geography and Ocean Science, Nanjing University, Nanjing 210023, China
5
The Jiangsu Provincial Key Laboratory for NSLSCS, School of Mathematical Science, Nanjing Normal University, Nanjing 210023, China
6
The Key Laboratory of Urban Land Resources Monitoring and Simulation, Ministry of Natural Resources, Shenzhen 518034, China
*
Author to whom correspondence should be addressed.
Remote Sens. 2022, 14(19), 4961; https://doi.org/10.3390/rs14194961
Submission received: 23 August 2022 / Revised: 16 September 2022 / Accepted: 30 September 2022 / Published: 5 October 2022

Abstract

:
Accurate and timely access to building rooftop information is very important for urban management. The era of big data brings new opportunities for rooftop extraction based on deep learning and high-resolution satellite imagery. However, collecting representative datasets from such big data to train deep learning models efficiently is an essential problem that still needs to be explored. In this study, geospatial stratified and optimized sampling (GSOS) based on geographical priori information and optimization of sample spatial location distribution is proposed to acquire representative samples. Specifically, the study area is stratified based on land cover to divide the rooftop-dense stratum and the rooftop-sparse stratum. Within each stratum, an equal amount of samples is collected and their spatial locations are optimized. To evaluate the effectiveness of the proposed strategy, several qualitive and quantitative experiments are conducted. As a result, compared with other common sampling approaches (e.g., random sampling, stratified random sampling, and optimized sampling), GSOS is superior in terms of the abundance and types of collected samples. Furthermore, two quantitative metrics, the F1-score and Intersection over Union (IoU), are reported for rooftop extraction based on deep learning methods and different sampling methods, in which the results based on GSOS are on average 9.88% and 13.20% higher than those based on the other sampling methods, respectively. Moreover, the proposed sampling strategy is able to obtain representative training samples for the task of building rooftop extractions and may serve as a viable method to alleviate the labour-intensive problem in the construction of rooftop benchmark datasets.

1. Introduction

Basic geospatial data are an important foundation for urban sensing and modelling. Its collection, updating and expansion are basic parts for smart city construction [1,2,3]. Buildings, which are an important urban physical element, adequately carry the natural and human activities of human beings. The rooftop area information derived from buildings can be used as significant basic data for sustainable urban development, urban planning, and integrated urban-rural development [4,5,6].
Current rooftop area information collection mainly relies on photogrammetry, manual remote sensing interpretation and airborne laser scanning, which are labour- or material-intensive and difficult to extend to the large-scale data acquisition. In recent years, with the support of massive geospatial data and the development of computer software and hardware, deep learning has demonstrated superior accuracy, robustness, and efficiency in rooftop recognition. Deep learning has made great progress in the application of rooftop area extraction based on multiple data sources, such as remote sensing imagery, light detection and ranging, and digital surface models, and has become a mainstream problem-solving solution [7,8,9,10,11]. Currently, many studies that focus on model-level improvements propose a series of state-of-the-art end-to-end network model architectures [12,13,14,15]. These network model architectures are specifically designed to efficiently extract rooftop information about the area [16], structure lines [17], and building styles [18]. However, when dealing with rooftop area extractions on a large scale (e.g., up to the city, national or even the world), it is difficult to extract useful features from large amounts of disorganized data only through model-level improvements. On the other hand, if the data are input directly into the model without selection, more noise and redundant information will be introduced [19,20,21]. This will result in difficult convergence of the model and inaccurate rooftop extractions, making the rooftop area dataset produced based on the model of poor quality.
Sampling is the collection of parts out of the overall data set for model development. Given the nature of the data-driven method, the quality of data collected by sampling directly affects the final inference performance of the deep learning model [20,22,23]. However, acquiring high-quality data, especially with labels, is costly. Particularly in geospatial science, data labelling requires a great deal of expertise, and it is difficult to collect data efficiently with crowdsourcing [21]. Therefore, a combination of data characteristics and an effective sampling method, i.e., collecting representative image patches from satellite images of the entire study area, can be considered when extracting information on large-scale rooftop area information. Such an integrated approach can produce representative samples from a large amount of data and reduce the sample size while obtaining enough representative information, thereby saving manpower costs and improving model performance.
It has been confirmed that the spatial distribution of buildings is characterized by the “closer the more similar” (the first law of geography) [24] and spatial heterogeneity (the second law of geography) [25]. Therefore, for a deep learning-based rooftop extraction task, it is inefficient to collect data through sampling methods without considering the existing spatial distribution characteristics of buildings. Not only is it difficult to obtain representative samples of building rooftop areas, but it also results in a serious imbalance of sample categories (i.e., the proportion of rooftop targets is much smaller than the proportion of non-rooftop targets) [6,26,27]. Additionally, sampling that does not take spatial information into account is likely to capture adjacent or close samples with similar rooftops, and information redundancy will ensue.
A solution to the imbalance problem of sample categories is given by stratified sampling that considers spatially stratified heterogeneity [28,29,30,31]. The guiding idea is to independently sample in each stratum with as little variation as possible within the stratum and as much variation as possible between the strata [32]. A solution to the information redundancy problem is given by target-optimal sampling. By optimizing the sample spatial location distribution in terms of the coverage and rationality, the information richness of the sample can be effectively improved. Currently, the above sampling methods are widely applied and validated in studies such as water detection [33], soil collection [34,35], and atmospheric pollutant surveys [36]. However, the optimization of sample preparation by these sampling methods is rarely carried out in the application of rooftop area extractions. On the other hand, rooftop extraction tasks based on remote sensing and deep learning have inherently complex, multimodal variability. In this task, the characteristics of the sensors, the geometry of the observation and the semantic content can vary considerably. The effectiveness of implementing sample preparation optimization based on these methods needs to be further validated.
In this paper, a geospatial stratified and optimized sampling (GSOS) strategy aimed at improving the performance of deep learning-based extractions of building rooftop areas from the data preparation level is proposed. To maintain the high and consistent quality of the data source, we introduce Google Earth satellite (GES) imagery and recently published vectorized rooftop area data [6]. The former is utilized as the data source, and the latter is utilized as ground truth data for training and validating deep learning models. Land cover is introduced as the a priori information to split the study area into various regions. Thus, spatial simulated annealing (SSA), considering the distance between each sample’s location, is adopted to improve sample coverage and acquire highly representative samples for model training. Finally, quantitative comparison studies for sample sets and models are designed to demonstrate the effectiveness of our strategy.
The rest of this paper is organized as follows. In Section 2, the materials of this study are introduced. In Section 3, the design and evaluation metrics of the GSOS are presented. In Section 4, the comparative experiments are demonstrated, and the effectiveness of GSOS is analysed. In Section 5, the limitations of the experiment and possible improvements are discussed. Finally, we conclude in Section 6.

2. Materials

2.1. Study Area

The study area is Nanjing in Jiangsu Province, China (see Figure 1). By the end of 2021, this city had a built-up area of nearly 870 km2, a resident population of over 9 million, an urbanization rate of 86.9% and an economic output that consistently ranks among the top ten cities in China. Nanjing is the ancient capital of the Six Dynasties and an important central city in eastern China. The long history and important position of this city can offer a diverse and representative range of building styles.

2.2. Dataset

2.2.1. Google Earth Satellite Imagery

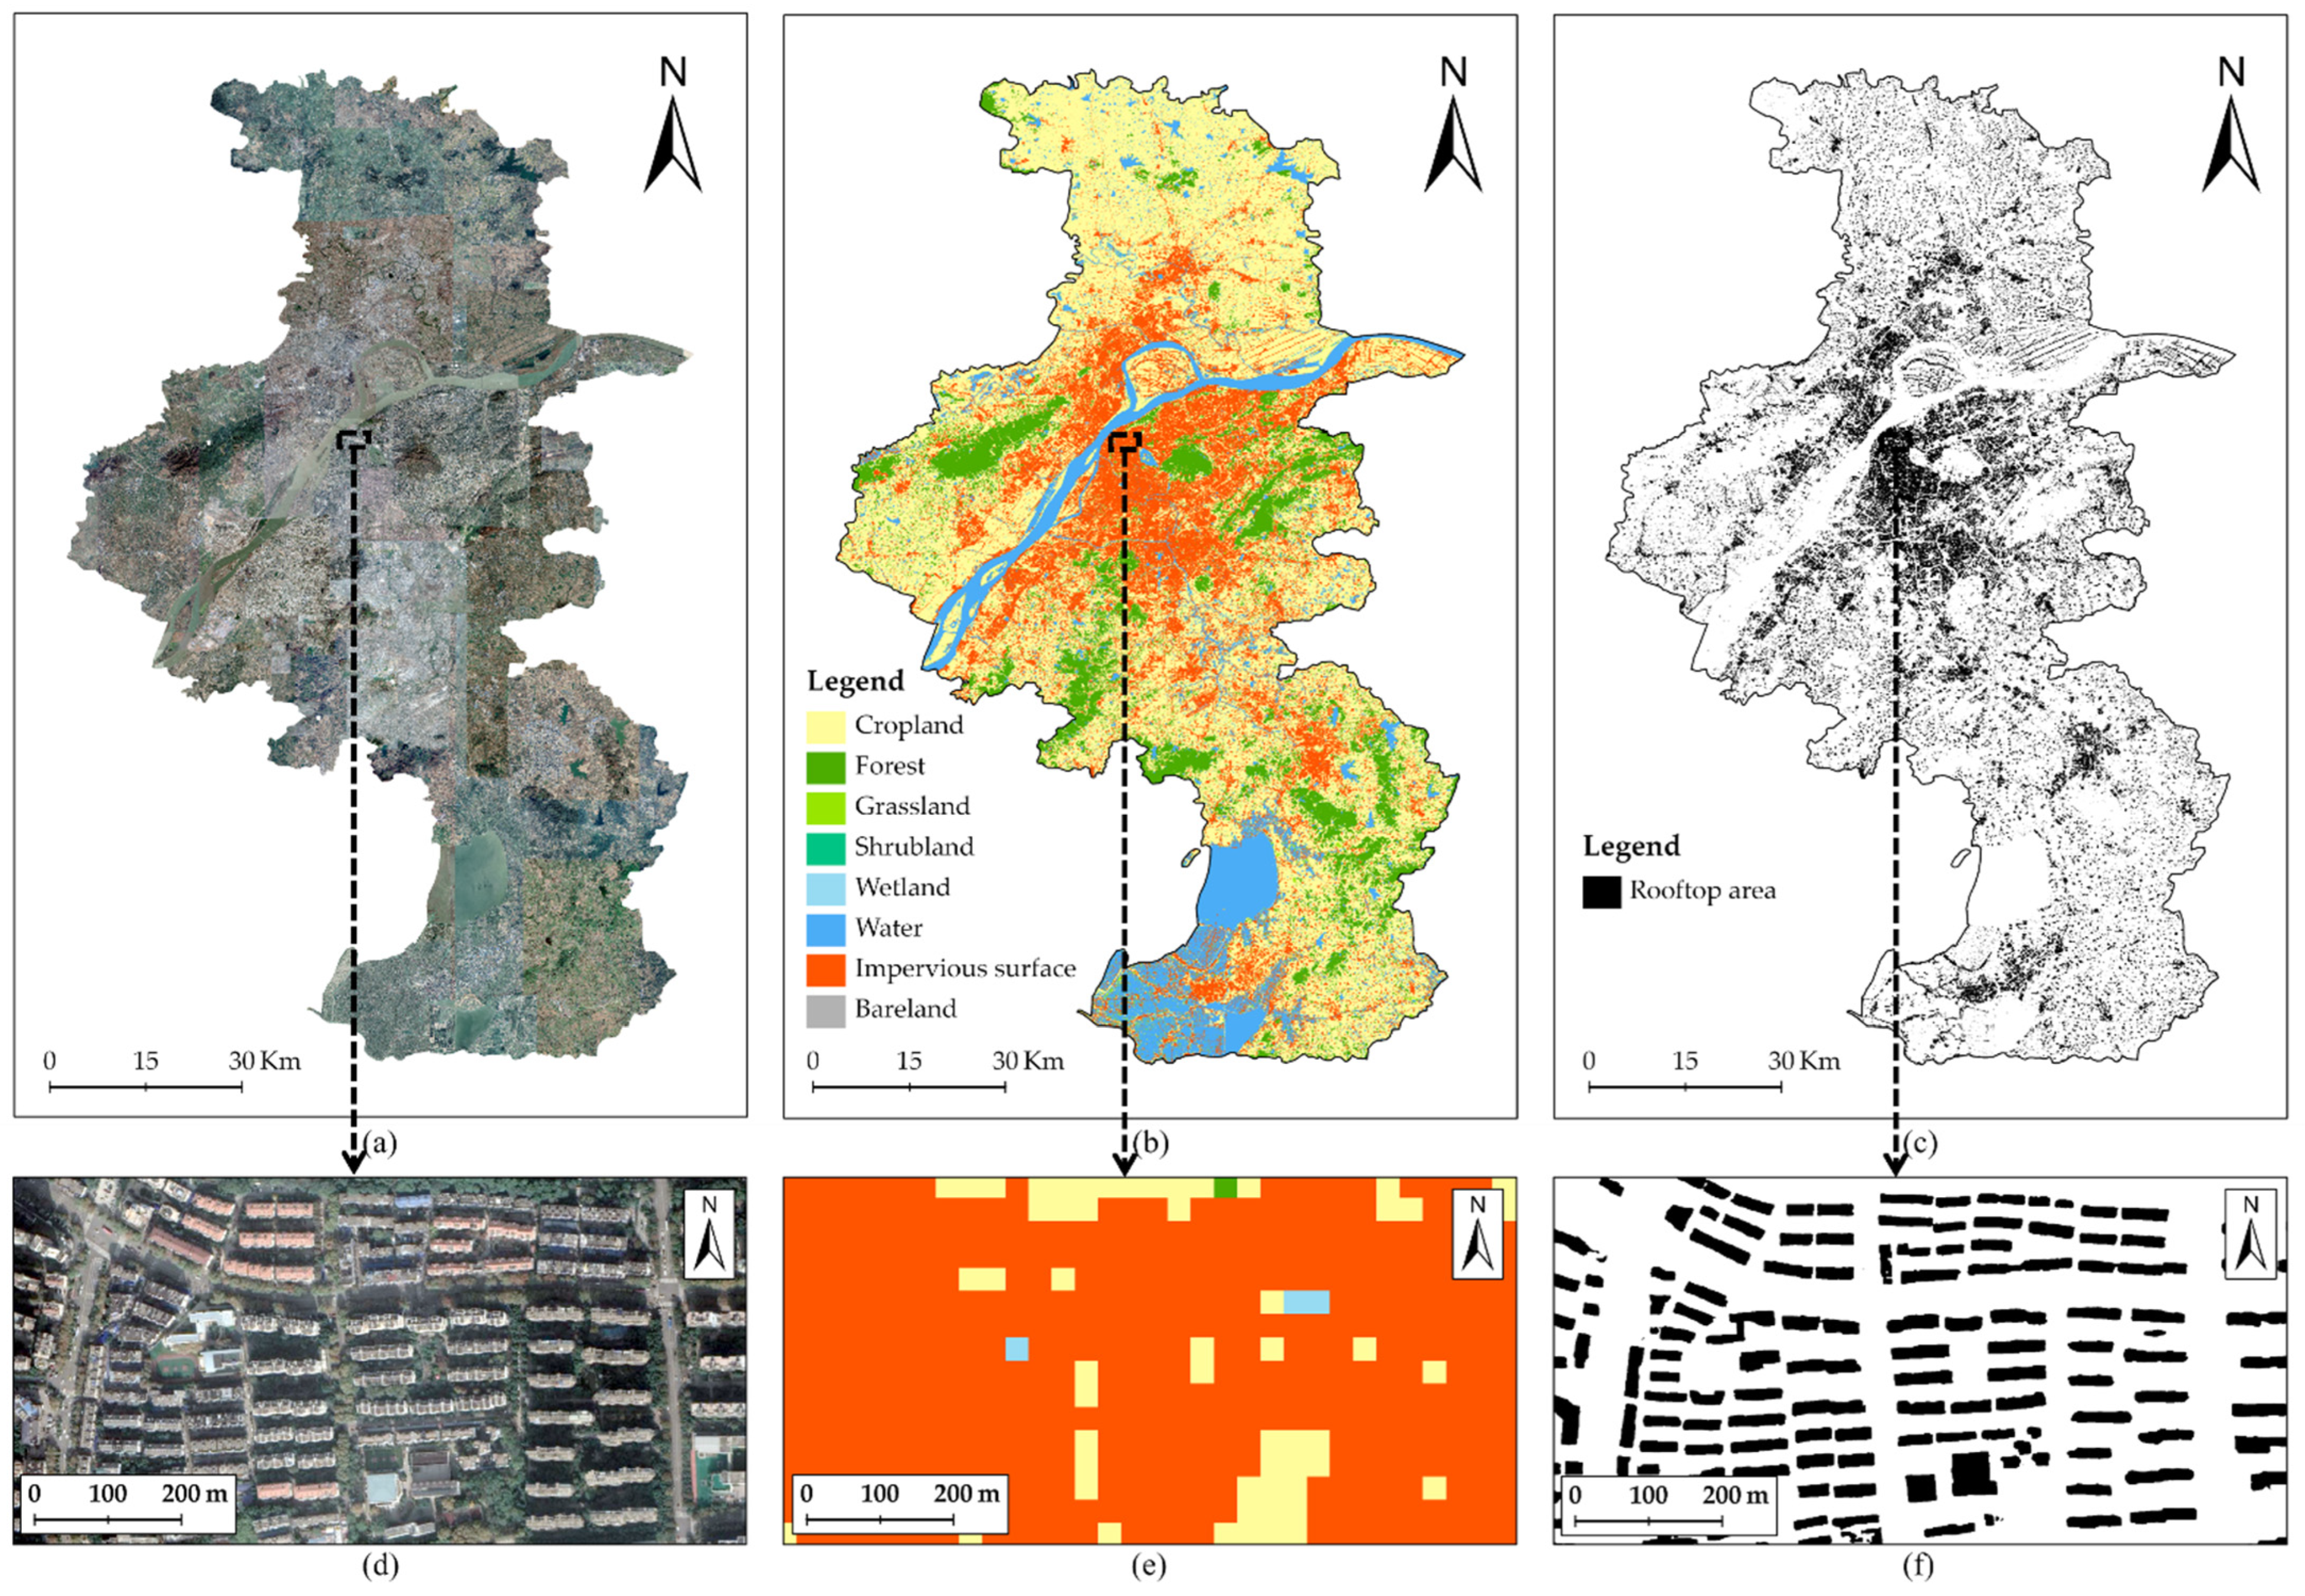
GES imagery offers new opportunities for access to urban information due to its wide coverage, speed of update and low cost of acquisition. In this study, GES imagery of approximately 0.6 m/pixel as the data source (Figure 2a) is used. Based on the open map service API (https://www.google.com/earth, accessed on 15 March 2022) provided by Google, the image data can be downloaded according to the longitude and latitude ranges of Nanjing. Imagery at this resolution shows building rooftop details clearly and with a controllable amount of data.

2.2.2. Land Cover Data

Building rooftops have a high probability of being collected in built-up areas. This can serve as prior information to collect building rooftop samples. Therefore, land use data can be used to provide built-up area information to support stratified sampling. Currently, the Finer Resolution Observation and Monitoring of Global Land Cover (FROM-GLC30 2017) (http://data.ess.tsinghua.edu.cn/, accessed on 8 May 2022) (Figure 2b), with a spatial resolution of 30 metres and an overall accuracy of 72.43%, is an authoritative and public land cover data. This data includes ten categories of land cover, i.e., cropland, forest, grassland, shrubland, wetland, water, tundra, impervious surface, bareland, and tundra.

2.2.3. Vectorized Rooftop Area Data of Nanjing

Considering the trade-off between the manual labelling cost and the consistent quality of labels, vectorized rooftop area data in Nanjing (Figure 2c), which are a high-quality and public rooftop area dataset published by Zhang, Z et al. (2022), is adopted in this study as the ground truth data. The dataset is extracted with a deep learning segmentation model based on high resolution remote sensing imagery and provides clear and detailed rooftop area data with an overall F1-score of 83.11%.

3. Methodology

3.1. Research Framework

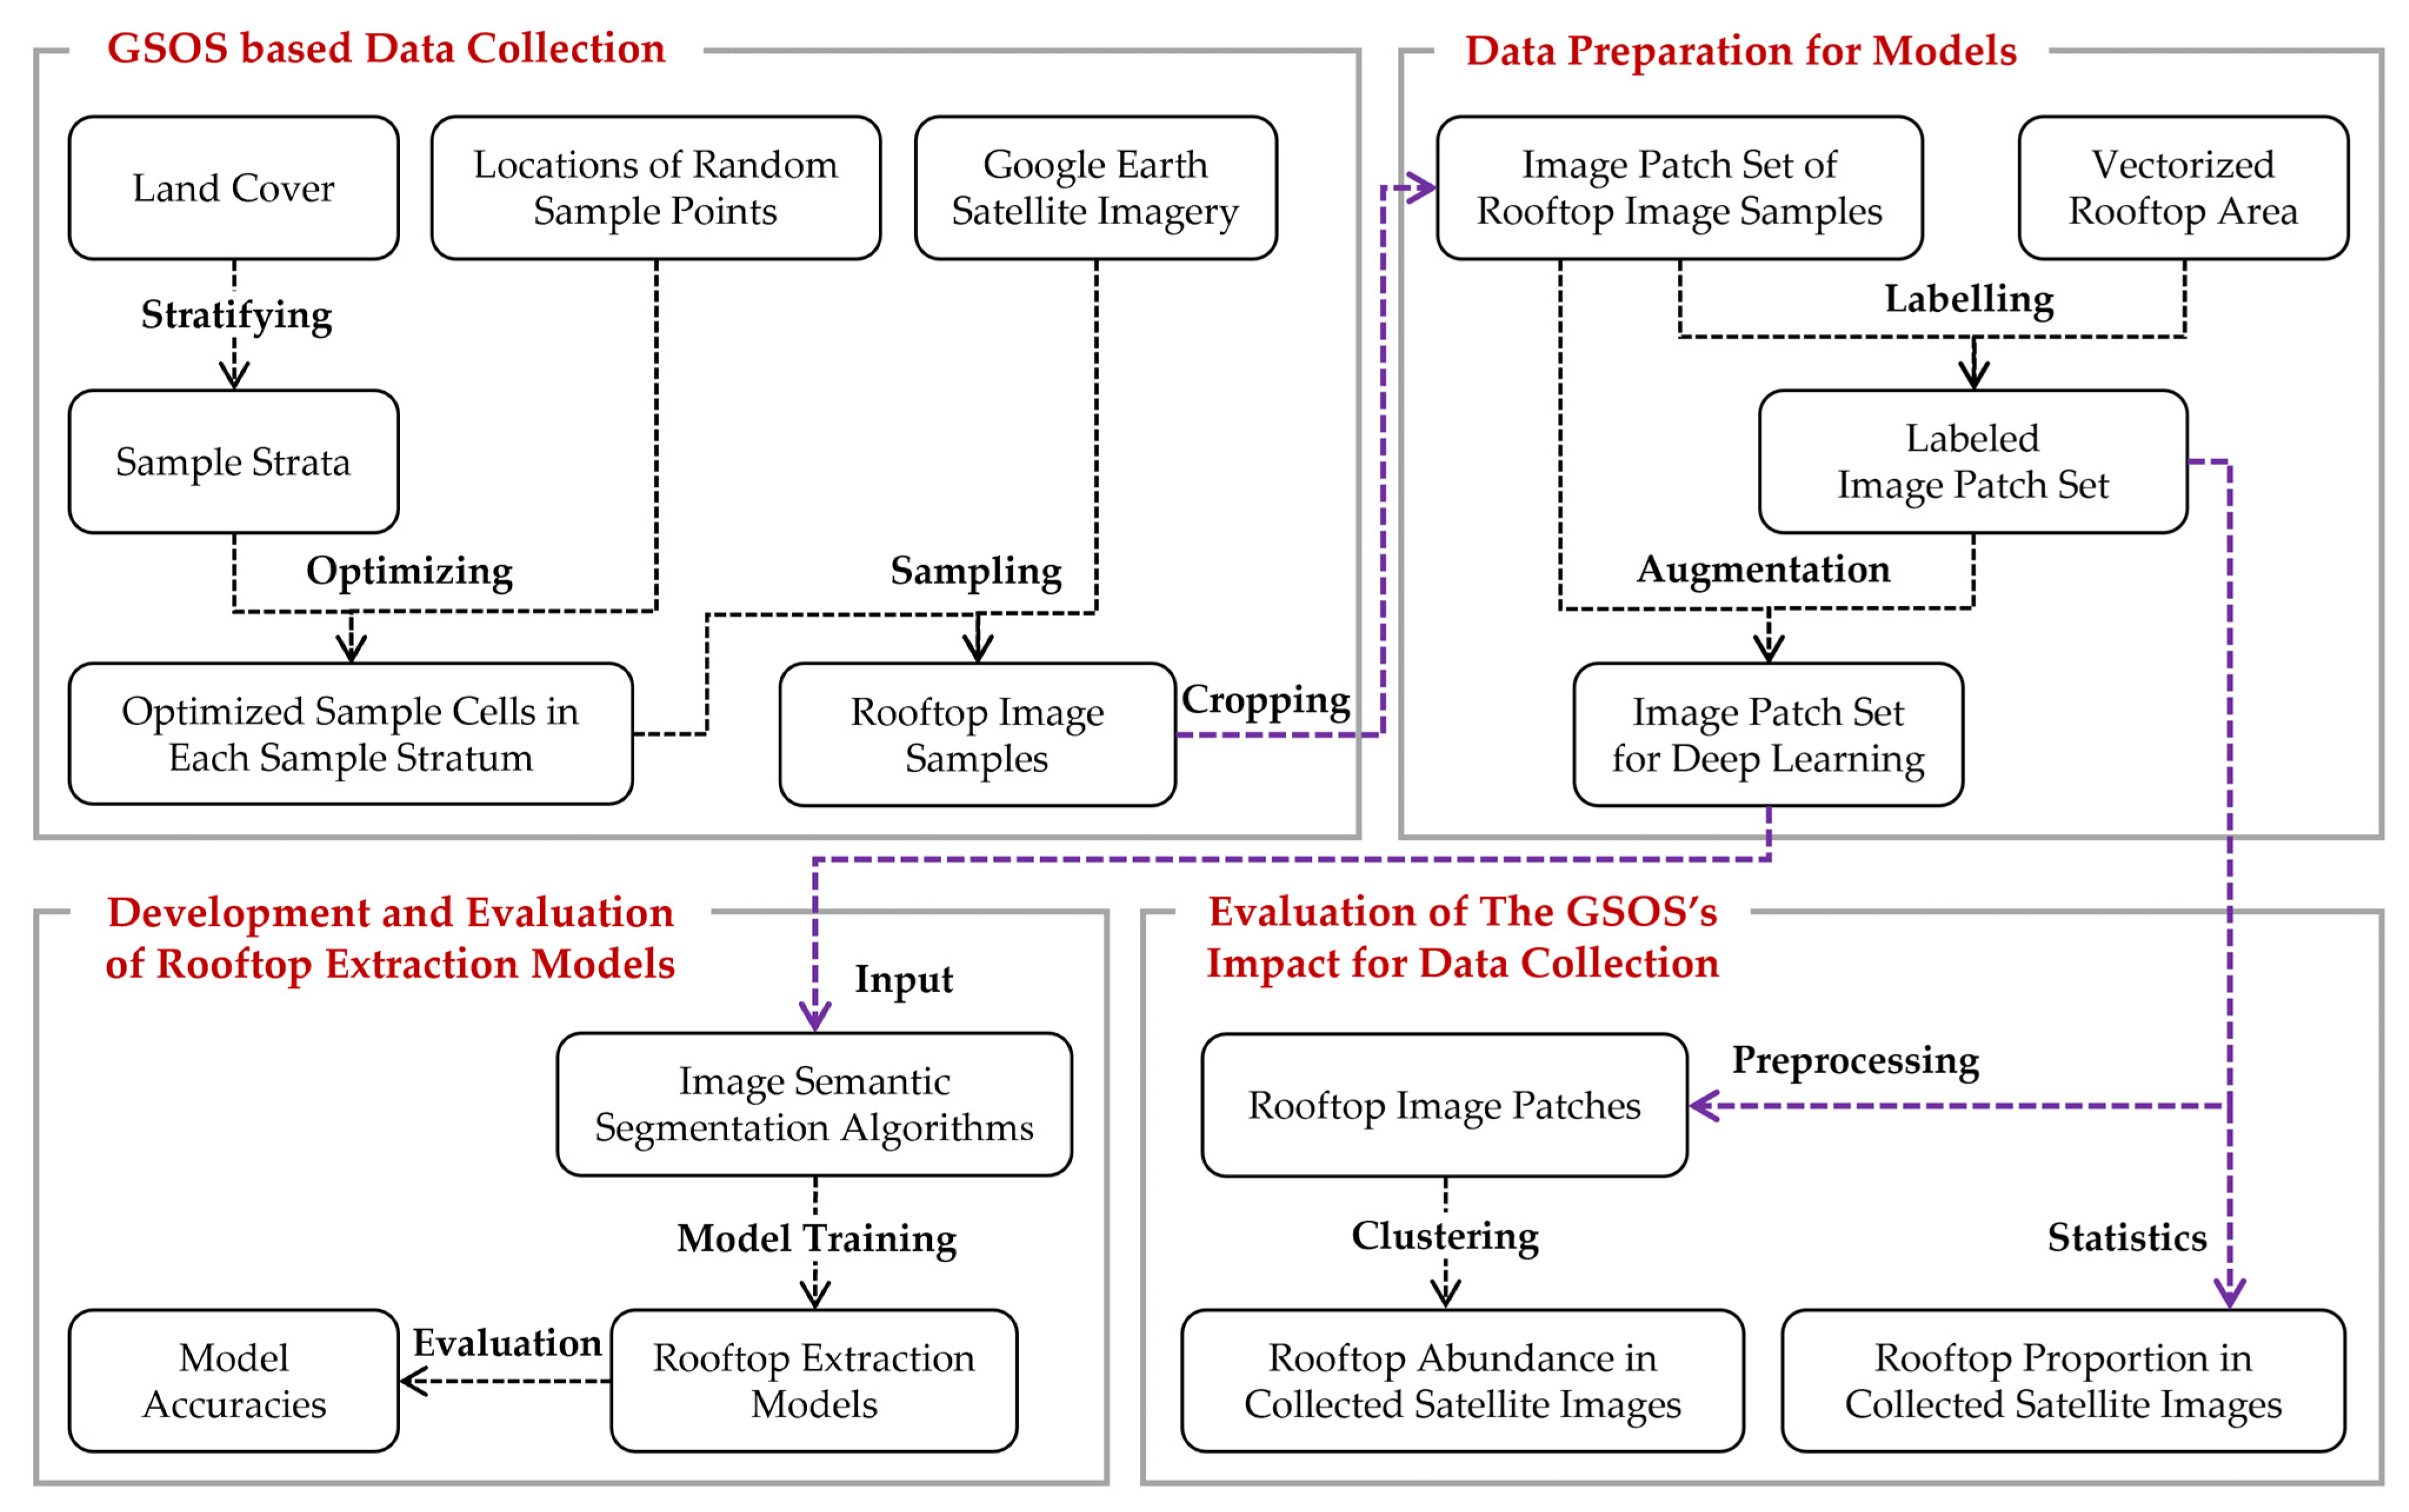
The research framework consists of the following three main modules: data preparation based on the GSOS, development of the rooftop extraction models, and evaluation of the impact of the GSOS on the rooftop extraction accuracy. The overall working framework is shown in Figure 3.
In GSOS-based data preparation, stratified sampling is first carried out by combining a priori information on the land cover to form sample collection strata with different rooftop densities. A single-objective optimization to maximize the average sample distance is utilized to expand the coverage of samples in each sample stratum with a view to increasing the proportion of rooftops and the amount of rooftop categories in the sample set. A series of city-wide sample sets of building rooftops are collected by the GSOS. The constructed sample sets are input into deep learning networks to obtain building rooftop extraction models. By evaluating the sample set and the model, the impact of the GSOS on building rooftop extraction is quantitatively verified.

3.2. Geospatial Stratified and Optimized Sampling

3.2.1. Stratification Considering the Geographical Context

The proportion of building rooftops in remote sensing imagery is much smaller than that of non-rooftop targets, and the use of simple random sampling is prone to sample category imbalance problems. This can lead to a heavily biased model. Stratified sampling allows for a balanced sample of all categories. This method divides the overall area into strata based on one criterion and randomly selects sample points within each stratum.
In this study, the study area based on land cover information is stratified, and the study area is divided into built-up and unbuilt-up areas based on FROM-GLC30, creating rooftop-dense areas and rooftop-sparse areas (see Figure 4a). Rooftop-dense areas are characterized by high levels of artificial construction activities and building densities; as a result, collecting samples rich in building rooftop information is easy. Rooftop-sparse areas include water, grassland, cropland, and bare ground; thus, collecting samples with a sparse spatial location distribution of rooftops is simple. Although it is less efficient to collect valid information in rooftop-sparse areas, as they are much larger than rooftop-dense areas, we still collected an equal number of samples in both areas to obtain as comprehensive information as possible on the different styles and densities of rooftops in the study area.
However, empirical studies have shown that it is difficult to collect rich information about rooftops in fragmented and broken built-up areas. Therefore, the division of rooftop-dense areas by built-up areas alone is lacking. Built-up areas that are large enough to provide dense rooftops, while those that are too small are not. We therefore considered patches of built-up areas that are more than half the area of one image sample to be a rooftop-dense areas, and the remains are rooftop-sparse areas (see Figure 4b).
To facilitate subsequent optimization of the sample space location, we generated a point matrix for sampling within the study area. The sample points that fall into the rooftop-dense area are expanded into rectangular sample cells, which constitute the rooftop-dense stratum. The sample points that fall into the rooftop-sparse area are expanded into rectangular sample cells, which constitute the rooftop-sparse stratum (see Figure 4c,d). In addition, the size of the sample cells depends on the spacing of the point matrix, with no overlap between sample cells.

3.2.2. Optimal Sampling Considering the Sample Coverage

According to the first and second laws of geography, the spatial distribution of buildings is characterized by the “closer the more similar” and spatial heterogeneity. Random sampling within layers tends to collect neighbouring and similar samples, resulting in problems such as redundancy of information. In the absence of sufficient priori knowledge to support further stratification, making the samples as evenly dispersed as possible within the sample strata can better improve the regional coverage and the performance of rooftop information collection.
Simulated Annealing (SA) is a probability-based method to find global optimal solutions, which is widely applied to objective optimization problems [37,38,39,40]. The SSA arithmetic is an extension of SA in space [41,42,43]. In the sample collection of this study, a certain amount of sample cells will be first collected randomly. Subsequently, SSA will be utilized to maximize the average distance between these sample cells and to extend their coverage. The inverse of the nearest neighbour index (NNI) is introduced as the cost function of SSA. It is calculated as follows:
NNI stratum = 1 n stratum i = 1 n stratum min ( d stratum i ) A stratum / n stratum
Cost stratum = 1 NNI stratum
where A stratum is the area of the sample stratum, n stratum is the amount of the sample cells in the stratum and min( d stratum i ) is the distance between the centroid of the ith sample cell and the nearest neighbour in the stratum except itself. The denominator of the Formula (1) describes the expected distance when the sample cells are randomly distributed in the stratum. The numerator of the Formula (1) describes the average distance between each sample cell and its nearest neighbour in the stratum. The smaller the Cost stratum value is, the more discrete the sample cells in the stratum tend to be.

3.3. Image Semantic Segmentation

Image semantic segmentation is a combination of image segmentations and image classifications by assigning the same labels to pixels in an image that belong to the same category. It plays a crucial role in remote sensing image feature information extraction. Compared to traditional non-deep learning image segmentation methods, deep learning-based methods can extract more abstract image features, thus better exploring the unique characteristics of different targets and having higher segmentation accuracies. As one kind of mainstream semantic segmentation network for deep learning, encoder-decoder networks gradually incorporate high-dimensional features into low-dimensional features, allowing the network to capture semantic information at different scales. This solves both the resolution degradation problem and the multi-scale problem. Semantic segmentation models, such as FCN, UNet, SegNet and DeepLab, which are classical encoder-decoder structures, have achieved good results in the field of remote sensing image semantic segmentation [44,45,46,47,48,49].
In this study, the FCN, UNet, SegNet, DeepLab and DeepLabV3+ models are selected to work together for rooftop recognition. Of these, we follow the study by Zhong, T. et al. [11] using DeepLabV3+ as the primary identification model to help fully evaluate the effectiveness of the GSOS. The other four models only serve as complementary models to evaluate the generalizability of the GSOS over different networks.

3.4. Evaluation Metrics

A confusion matrix is a situation analysis table that summarizes the true data and model predictions in supervised learning and records the comparison in a matrix that allows quantitative evaluations of the performance of supervised learning algorithms. The columns of the confusion matrix represent the true class, and the rows represent the predicted class. The confusion matrix of the binary classification model and its specific definitions are shown in Figure 5.
The confusion matrix describes the number of pixels intuitively. This metric becomes incomparable across different datasets. It is necessary to normalize the results. Most studies calculate the precision and recall based on a confusion matrix, but the two are mutually constraining (as the precision increases, the recall decreases and vice versa.). Therefore, a combined calculation of the two is required to achieve a comprehensive evaluation.
The F1-score is the harmonic mean of the precision and recall. Its evaluation result is closer to the average of the precision and recall. In addition, Intersection over Union (IoU) is also a common metric in object detections. It can be re-expressed in terms of the precision and recall, and the result is closer to the worst case of the precision and recall. Moreover, the precision, recall, F1-score, and IoU are calculated as follows:
Precision = TP TP + FP
Recall = TP TP + FN
F 1 - score = 2   ×   Precision   ×   Recall Precision + Recall
IoU = TP + TN TP + FP + TN + FN = Precision   ×   Recall Precision + Recall     Precision   ×   Recall

4. Results

4.1. Experiment Configuration

In the GSOS of rooftop satellite imagery in Nanjing, the spacing of the point matrix covering the rooftop-dense area and the rooftop-sparse area is 500 metres. The size of the sample cell based on point expansion is 500 × 500 metres (838 × 838 pixels). There is no overlapping between the sample cells. The image samples are cropped based on the optimized sample cells. A sliding window of 384 × 384 pixels is used to crop the image samples non-overlappingly to generate the image patch set that can be fed into a semantic segmentation model. And 70% of the image patch set is used for training the model and 30% for validation, as shown in Figure 6.
In this paper, the sampling is repeated eight times, with each set of samples being independent. Image samples never captured in the 8 times sampling will be collected as the independent test set to evaluate the accuracies of the rooftop extraction models. Furthermore, data augmentation is performed in the training phase to reduce model bias in this study in the form of rotation, flipping, blurring and noise. The detailed configuration of the training phase of the deep learning models is shown in Table 1.
In this study, quantitative experiments are designed to compare the proposed GSOS strategy with other sampling strategies, i.e., random spatial sampling (RSS), stratified random spatial sampling (SRSS) and distance optimized sampling (DOS). Subsequently, the sample rooftop proportion, abundance and impact on the rooftop extraction accuracies of these sampling strategies are reported.

4.2. Rooftop Coverage Evaluation

4.2.1. Comparison of Rooftop Proportion

In this study, the rooftop proportions with the percentage of the rooftop areas to the total area in the sample set are measured. Moreover, this study will be conducted on 8 incremental sample sizes. The statistical comparison results of the rooftop proportion for different sampling strategies are presented in Table 2.
The sampling strategies that take land cover information into account (GSOS and SRSS) are the most effective, with the highest proportion at approximately 7.1%. In contrast, the RSS and DOS obtain a lower percentage of rooftops, only approximately half of the former. This suggests that the incorporation of land cover can help to obtain denser rooftop objects. Thereby, a reduced sample size and reduced labelling effort can be achieved while obtaining enough rooftop information to support the model training.
However, there is a slight loss of rooftop area from the sample location optimized sampling carried out to account for rooftop abundance and to collect information of different densities, but only approximately 0.7%. The benefits of rooftop abundance are presented in the next subsection. In addition, the GSOS has a significantly lower standard deviation. This indicates that it is more stable over multiple samplings and less affected by randomness. This helps the GSOS to be further applied to other studies.

4.2.2. Comparison of Rooftop Abundance

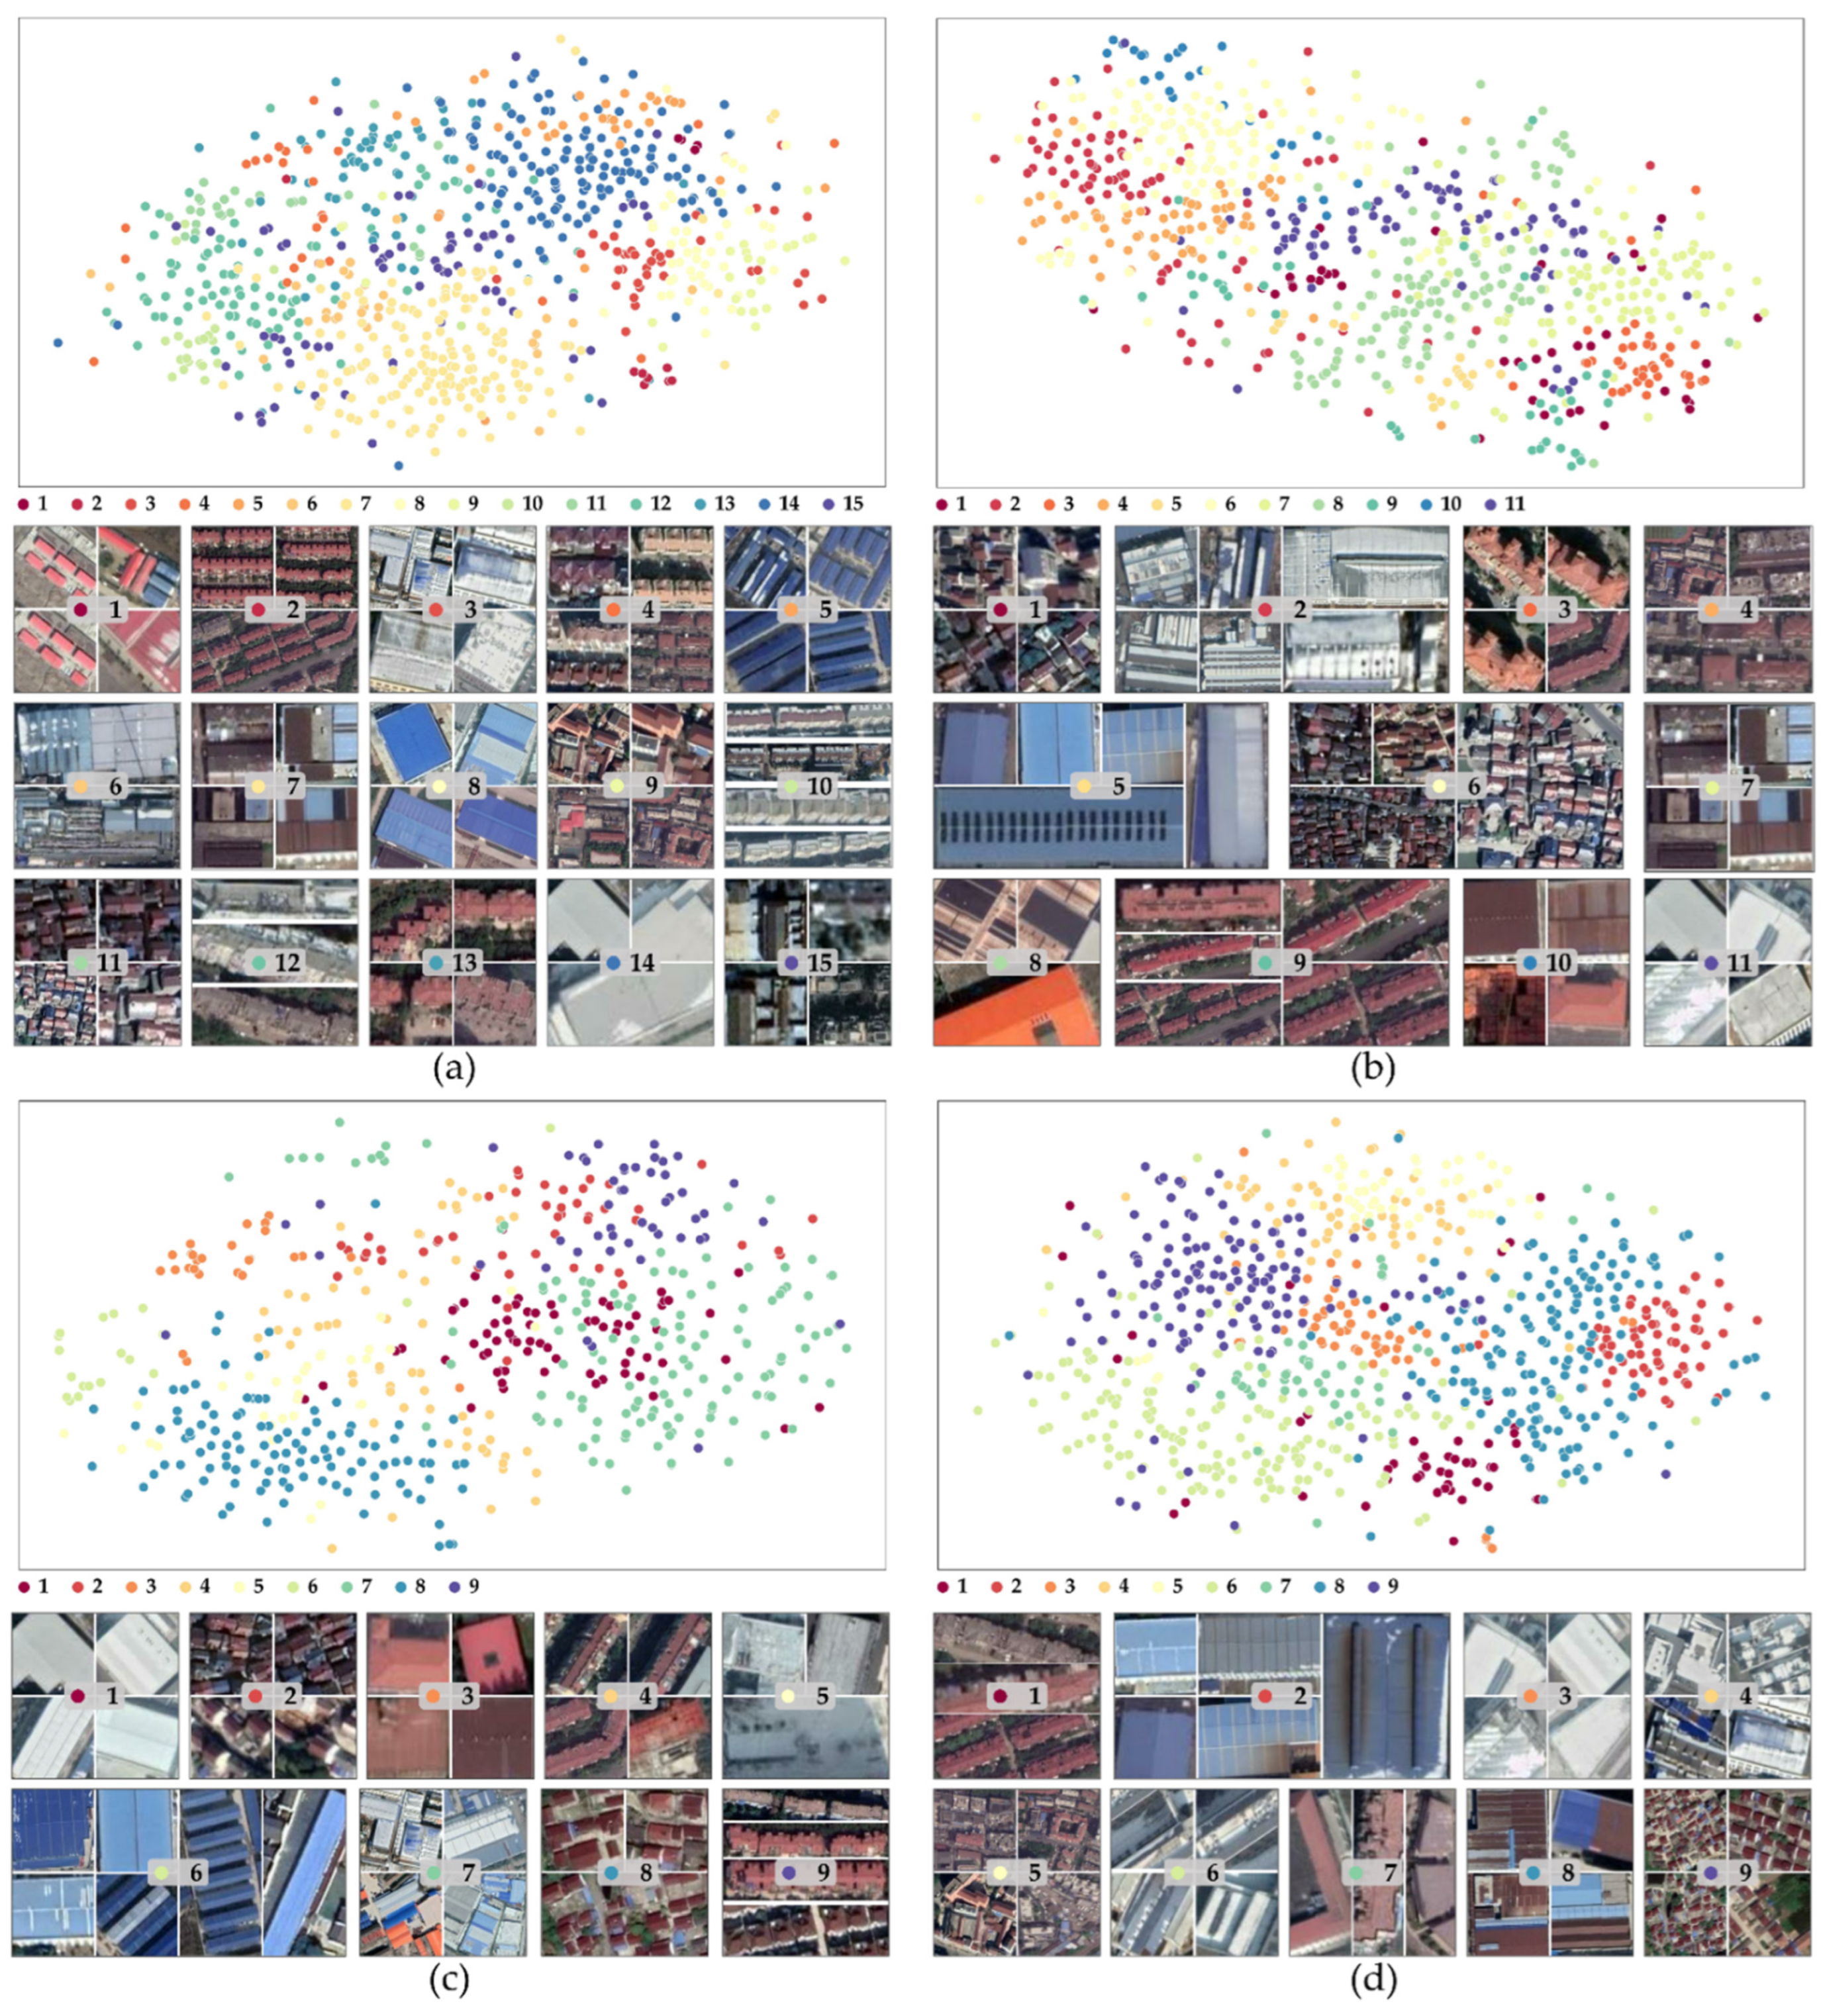
To evaluate the ability of different sampling strategies to obtain multiple classes of rooftops, the collected rooftop image patches are classified. The image patches that are larger than 50 × 50 pixels are adopted to generate feature vectors by ResNet18 and then clustered into 2D space by KMeans and TSNE, where K is set to a value much larger than the number of any possible rooftop classes in the study area. Based on the results of the automated clustering, combined with manual visual interpretation, similar classes are iteratively merged, and the number of collected rooftop classes are obtained, as shown in Figure 7.
The clustering results show that the GSOS obtained 15 classes of rooftops, which are six and four more than that of DOS and SRSS, as shown in Figure 7a–c. Abundant classes of samples provide a more detailed portrayal of the rooftop features in the study area. This can bring more typical samples to the rooftop segmentation model.

4.3. Rooftop Extraction Model Evaluation

To further illustrate the effectiveness of the GSOS, the quantitative results in terms of the rooftop extraction accuracy and generalizability over different models are reported in this study.

4.3.1. Comparison of the Rooftop Extraction Accuracy

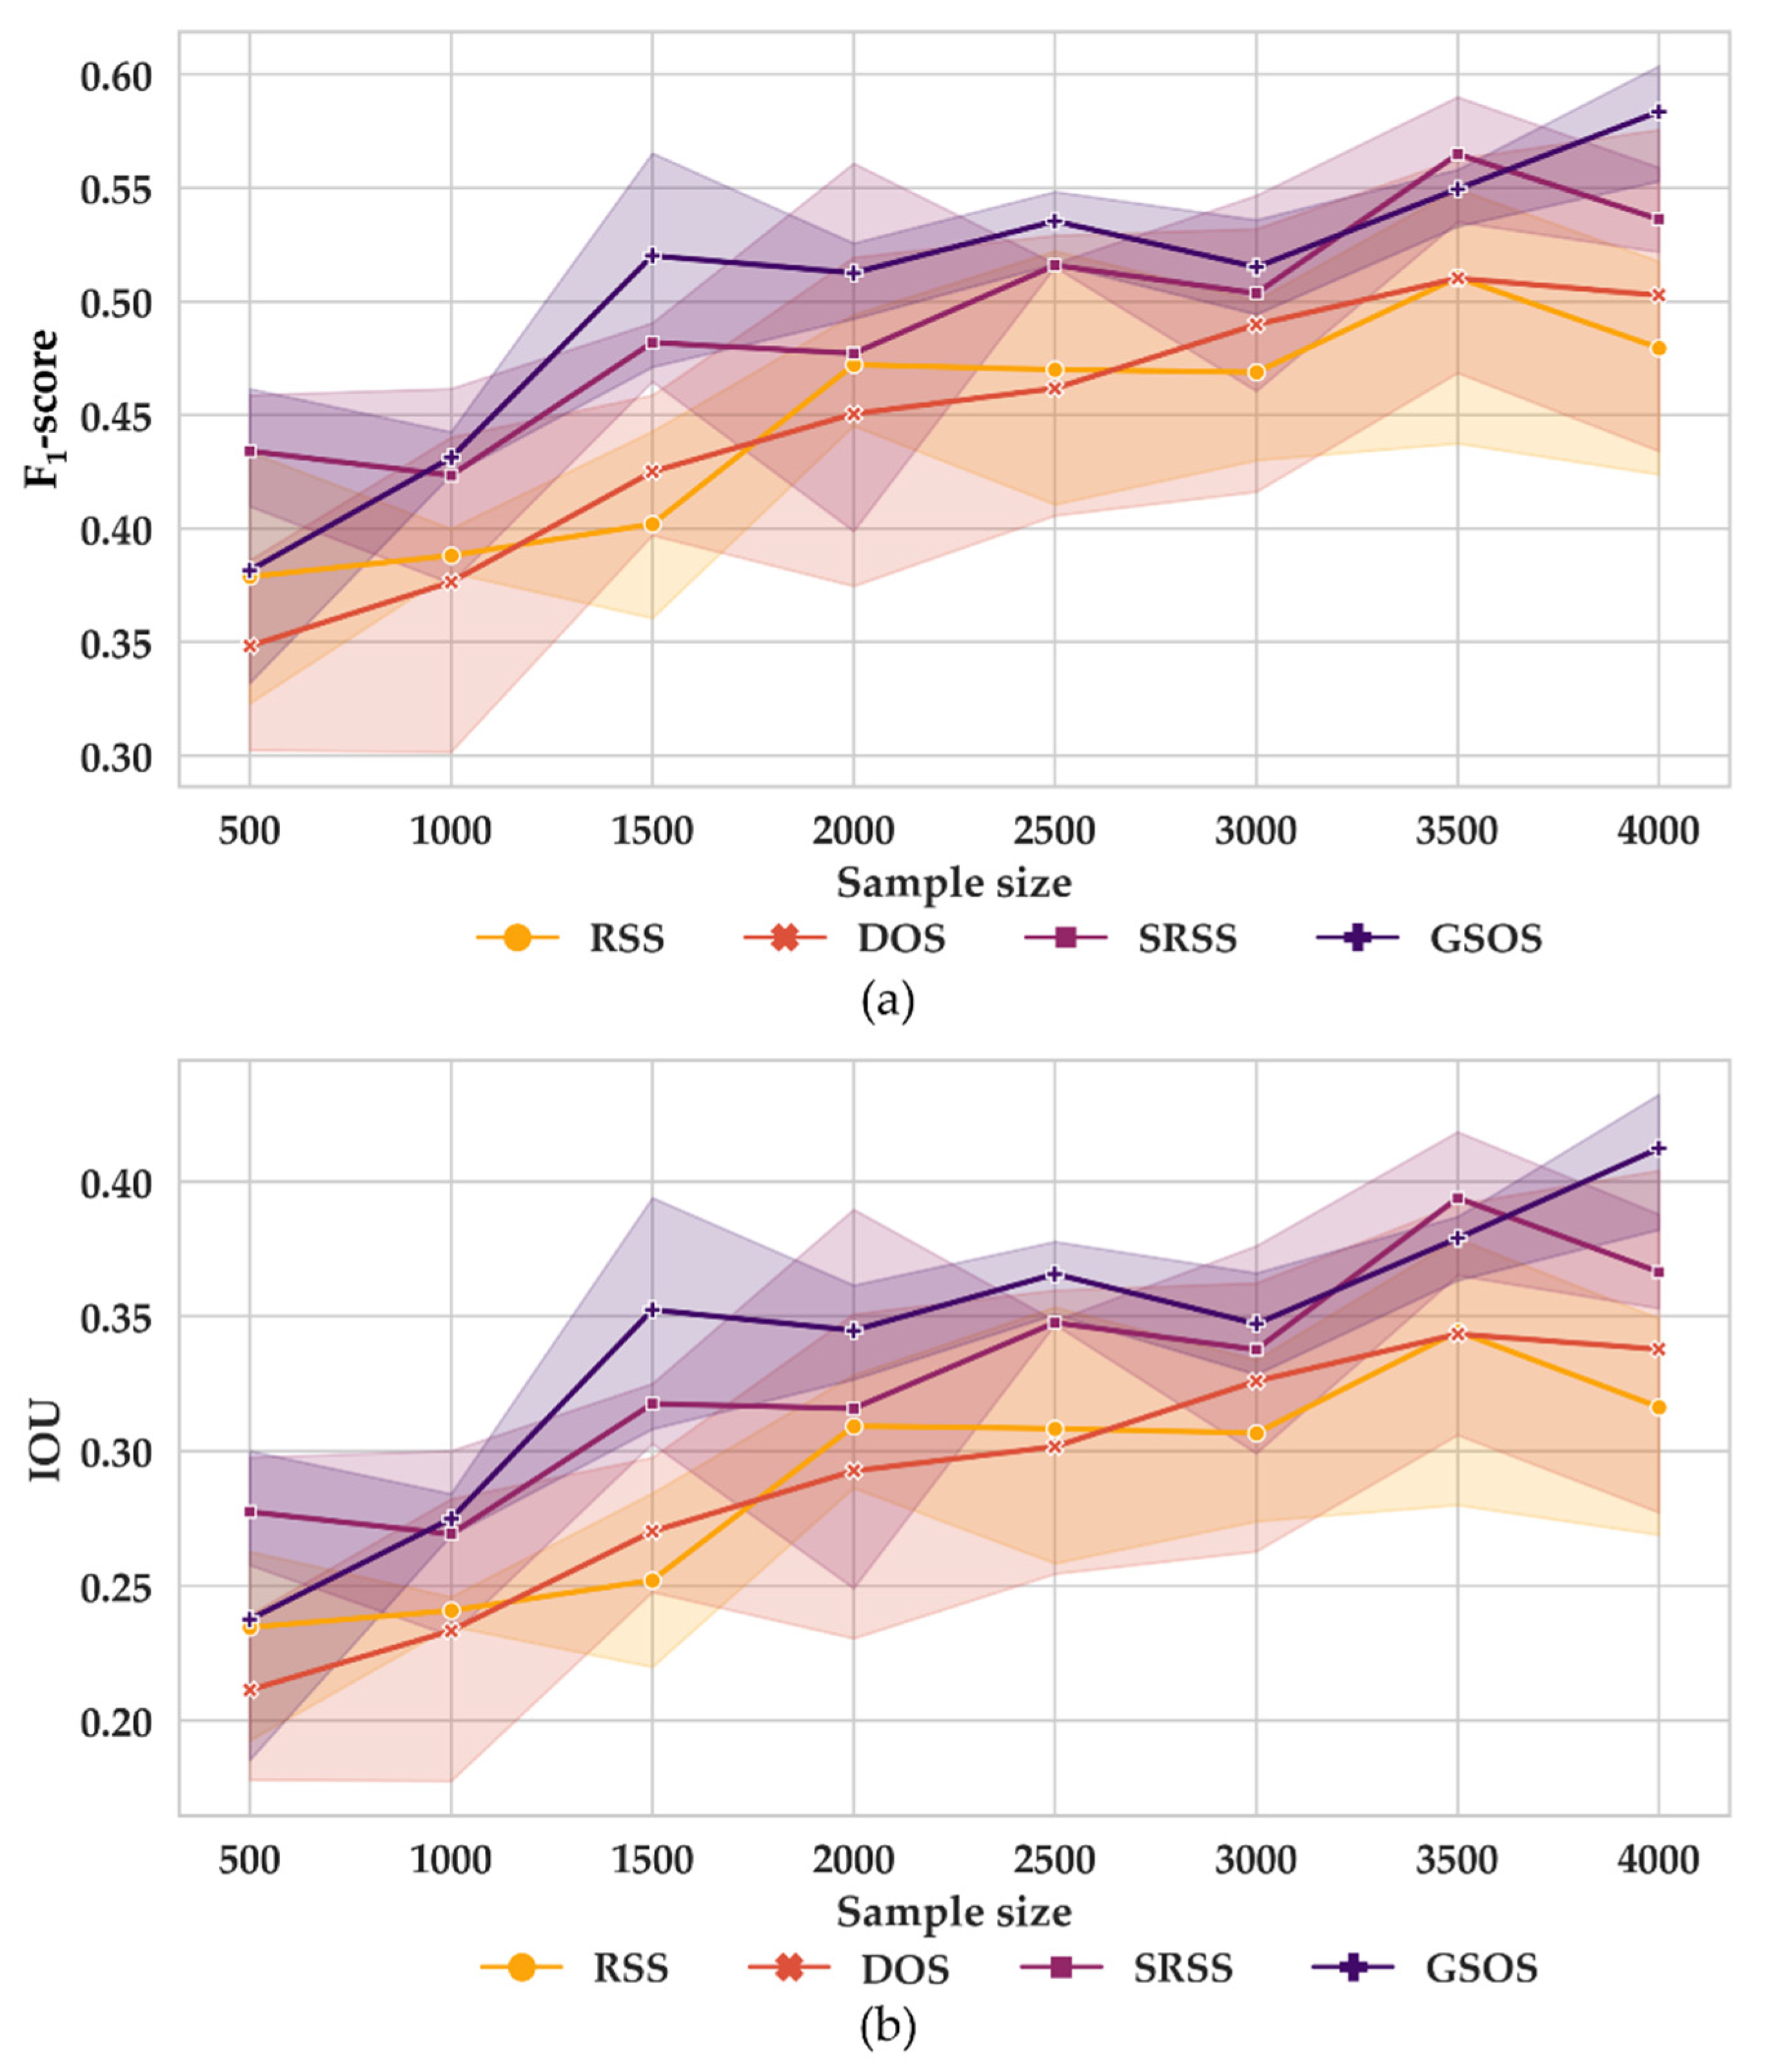
The evaluation of the impact of the sampling strategy on the model accuracy is carried out based on DeepLabV3+. Given the nature of the data sampling, randomness and uncertainty in the samples cannot be avoided. To reduce this effect, multiple SnapShots of local optima are captured in each training session according to the loss function. Rooftop identification and evaluation are performed based on these SnapShots, and their confidence intervals are obtained, as shown in Figure 8.
The results showed that as the sample size increased, the F1-score and IoU of the model corresponding to each sampling strategy showed a significant increasing trend. This increasing trend slows down after the sample size is larger than 2000. On the other hand, the GSOS generally outperformed the other sampling strategies regarding the model accuracy. When compared to the DSS and SRSS under the same sample size, F1-scores increased by an average of 13.40% and 3.01%, respectively, and IoU increased by an average of 17.62% and 4.18%, respectively. In particular, the GSOS and SRSS are significantly superior to the other two strategies, suggesting that geographic priori information of land cover plays a significant role in relation to improving the sample preparation and increasing rooftop recognition accuracies.
In terms of the model confidence intervals, the GSOS also performs well. As the sample size increases, the confidence intervals of the GSOS gradually converge, the fluctuations stabilize, and the models become more reliable. This indicates that the method effectively reduces the effects of randomness.
In addition, it was found that with the GSOS, only a smaller sample size is required to achieve the rooftop extraction effect of the non-optimized case with a larger sample size, especially for sampling strategies that are not guided by land cover information. This helps to save significant overheads in producing building rooftop area datasets with deep learning, as high-quality labelled samples are generally expensive.

4.3.2. Comparison of Generalizability

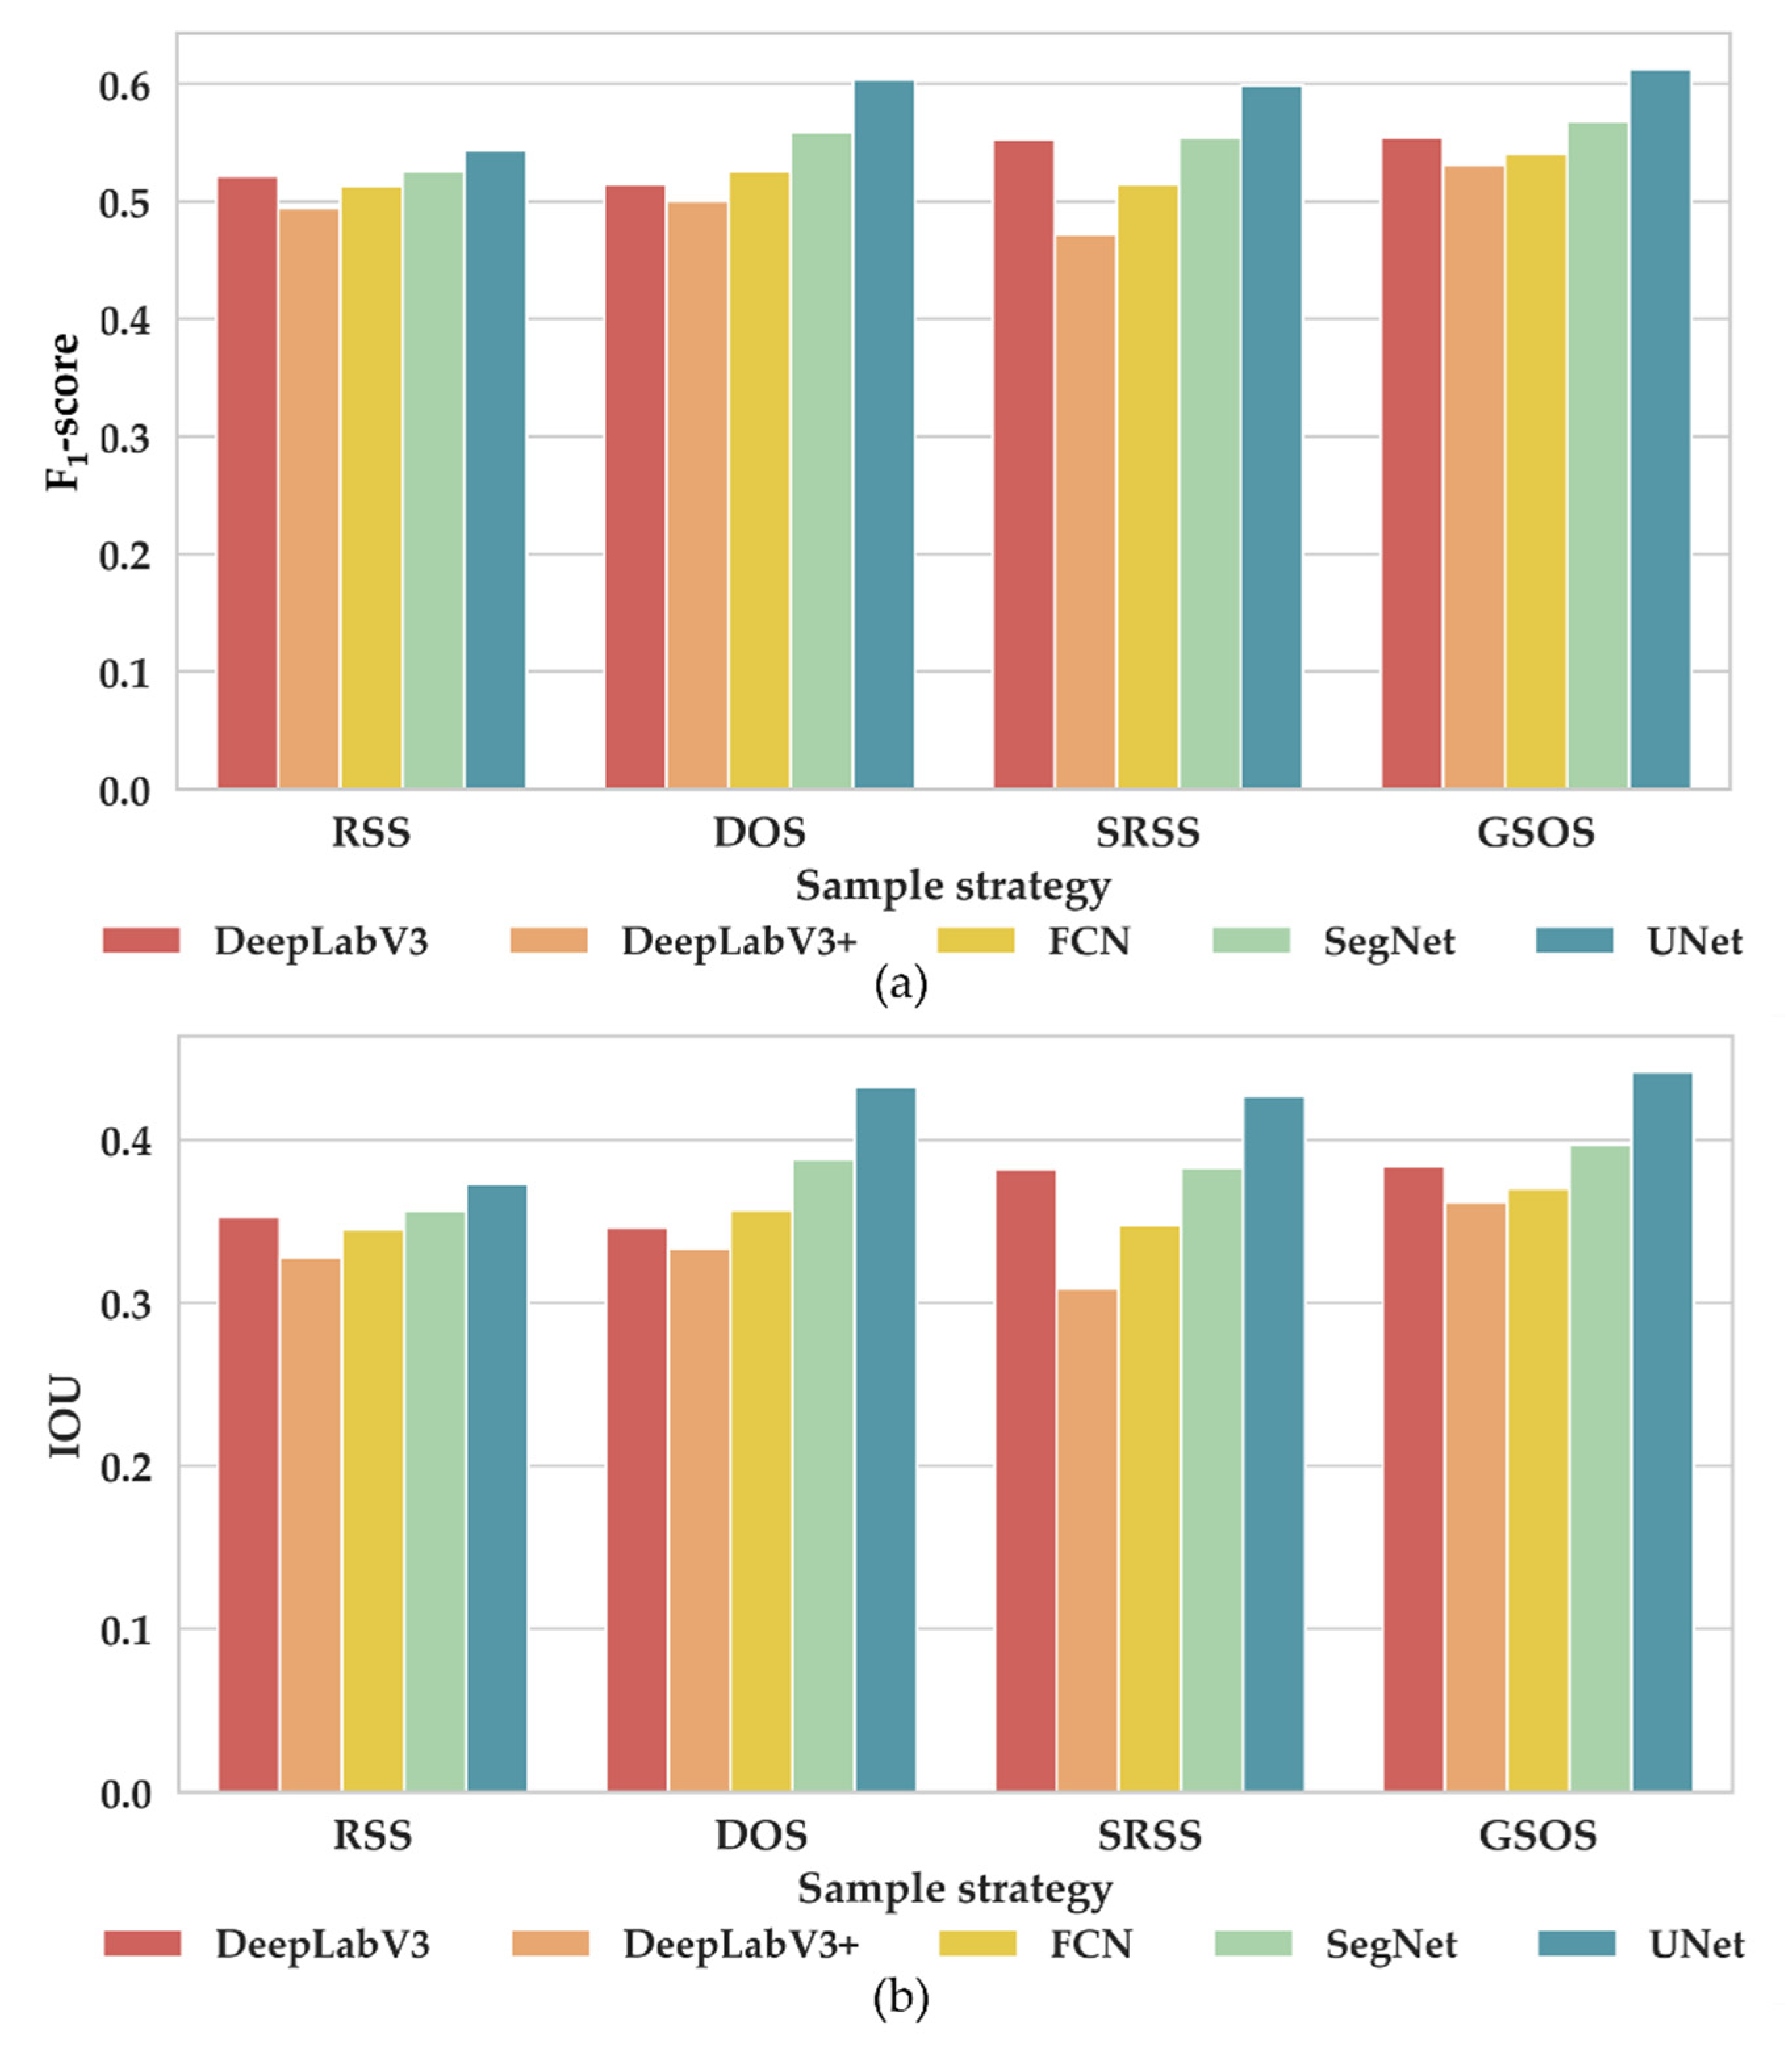
The evaluation of the sampling strategies for generalizability under different deep learning networks is carried out based on the FCN, UNet, SegNet, DeepLab and DeepLabV3+ at a sample size of 2000. As shown in Figure 9, the GSOS is superior in terms of generalizability. The stable and high accuracy performance of the GSOS with multiple networks indicates that the rooftop sample set captured by the GSOS is representative of the regional characteristics. Networks of different structures can extract typical features of rooftops in the study area. This helps to support, in the future, further exploration in modelling when producing building rooftop area datasets with deep learning.
It is worth mentioning that in previous studies, the SRSS obtained model accuracies closer to that of the GSOS. However, in generalizability comparisons, the SRSS model accuracies are extremely unstable across different networks. The model accuracy is even lower than that of the RSS when trained with DeepLabV3+. This makes it difficult for the SRSS to support more extensive and deeper studies at the model level in the future.

5. Discussion

5.1. Uncertainty Analysis

Considering the cost of manual labelling and the difference in the quality of manual labelling, a publicly published dataset of rooftops based on ground truth data extracted from high-resolution remote sensing images and deep learning methods is adopted in this study. However, with an F1-score of 83.11% for this dataset, there are bound to be areas that do not match the ground truth. The uncertainty caused by this error can be mitigated by increasing the sample size, which can collect as much rooftop information with small errors as possible.
Data sampling is accompanied by randomness and uncertainty. When the sample size is small, the abundance of rooftop information inevitably decreases, and even after optimization, it is difficult to cover the full region. The impact of randomness on the rooftop extraction becomes more significant. On the other hand, the model also introduces parameters with randomness during the training process, increasing the uncertainty of the results. In this study, multiple iterations are used to reduce the effect of randomness, but the fluctuations caused by it are still inevitable.

5.2. Potential Improvements of GSOS

The proposed GSOS is constructed for the rooftop area extraction task in Nanjing, considering the built-up area, urbanization rate, and data accessibility. In cities or regions with widely varying physical and human characteristics, i.e., regions with different modalities, the main factors influencing the spatial distribution characteristics of rooftops differ. When the GSOS is extended to these regions, or even to regions at other spatial-temporal scales, the geographical priori information and optimization objectives to be considered change.
In the future, the spatial autocorrelation and spatial heterogeneity of the building rooftops can be considered in more detail in conjunction with digital surface models, urban functional areas, street views, POIs, living footprints and regional economies [50,51,52]. Thus, more possible sample stratification can be explored from different perspectives, such as the building function and style. In addition, multiple source data and feature mining methods can be combined to explore more possible methods of target optimization. Further attempts to adapt the sampling methods applicable to the different modalities of urban clusters can be performed. On the other hand, the integration of multi-source remote sensing imagery may help to further improve and evaluate the generalisability of GSOS.
When extended to other research objectives, the GSOS can serve as a reference for other studies by exploring more appropriate geographic priori information and target optimization methods. For example:
  • In a study to explore local-scale patterns of urban air pollution, researchers divide cities by landscape and administrative and functional zones to explore urban air NO2 pollution patterns and their causal factors [53].
  • On the other hand, varying the spatial simulated annealing optimization objective for different research objectives can also provide a reference for the researchers.
  • In a study on lake water quality monitoring, researchers have adopted the mean spatial-temporal error (MSTE) as the optimization objective, with a view to reducing the errors arising from spatial-temporal interpolations [42].

6. Conclusions

Rooftop area information is an important data basis for urban planning and urban—rural integration. Using satellite imagery and deep learning to extract rooftop information is a mainstream solution. However, the current studies focus mostly on algorithm development and overlook the importance of data collection. To address this challenge, an advanced sampling strategy, the GSOS, is proposed in this study to generate a high-quality dataset for training rooftop extraction models. From qualitative and quantitative evaluations, the results show that the generated samples are representative in terms of the rooftop coverage and types in the image samples. In addition, the prediction results of the rooftop extraction models demonstrate that the GSOS-based models are capable of achieving high identification accuracies with small sample sizes. In the future, the advanced sampling strategy may be able to incorporate more fundamental geographical and socio-statistical information to provide a customized solution for data collection with different modalities.

Author Contributions

Conceptualization, Z.S., Z.Z., M.C. (Min Chen), Z.Q., M.C. (Min Cao) and Y.W.; methodology, Z.S., Z.Z. and Z.Q.; software, Z.S., Z.Z. and Z.Q.; validation, Z.S.; formal analysis, Z.S. and Z.Q.; investigation, Z.Z.; resources, Z.S. and Z.Z.; data curation, Z.S.; writing—original draft preparation, Z.S.; writing—review and editing, Z.S., Z.Z., M.C. (Min Chen), Z.Q., M.C. (Min Cao) and Y.W.; visualization, Z.S.; supervision, Y.W.; project administration, Y.W.; funding acquisition, Y.W. All authors have read and agreed to the published version of the manuscript.

Funding

M.C. (Min Chen) and Y.W. were supported by the National Natural Science Foundation of China (Grant No. 41930648). Z.S. was supported by the Postgraduate Research & Practice Innovation Program of Jiangsu Province (Grant KYCX22_1587). M.C. (Min Cao) was supported by the Open Fund of Key Laboratory of Urban Land Resources Monitoring and Simulation, Ministry of Natural Resources (KF-2020-05-025).

Data Availability Statement

The GES imagery for Nanjing is available from the following website: https://www.google.com/earth (accessed on 15 March 2022). The land cover data for Nanjing can be found at http://data.ess.tsinghua.edu.cn/ (accessed on 8 May 2022). The vectorized rooftop area data for Nanjing can be found at https://data.tpdc.ac.cn/en/data/60dac98d-eec4-41df-9ad5-b1563e5c532c/ (accessed on 7 May 2022).

Acknowledgments

We would like to thank the editors and the anonymous reviewers for their meticulous comments and suggestions, which greatly helped us to improve the manuscript quality.

Conflicts of Interest

The authors declare no conflict of interest.

References

  1. Crompvoets, J.; Bregt, A.; Rajabifard, A.; Williamson, I. Assessing the worldwide developments of national spatial data clearinghouses. Int. J. Geogr. Inf. Sci. 2004, 18, 665–689. [Google Scholar] [CrossRef]
  2. Rajabifard, A.; Binns, A.; Masser, I.; Williamson, I. The role of sub-national government and the private sector in future spatial data infrastructures. Int. J. Geogr. Inf. Sci. 2006, 20, 727–741. [Google Scholar] [CrossRef] [Green Version]
  3. Qian, Z.; Chen, M.; Yang, Y.; Zhong, T.; Zhang, F.; Zhu, R.; Zhang, K.; Zhang, Z.; Sun, Z.; Ma, P. Vectorized dataset of roadside noise barriers in China using street view imagery. Earth Syst. Sci. Data Discuss. 2022, 14, 4057–4076. [Google Scholar] [CrossRef]
  4. Gassar, A.A.A.; Cha, S.H. Review of geographic information systems-based rooftop solar photovoltaic potential estimation approaches at urban scales. Appl. Energy 2021, 291, 116817. [Google Scholar] [CrossRef]
  5. Gernaat, D.E.; de Boer, H.-S.; Dammeier, L.C.; van Vuuren, D.P. The role of residential rooftop photovoltaic in long-term energy and climate scenarios. Appl. Energy 2020, 279, 115705. [Google Scholar] [CrossRef]
  6. Zhang, Z.; Qian, Z.; Zhong, T.; Chen, M.; Zhang, K.; Yang, Y.; Zhu, R.; Zhang, F.; Zhang, H.; Zhou, F. Vectorized rooftop area data for 90 cities in China. Sci. Data 2022, 9, 66. [Google Scholar] [CrossRef]
  7. Aslani, M.; Seipel, S. Automatic identification of utilizable rooftop areas in digital surface models for photovoltaics potential assessment. Appl. Energy 2022, 306, 118033. [Google Scholar] [CrossRef]
  8. Ren, H.; Xu, C.; Ma, Z.; Sun, Y. A novel 3D-geographic information system and deep learning integrated approach for high-accuracy building rooftop solar energy potential characterization of high-density cities. Appl. Energy 2022, 306, 117985. [Google Scholar] [CrossRef]
  9. Sun, T.; Shan, M.; Rong, X.; Yang, X. Estimating the spatial distribution of solar photovoltaic power generation potential on different types of rural rooftops using a deep learning network applied to satellite images. Appl. Energy 2022, 315, 119025. [Google Scholar] [CrossRef]
  10. Wierzbicki, D.; Matuk, O.; Bielecka, E. Polish cadastre modernization with remotely extracted buildings from high-resolution aerial orthoimagery and airborne LiDAR. Remote Sens. 2021, 13, 611. [Google Scholar] [CrossRef]
  11. Zhong, T.; Zhang, Z.; Chen, M.; Zhang, K.; Zhou, Z.; Zhu, R.; Wang, Y.; Lü, G.; Yan, J. A city-scale estimation of rooftop solar photovoltaic potential based on deep learning. Appl. Energy 2021, 298, 117132. [Google Scholar] [CrossRef]
  12. Cao, Z.; Fu, K.; Lu, X.; Diao, W.; Sun, H.; Yan, M.; Yu, H.; Sun, X. End-to-end DSM fusion networks for semantic segmentation in high-resolution aerial images. IEEE Geosci. Remote Sens. Lett. 2019, 16, 1766–1770. [Google Scholar] [CrossRef]
  13. Li, Q.; Zorzi, S.; Shi, Y.; Fraundorfer, F.; Zhu, X.X. RegGAN: An End-to-End Network for Building Footprint Generation with Boundary Regularization. Remote Sens. 2022, 14, 1835. [Google Scholar] [CrossRef]
  14. Sheikh, M.A.A.; Maity, T.; Kole, A. IRU-Net: An Efficient End-to-End Network for Automatic Building Extraction From Remote Sensing Images. IEEE Access 2022, 10, 37811–37828. [Google Scholar] [CrossRef]
  15. Wang, C.; Bai, X.; Wang, S.; Zhou, J.; Ren, P. Multiscale visual attention networks for object detection in VHR remote sensing images. IEEE Geosci. Remote Sens. Lett. 2018, 16, 310–314. [Google Scholar] [CrossRef]
  16. Guo, H.; Shi, Q.; Du, B.; Zhang, L.; Wang, D.; Ding, H. Scene-driven multitask parallel attention network for building extraction in high-resolution remote sensing images. IEEE Trans. Geosci. Remote Sens. 2020, 59, 4287–4306. [Google Scholar] [CrossRef]
  17. Qian, Z.; Chen, M.; Zhong, T.; Zhang, F.; Zhu, R.; Zhang, Z.; Zhang, K.; Sun, Z.; Lü, G. Deep Roof Refiner: A detail-oriented deep learning network for refined delineation of roof structure lines using satellite imagery. Int. J. Appl. Earth Obs. Geoinf. 2022, 107, 102680. [Google Scholar] [CrossRef]
  18. Sun, M.; Zhang, F.; Duarte, F.; Ratti, C. Understanding architecture age and style through deep learning. Cities 2022, 128, 103787. [Google Scholar] [CrossRef]
  19. Hong, D.; Gao, L.; Yokoya, N.; Yao, J.; Chanussot, J.; Du, Q.; Zhang, B. More diverse means better: Multimodal deep learning meets remote-sensing imagery classification. IEEE Trans. Geosci. Remote Sens. 2020, 59, 4340–4354. [Google Scholar] [CrossRef]
  20. Liu, J.; Li, J.; Li, W.; Wu, J. Rethinking big data: A review on the data quality and usage issues. ISPRS J. Photogramm. Remote Sens. 2016, 115, 134–142. [Google Scholar] [CrossRef]
  21. Swan, B.; Laverdiere, M.; Yang, H.L.; Rose, A. Iterative self-organizing SCEne-LEvel sampling (ISOSCELES) for large-scale building extraction. GIScience Remote Sens. 2022, 59, 1–16. [Google Scholar] [CrossRef]
  22. He, T.; Yu, S.; Wang, Z.; Li, J.; Chen, Z. From data quality to model quality: An exploratory study on deep learning. In Proceedings of the 11th Asia-Pacific Symposium on Internetware, Fukuoka, Japan, 28–29 October 2019; pp. 1–6. [Google Scholar]
  23. Ng, W.; Minasny, B.; Mendes, W.d.S.; Demattê, J.A.M. The influence of training sample size on the accuracy of deep learning models for the prediction of soil properties with near-infrared spectroscopy data. Soil 2020, 6, 565–578. [Google Scholar] [CrossRef]
  24. Tobler, W.R. A computer movie simulating urban growth in the Detroit region. Econ. Geogr. 1970, 46, 234–240. [Google Scholar] [CrossRef]
  25. Goodchild, M.F. The validity and usefulness of laws in geographic information science and geography. Ann. Assoc. Am. Geogr. 2004, 94, 300–303. [Google Scholar] [CrossRef] [Green Version]
  26. Cai, Y.; He, H.; Yang, K.; Fatholahi, S.N.; Ma, L.; Xu, L.; Li, J. A comparative study of deep learning approaches to rooftop detection in aerial images. Can. J. Remote Sens. 2021, 47, 413–431. [Google Scholar] [CrossRef]
  27. He, H.; Garcia, E.A. Learning from imbalanced data. IEEE Trans. Knowl. Data Eng. 2009, 21, 1263–1284. [Google Scholar]
  28. Doan, Q.H.; Mai, S.-H.; Do, Q.T.; Thai, D.-K. A cluster-based data splitting method for small sample and class imbalance problems in impact damage classification. Appl. Soft Comput. 2022, 120, 108628. [Google Scholar] [CrossRef]
  29. Shields, M.D.; Teferra, K.; Hapij, A.; Daddazio, R.P. Refined stratified sampling for efficient Monte Carlo based uncertainty quantification. Reliab. Eng. Syst. Saf. 2015, 142, 310–325. [Google Scholar] [CrossRef] [Green Version]
  30. Wu, Q.; Ye, Y.; Zhang, H.; Ng, M.K.; Ho, S.-S. ForesTexter: An efficient random forest algorithm for imbalanced text categorization. Knowl. -Based Syst. 2014, 67, 105–116. [Google Scholar] [CrossRef]
  31. Zheng, Z.; Zhong, Y.; Ma, A.; Zhang, L. FPGA: Fast patch-free global learning framework for fully end-to-end hyperspectral image classification. IEEE Trans. Geosci. Remote Sens. 2020, 58, 5612–5626. [Google Scholar] [CrossRef]
  32. Cao, Z.; Wang, J.; Li, L.; Jiang, C. Strata efficiency and optimization strategy of stratified sampling on spatial population. Prog. Geogr. 2008, 27, 152–160. [Google Scholar]
  33. Catherine, A.; Troussellier, M.; Bernard, C. Design and application of a stratified sampling strategy to study the regional distribution of cyanobacteria (Ile-de-France, France). Water Res. 2008, 42, 4989–5001. [Google Scholar] [CrossRef] [PubMed]
  34. Knotters, M.; Teuling, K.; Reijneveld, A.; Lesschen, J.P.; Kuikman, P. Changes in organic matter contents and carbon stocks in Dutch soils, 1998–2018. Geoderma 2022, 414, 115751. [Google Scholar] [CrossRef]
  35. Molla, A.; Zuo, S.; Zhang, W.; Qiu, Y.; Ren, Y.; Han, J. Optimal spatial sampling design for monitoring potentially toxic elements pollution on urban green space soil: A spatial simulated annealing and k-means integrated approach. Sci. Total Environ. 2022, 802, 149728. [Google Scholar] [CrossRef]
  36. Clougherty, J.E.; Kheirbek, I.; Eisl, H.M.; Ross, Z.; Pezeshki, G.; Gorczynski, J.E.; Johnson, S.; Markowitz, S.; Kass, D.; Matte, T. Intra-urban spatial variability in wintertime street-level concentrations of multiple combustion-related air pollutants: The New York City Community Air Survey (NYCCAS). J. Expo. Sci. Environ. Epidemiol. 2013, 23, 232–240. [Google Scholar] [CrossRef]
  37. Kirkpatrick, S.; Gelatt Jr, C.D.; Vecchi, M.P. Optimization by simulated annealing. Science 1983, 220, 671–680. [Google Scholar] [CrossRef]
  38. Coll, N.; Fort, M.; Saus, M. Coverage area maximization with parallel simulated annealing. Expert Syst. Appl. 2022, 202, 117185. [Google Scholar] [CrossRef]
  39. Li, X.; Gao, B.; Pan, Y.; Bai, Z.; Gao, Y.; Dong, S.; Li, S. Multi-objective optimization sampling based on Pareto optimality for soil mapping. Geoderma 2022, 425, 116069. [Google Scholar] [CrossRef]
  40. Shao, S.; Su, B.; Zhang, Y.; Gao, C.; Zhang, M.; Zhang, H.; Yang, L. Sample design optimization for soil mapping using improved artificial neural networks and simulated annealing. Geoderma 2022, 413, 115749. [Google Scholar] [CrossRef]
  41. Gao, B.; Chen, Z.; Gao, Y.; Hu, M.; Li, X.; Pan, Y. Optimization of the sampling design for multiobjective soil mapping using the multiple path SSA (MP-SSA) method. CATENA 2022, 217, 106479. [Google Scholar] [CrossRef]
  42. Li, J.; Tian, L.; Wang, Y.; Jin, S.; Li, T.; Hou, X. Optimal sampling strategy of water quality monitoring at high dynamic lakes: A remote sensing and spatial simulated annealing integrated approach. Sci. Total Environ. 2021, 777, 146113. [Google Scholar] [CrossRef]
  43. Molla, A.; Ren, Y.; Zuo, S.; Qiu, Y.; Liangbin, L.; Zhang, Q.; Ju, J. Evaluating sample sizes and design for monitoring and characterizing the spatial variations of potentially toxic elements in the soil. Sci. Total Environ. 2022, 847, 157489. [Google Scholar] [CrossRef]
  44. Foroughi, F.; Wang, J.; Nemati, A.; Chen, Z.; Pei, H. Mapsegnet: A fully automated model based on the encoder-decoder architecture for indoor map segmentation. IEEE Access 2021, 9, 101530–101542. [Google Scholar] [CrossRef]
  45. Ji, Y.; Zhang, H.; Zhang, Z.; Liu, M. CNN-based encoder-decoder networks for salient object detection: A comprehensive review and recent advances. Inf. Sci. 2021, 546, 835–857. [Google Scholar] [CrossRef]
  46. Li, Y.; Lu, H.; Liu, Q.; Zhang, Y.; Liu, X. SSDBN: A Single-Side Dual-Branch Network with Encoder–Decoder for Building Extraction. Remote Sens. 2022, 14, 768. [Google Scholar] [CrossRef]
  47. Shi, X.; Fu, S.; Chen, J.; Wang, F.; Xu, F. Object-level semantic segmentation on the high-resolution Gaofen-3 FUSAR-map dataset. IEEE J. Sel. Top. Appl. Earth Obs. Remote Sens. 2021, 14, 3107–3119. [Google Scholar] [CrossRef]
  48. Tang, Y.; Zhang, A.A.; Luo, L.; Wang, G.; Yang, E. Pixel-level pavement crack segmentation with encoder-decoder network. Measurement 2021, 184, 109914. [Google Scholar] [CrossRef]
  49. Wang, L.; Li, R.; Duan, C.; Zhang, C.; Meng, X.; Fang, S. A novel transformer based semantic segmentation scheme for fine-resolution remote sensing images. IEEE Geosci. Remote Sens. Lett. 2022, 19, 1–5. [Google Scholar] [CrossRef]
  50. Qian, Z.; Liu, X.; Tao, F.; Zhou, T. Identification of urban functional areas by coupling satellite images and taxi GPS trajectories. Remote Sens. 2020, 12, 2449. [Google Scholar] [CrossRef]
  51. Zhang, K.; Qian, Z.; Yang, Y.; Chen, M.; Zhong, T.; Zhu, R.; Lv, G.; Yan, J. Using street view images to identify road noise barriers with ensemble classification model and geospatial analysis. Sustain. Cities Soc. 2022, 78, 103598. [Google Scholar] [CrossRef]
  52. Zhong, T.; Zhang, K.; Chen, M.; Wang, Y.; Zhu, R.; Zhang, Z.; Zhou, Z.; Qian, Z.; Lv, G.; Yan, J. Assessment of solar photovoltaic potentials on urban noise barriers using street-view imagery. Renew. Energy 2021, 168, 181–194. [Google Scholar] [CrossRef]
  53. Ma, X.; Longley, I.; Gao, J.; Kachhara, A.; Salmond, J. A site-optimised multi-scale GIS based land use regression model for simulating local scale patterns in air pollution. Sci. Total Environ. 2019, 685, 134–149. [Google Scholar] [CrossRef]
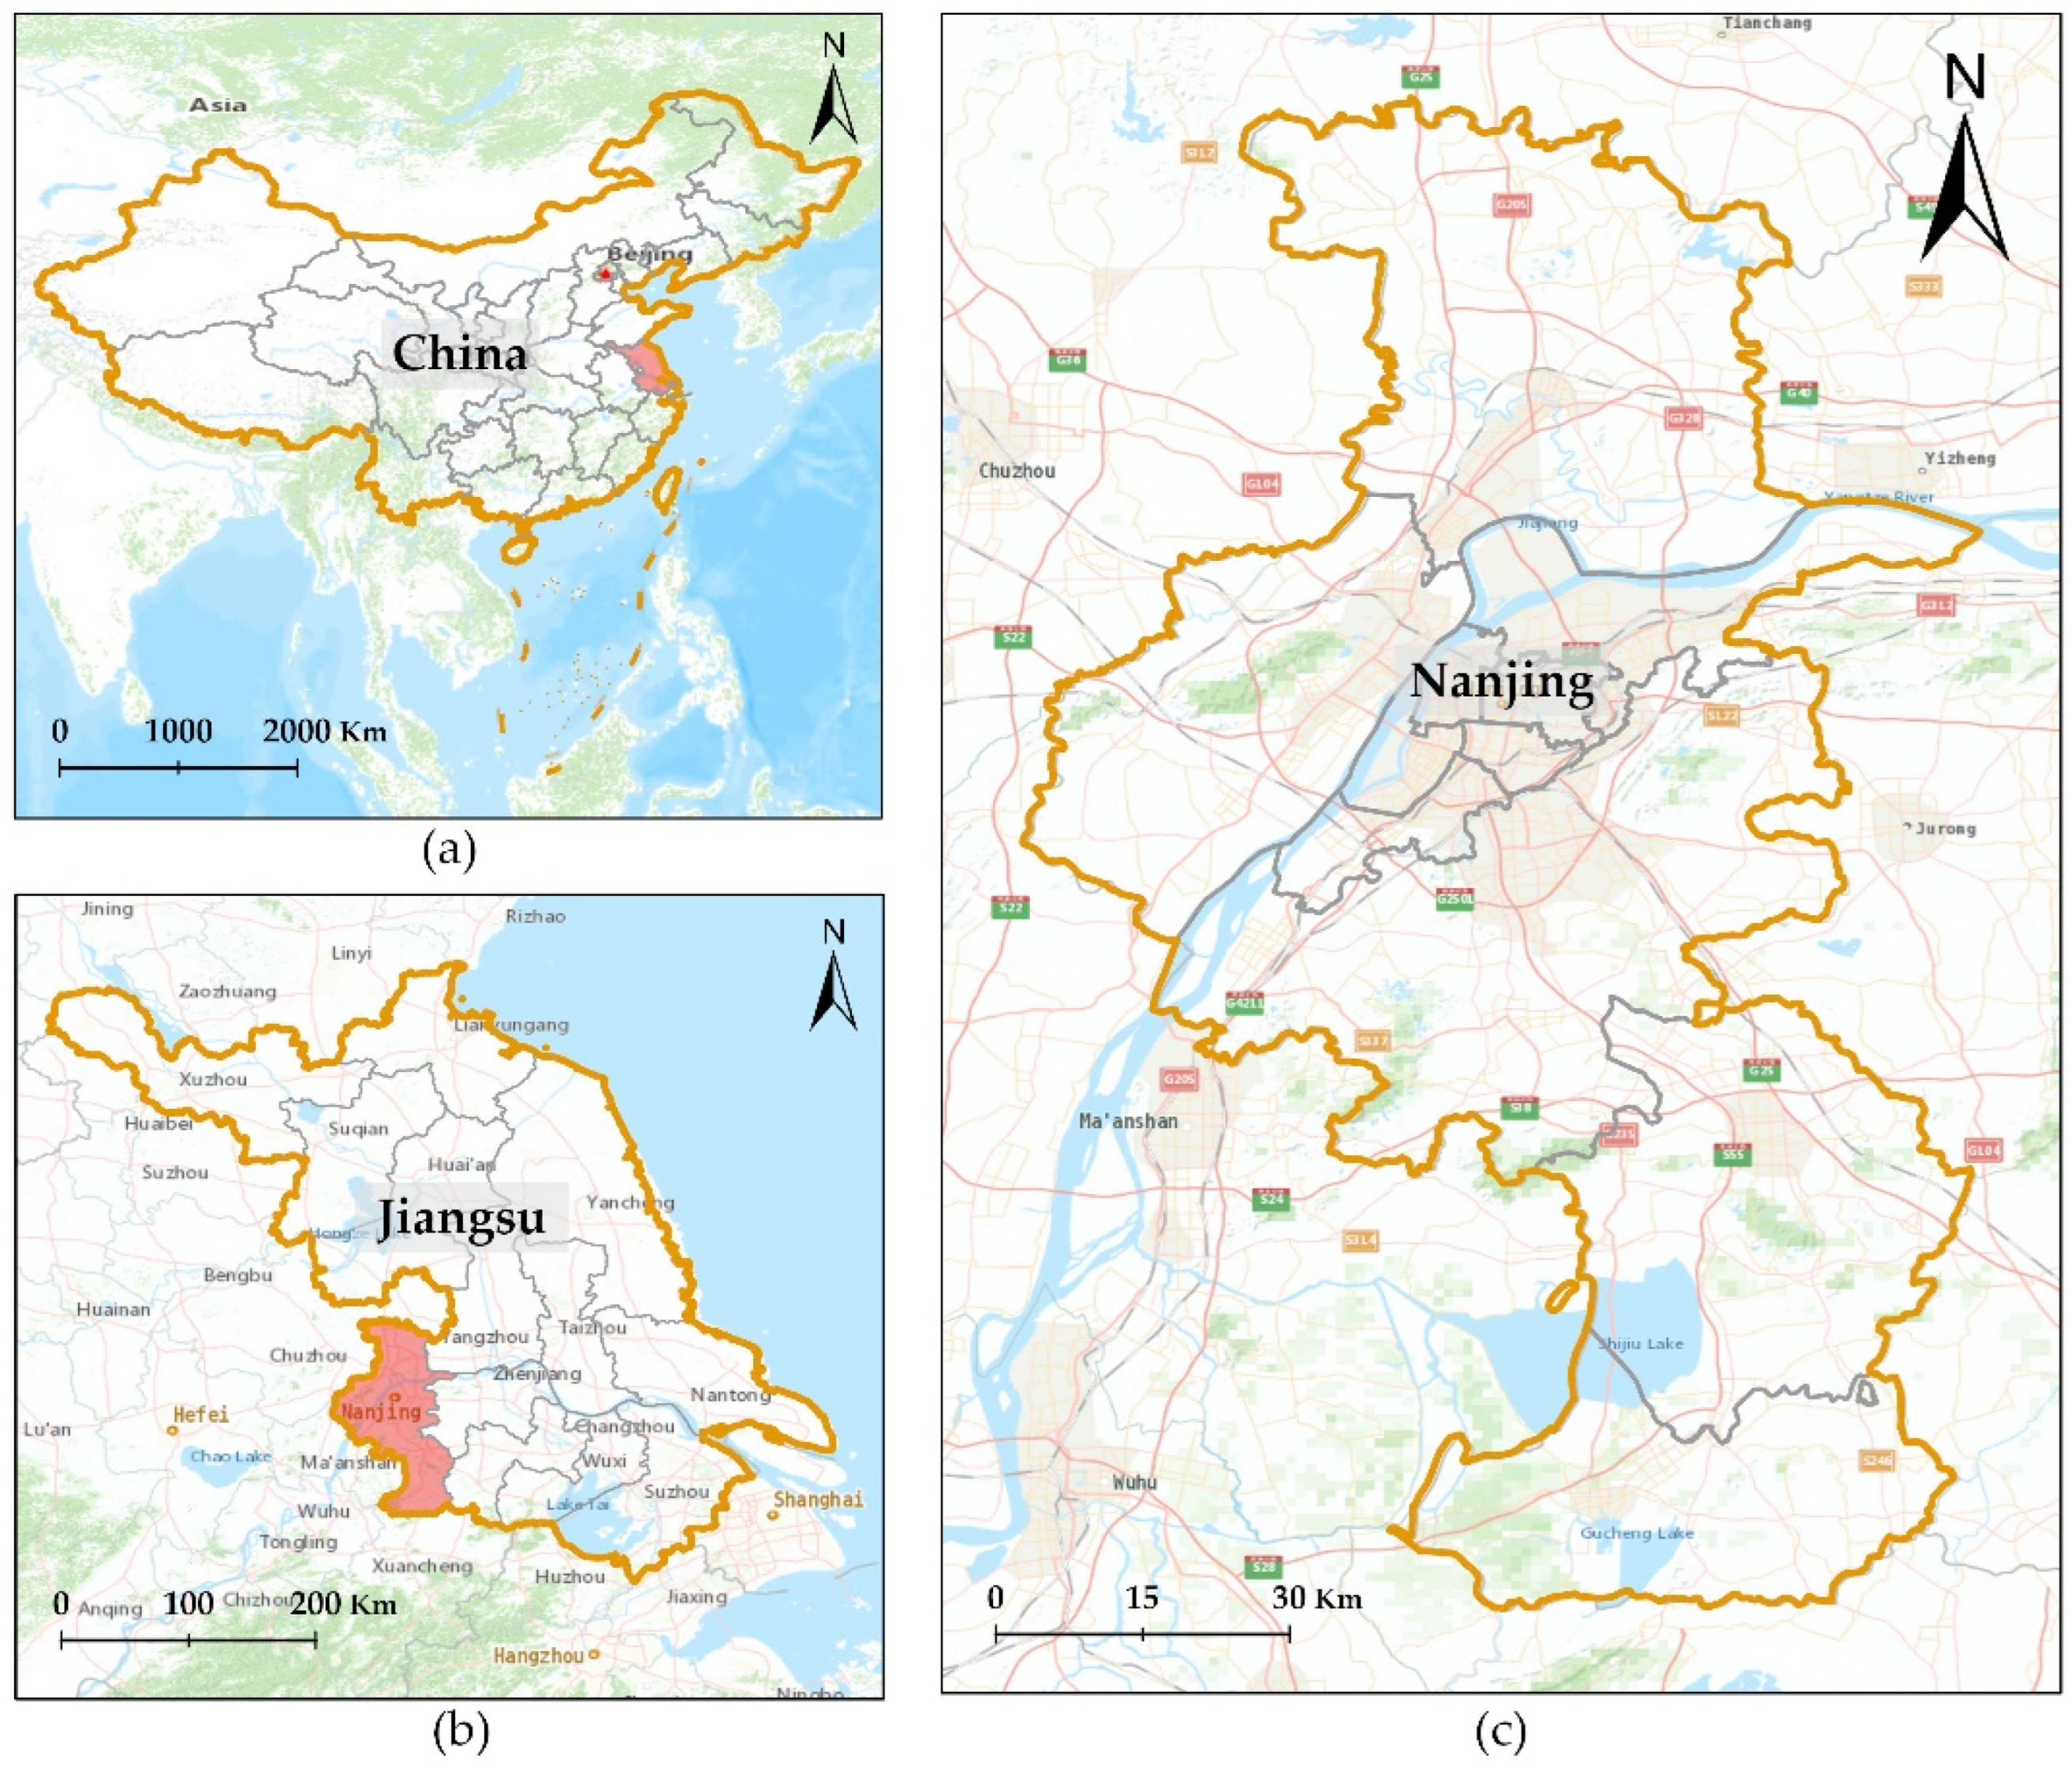
Figure 1. Study area. (a) China, (b) Jiangsu Province, (c) Nanjing City.
Remotesensing 14 04961 g001
Figure 2. Datasets of Nanjing. (a) GES imagery, (b) FROM-GLC30 2017, (c) vectorized rooftop area, (d) part of the GES imagery, (e) part of the FROM-GLC30 2017 image, and (e) part of the vectorized rooftop area image.
Remotesensing 14 04961 g002
Figure 3. Overall working framework.
Remotesensing 14 04961 g003
Figure 4. Sampling area stratification based on the patch size of the built-up area; (a) division of the built-up and unbuilt-up areas in Nanjing; (b) division of the rooftop-dense and rooftop-sparse areas in Nanjing; (c) the four adjacent sample cells in rooftop-dense stratum; (d) the four adjacent sample cells in rooftop-sparse stratum.
Remotesensing 14 04961 g004
Figure 5. Definition of the confusion matrix in the binary classification.
Remotesensing 14 04961 g005
Figure 6. The working framework for training dataset collection based on GSOS.
Remotesensing 14 04961 g006
Figure 7. TSNE plots of rooftop image patches based on KMeans clustering and partial image patches of each class. (a) TSNE plots and partial image patches of the GSOS; (b) TSNE plots and partial image patches of the SRSS; (c) TSNE plots and partial image patches of the DOS; (d) TSNE plots and partial image patches of the RSS.
Remotesensing 14 04961 g007
Figure 8. Learning curves. (a) Learning curve under the F1-score metrics; (b) learning curve under the IoU metrics.
Remotesensing 14 04961 g008
Figure 9. Effect curve of four sampling strategies on the rooftop extraction accuracy under different network models. (a) effect curve under the F1-score metrics; (b) effect curve under the IoU metrics.
Remotesensing 14 04961 g009
Table 1. Experiment configuration.
ItemConfiguration
OptimizerAdamW
Weight decay rate0.0005
Learning rate schedulerCosine Annealing Warm Restarts
Number of iterations for the first restart2
The factor increases the number of epochs after a restart2
Loss functionBCE&DICE
Table 2. Statistical comparison results of the rooftop proportion for different sampling strategies.
Sample SizeAverage Proportion of Rooftops in Image Patches
RSSDOSSRSSGSOS
5004.14%4.26%7.58%6.83%
10003.90%2.29%7.59%6.98%
15002.31%4.17%7.86%7.14%
20004.02%2.29%7.46%7.10%
25004.07%2.20%7.75%7.18%
30003.88%2.38%7.52%7.05%
35004.06%2.20%7.79%7.17%
40004.28%2.20%7.66%7.26%
Mean3.83%2.75%7.65%7.09%
STD0.59%0.85%0.13%0.12%
Publisher’s Note: MDPI stays neutral with regard to jurisdictional claims in published maps and institutional affiliations.