Article

Evaluation of IMERG Precipitation Products in the Southeast Costal Urban Region of China

1
Institute of Geographic Sciences and Natural Resources Research, Chinese Academy of Sciences, Beijing 100101, China
2
Jiangsu Center for Collaborative Innovation in Geographical Information Resource Development and Application, Nanjing 210023, China
Remote Sens. 2022, 14(19), 4947; https://doi.org/10.3390/rs14194947
Submission received: 1 September 2022 / Revised: 30 September 2022 / Accepted: 30 September 2022 / Published: 3 October 2022

Abstract

:
The intensification of extreme precipitation has aggravated urban flood disasters, which makes timely and reliable precipitation information urgently needed. As the high-quality and widely used satellite precipitation products, Integrated Multi-satellitE Retrievals for GPM (IMERG), have not been well investigated in coastal urban agglomerations where damages from precipitation-related disasters are more severe. With precipitation measurements from local high-density gauge stations, this study evaluates three IMERG runs (IMERG ER, IMERG LR, and IMERG FR) in the southeast coastal urban region of China. The evaluation shows that the three IMERG products severely overestimate weak precipitation and underestimate heavy precipitation. Among the three runs, the post-corrected IMERG FR does not show a substantial improvement compared to the near-real-time IMERG ER and IMERG LR. The performance of IMERG varies depending on the precipitation pattern and intensity, with the best estimation ability occurring in the coastal urban region in summer and in the northern forests in winter. Due to the year-round urban effect on precipitation variability, IMERG cannot detect precipitation events well in the central high-density urban areas, and has its best detection ability on cultivated lands in summer and forests in winter. Within the urban agglomeration, IMERG shows a poorer performance in areas with higher urbanization levels. Thus, the IMERG products for coastal urban areas need considerable improvements, such as regionalized segmental corrections based on precipitation intensity and the adjustment of short-duration estimates by daily or sub-daily precipitation measurements.

1. Introduction

Precipitation is one of the key components of the hydrological cycle, connecting the ocean, land and atmosphere [1]. In recent decades, the intensification of extreme precipitation events has aggravated the frequency and intensity of floods [2], which have caused extensive economic and social damage worldwide, especially in populous and economically active urban areas [3]. Timely and reliable precipitation information is urgently needed for urban flood monitoring and warning to reduce casualties and economic losses. However, due to the strong heterogeneity of precipitation processes [4], the accurate acquisition of precipitation data with fine spatial and temporal resolution still remains a great challenge for the world [5,6].
The rain gauge is considered the traditional and direct method for measuring precipitation at any given point. This approach is limited by the uneven distribution of stations and high maintenance costs [7,8,9,10]. To capture the spatial variability of precipitation, several techniques have been developed, such as ground-based weather radar [11,12] and numerical weather prediction and reanalysis [13]. Satellite remote sensing is another effective means to obtain high-resolution precipitation data with wide coverage as well as spatial and temporal continuity [14]. Based on the massive data accumulated by the global satellite network, continuous precipitation can be derived by visible/infrared inversion [15,16,17,18], active or passive microwave inversion [19,20,21], and multi-sensor joint inversion [22,23]. There are many satellite precipitation products (SPPs) that have been developed and used, such as the TRMM Multi-satellite Precipitation Analysis (TMPA) [23], Global Satellite Mapping of Precipitation [24], Climate Prediction Center Morphing Technique [22] and Integrated Multi-satellitE Retrievals for GPM (IMERG) [25].
Among the various SPPs, TMPA has contributed nearly two decades of high-quality tropical and subtropical precipitation data [26], but is no longer available after 2019. As the successor to TMPA, IMERG offers precipitation estimates starting from 2014, by inverting atmospheric signals emitted or scattered by hydrometeors [27], with the improved detection of weak and solid precipitation [28]. Benefiting from advanced equipment, IMERG provides wider coverage, finer spatial and temporal resolution, and more reliable precipitation records than its predecessor TMPA. In recent years, as one of the state-of-the-art SPPs, IMERG products have been widely used in hydrological simulation [29], flood prediction [30], and extreme event analysis [31].
Since the release of the IMERG products, they have been evaluated in different regions and at various spatial and temporal scales to explore their accuracy and reliability. The superiority of IMERG over TMPA and its ability to capture spatial patterns of precipitation have been noted by studies conducted in mainland China [32], the United States [33,34], Iran [8], India [35], and Brazil [9]. Evaluations at different timescales demonstrate that the performance of IMERG is more effective at larger timescales [36,37,38,39]. For different climatic regimes, the ability of IMERG to estimate precipitation is stronger in humid areas than in semi-arid and arid areas [40,41,42]. Several studies have reported that shortcomings of IMERG include the overestimation of weak precipitation [43,44], underestimation of high intensity precipitation [45,46], and the inability to accurately represent precipitation over complex terrain [47,48]. In addition, evaluations on different surface types show that estimating coastal precipitation is particularly challenging for IMERG, which is attributed to the joint contribution of contrasting radiation from ocean and land over the coastline [49,50,51,52]. Some evaluations have demonstrated that IMERG typically has better performance in the summer than in the winter [53,54,55].
These previous efforts were large-scale regional assessments, with little focus on urban areas where accurate, timely and high-resolution precipitation information is urgently needed for urban management, disaster warning and policy development. In order to take full advantage of the fine temporal resolution of IMERG, evaluations at sub-daily timescales are needed, with an emphasis on how effectively the products can describe sub-daily precipitation.
To explore the above issues, this study presents an evaluation of the IMERG precipitation products for the southeast coastal region of China during 2018. The region has a typical coastal urban agglomeration, with a compact infrastructure, dense population, and high economic connectivity. Located along the coast, this urban agglomeration frequently suffers from torrential rains, typhoons, and floods, which pose great threats to human life and the economy. Within the region, a high-density rain gauge network has been established to measure hourly precipitation, providing the opportunity to investigate the sub-daily performance of the IMERG products in coastal urban areas.
The main objectives of this study are: (1) to evaluate the overall estimation and detection ability of the IMERG products at multiple temporal scales (hourly and daily); (2) to analyze and compare the IMERG performance in coastal urban and non-urban areas; and (3) to investigate the performance of the IMERG products in different parts of the study area at the grid-scale. This work can provide useful references for research and the application of IMERG precipitation data in the fields of water resources management, development planning and disaster early warning in coastal urban areas.

2. Study Area and Datasets

2.1. Study Area

The study area is located in the coastal region of southeast China between 111.2°–114.5°E and 21.3°–24.2°N (Figure 1). The region covers a total area of 56,000 km2, and more than 80% is urban, including the nine cities of Guangzhou, Shenzhen, Zhuhai, Foshan, Huizhou, Dongguan, Zhongshan, Jiangmen and Zhaoqing in Guangdong Province, and two special administrative regions of Hong Kong and Macau. The regional gross domestic product (GDP) reached US$ 1.7 trillion in 2020, with a GDP per capita of over US$ 20,000 and a population of over 80 million. The study area has a well-developed transport infrastructure, with around 4000 km of highways, more than 6000 km of navigable rivers, and a dense network of coastal ports and airports.
The elevation here varies from −10 to 1614 m, with some mountains in the north and extensive plains in the center and south. The study area has a distinct subtropical monsoon climate, with high temperatures and simultaneous rain and heat throughout the year. The average annual temperature is about 19–24 °C [56] and the average annual precipitation is about 1300–2500 mm [57]. 80% of the regional annual precipitation is concentrated in the wet season (April to September). Precipitation during the dry season (October to March) and the pre-wet season (April to June) is mainly influenced by frontal troughs, while precipitation during the post-wet season (July to September) is dominated by tropical weather systems and local convection. Orographic precipitation in this area is triggered by the northern mountains and some south-facing elevated terrain. During the wet season, extreme precipitation is frequent and can lead to severe flooding, as well as casualties and economic losses [58]. Therefore, timely and reliable precipitation information for this area is essential to ensure regional security and development.

2.2. Datasets

2.2.1. Rain Gauge Observation Data

Hourly precipitation observations were obtained from a ground-based network of 2177 rain gauge stations maintained by the China Meteorological Administration. The majority of these measurements are from tipping-bucket rainfall recorders which have a receiver diameter of 20 cm, a receiver height of 70 cm, and a signal output for every 0.1 mm of precipitation collected. Each observation is flagged by a quality control code (Table 1), according to which invalid (missing or low-quality) measurements are removed before evaluation (see Section 3.1 for details). Restricted by permission for data access, we were only able to obtain gauge observations for the one year of 2018. This 2018 dataset is used as a reference to evaluate and compare the IMERG precipitation products in the study area. Due to the high density of rain gauge stations, 68.3% of the IMERG grids contain at least one station. Grids with no stations are mainly located at sea. The rain gauge observations are helpful in understanding the performance of the IMERG products along the coast.

2.2.2. Satellite Precipitation Products

The SPPs evaluated in this study include the three newest released IMERG V06 products. As compared to the predecessor TMPA, the IMERG products have a finer spatial and temporal resolution (0.1° and 0.5 h), as well as a larger spatial coverage (60°N–60°S) [28]. In response to different user requirements for immediacy and accuracy, the IMERG products are designed with three runs: IMERG Early Run (ER), IMERG Late Run (LR) and IMERG Final Run (FR). The former two are near-real-time products with latencies of 4 h and 14 h, respectively. They can be used for applications where a high degree of timeliness is required, such as disaster warning and prevention. The main difference between them is that IMERG LR incorporates more passive microwave estimates and uses both forward and backward propagation, whereas IMERG ER only uses forward propagation. The research-level product IMERG FR, has a longer latency of 3.5 months. Compared to IMERG ER and IMERG LR, this product is calibrated by monthly observations from the Global Precipitation Climatology Centre (GPCC), and thus provides more accurate precipitation information (especially in areas covered by the GPCC rain gauges). The latest V06 release of IMERG in 2018 is chosen for this evaluation. These products can be obtained from the Precipitation Measurement Missions website (https://gpm.nasa.gov/data/directory, accessed on 14 December 2021).

2.2.3. Land Cover Data

Land cover information from GlobeLand30 was used in the evaluation for urban and non-urban areas. The data are a 30 m global land cover product, including ten class types of cultivated land, forest, grassland, shrubland, wetland, waterbody, tundra, artificial surfaces, bareland as well as permanent snow and ice [59,60]. The 2020 version was employed for the study, which is available at http://www.globallandcover.com/ (accessed on 14 December 2021).

3. Methods

3.1. Data Preprocessing

At first, invalid gauge observations with a quality control code of 1, 2, 5, 6, 7, 8 and 9 were removed. Then, 1381 stations (Figure 1b) with invalid records of less than 5% of the length of study period (438 h) were chosen for the evaluation. In total, more than 11.6 million reliable hourly gauge observations were finally used in the study. The time system of valid gauge measurements was converted to the Coordinated Universal Time to match with the SPPs records. Constrained by the time interval of gauge observations, the evaluation could not be conducted at finer temporal scales than hourly. The half-hourly IMERG estimates were therefore summed by hour to obtain hourly data which matched the gauge measurements. Similarly, hourly IMERG and valid gauge records were processed daily to investigate the daily-scale performance. Notably, a daily gauge record was considered invalid if the day contained invalid hourly measurements.
Considering the limited spatial representativeness of a single gauge and the high density of the gauge observation network, the evaluation took the grid as a baseline by matching the grid estimate to the arithmetic average of the gauge measurements within the grid. Thus, only the IMERG grids containing more than one station were evaluated. There were 834 evaluated grids in the study area, accounting for 68.3% of the total grid number. Grids with no stations internally were mainly located at sea. This spatial matching method can, to some extent, alleviate the underestimation of the SPPs and yield more reliable assessment results [61,62].
For the performance comparison in urban and non-urban areas, we determined the land cover type for each IMERG grid based on GlobeLand30. Specifically, the type with the largest area in a grid was regarded as the type for the grid. Notably, grids with the type of artificial surfaces were considered as urban grids. Evaluations were conducted for three main land cover types: cultivated land, forest and urban, which accounted for 14.0%, 65.4% and 12.8% of the total evaluated grids, respectively. The other types covered very small areas with a fragmented distribution, and were therefore not considered. In addition, the artificial surface area proportion for each urban grid was calculated and used to analyze the performance differences within the urban areas.

3.2. Evaluation Metrics

This work provides a comprehensive evaluation of the three IMERG products in terms of their ability to estimate precipitation magnitude and capture precipitation events based on six metrics, including the mean bias error ( M B E ), correlation coefficient ( C o r r ), root mean square error ( R M S E ), the probability of detection ( P O D ), the false alarm ratio ( F A R ) and the equitable threat score ( E T S ). The former three are accuracy metrics to indicate the accuracy of the SPP estimates; while the latter three are detection metrics to measure the agreement of precipitation occurrence observed by the SPPs and the gauges. The six selected metrics are recommended by the World Meteorological Organization (WMO) for the evaluation of quantitative precipitation estimates [63], and have been widely used in many studies [13,64,65,66,67].
For the accuracy metrics, M B E indicates the direction of bias. Positive and negative values of this metric suggest wetter or drier estimates of SPPs, respectively. C o r r is used to describe the linear correlation between the SPP and the gauge data. The closer the value is to 1, the better the linear agreement between the SPP and the gauge records. R M S E measures the degree of overall error for the SPPs, and a smaller value denotes more accurate SPP estimates. It is worth noting that R M S E is sensitive to precipitation magnitude, i.e., R M S E is likely to be larger for higher-value estimates. The equations of these metrics are as follows:
M B E = i = 1 n ( x i y i ) n
C o r r = i = 1 n ( x i x ¯ ) ( y i y ¯ ) i = 1 n ( x i x ¯ ) 2 i = 1 n ( y i y ¯ ) 2
R M S E = i = 1 n ( x i y i ) 2 n
where x represents SPP grid estimates, y denotes the grid-average values of gauge observations, and n is the total number of SPP estimates. Considering the error magnitude, which is sensitive to precipitation amount, the R M S E divided by the corresponding real precipitation ( r R M S E ) is adopted in the evaluation for urban and non-urban areas.
For the detection metrics, P O D refers to the proportion of real precipitation events that can be detected by the SPPs (equivalent to the hit rate), and its optimal value is 1. F A R indicates the proportion of false events captured by the SPPs (implying a misdetection rate), with an optimal value of 0. E T S measures the overall ability of the SPPs to detect precipitation events after exclusion of hit randomness. When a SPP does not miss or misidentify any precipitation events, it will get the best E T S score of 1. The metrics are calculated as follows:
P O D = H H + M
F A R = F H + F
E T S = H H e H + M + F H e ,   H e = ( H + M ) ( H + F ) H + M + F + C
where H is the number of events observed by both gauge averages and SPPs, M is the number of events observed by gauge averages but not by SPPs, F is the opposite of M , C and is the events not observed by both gauge averages and SPPs, H e represents the number of events correctly detected by SPPs due to randomness. To determine the presence or absence of a precipitation event, 0.1 mm/h and 1 mm/d are used instead of 0 as the threshold at hourly and daily timescales, respectively, considering the tendency for gauges and satellites to produce large uncertainties for light “drizzle”.

3.3. Precipitation Intensity Classification Standard

Evaluation and comparison of the three IMERG products was also performed under different precipitation intensities to obtain a more comprehensive understanding of their performance. To facilitate the metric calculation at different intensities, this work graded the precipitation intensity. On an hourly basis, this study classified precipitation into the six levels of <0.1 mm/h, 0.1–1 mm/h, 1–2.5 mm/h, 2.5–8 mm/h, 8–16 mm/h, and >16 mm/h, corresponding to no/trace rain, tiny rain, light rain, moderate rain, heavy rain, and torrential rain [37]. On a daily basis, precipitation was divided into the six grades of <0.1 mm/d, 0.1–1 mm/d, 1–2 mm/d, 2–10 mm/d, 10–50 mm/d, and >50 mm/d, corresponding to no/trace rain, tiny rain, light rain, moderate rain, heavy rain, and torrential rain [68].

4. Results

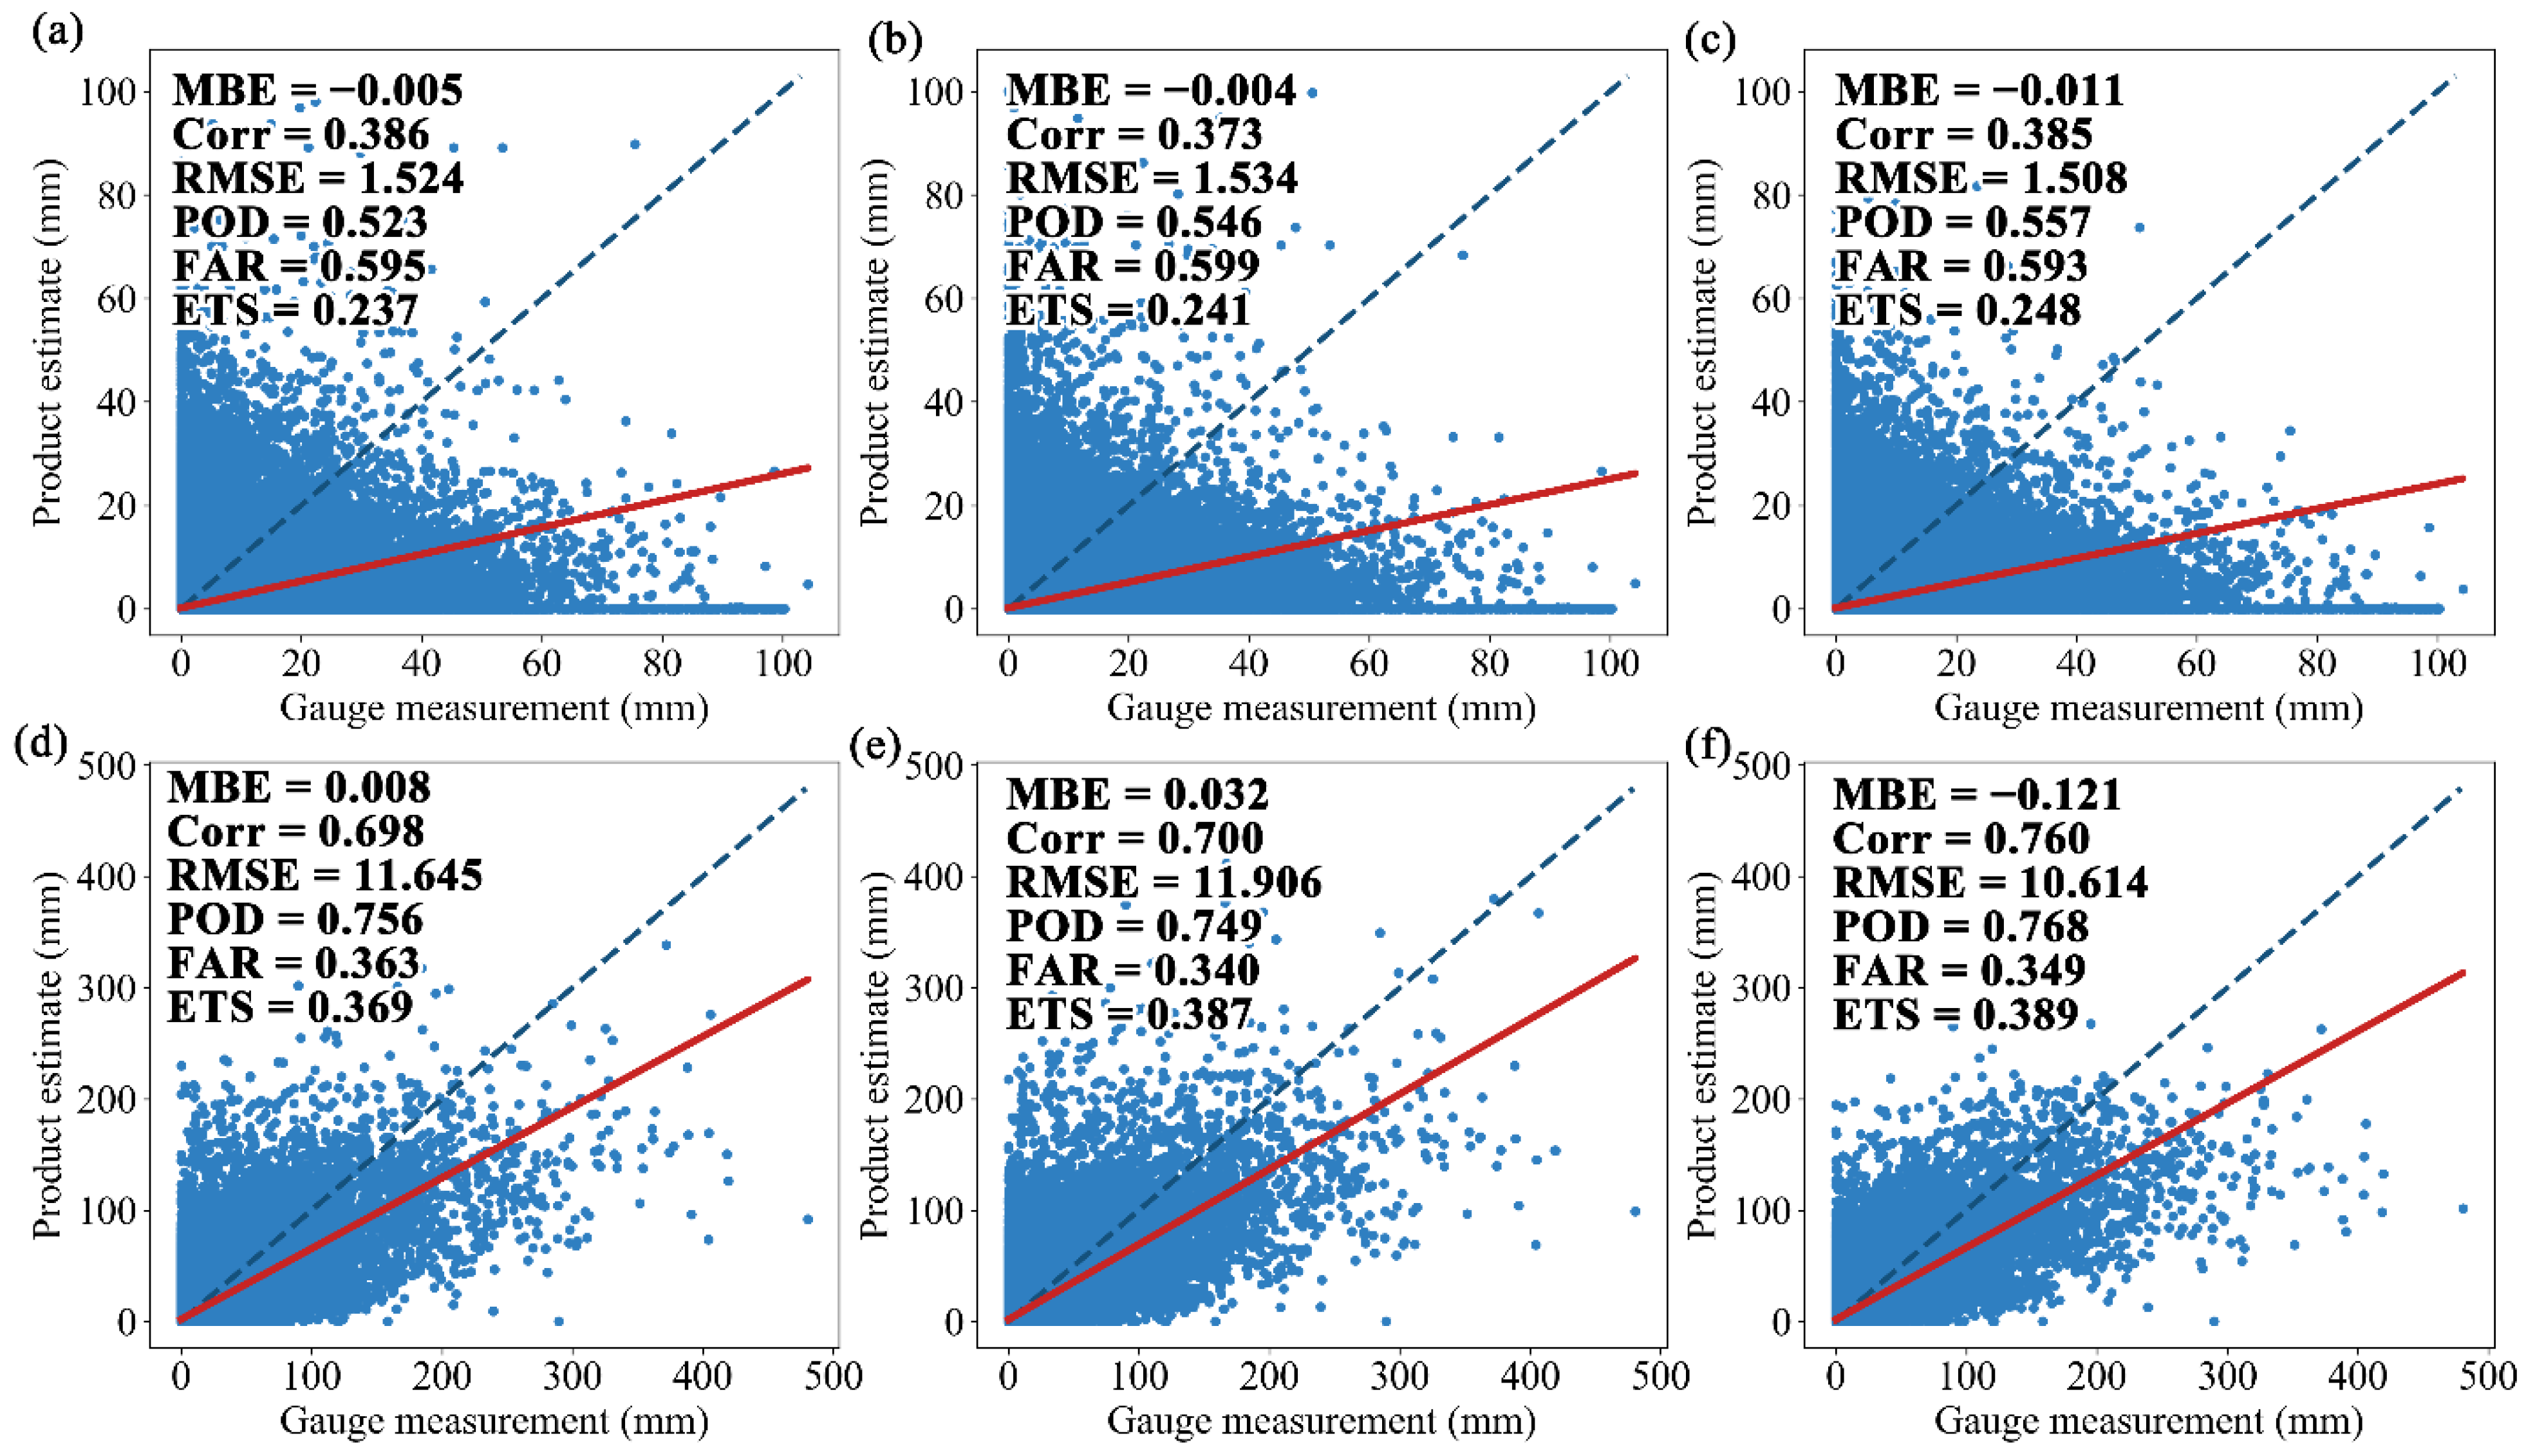
4.1. Evaluation across Temporal Scales

Figure 2 presents the comparison of the IMERG estimates with the gauge observations and the corresponding metrics at different temporal scales during the whole year. On an hourly basis, the performance differences between the three IMERG products are not significant. The overall C o r r values range from 0.37 to 0.39, the negative M B E values range from 0.004 to 0.011 mm, and the R M S E values range from 1.50 to 1.54 mm. It was apparent that the accuracy of the three IMERG products was not good for hourly estimation. Many point-pairs were dispersed, close to or even located on the boundary axes, suggesting a big deficiency of IMERG in estimating light or high-intensity precipitation over short periods. The detection capability of IMERG was also insufficient, with a low hit rate ( P O D ranged between 0.52 and 0.56) and instead, a higher misdetection rate ( F A R ranged between 0.59 and 0.60). As a result, none of the three IMERG products achieved E T S scores above 0.25, indicating a weak detection ability.
As shown by the daily metrics (Figure 2d–f), the three IMERG products performed significantly better on a daily rather than hourly basis, but there was still much room for improvement. Probably due to the correction by the GPCC measurements, IMERG FR outperformed IMERG ER and IMERG LR in terms of agreement with gauge data and overall error magnitude. This calibrated product also avoided some apparently overestimated records (e.g., some points in the upper left corner of Figure 2d,e). For the detection of precipitation occurrence, the IMERG products showed a high hit rate in capturing actual precipitation events. However, there were many cases where IMERG misidentified non-precipitation events as precipitation events, probably due to the high sensitivity of the sensors. Among the different runs of IMERG, the detection ability of IMERG FR outperformed IMERG LR and IMERG ER.
The performance of the three IMERG products differed over different seasons on an hourly basis (Figure 3). The results on a daily timescale can be referred to in the Supplementary Materials (Figure S1). The best scores for all metrics were achieved generally in the summer, with the second and third best scores occurring in the spring and autumn, and the worst in the winter. Similar results were found in previous studies across the Northern Hemisphere, including mainland China [69], Europe [55] and the United States [53]. The main reason may be that satellites are better at detecting and estimating local convection with a certain intensity [53], and this type of precipitation occurs mostly during summer in the Southeast China. In addition, weak precipitation is more common in winter compared to other seasons, while detecting weak precipitation has been a major challenge for satellite precipitation estimation. This issue was also pointed out by a study in the United States [34] that missed precipitation is a major error source during the winter. The three IMERG products showed no distinct differences for spring, summer, and autumn. But in the winter, IMERG FR outperformed the other two near-real-time products, showing the relatively good stability of IMERG FR performance across seasons.

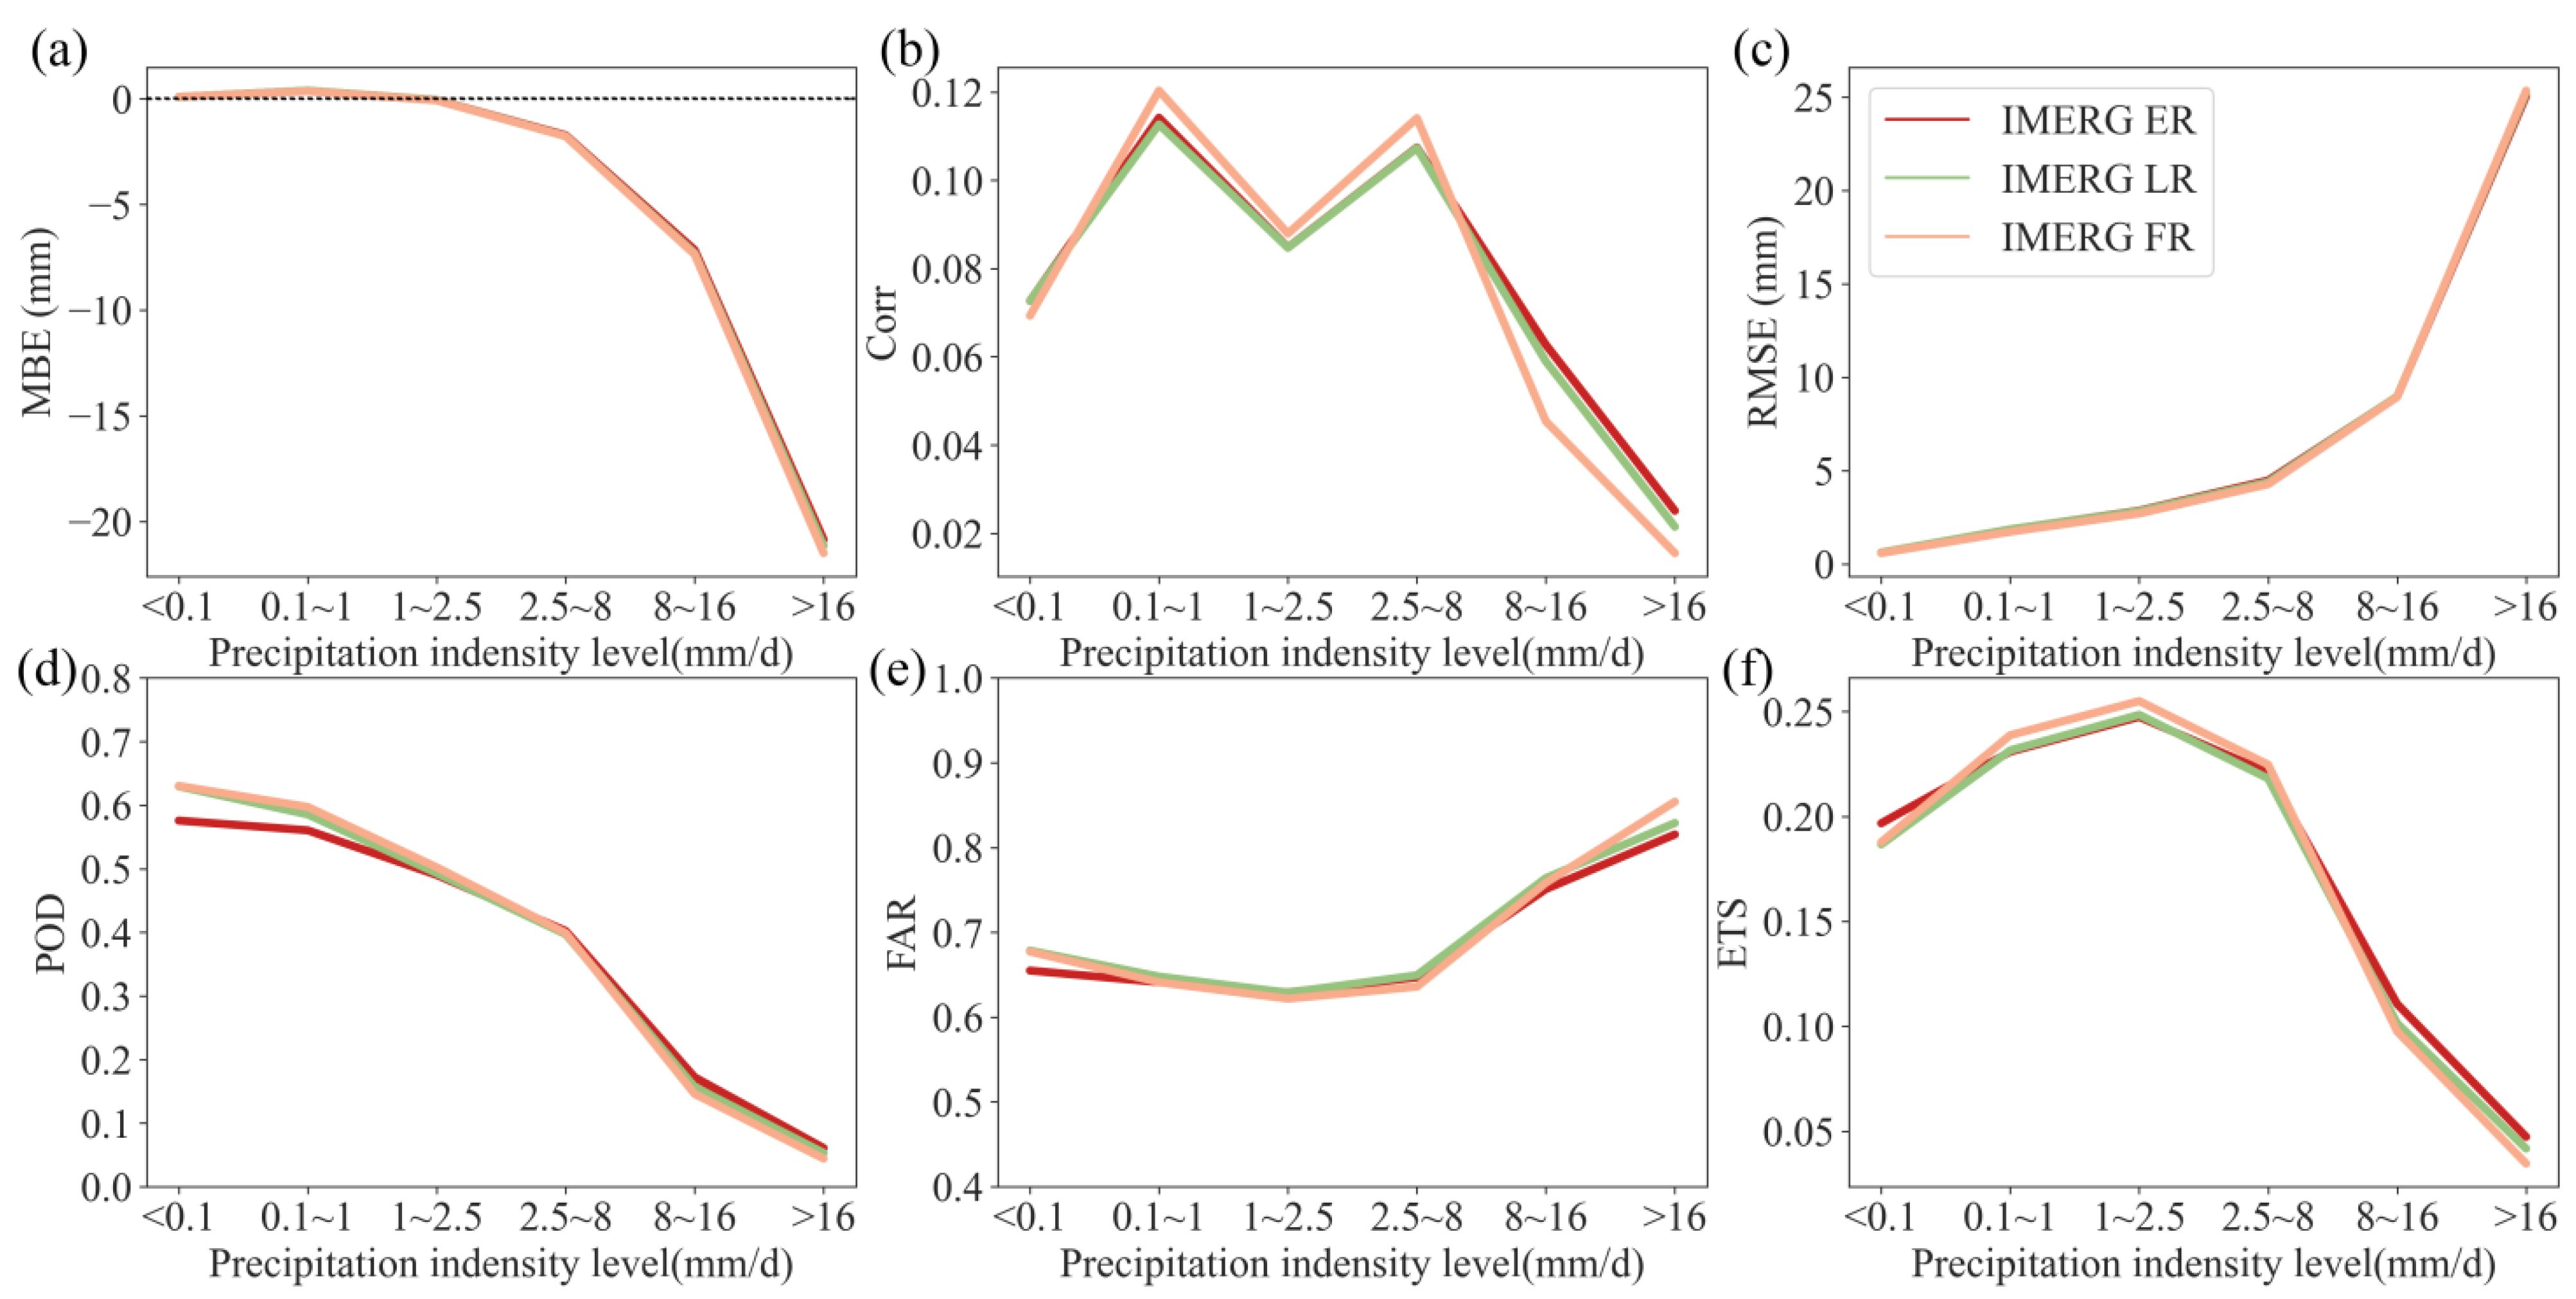
4.2. Evaluation for Different Precipitation Intensities

Figure 4 shows the changes in each metric for different precipitation intensities on an hourly scale. For accuracy metrics, M B E of all three IMERG products had large negative values when precipitation intensity was higher than 2.5 mm/h, indicating the overall drier biases of IMERG estimates for high-intensity precipitation. C o r r fluctuated at different intensities, but the best scores always occurred in the range of 0.1–8 mm/h. Sensitive to the estimate magnitudes, R M S E had larger values at higher intensities. The detection abilities of all three IMERG products were closely related to the precipitation intensity. P O D significantly decreased with increasing intensity, while F A R had a U-shaped change. This showed that there existed several cases in which IMERG overestimated the intensity level of no or weak precipitation events. Meanwhile, IMERG also tended to misidentify the intensity levels as heavy or torrential rain while underestimating the level of actual high-intensity precipitation. As a result, all three IMERG products had relatively good detection abilities for moderate-intensity precipitation, as shown by the high E T S scores in the precipitation intensity range.
The changes of M B E , R M S E , P O D and F A R with precipitation intensity for the three IMERG products on a daily scale in Figure 5 are similar to those on an hourly scale. However, the two metrics of C o r r and E T S exhibit an overall increasing trend with the precipitation intensity. This could stem from the fact that the six intensity levels on hourly and daily scales do not correspond exactly to each other in proportion. In other words, this may be due to the deficiency of the IMERG products in describing the diurnal variation of persistent, high-intensity precipitation. The performance differences between the IMERG products on a daily scale are mainly reflected in the detection of high-intensity precipitation, while there is not much difference in the comparison of weak precipitation.
Many evaluations have reported the overestimation of weak precipitation and underestimation of heavy precipitation by IMERG [46,70,71,72,73]. The overestimation of weak precipitation largely comes from the misdetection of non-precipitation events (Figure 2, Figure 4e and Figure 5e), which is because the passive microwave (PMW) sometimes misidentifies dynamic land surface characteristics as precipitation signals [74]. In addition, the IMERG algorithm (especially the morphing process) is also noted to increase the occurrence of estimated rainfall [51]. For high-intensity precipitation, some researchers consider that the underestimation of IMERG stems from the inherent limitations of PMW and infrared (IR) estimation algorithms (Zhang et al., 2019). PMW-based and IR-based algorithms estimate land precipitation from the scattering signal of frozen hydrometeors and cloud top temperature, respectively [75,76,77]. Therefore, they have difficulty in accurately capturing heavy precipitation (such as convective storms) that are weakly linked to cloud top temperature or have no/few ice particles. The Bayesian averaging in the Goddard profiling (GPROF) retrieval algorithm would also lead to underestimation of high-intensity precipitation [78]. Specifically, the Bayesian method averages multiple profiles in the priori database, which makes the most extreme heavy precipitation in the database to be averaged to lower values and unretrievable.

4.3. Evaluation for Urban and Non-Urban Areas

Land cover affects the water–heat exchange in the boundary layer, which may lead to different performances of SPPs in urban and non-urban areas [79]. Therefore, we investigated the ability of IMERG in this regard with the three main land cover types of cultivated land, forest and urban. Figure 6 shows the hourly results, while the similar daily results are presented in Figure S2.
For the whole of 2018, all three IMERG products have better overall estimation abilities in urban areas, as evidenced by the higher C o r r s and smaller r R M S E s. The two near-real-time products generally overestimated urban precipitation, while showing small overall negative M B E s (which are the results of offset between overestimation and underestimation) on the other two land covers. With ground-based observations, IMERG FR corrected the overestimation in urban areas. Compared to forests, IMERG products provided more accurate estimates for cultivated lands, and had better M B E , C o r r and r R M S E scores. Similar results were found in the summer, but the estimation ability exhibited opposite characteristics in the winter, being strongest in forests, second in cultivated lands and weakest in urban areas (Figures S3 and S4).
In terms of detection metrics, the three IMERG products performed better with cultivated lands than forests, and worst in urban areas. The poor detection ability in urban areas came mainly from the high misdetection rate of precipitation occurrences (Figure 6e). As the IMERG satellite radar obtains precipitation information mainly by detecting precipitation particles, a rise in cloud condensation nodules induced by large anthropogenic aerosol emission in urban areas will increase the chance of false detection [80]. In addition, the roughness of artificial surfaces, urban thermal effects, and water vapor variability can also cause greater uncertainty in urban precipitation occurrence and can affect the SPP detection capability [81,82]. Such an urban effect occurred throughout the year, despite the observed seasonality of the differences in detection abilities between cultivated lands and forests (Figures S3 and S4).
We also analyzed the performance differences within the urban areas. Figure 7 shows the changes in the metrics of urban grids with artificial surface area proportion on an hourly scale. It can be seen that almost all the metrics, except M B E , become significantly worse (p-value < 0.001) with increasing artificial surface area proportion, which indicates a negative impact of the urbanization level on IMERG performance to some extent. The extent of the urban effect appears to show little difference for the three IMERG runs. Similar results were observed on a daily scale and across seasons (Figures S5–S7).

4.4. Evaluation for Spatial Distribution

Figure 8 shows the spatial distributions of evaluation metrics on an hourly scale. Results on a daily scale are similar and can be found in the Supplementary Materials (Figure S8). The M B E values for all IMERG products were mainly negative in the north and south, especially in the southernmost coastal areas (Figure 6a–c). The main difference in this metric among the IMERG products was reflected in the central region, showing the concentrated wetter estimates for IMERG ER and IMERG LR, which was not observed for IMERG FR. C o r r of the three IMERG products showed a spatial trend of gradually increasing from the north-western hills to the south-eastern plains, with the highest values in the southern coast (Figure 6d–f). The largest R M S E values were shown along the southernmost coastlines, with the moderate and lowest values in the center and north, respectively (Figure 6g–i).
In terms of detection capability (Figure 6j–r), the highest values of P O D and F A R for the three IMERG products were both found in the central area with a high urban density, resulting in a significantly lower E T S in this area. In contrast, coastal areas such as Jiangmen, Zhuhai and southern Huizhou, which have higher P O D and lower F A R values, showed better E T S scores. Generally, the estimation accuracy of IMERG was better for the southeast coastal region, while the strongest and weakest detection capabilities were found for the south coast and the central high-density urban areas, respectively. This finding was consistent with the evaluation results for different land covers, as urban areas are mainly located in the south-central plains, cultivated lands are evenly distributed across the study area, and extensive forests are in the northern hills (Figure 1c).
Using C o r r and E T S as proxies for accuracy and detection metrics, respectively, the spatial patterns of IMERG performance over the seasons was further explored (Figure 9). The spatial distributions of summer C o r r and E T S were essentially similar to the year-round results because the annual precipitation in this region is dominated by summer precipitation. By winter, C o r r reached its maximum in the east. In comparison, the areas of high C o r r values of IMERG FR were wider, covering the east, northeast, and west. For detection capability, E T S values were relatively larger in the north, while the low values all occurred in the south.
Due to the abundant sources of water vapor as well as frequent tropical weather systems and local convection, coastal areas have more precipitation with certain intensity in summer, while precipitation in the northern mountains is usually relatively weak (Figure S9a). SPPs are deficient in detecting weak precipitation and therefore have overall better performance in the southeast during summer. In winter, the coastal convective activity decreases, and regional precipitation is mainly controlled by frontal troughs. Hence, the precipitation intensity in the south is not as strong as that in the north (Figure S9b). This led to the better performance of IMERG in the northern mountains during winter. It is noteworthy that the evaluated SPPs showed a lack of detection capability for central high-density urban areas in both summer and winter, suggesting a year-round urban influence on precipitation occurrence.

5. Discussion

5.1. Advantages of the High-Density Gauge Observations

To assess the SPPs in this study, a high-density network of 1381 gauge stations was used, covering essentially the entire study area (Figure 1b). Only the IMERG grids containing more than one station were involved in the evaluation. These evaluated grids were distributed evenly across the study area (Figure S10), enabling a spatial evaluation of IMERG. The gauge density is approximately 2.49 stations/100 km2, well above the threshold of 1.5 stations/100 km2 which defines a high-density network [83]. Previous studies have reported that the sparse distribution of ground reference stations can lead to an underestimation of SPP performance [61]. Thus, such high-density gauge observations can yield more accurate and dependable evaluation results.
Usually when gauge stations are sparse or insufficient, only a single station and the corresponding SPP grid are used for evaluation. However, the spatial representativeness of an individual point-scale station is limited and cannot fully account for the precipitation over a certain area. It has been suggested that the grid-average value of station observations can better reflect the mixing of precipitation at different localities within the grid cell [84]. Based on the high-density network in this study, the SPP estimates for grids covering more than one gauge can be compared with the grid-average values of gauge data. Since IMERG FR is calibrated against GPCC observations, it is necessary to consider the overlap between the reference gauge stations and GPCC data to ensure a meaningful comparison between the three IMERG products. However, the GPCC does not provide the exact location of its stations, and only releases the number of stations per 1° grid worldwide. Thus, the method suggested by Yu et al. [46] was used to analyze the number of GPCC stations as a proportion of the number of reference stations in each 1° grid. The result showed that this proportion is less than 10% in most 1° grids, with a few of the highest not exceeding 30% (Figure S11). This illustrated the independence of most local gauges versus the GPCC observations, thus the comparison results for the three IMERG runs were valid in the study.

5.2. Performance of IMERG

The evaluation shows that IMERG cannot accurately represent hourly and daily precipitation in the southeast coastal urban areas of China. As presented in Figure 2, the IMERG products have poor estimation accuracy and weak detection ability (low hit rate and high misdetection rate), which is consistent with some previous works conducted in Guangdong province [37,71,85,86]. Poor performance of IMERG is also found in coastal regions such as Brazil [49], India [87], Mediterranean islands [50] and eastern China [88]. This may be attributed to the complex radiation conditions in coastal regions [52]. The ocean surface is radiometrically cold and homogeneous, while the land surface is warm and heterogeneous [21]. As the transitional zones, coastal regions include radiative contributions from both land and ocean surfaces, which poses a great challenge for coastal precipitation retrieval.
For different precipitation intensities, IMERG significantly overestimates weak precipitation and underestimates high-intensity precipitation, which has been previously reported in regions such as the Guangdong Province [37,71,86], eastern China [70,72], North America [43], and Central Asia [73]. The overestimation of weak precipitation is probably due to the misdetection of dynamic land surface signals by PMW [51]; while the underestimation of high-intensity precipitation comes from the insignificant association of some heavy precipitation types with the atmospheric signatures relied upon by PWM and IR retrieval [86]. Besides, the Bayesian averaging of the GPROF retrieval algorithm and the morphing process of the IMERG algorithm are also causes of wetter weak precipitation and drier heavy precipitation, respectively [51,78].
Analysis for urban and non-urban areas demonstrates a year-round negative impact of the urban areas on IMERG detection ability. Within the urban areas, IMERG performs better in areas with lower urbanization levels. Similar results were found in another study for Southeast China, which showed a larger uncertainty in IMERG estimates for urban precipitation [88]. This results from the greater uncertainty in urban precipitation occurrence caused by aerosol emissions, artificial surface roughness, urban thermal effects, and water vapor changes [80,81,82].
In addition, the gauge-corrected IMERG FR does not show a significant improvement over IMERG ER and IMERG LR, which is likely related to the limited temporal resolution and number of GPCC observations in the study area. This finding is also noted in the studies of Li et al. [37] and Zhang et al. [86] in similar regions.
Notably, limited by the accessibility of gauge data, we only performed the validation for the year of 2018. However, this one year of hourly data does not affect our evaluation results. First, we focused mainly on the IMERG performance in describing precipitation occurrence and amount on an hourly basis. Second, each precipitation intensity level had a sufficient number of rainfall events which could be used for evaluation. Third, the study area also experienced tropical storms during the year of 2018, such as typhoon Ewiniar in June and typhoon Mangkhut in September, which provided an opportunity to evaluate large high-intensity precipitation. Therefore, we consider our results to be robust and also reliable for other years.

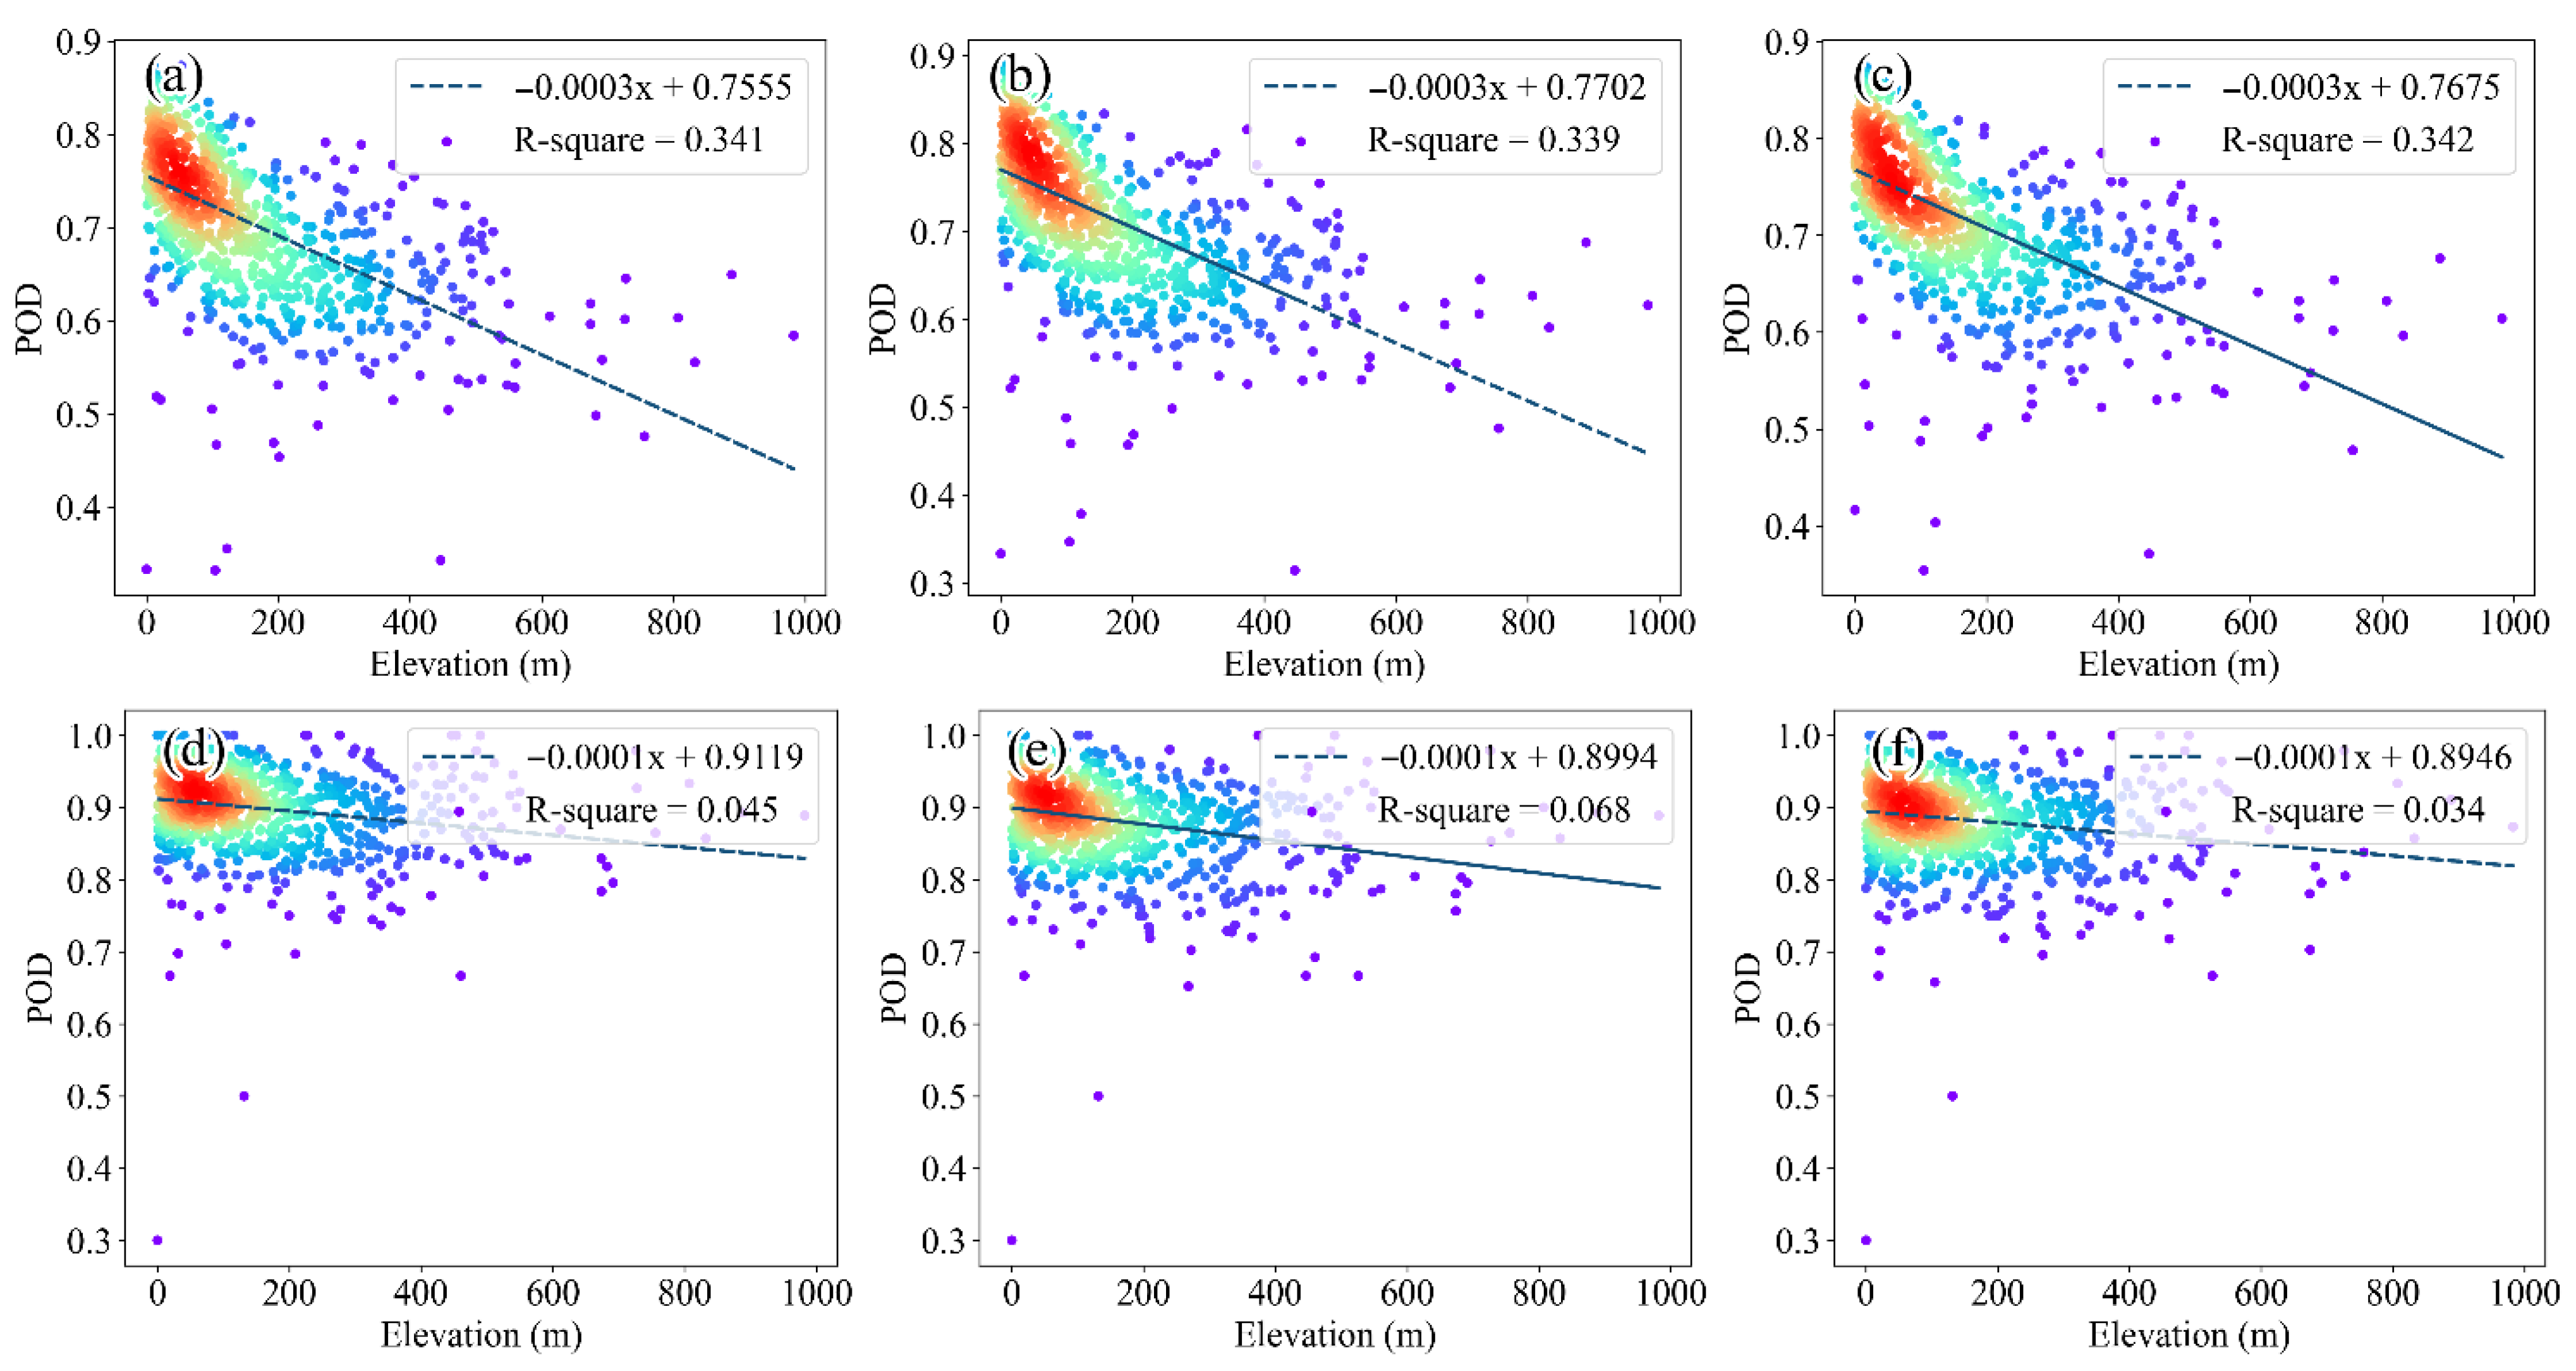
5.3. Elevation Effects on IMERG Detection Capability

The detection performance of IMERG is generally better along the southeast coast and weaker in the northern mountains, which shows some resemblances to the distribution of regional elevation. Therefore, the changes in the metrics with elevation was explored at different temporal scales (Figures S12 and S13). Among the metrics, only P O D showed a decreasing tendency with increasing elevation on an hourly scale. The further analysis in different seasons showed that the negative effect of elevation on the IMERG P O D was only significant in summer (Figure 10) and not in any other season (Figures S14–S16). This suggested that the influence of topography on IMERG’s detection capability was mainly reflected by the capture of sub-daily precipitation events in summer. The reason for this may be that the abundant moisture from the south in summer tends to rise and form orographic precipitation at high elevations [89]. This mechanism usually generates precipitation at lower levels and does not significantly increase the ice content aloft or reduce cloud top temperatures [90]. Thus, it is difficult for PMW and IR to detect such small-scale, short-duration, and often less intense types of precipitation [91], leading to a drop in IMERG hit rates.

5.4. Improvement for IMERG

The evaluation of this study indicates that there is still much room for improvement in the performance of IMERG for the southeast coast of China. The most obvious shortcoming is the overestimation of weak precipitation and the underestimation of heavy precipitation, especially at sub-daily scales. Although this deficiency has been noted in previous studies [39,92,93], it is particularly evident in this coastal urban region. This issue may be addressed by segmental correction, as proposed by Yu et al. [46], by building separate correction models to adjust precipitation estimates for different intensities. Since the errors of IMERG for different precipitation intensities vary in different regions, this study suggests that it is necessary to design a spatial distribution map of the calibration model parameters to localize the correction algorithm, which can improve the IMERG’s ability to detect regional precipitation (especially high-intensity precipitation) and to optimize its application in operations such as rainstorm warning, flood prevention and urban management in coastal areas.
Furthermore, contrary to expectations, the performance of the GPCC-calibrated IMERG FR has not significantly improved in the coastal region compared to the near-real-time products, IMERG ER and IMERG LR. This may stem from the limited number of GPCC stations (19 stations in the region), which do not represent well, the spatial variability of precipitation across the region [94]. Moreover, the GPCC data used for product adjustments are monthly records, which may not help much in improving performance at daily and sub-daily scales. Therefore, this study also suggests using GPCC daily observations, or even integrating locally available sub-daily measurements for calibration, to further enhance the product’s ability to observe precipitation over short periods in some key areas.

6. Conclusions

Precipitation is a key factor linking atmospheric and terrestrial processes. It is important to obtain accurate information for precipitation distribution and variability, especially for urban areas that are affected more significantly by precipitation-related disasters. The southeast coastal region of China is a typical coastal urban agglomeration, which is economically active and densely populated. Frequent strong convective weather events, such as typhoons and floods, plague the region, so timely and reliable precipitation information is very important. In recent years, various SPPs have been developed to provide wide-range and continuous precipitation estimates. As a high-quality precipitation dataset with fine spatial and temporal resolution, IMERG has great potential for applications in urban rainstorm warning, disaster prevention, and health management. Therefore, it was necessary to evaluate the performance of IMERG in this coastal urban region.
With gauge observations from a local high-density network, this paper presents a comprehensive evaluation of the three runs of IMERG (IMERG ER, IMERG LR, and IMERG FR). The evaluation was conducted at multiple temporal (hourly and daily) and spatial (regional and grid) scales in terms of estimation accuracy and detection ability. The conclusions are as follows.
(1)
All three IMERG products severely overestimate weak precipitation and underestimate high-intensity precipitation, which somehow leads to the better estimation of moderate-intensity and relatively heavy precipitation at sub-daily and daily scales, respectively.
(2)
Among the three IMERG runs, IMERG FR has the best performance, but is not that different to IMERG ER and IMERG LR.
(3)
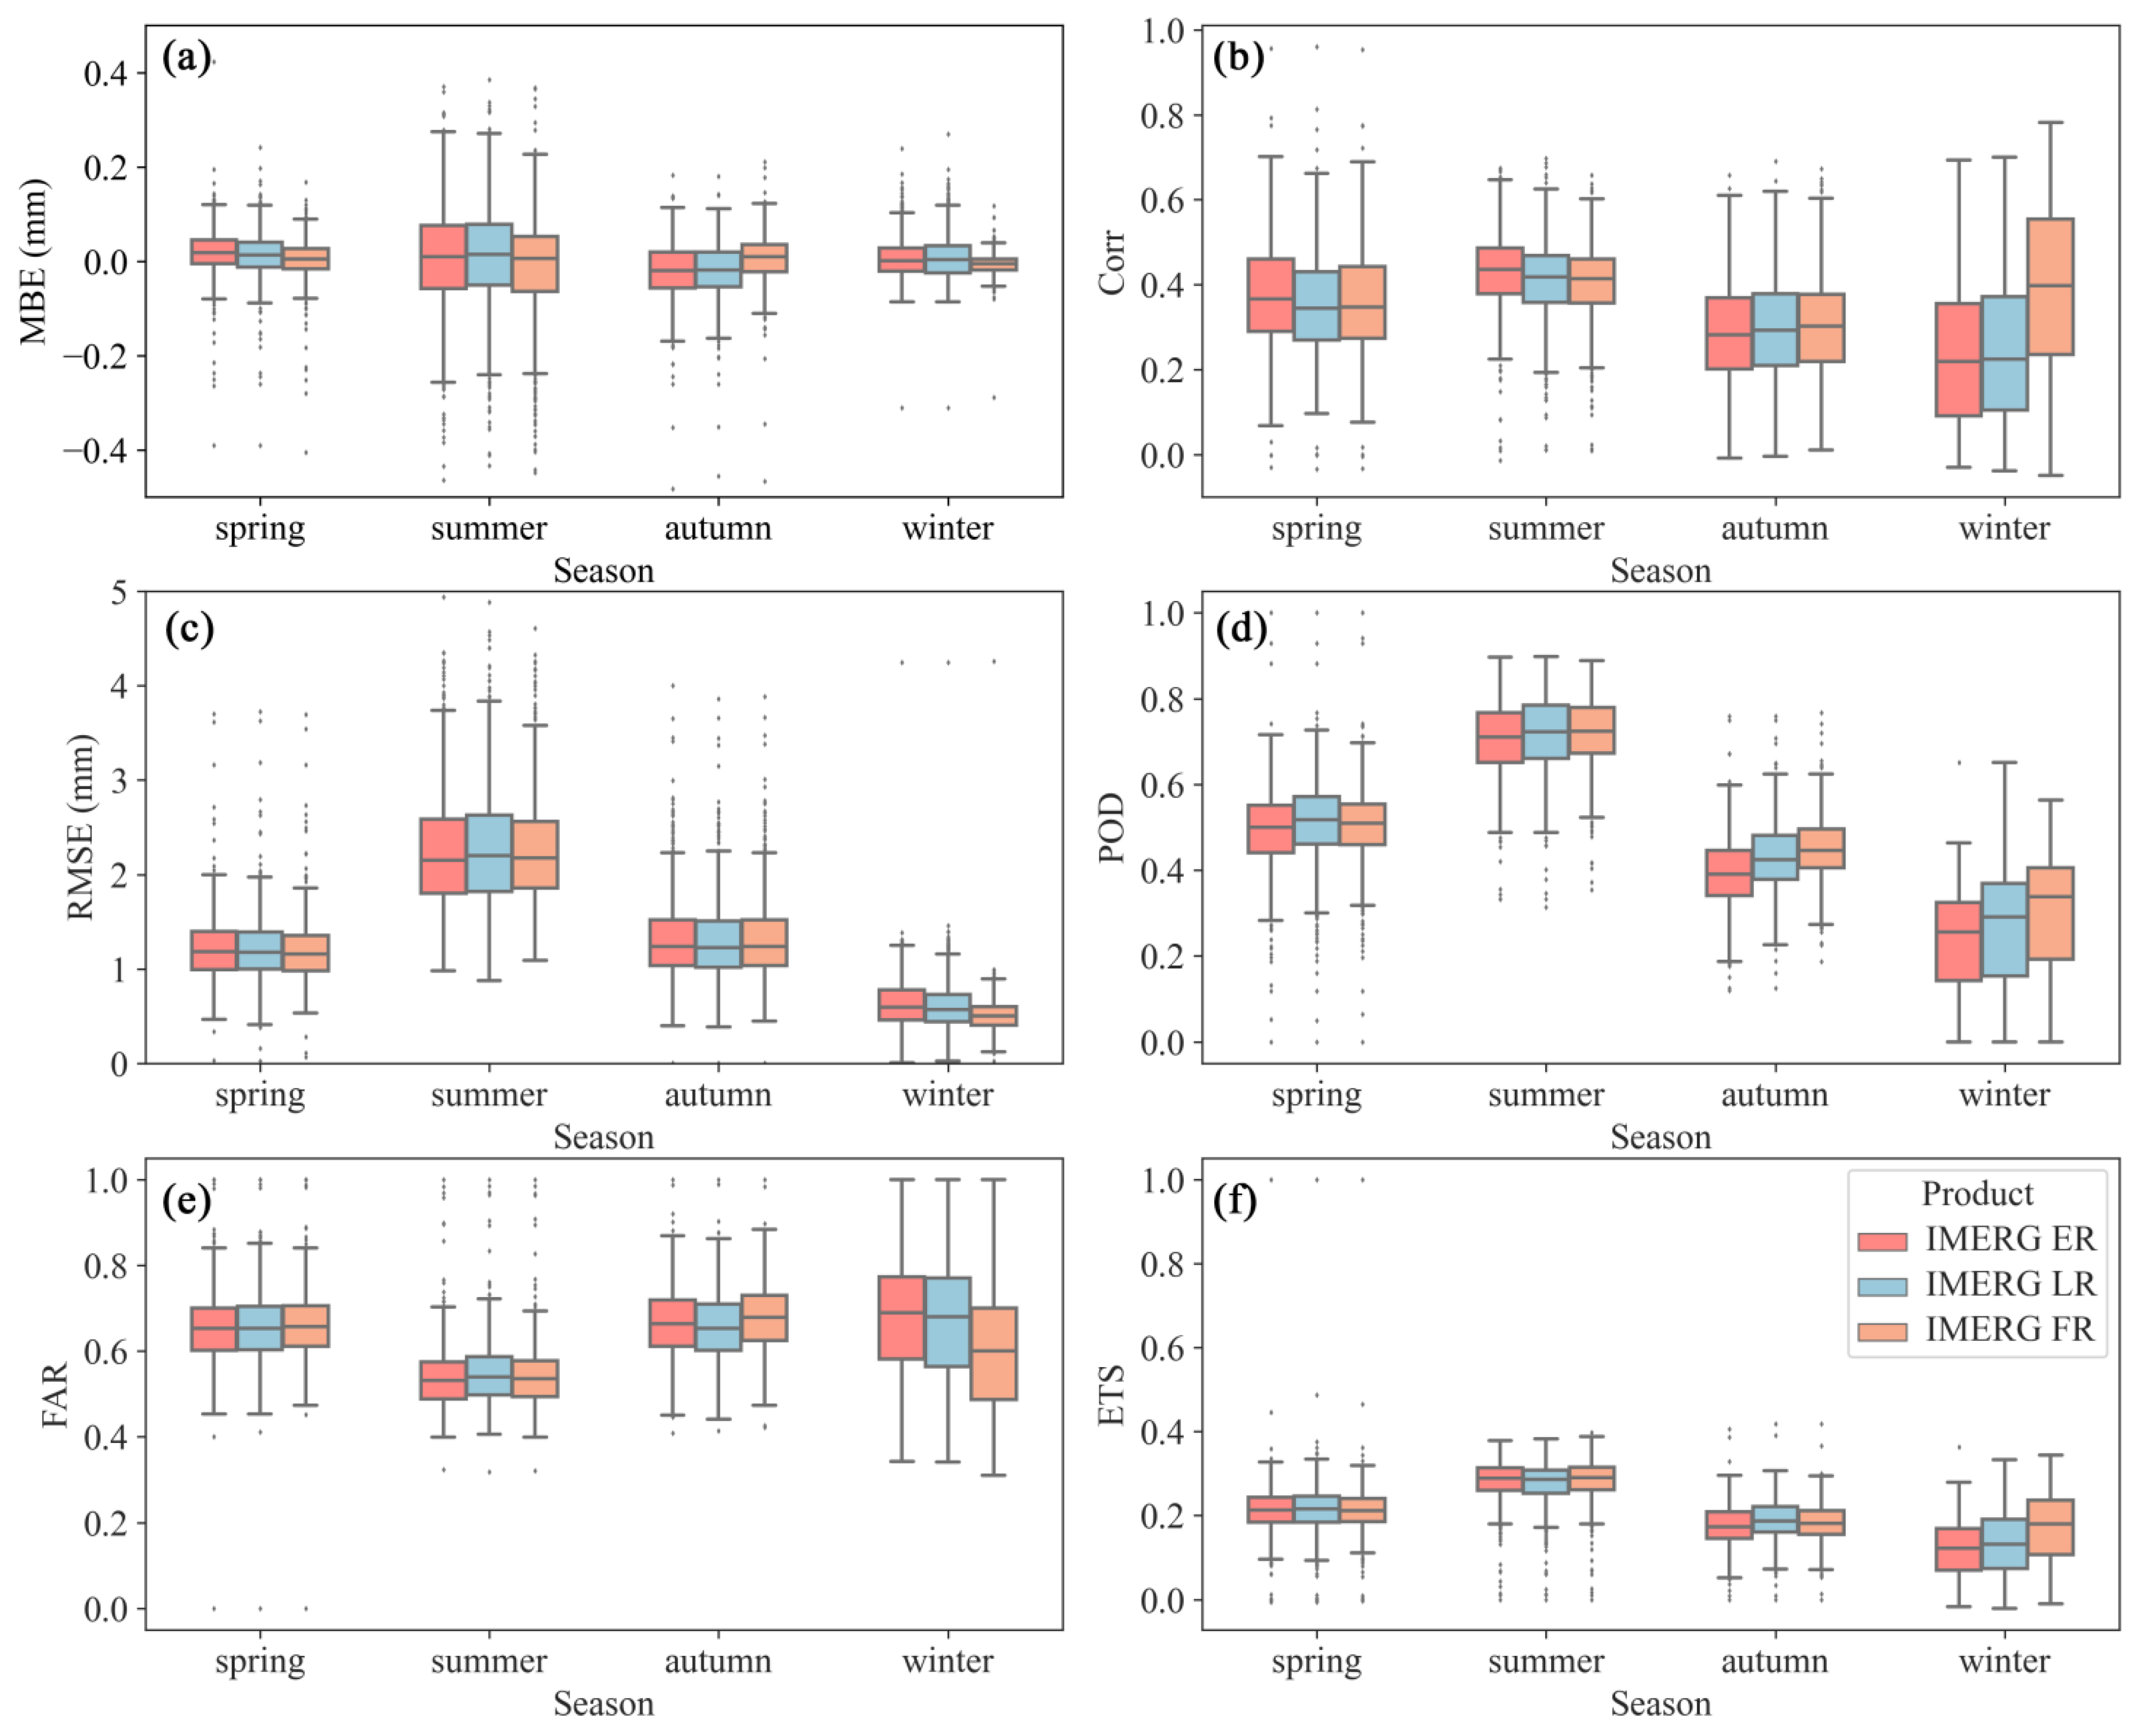
In different seasons, IMERG performances, in order of best to worst, are found in summer, spring, autumn and winter. Compared to IMERG ER and IMERG LR, the calibrated IMERG FR exhibits a more consistent performance across seasons.
(4)
The estimation ability of IMERG is best in coastal urban areas in summer and northern forests in winter. Due to the year-round urban impact on precipitation variability, IMERG cannot detect urban precipitation occurrences well, which makes IMERG better at detecting precipitation on cultivated lands in summer and forests in winter.
(5)
Within the urban regions, IMERG performs better in areas with lower urbanization levels.
(6)
Elevation has a significant negative effect on the ability of IMERG to capture summer precipitation occurrences.
In summary, the detection capability of IMERG needs to be greatly improved for the southeast coast of China. The current IMERG version is not recommended for use in sub-daily-scale urban research within the study area, such is the urban effect on precipitation and the urban weather nowcast. Future improvements could involve a regionalized segmental correction to the satellite estimates based on precipitation intensity. Besides, for the research-level IMERG FR, an attempt could be made to adjust the SPP estimates with daily or sub-daily observations to obtain more accurate local short-term precipitation information. This evaluation provides a helpful reference for the application of IMERG products in coastal urban areas.

Supplementary Materials

The following supporting information can be downloaded at: https://www.mdpi.com/article/10.3390/rs14194947/s1.

Funding

This work was supported by the National Natural Science Foundation of China (grant no. 41971312, 41890854).

Data Availability Statement

The rain gauge observations were provided by the Meteorological Unified Service Interface Community (MUSIC). The IMERG and GlobeLand30 datasets are available via the respective websites of the dataset producers.

Acknowledgments

Special thanks are given to the China Meteorological Administration for providing the precipitation gauge data. The authors would also like to thank the developers of the SPP products for making the data freely available to the public.

Conflicts of Interest

The authors declare no conflict of interest.

References

  1. Brocca, L.; Pellarin, T.; Crow, W.T.; Ciabatta, L.; Massari, C.; Ryu, D.; Su, C.; Rüdiger, C.; Kerr, Y. Rainfall estimation by inverting SMOS soil moisture estimates: A comparison of different methods over Australia. J. Geophys. Res. Atmos. 2016, 121, 12062–12079. [Google Scholar] [CrossRef]
  2. Maggioni, V.; Massari, C. On the performance of satellite precipitation products in riverine flood modeling: A review. J. Hydrol. 2018, 558, 214–224. [Google Scholar] [CrossRef]
  3. Zhang, Y.; Hong, Y.; Wang, X.; Gourley, J.J.; Xue, X.; Saharia, M.; Ni, G.; Wang, G.; Huang, Y.; Chen, S.; et al. Hydrometeorological analysis and remote sensing of extremes: Was the July 2012 Beijing flood event detectable and predictable by global satellite observing and global weather modeling systems? J. Hydrometeorol. 2015, 16, 381–395. [Google Scholar] [CrossRef]
  4. Bárdossy, A.; Pegram, G. Interpolation of precipitation under topographic influence at different time scales. Water Resour. Res. 2013, 49, 4545–4565. [Google Scholar] [CrossRef]
  5. Guo, H.; Chen, S.; Bao, A.; Behrangi, A.; Hong, Y.; Ndayisaba, F.; Hu, J.; Stepanian, P.M. Early assessment of Integrated Multi-satellite Retrievals for Global Precipitation Measurement over China. Atmos. Res. 2016, 176, 121–133. [Google Scholar] [CrossRef]
  6. Terink, W.; Leijnse, H.; van den Eertwegh, G.; Uijlenhoet, R. Spatial resolutions in areal rainfall estimation and their impact on hydrological simulations of a lowland catchment. J. Hydrol. 2018, 563, 319–335. [Google Scholar] [CrossRef]
  7. Kucera, P.A.; Ebert, E.E.; Turk, F.J.; Levizzani, V.; Kirschbaum, D.; Tapiador, F.J.; Loew, A.; Borsche, M. Precipitation from space: Advancing earth system science. Bull. Am. Meteorol. Soc. 2013, 94, 365–375. [Google Scholar] [CrossRef]
  8. Fallah, A.; Sungmin, O.; Reza, G.; Peter, R. Evaluation of precipitation datasets against local observations in southwestern Iran. Int. J. Climatol. 2020, 40, 4102–4116. [Google Scholar] [CrossRef] [Green Version]
  9. Rozante, J.R.; Vila, D.A.; Chiquetto, J.B.; de Fernandes, A.A.; Alvim, D.S. Evaluation of TRMM/GPM blended daily products over Brazil. Remote Sens. 2018, 10, 882. [Google Scholar] [CrossRef] [Green Version]
  10. Kidd, C.; Becker, A.; Huffman, G.J.; Muller, C.L.; Joe, P.; Skofronick-Jackson, G.; Kirschbaum, D.B. So, how much of the Earth’s surface is covered by rain gauges? Bull. Am. Meteorol. Soc. 2017, 98, 69–78. [Google Scholar] [CrossRef]
  11. Kidd, C.; Bauer, P.; Turk, J.; Huffman, G.J.; Joyce, R.; Hsu, K.L.; Braithwaite, D. Intercomparison of high-resolution precipitation products over Northwest Europe. J. Hydrometeorol. 2012, 13, 67–83. [Google Scholar] [CrossRef] [Green Version]
  12. Wolff, D.B.; Fisher, B.L. Comparisons of instantaneous TRMM ground validation and sattellite rain-rate estimates at different spatial scales. J. Appl. Meteorol. Climatol. 2008, 47, 2215–2237. [Google Scholar] [CrossRef]
  13. Yu, C.; Hu, D.; Liu, M.; Wang, S.; Di, Y. Spatio-temporal accuracy evaluation of three high-resolution satellite precipitation products in China area. Atmos. Res. 2020, 241, 104952. [Google Scholar] [CrossRef]
  14. Zhang, L.; Li, X.; Cao, Y.; Nan, Z.; Wang, W.; Ge, Y.; Wang, P.; Yu, W. Evaluation and integration of the top-down and bottom-up satellite precipitation products over mainland China. J. Hydrol. 2020, 581, 124456. [Google Scholar] [CrossRef]
  15. Arkin, P.A.; Meisner, B.N. The Relationship between Large-Scale Convective Rainfall and Cold Cloud over the Western Hemisphere during 1982-84. Mon. Weather Rev. 1987, 115, 51–74. [Google Scholar] [CrossRef]
  16. Ba, M.B.; Gruber, A. GOES Multispectral Rainfall Algorithm (GMSRA). J. Appl. Meteorol. Climatol. 2001, 40, 1500–1514. [Google Scholar] [CrossRef]
  17. Griffith, C.G.; Woodley, W.L.; Pamela, G.G.; Martin, D.W.; Stout, J.; Sikdar, D.N. Rain Estimation from Geosynchronous Satellite Imagery—Visible and Infrared Studies. Mon. Weather Rev. 1978, 106, 1153–1171. [Google Scholar] [CrossRef]
  18. Xie, P.; Arkin, P.A. Global Precipitation: A 17-Year Monthly Analysis Based on Gauge Observations, Satellite Estimates, and Numerical Model Outputs. Bull. Am. Meteorol. Soc. 1997, 78, 2539–2558. [Google Scholar] [CrossRef]
  19. Ferraro, R.R. Special sensor microwave imager derived global rainfall estimates for climatological applications. J. Geophys. Res. Atmos. 1997, 102, 16715–16735. [Google Scholar] [CrossRef]
  20. Iguchi, T.; Kozu, T.; Meneghini, R.; Awaka, J.; Okamoto, K. Rain-Profiling Algorithm for the TRMM Precipitation Radar. J. Appl. Meteorol. Climatol. 2000, 39, 2038–2052. [Google Scholar] [CrossRef]
  21. Kummerow, C.; Hong, Y.; Olson, W.S.; Yang, S.; Adler, R.F.; McCollum, J.; Ferraro, R.; Petty, G.; Shin, D.B.; Wilheit, T.T. The evolution of the Goddard profiling algorithm (GPROF) for rainfall estimation from passive microwave sensors. J. Appl. Meteorol. 2001, 40, 1801–1820. [Google Scholar] [CrossRef]
  22. Joyce, R.J.; Janowiak, J.E.; Arkin, P.A.; Xie, P. CMORPH: A Method that Produces Global Precipitation Estimates from Passive Microwave and Infrared Data at High Spatial and Temporal Resolution. J. Hydrometeorol. 2004, 5, 487–503. [Google Scholar] [CrossRef]
  23. Huffman, G.; Bolvin, D.; Nelkin, E.; Wolff, D.; Adler, R.F.; Gu, G.; Hong, Y.; Bowman, K.; Stocker, E. The TRMM Multisatellite Precipitation Analysis (TMPA): Quasi-Global, Multiyear, Combined-Sensor Precipitation Estimates at Fine Scales. J. Hydrometeorol. 2007, 8, 38–56. [Google Scholar] [CrossRef]
  24. Kubota, T.; Shige, S.; Hashizume, H.; Aonashi, K.; Takahashi, N.; Seto, S.; Hirose, M.; Takayabu, Y.N.; Ushio, T.; Nakagawa, K.; et al. Global Precipitation Map Using Satellite-Borne Microwave Radiometers by the GSMaP Project: Production and Validation. IEEE Trans. Geosci. Remote Sens. 2007, 45, 2259–2275. [Google Scholar] [CrossRef]
  25. Huffman, G.J.; Bolvin, D.T.; Braithwaite, D.; Hsu, K.; Joyce, R.; Kidd, C.; Nelkin, E.J.; Sorooshian, S.; Tan, J.; Xie, P. NASA Global Precipitation Measurement (GPM) Integrated Multi-Satellite Retrievals for GPM (IMERG). In Algorithm Theoretical Basis Document (ATBD) Version 06; NASA: Greenbelt, MD, USA, 2020. Available online: https//gpm.nasa.gov/sites/default/files/2020-05/IMERG_ATBD_V06.3.pdf (accessed on 21 September 2022).
  26. Sahoo, A.K.; Sheffield, J.; Pan, M.; Wood, E.F. Evaluation of the Tropical Rainfall Measuring Mission Multi-Satellite Precipitation Analysis (TMPA) for assessment of large-scale meteorological drought. Remote Sens. Environ. 2015, 159, 181–193. [Google Scholar] [CrossRef]
  27. Xu, R.; Tian, F.; Yang, L.; Hu, H.; Lu, H.; Hou, A. Ground validation of GPM IMERG and trmm 3B42V7 rainfall products over Southern Tibetan plateau based on a high-density rain gauge network. J. Geophys. Res. Atmos. 2017, 122, 910–924. [Google Scholar] [CrossRef]
  28. Hou, A.Y.; Kakar, R.K.; Neeck, S.; Azarbarzin, A.A.; Kummerow, C.D.; Kojima, M.; Oki, R.; Nakamura, K.; Iguchi, T. The global precipitation measurement mission. Bull. Am. Meteorol. Soc. 2014, 95, 701–722. [Google Scholar] [CrossRef]
  29. Tang, G.; Zeng, Z.; Long, D.; Guo, X.; Yong, B.; Zhang, W.; Hong, Y. Statistical and hydrological comparisons between TRMM and GPM Level-3 products over a midlatitude Basin: Is day-1 IMERG a good successor for TMPA 3B42V7? J. Hydrometeorol. 2016, 17, 121–137. [Google Scholar] [CrossRef]
  30. Wang, Z.; Zhong, R.; Lai, C.; Chen, J. Evaluation of the GPM IMERG satellite-based precipitation products and the hydrological utility. Atmos. Res. 2017, 196, 151–163. [Google Scholar] [CrossRef]
  31. Huang, C.; Hu, J.; Chen, S.; Zhang, A.; Liang, Z.; Tong, X.; Xiao, L.; Min, C.; Zhang, Z. How well can IMERG products capture typhoon extreme precipitation events over southern China? Remote Sens. 2019, 11, 70. [Google Scholar] [CrossRef]
  32. Tang, G.; Clark, M.P.; Papalexiou, S.M.; Ma, Z.; Hong, Y. Have satellite precipitation products improved over last two decades? A comprehensive comparison of GPM IMERG with nine satellite and reanalysis datasets. Remote Sens. Environ. 2020, 240, 111697. [Google Scholar] [CrossRef]
  33. Gebregiorgis, A.S.; Kirstetter, P.E.; Hong, Y.E.; Gourley, J.J.; Huffman, G.J.; Petersen, W.A.; Xue, X.; Schwaller, M.R. To What Extent is the Day 1 GPM IMERG Satellite Precipitation Estimate Improved as Compared to TRMM TMPA-RT? J. Geophys. Res. Atmos. 2018, 123, 1694–1707. [Google Scholar] [CrossRef]
  34. Wang, J.; Petersen, W.A.; Wolff, D.B. Validation of satellite-based precipitation products from TRMM to GPM. Remote Sens. 2021, 13, 745. [Google Scholar] [CrossRef]
  35. Singh, K.A.; Tripathi, J.N.; Singh, K.K.; Singh, V.; Sateesh, M. Comparison of different satellite-derived rainfall products with IMD gridded data over Indian meteorological subdivisions during Indian Summer Monsoon (ISM) 2016 at weekly temporal resolution. J. Hydrol. 2019, 575, 1371–1379. [Google Scholar] [CrossRef]
  36. Meng, C.; Mo, X.; Liu, S.; Hu, S. Extensive evaluation of IMERG precipitation for both liquid and solid in Yellow River source region. Atmos. Res. 2021, 256, 105570. [Google Scholar] [CrossRef]
  37. Li, X.; Chen, Y.; Wang, H.; Zhang, Y. Assessment of GPM IMERG and radar quantitative precipitation estimation (QPE) products using dense rain gauge observations in the Guangdong-Hong Kong-Macao Greater Bay Area, China. Atmos. Res. 2020, 236, 104834. [Google Scholar] [CrossRef]
  38. Xu, F.; Guo, B.; Ye, B.; Ye, Q.; Chen, H.; Ju, X.; Guo, J.; Wang, Z. Systematical Evaluation of GPM IMERG and TRMM 3B42V7 Precipitation Products in the Huang-Huai-Hai Plain, China. Remote Sens. 2019, 11, 697. [Google Scholar] [CrossRef] [Green Version]
  39. Wang, S.; Liu, J.; Wang, J.; Qiao, X.; Zhang, J. Evaluation of GPM IMERG V05B and TRMM 3B42V7 Precipitation products over high mountainous tributaries in Lhasa with dense rain gauges. Remote Sens. 2019, 11, 80. [Google Scholar] [CrossRef] [Green Version]
  40. Asong, Z.E.; Razavi, S.; Wheater, H.S.; Wong, J.S. Evaluation of Integrated Multisatellite Retrievals for GPM (IMERG) over Southern Canada against Ground Precipitation Observations: A Preliminary Assessment. J. Hydrometeorol. 2017, 18, 1033–1050. [Google Scholar] [CrossRef]
  41. Wu, L.; Xu, Y.; Wang, S. Comparison of TMPA-3B42RT legacy product and the equivalent IMERG products over Mainland China. Remote Sens. 2018, 10, 778. [Google Scholar] [CrossRef]
  42. Fang, J.; Yang, W.; Luan, Y.; Du, J.; Lin, A.; Zhao, L. Evaluation of the TRMM 3B42 and GPM IMERG products for extreme precipitation analysis over China. Atmos. Res. 2019, 223, 24–38. [Google Scholar] [CrossRef]
  43. Tan, J.; Petersen, W.A.; Tokay, A. A novel approach to identify sources of errors in IMERG for GPM ground validation. J. Hydrometeorol. 2016, 17, 2477–2491. [Google Scholar] [CrossRef]
  44. Yuan, F.; Zhang, L.; Win, K.W.W.; Ren, L.; Zhao, C.; Zhu, Y.; Jiang, S.; Liu, Y. Assessment of GPM and TRMM multi-satellite precipitation products in streamflow simulations in a data sparse mountainous watershed in Myanmar. Remote Sens. 2017, 9, 302. [Google Scholar] [CrossRef] [Green Version]
  45. Li, Z.; Tang, G.; Kirstetter, P.; Gao, S.; Li, J.L.F.; Wen, Y.; Hong, Y. Evaluation of GPM IMERG and its constellations in extreme events over the conterminous united states. J. Hydrol. 2022, 606, 127357. [Google Scholar] [CrossRef]
  46. Yu, C.; Hu, D.; Di, Y.; Wang, Y. Performance evaluation of IMERG precipitation products during typhoon Lekima (2019). J. Hydrol. 2021, 597, 126307. [Google Scholar] [CrossRef]
  47. Amjad, M.; Yilmaz, M.T.; Yucel, I.; Yilmaz, K.K. Performance evaluation of satellite- and model-based precipitation products over varying climate and complex topography. J. Hydrol. 2020, 584, 124707. [Google Scholar] [CrossRef]
  48. Yang, M.; Liu, G.; Chen, T.; Chen, Y.; Xia, C. Evaluation of GPM IMERG precipitation products with the point rain gauge records over Sichuan, China. Atmos. Res. 2020, 246, 105101. [Google Scholar] [CrossRef]
  49. Nascimento, J.G.; Althoff, D.; Bazame, H.C.; Neale, C.M.U.; Duarte, S.N.; Ruhoff, A.L.; Gonçalves, I.Z. Evaluating the latest imerg products in a subtropical climate: The case of paraná state, brazil. Remote Sens. 2021, 13, 906. [Google Scholar] [CrossRef]
  50. Caracciolo, D.; Francipane, A.; Viola, F.; Noto, L.V.; Deidda, R. Performances of GPM satellite precipitation over the two major Mediterranean islands. Atmos. Res. 2018, 213, 309–322. [Google Scholar] [CrossRef] [Green Version]
  51. Derin, Y.; Kirstetter, P.-E.; Gourley, J.J. Evaluation of IMERG Satellite Precipitation over the Land–Coast–Ocean Continuum. Part I: Detection. J. Hydrometeorol. 2021, 22, 2843–2859. [Google Scholar] [CrossRef]
  52. Derin, Y.; Kirstetter, P.-E.; Brauer, N.; Gourley, J.J.; Wang, J. Evaluation of IMERG Satellite Precipitation over the Land–Coast–Ocean Continuum. Part II: Quantification. J. Hydrometeorol. 2022, 23, 1297–1314. [Google Scholar] [CrossRef]
  53. Beck, H.E.; Pan, M.; Roy, T.; Weedon, G.P.; Pappenberger, F.; Van Dijk, A.I.J.M.; Huffman, G.J.; Adler, R.F.; Wood, E.F. Daily evaluation of 26 precipitation datasets using Stage-IV gauge-radar data for the CONUS. Hydrol. Earth Syst. Sci. 2019, 23, 207–224. [Google Scholar] [CrossRef] [Green Version]
  54. Huang, W.R.; Chang, Y.H.; Liu, P.Y. Assessment of IMERG precipitation over Taiwan at multiple timescales. Atmos. Res. 2018, 214, 239–249. [Google Scholar] [CrossRef]
  55. Navarro, A.; García-Ortega, E.; Merino, A.; Sánchez, J.L.; Kummerow, C.; Tapiador, F.J. Assessment of IMERG precipitation estimates over Europe. Remote Sens. 2019, 11, 2470. [Google Scholar] [CrossRef] [Green Version]
  56. Shen, W.; Li, M.; Huang, C.; He, T.; Tao, X.; Wei, A. Local land surface temperature change induced by afforestation based on satellite observations in Guangdong plantation forests in China. Agric. For. Meteorol. 2019, 276, 107641. [Google Scholar] [CrossRef]
  57. Xia, Q.; Zhang, W.; Chen, H.; Lee, W.C.; Han, L.; Ma, Y.; Liu, X. Quantification of precipitation using polarimetric radar measurements during several typhoon events in Southern China. Remote Sens. 2020, 12, 58. [Google Scholar] [CrossRef]
  58. Liang, Y.; Jiang, C.; Ma, L.; Liu, L.; Chen, W.; Liu, L. Government support, social capital and adaptation to urban flooding by residents in the Pearl River Delta area, China. Habitat Int. 2017, 59, 21–31. [Google Scholar] [CrossRef] [Green Version]
  59. Chen, J.; Ban, Y.; Li, S. Open access to Earth land-cover map. Nature 2014, 514, 434. [Google Scholar] [CrossRef] [Green Version]
  60. Chen, J.; Chen, J.; Liao, A. Remote Sensing Mapping of Global Land Cover; Science Press: Beijing, China, 2016. [Google Scholar]
  61. Tang, G.; Behrangi, A.; Long, D.; Li, C.; Hong, Y. Accounting for spatiotemporal errors of gauges: A critical step to evaluate gridded precipitation products. J. Hydrol. 2018, 559, 294–306. [Google Scholar] [CrossRef] [Green Version]
  62. Sharifi, E.; Steinacker, R.; Saghafian, B. Assessment of GPM-IMERG and other precipitation products against gauge data under different topographic and climatic conditions in Iran: Preliminary results. Remote Sens. 2016, 8, 135. [Google Scholar] [CrossRef]
  63. Brown, B.; Atger, F.; Brooks, H.; Casati, B.; Damrath, U.; Ebert, B.; Ghelli, A.; Nurmi, P.; Stephenson, D.; Wilson, C.; et al. Recommendations for the Verification and Intercomparison of QPFs from Operational NWP Models; World Meteorological Organization: Geneva, Switzerland, 2004. [Google Scholar]
  64. Guo, H.; Bao, A.; Chen, T.; Zheng, G.; Wang, Y.; Jiang, L.; De Maeyer, P. Assessment of CMIP6 in simulating precipitation over arid Central Asia. Atmos. Res. 2021, 252, 105451. [Google Scholar] [CrossRef]
  65. Yumnam, K.; Kumar Guntu, R.; Rathinasamy, M.; Agarwal, A. Quantile-based Bayesian Model Averaging approach towards merging of precipitation products. J. Hydrol. 2022, 604, 127206. [Google Scholar] [CrossRef]
  66. Zhang, Y.; Wu, C.; Yeh, P.J.F.; Li, J.; Hu, B.X.; Feng, P.; Jun, C. Evaluation and comparison of precipitation estimates and hydrologic utility of CHIRPS, TRMM 3B42 V7 and PERSIANN-CDR products in various climate regimes. Atmos. Res. 2022, 265, 105881. [Google Scholar] [CrossRef]
  67. Yuan, X.; Yang, K.; Lu, H.; He, J.; Sun, J.; Wang, Y. Characterizing the features of precipitation for the Tibetan Plateau among four gridded datasets: Detection accuracy and spatio-temporal variabilities. Atmos. Res. 2021, 264, 105875. [Google Scholar] [CrossRef]
  68. Tan, M.L.; Ibrahim, A.L.; Duan, Z.; Cracknell, A.P.; Chaplot, V. Evaluation of six high-resolution satellite and ground-based precipitation products over Malaysia. Remote Sens. 2015, 7, 1504–1528. [Google Scholar] [CrossRef] [Green Version]
  69. Chen, F.; Li, X. Evaluation of IMERG and TRMM 3B43 monthly precipitation products over mainland China. Remote Sens. 2016, 8, 472. [Google Scholar] [CrossRef] [Green Version]
  70. Qi, W.; Yong, B.; Gourley, J.J. Monitoring the super typhoon lekima by GPM-based near-real-time satellite precipitation estimates. J. Hydrol. 2021, 603, 126968. [Google Scholar] [CrossRef]
  71. Wang, D.; Wang, X.; Liu, L.; Wang, D.; Huang, H.; Pan, C. Evaluation of TMPA 3B42V7, GPM IMERG and CMPA precipitation estimates in Guangdong Province, China. Int. J. Climatol. 2019, 39, 738–755. [Google Scholar] [CrossRef]
  72. Peng, F.; Zhao, S.; Chen, C.; Cong, D.; Wang, Y. Evaluation and comparison of the precipitation detection ability of multiple satellite products in a typical agriculture area of China. Atmos. Res. 2020, 236, 104814. [Google Scholar] [CrossRef]
  73. Alsumaiti, T.S.; Hussein, K.; Ghebreyesus, D.T.; Sharif, H.O. Performance of the CMORPH and GPM IMERG products over the United Arab Emirates. Remote Sens. 2020, 12, 1426. [Google Scholar] [CrossRef]
  74. Ringerud, S.; Peters-Lidard, C.; Munchak, J.; You, Y. Applications of dynamic land surface information for passive microwave precipitation retrieval. J. Atmos. Ocean. Technol. 2021, 38, 167–180. [Google Scholar] [CrossRef]
  75. Kirstetter, P.E.; Karbalaee, N.; Hsu, K.; Hong, Y. Probabilistic precipitation rate estimates with space-based infrared sensors. Q. J. R. Meteorol. Soc. 2018, 144, 191–205. [Google Scholar] [CrossRef] [Green Version]
  76. Wang, N.Y.; Liu, C.; Ferraro, R.; Wolff, D.; Zipser, E.; Kummerow, C. TRMM 2A12 land precipitation product—Status and future plans. J. Meteorol. Soc. Jpn. 2009, 87, 237–253. [Google Scholar] [CrossRef] [Green Version]
  77. Kummerow, C.D. Introduction to Passive Microwave Retrieval Methods. In Advances in Global Change Research; Springer: Cham, Switzerland, 2020; Volume 67, pp. 123–140. ISBN 9783030245689. [Google Scholar]
  78. You, Y.; Petkovic, V.; Tan, J.; Kroodsma, R.; Berg, W.; Kidd, C.; Peters-Lidard, C. Evaluation of v05 precipitation estimates from gpm constellation radiometers using kupr as the reference. J. Hydrometeorol. 2020, 21, 705–728. [Google Scholar] [CrossRef]
  79. Lowry, W.P. Urban effects on precipitation amount. Prog. Phys. Geogr. Earth Environ. 1998, 22, 477–520. [Google Scholar] [CrossRef]
  80. Cotton, W.R.; Pielke, R.A.S. Human Impacts on Weather and Climate; Cambridge University Press: Cambridge, UK, 2007; ISBN 9780511808319. [Google Scholar]
  81. Shepherd, J.M. A review of current investigations of urban-induced rainfall and recommendations for the future. Earth Interact. 2005, 9, 1–27. [Google Scholar] [CrossRef] [Green Version]
  82. Wan, H.; Zhong, Z.; Yang, X.; Li, X. Ensembles to model the impact of urbanization for a summertime rainstorm process in Yangtze River Delta, China. Meteorol. Appl. 2015, 22, 105–112. [Google Scholar] [CrossRef]
  83. Tian, F.; Hou, S.; Yang, L.; Hu, H.; Hou, A. How does the evaluation of the GPM IMERG rainfall product depend on gauge density and rainfall intensity? J. Hydrometeorol. 2018, 19, 339–349. [Google Scholar] [CrossRef]
  84. Zandler, H.; Haag, I.; Samimi, C. Evaluation needs and temporal performance differences of gridded precipitation products in peripheral mountain regions. Sci. Rep. 2019, 9, 15118. [Google Scholar] [CrossRef] [Green Version]
  85. Li, X.; Chen, Y.; Deng, X.; Zhang, Y.; Chen, L. Evaluation and hydrological utility of the GPM IMERG precipitation products over the Xinfengjiang river reservoir basin, China. Remote Sens. 2021, 13, 866. [Google Scholar] [CrossRef]
  86. Zhang, A.; Xiao, L.; Min, C.; Chen, S.; Kulie, M.; Huang, C.; Liang, Z. Evaluation of latest GPM-Era high-resolution satellite precipitation products during the May 2017 Guangdong extreme rainfall event. Atmos. Res. 2019, 216, 76–85. [Google Scholar] [CrossRef]
  87. Prakash, S.; Mitra, A.K.; AghaKouchak, A.; Liu, Z.; Norouzi, H.; Pai, D.S. A preliminary assessment of GPM-based multi-satellite precipitation estimates over a monsoon dominated region. J. Hydrol. 2018, 556, 865–876. [Google Scholar] [CrossRef] [Green Version]
  88. Sui, X.; Li, Z.; Ma, Z.; Xu, J.; Zhu, S.; Liu, H. Ground validation and error sources identification for gpm imerg product over the southeast coastal regions of China. Remote Sens. 2020, 12, 154. [Google Scholar] [CrossRef]
  89. Tucker, D. Orographic Precipitation. In Encyclopedia of World Climatology; Oliver, J.E., Ed.; Springer: Dordrecht, The Netherlands, 2005; pp. 552–555. ISBN 978-1-4020-3266-0. [Google Scholar]
  90. Purnell, D.J.; Kirshbaum, D.J. Synoptic control over orographic precipitation distributions during the Olympics Mountains Experiment (OLYMPEX). Mon. Weather Rev. 2018, 146, 1023–1044. [Google Scholar] [CrossRef]
  91. Gadelha, A.N.; Coelho, V.H.R.; Xavier, A.C.; Barbosa, L.R.; Melo, D.C.D.; Xuan, Y.; Huffman, G.J.; Petersen, W.A.; Almeida, C.D.N. Grid box-level evaluation of IMERG over Brazil at various space and time scales. Atmos. Res. 2019, 218, 231–244. [Google Scholar] [CrossRef] [Green Version]
  92. Wang, X.; Ding, Y.; Zhao, C.; Wang, J. Similarities and improvements of GPM IMERG upon TRMM 3B42 precipitation product under complex topographic and climatic conditions over Hexi region, Northeastern Tibetan Plateau. Atmos. Res. 2019, 218, 347–363. [Google Scholar] [CrossRef]
  93. Anjum, M.N.; Ding, Y.; Shangguan, D.; Ahmad, I.; Ijaz, M.W.; Farid, H.U.; Yagoub, Y.E.; Zaman, M.; Adnan, M. Performance evaluation of latest integrated multi-satellite retrievals for Global Precipitation Measurement (IMERG) over the northern highlands of Pakistan. Atmos. Res. 2018, 205, 134–146. [Google Scholar] [CrossRef]
  94. Mahmoud, M.T.; Hamouda, M.A.; Mohamed, M.M. Spatiotemporal evaluation of the GPM satellite precipitation products over the United Arab Emirates. Atmos. Res. 2019, 219, 200–212. [Google Scholar] [CrossRef]
Figure 1. The (a) location, (b) topography and positions of the rain gauge stations, and (c) land cover of the study area.
Remotesensing 14 04947 g001
Figure 2. Comparison of estimates from IMERG ER (on (a) hourly and (d) daily scales), IMERG LR (on (b) hourly and (e) daily scales), IMERG FR (on (c) hourly and (f) daily scales) with gauge measurements. The blue lines in the figures are 1:1 lines and the red lines are the fitted trend lines.
Remotesensing 14 04947 g002
Figure 3. Variation of (a) M B E , (b) C o r r , (c) R M S E , (d) P O D , (e) F A R , and (f) E T S across different seasons on an hourly scale.
Remotesensing 14 04947 g003
Figure 4. Changes in (a) M B E , (b) C o r r , (c) R M S E , (d) P O D , (e) F A R , and (f) E T S for different precipitation intensity levels at hourly scale.
Remotesensing 14 04947 g004
Figure 5. Changes in (a) M B E , (b) C o r r , (c) R M S E , (d) P O D , (e) F A R , and (f) E T S for different precipitation intensity levels on a daily scale.
Remotesensing 14 04947 g005
Figure 6. Differences of (a) M B E , (b) C o r r , (c) r R M S E , (d) P O D , (e) F A R , and (f) E T S on cultivated lands, forests, and urban areas on an hourly scale.
Remotesensing 14 04947 g006
Figure 7. M B E (for IMERG (a) ER, (b) LR, (c) FR), C o r r (for IMERG (d) ER, (e) LR, (f) FR), R M S E (for IMERG (g) ER, (h) LR, (i) FR), P O D (for IMERG (j) ER, (k) LR, (l) FR), F A R (for IMERG (m) ER, (n) LR, (o) FR), and E T S (for IMERG (p) ER, (q) LR, (r) FR) of urban grids along with artificial surface area proportion on an hourly scale.
Remotesensing 14 04947 g007
Figure 8. Spatial distribution of evaluation metrics for IMERG ER ((a) M B E , (d) C o r r , (g) R M S E , (j) P O D , (m) F A R (p) E T S ), IMERG LR ((b) M B E , (e) C o r r , (h) R M S E , (k) P O D , (n) F A R (q) E T S ), and IMERG FR ((c) M B E , (f) C o r r , (i) R M S E , (l) P O D , (o) F A R (r) E T S ) on an hourly scale.
Remotesensing 14 04947 g008
Figure 9. Spatial distribution of C o r r of IMERG ER (in (a) summer and (d) winter), IMERG LR (in (b) summer and (e) winter), and IMERG FR (in (c) summer and (f) winter), as well as E T S of IMERG ER (in (g) summer and (j) winter), IMERG LR (in (h) summer and (k) winter), and IMERG FR (in (i) summer and (l) winter) on an hourly scale.
Remotesensing 14 04947 g009
Figure 10. Summer P O D for IMERG ER (on (a) hourly and (d) daily scales), IMERG LR (on (b) hourly and (e) daily scales), and IMERG FR (on (c) hourly and (f) daily scales) along with elevations.
Remotesensing 14 04947 g010
Table 1. Description of the quality control code.
Quality Control CodeDescriptionState
0Correct and usable dataValid
1Suspicious dataInvalid
2Wrong dataInvalid
3Revised dataValid
4Modified dataValid
5Default valueInvalid
6Default valueInvalid
7The station does not have observation taskInvalid
8Missing dataInvalid
9Data without quality controlInvalid
Publisher’s Note: MDPI stays neutral with regard to jurisdictional claims in published maps and institutional affiliations.

