Article

Investigation of Aerosol Types and Vertical Distributions Using Polarization Raman Lidar over Vipava Valley

1
School of Remote Sensing and Information Engineering, Wuhan University, Wuhan 430079, China
2
Center for Atmospheric Research, University of Nova Gorica, 5270 Nova Gorica, Slovenia
3
European National Meteorological Services, 1180 Brussels, Belgium
4
Aerosol d.o.o., 1000 Ljubljana, Slovenia
*
Author to whom correspondence should be addressed.
Remote Sens. 2022, 14(14), 3482; https://doi.org/10.3390/rs14143482
Submission received: 27 June 2022 / Revised: 17 July 2022 / Accepted: 18 July 2022 / Published: 20 July 2022

Abstract

:
Aerosol direct radiative forcing is strongly dependent on aerosol distributions and aerosol types. A detailed understanding of such information is still missing at the Alpine region, which currently undergoes amplified climate warming. Our goal was to study the vertical variability of aerosol types within and above the Vipava valley (45.87 ° N, 13.90 ° E, 125 m a.s.l.) to reveal the vertical impact of each particular aerosol type on this region, a representative complex terrain in the Alpine region which often suffers from air pollution in the wintertime. This investigation was performed using the entire dataset of a dual-wavelength polarization Raman lidar system, which covers 33 nights from September to December 2017. The lidar provides measurements from midnight to early morning (typically from 00:00 to 06:00 CET) to provide aerosol-type dependent properties, which include particle linear depolarization ratio, lidar ratio at 355 nm and the aerosol backscatter Ångström exponent between 355 nm and 1064 nm. These aerosol properties were compared with similar studies, and the aerosol types were identified by the measured aerosol optical properties. Primary anthropogenic aerosols within the valley are mainly emitted from two sources: individual domestic heating systems, which mostly use biomass fuel, and traffic emissions. Natural aerosols, such as mineral dust and sea salt, are mostly transported over large distances. A mixture of two or more aerosol types was generally found. The aerosol characterization and statistical properties of vertical aerosol distributions were performed up to 3 km.

1. Introduction

Atmospheric aerosols have a large impact on the Earth’s radiation budget and are thought to exert a indeterminate effect on climate [1]. The average temperature of the Alpine region, which is one of the Earth’s areas that are particularly affected by climate change, has risen by approximate +2.0 ° C, while the average increase in Europe is only about half as much, namely +1.2 ° C (https://www.vao.bayern.de/vao.htm, accessed on 26 June 2022). Comparatively severe warming is expected in the Alpine region, which will have an impact on the different parts of the Alpine environmental system where the atmosphere represents a complex system of interlinked processes. The cooling effect associated with anthropogenic aerosol is thought to partially mitigate greenhouse gas warming, but estimates of the radiative forcing pattern still remain complex and highly uncertain due to the large spatio-temporal variability of dust and their complex interation with atmospheric constituents, radiation and clouds [2,3]. There has been an increasing interest in the study of atmospheric aerosols given their confirmed impact, not only on human health, but also on the planetary radiation budget. Vertical distribution of atmospheric aerosol layers, especially that of smoke aerosols—black carbon (BC) and brown carbon (BrC)—as well as mineral dust with relative smaller single scattering albedo (SSA), significantly influence the direct radiative effect on the Earth’s climate by modifying the thermal structure, followed by feedbacks on Planetary Boundary Layer (PBL) dynamics [4,5]. Sea salt, non-absorption particles, play an significant role in cloud formation as an efficient cloud-condensation-nuclei [6]. The knowledge on aerosol distributions and properties therefore provides a highly important and also very different insight into many atmospheric processes. These atmospheric processes are a consequence of the aerosol properties, which in turn depend on aerosol origin and composition. It is indeed necessary to accurately picture and characterize the aerosol properties and distributions.
Aerosol properties related to their size and shape and their refractive index wavelength-dependence can be obtained using specialized lidar techniques [7,8,9]. The particle depolarization ratio (PDR), available from the measurement of different polarizations of the backscattered signal, is an important parameter in the investigation of aerosol shape and size [10]. The ratio differs considerably for spherical particles such as water droplets or smoke soot, and non-spherical particles such as ice crystals or mineral dust [7,11,12,13,14]. Backscatter Ångström exponent (BAE), available from a multi-wavelength lidar, is related to aerosol size distribution [9,15,16], while the lidar ratio (LR) between backscatter and extinction coefficients obtained by a Raman lidar system is related to aerosol size distribution and their refractive index [8,17,18,19,20]. In order to simultaneously provide all the above information on aerosols, which are necessary for distinguishing different aerosol types, a dedicated polarization Raman lidar for retrieval aerosol properties can be used.
The information along the vertical coordinate is even more important in areas characterized by complex orography, such as mountain environments and Alpine basin valleys, where the specific topographical and meteorological conditions pose additional challenges to the study of aerosol dispersion [21,22,23,24]. Unfortunately, obtaining this kind of information is often difficult and requires particular instruments or techniques; therefore, detailed knowledge about the aerosol vertical distribution is often limited to short, intensive campaigns [25,26], which are also needed for the validation of aerosol satellite datasets. In particular, the profiles of aerosol optical properties at 355 nm, obtained by ground-based lidar, become more useful after the Aeolus was successfully launched on 22 August 2018, which can directly retrieve the lidar ratio at 355 nm globally [27,28]. However, aerosol vertical information in terms of its properties and distributions is scarcely available, especially the datasets at 355 nm in mountainous regions.
As a part of Mediterranean region, Vipava valley is frequently affected by long range transport of Saharan dust from North Africa across the Mediterranean Sea [29,30,31,32,33,34]. Local emission of primary anthropogenic aerosols is characterized mainly by local biomass burning, especially in winter, and traffic emissions. Wood burning is the main fuel for heating in Vipava valley during the cold season. In the scope of this work, high spatial–temporal resolution profiles of backscattering coefficients, based on lidar measurements combined with in situ measurements at the town of Ajdovščina in the Vipava valley (45.93 ° N, 13.91 ° E), were acquired, aiming to reveal the vertical distribution of aerosol properties over the Vipava valley (a representative Alpine mountainous region in the Southwestern Slovenia) regarding different aerosol sources, including dust, sea salt and local biomass burning. The aim of the investigation of statistical properties of vertical aerosol distributions was to reveal the impact of each particular aerosol type on this region. Section 2 describes the experimental sites and data availability as well as the adopted aerosol typing methods. Section 3 provides the detailed investigations, which includes case studies of local emissions and statistical analysis of aerosol type distributions over this region. Finally, we discuss the findings in this work and draw a conclusions in Section 4.

2. Methodology

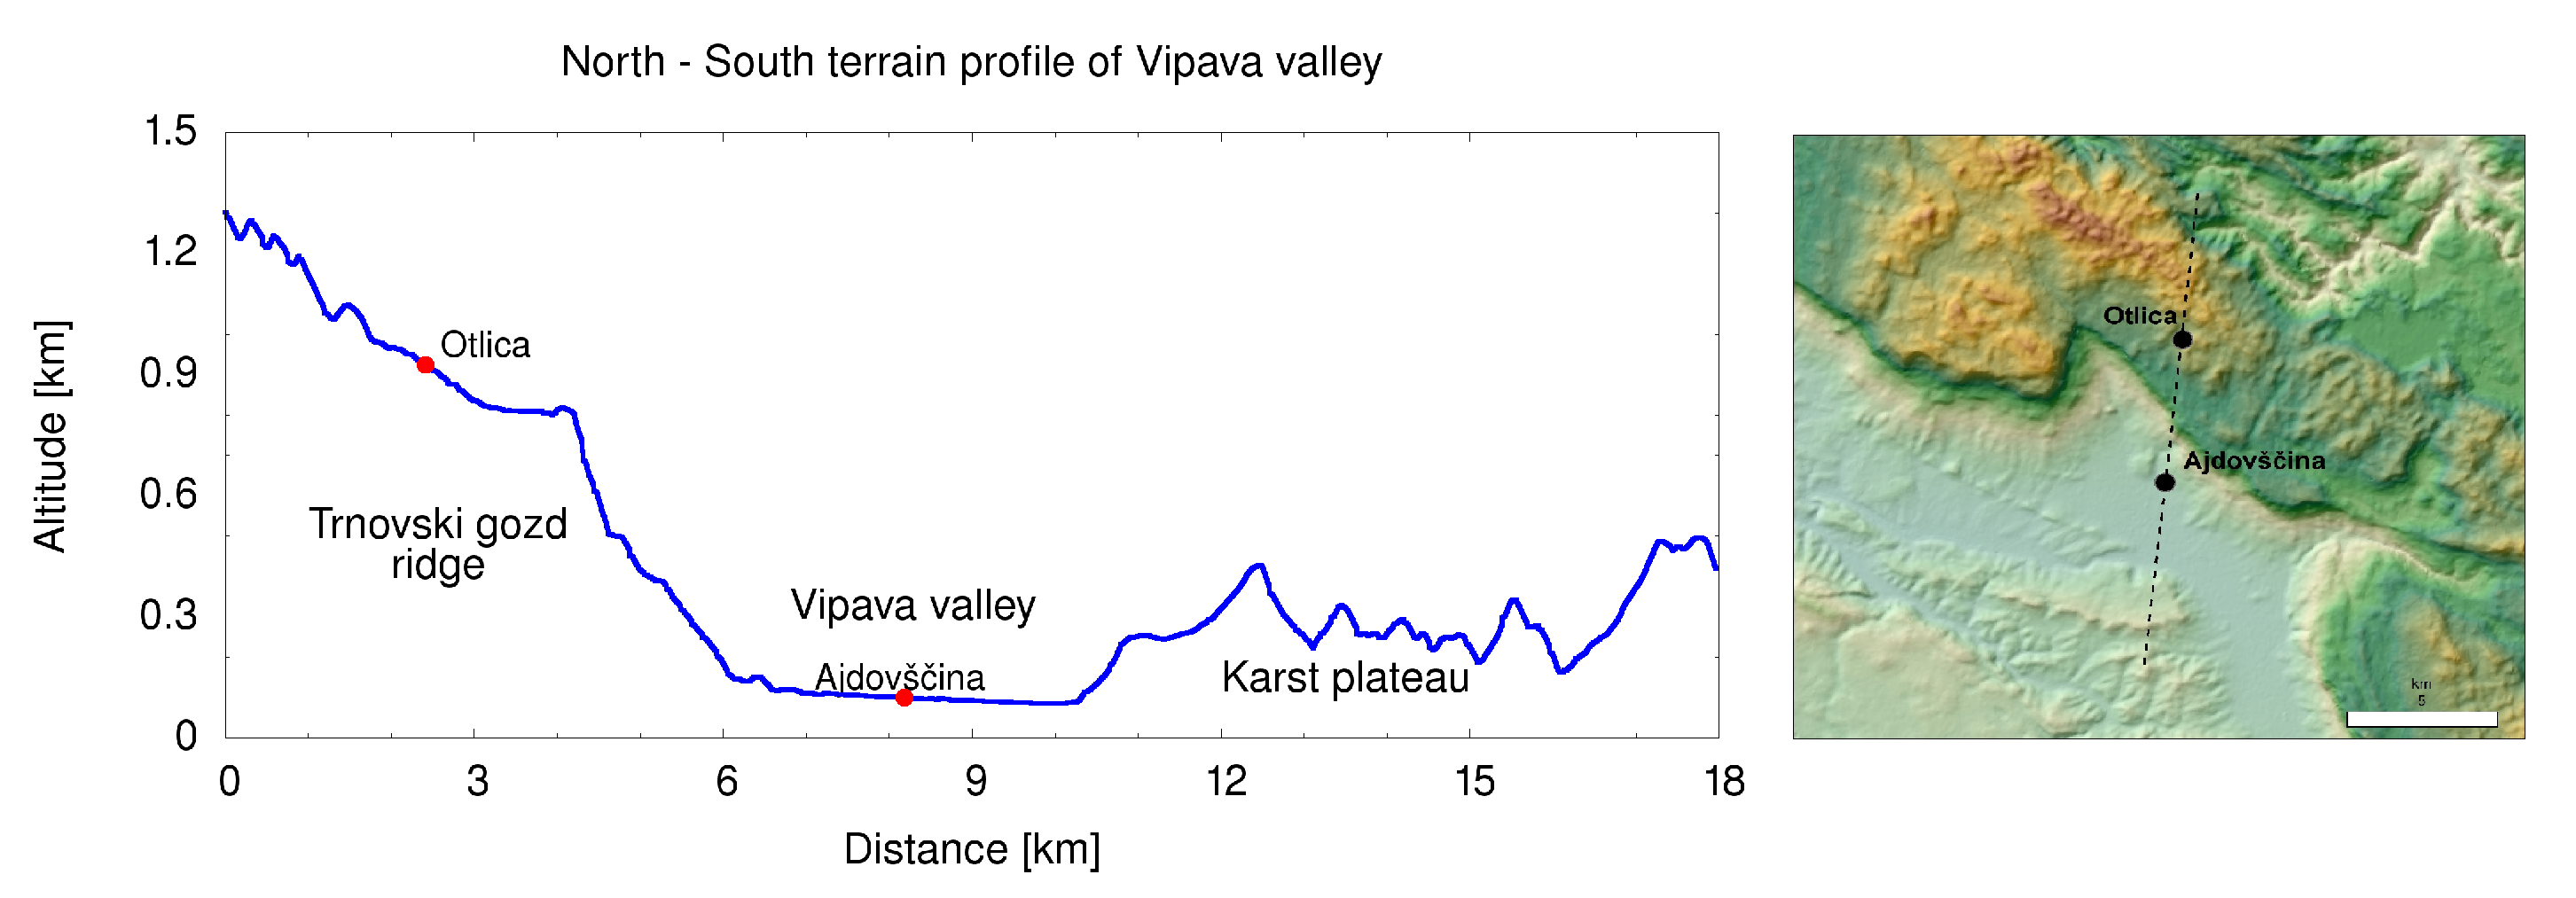
2.1. Experimental Site in the Vipava Valley

The in situ measurements were taken place at two locations. One field site was at the Vipava valley floor (University of Nova Gorica in Ajdovščina, 45.87 ° N, 13.90 ° E, 125 m a.s.l.) (Figure 1), where the lidar systems and the in situ sensors (for measurements of aerosol absorptions and meteorological conditions) were installed. The other field site was at Otlica, which is on the adjacent mountain range (951 m a.s.l.), 841 m above and 5 km away the Ajdovščina, where the aerosol absorption measurement and meteorological in situ sensors were installed as well. Aerosol absorption property measurements were taken by Magee Scientific aethalometer AE-33 [35]. It is a filter based photometer, which measures optical absorption at 7 wavelengths (370 nm, 470 nm, 520 nm, 590 nm, 660 nm, 880 nm and 950 nm). The gradual accumulation of light absorbing carbonaceous aerosols on the filter causes a gradual increase in light attenuation. Black carbon source apportionment featured in the AE-33 software uses the so-called aethalometer model [36] and is based on the source specific dependence of light absorption by aerosols. The radiosonde data was obtained from Rivolto (113 m a.s.l.), about 67 km away to support the aerosol source and lidar data (see Section 2.2) analysis. The heights in lidar and radiosonde data are relative to Ajdovščina.

2.2. Lidar System

A dual-wavelength polarization Raman lidar system operating at 355 nm and 1064 nm, with the capability to provide extinction coefficient, backscatter coefficient, volume and particle depolarization ratio (VDR and PDR), backscatter Ångström exponent (BAE) and lidar ratio (LR) profiles was specifically developed to investigate elevated aerosol loading and air pollution properties in the Vipava valley, closed on three sides by elevated mountainous terrain. The key features of this system are the capability of remote operation and high duty cycle under all-weather conditions, which are achieved by using a 600 mm aperture Cassegrain telescope as a receiver and two high-power Nd:YAG pulsed lasers with energies of 130 mJ at 355 nm and 50 mJ at 1064 nm as transmitters. PDR and BAE, which are based on data from Mie scattering channels, were available in all operating conditions, while the LR at 355 nm, which is based on the N 2 Raman channel at 387 nm, could be extracted only in the nighttime. The configuration of this system is described in detail in [37].

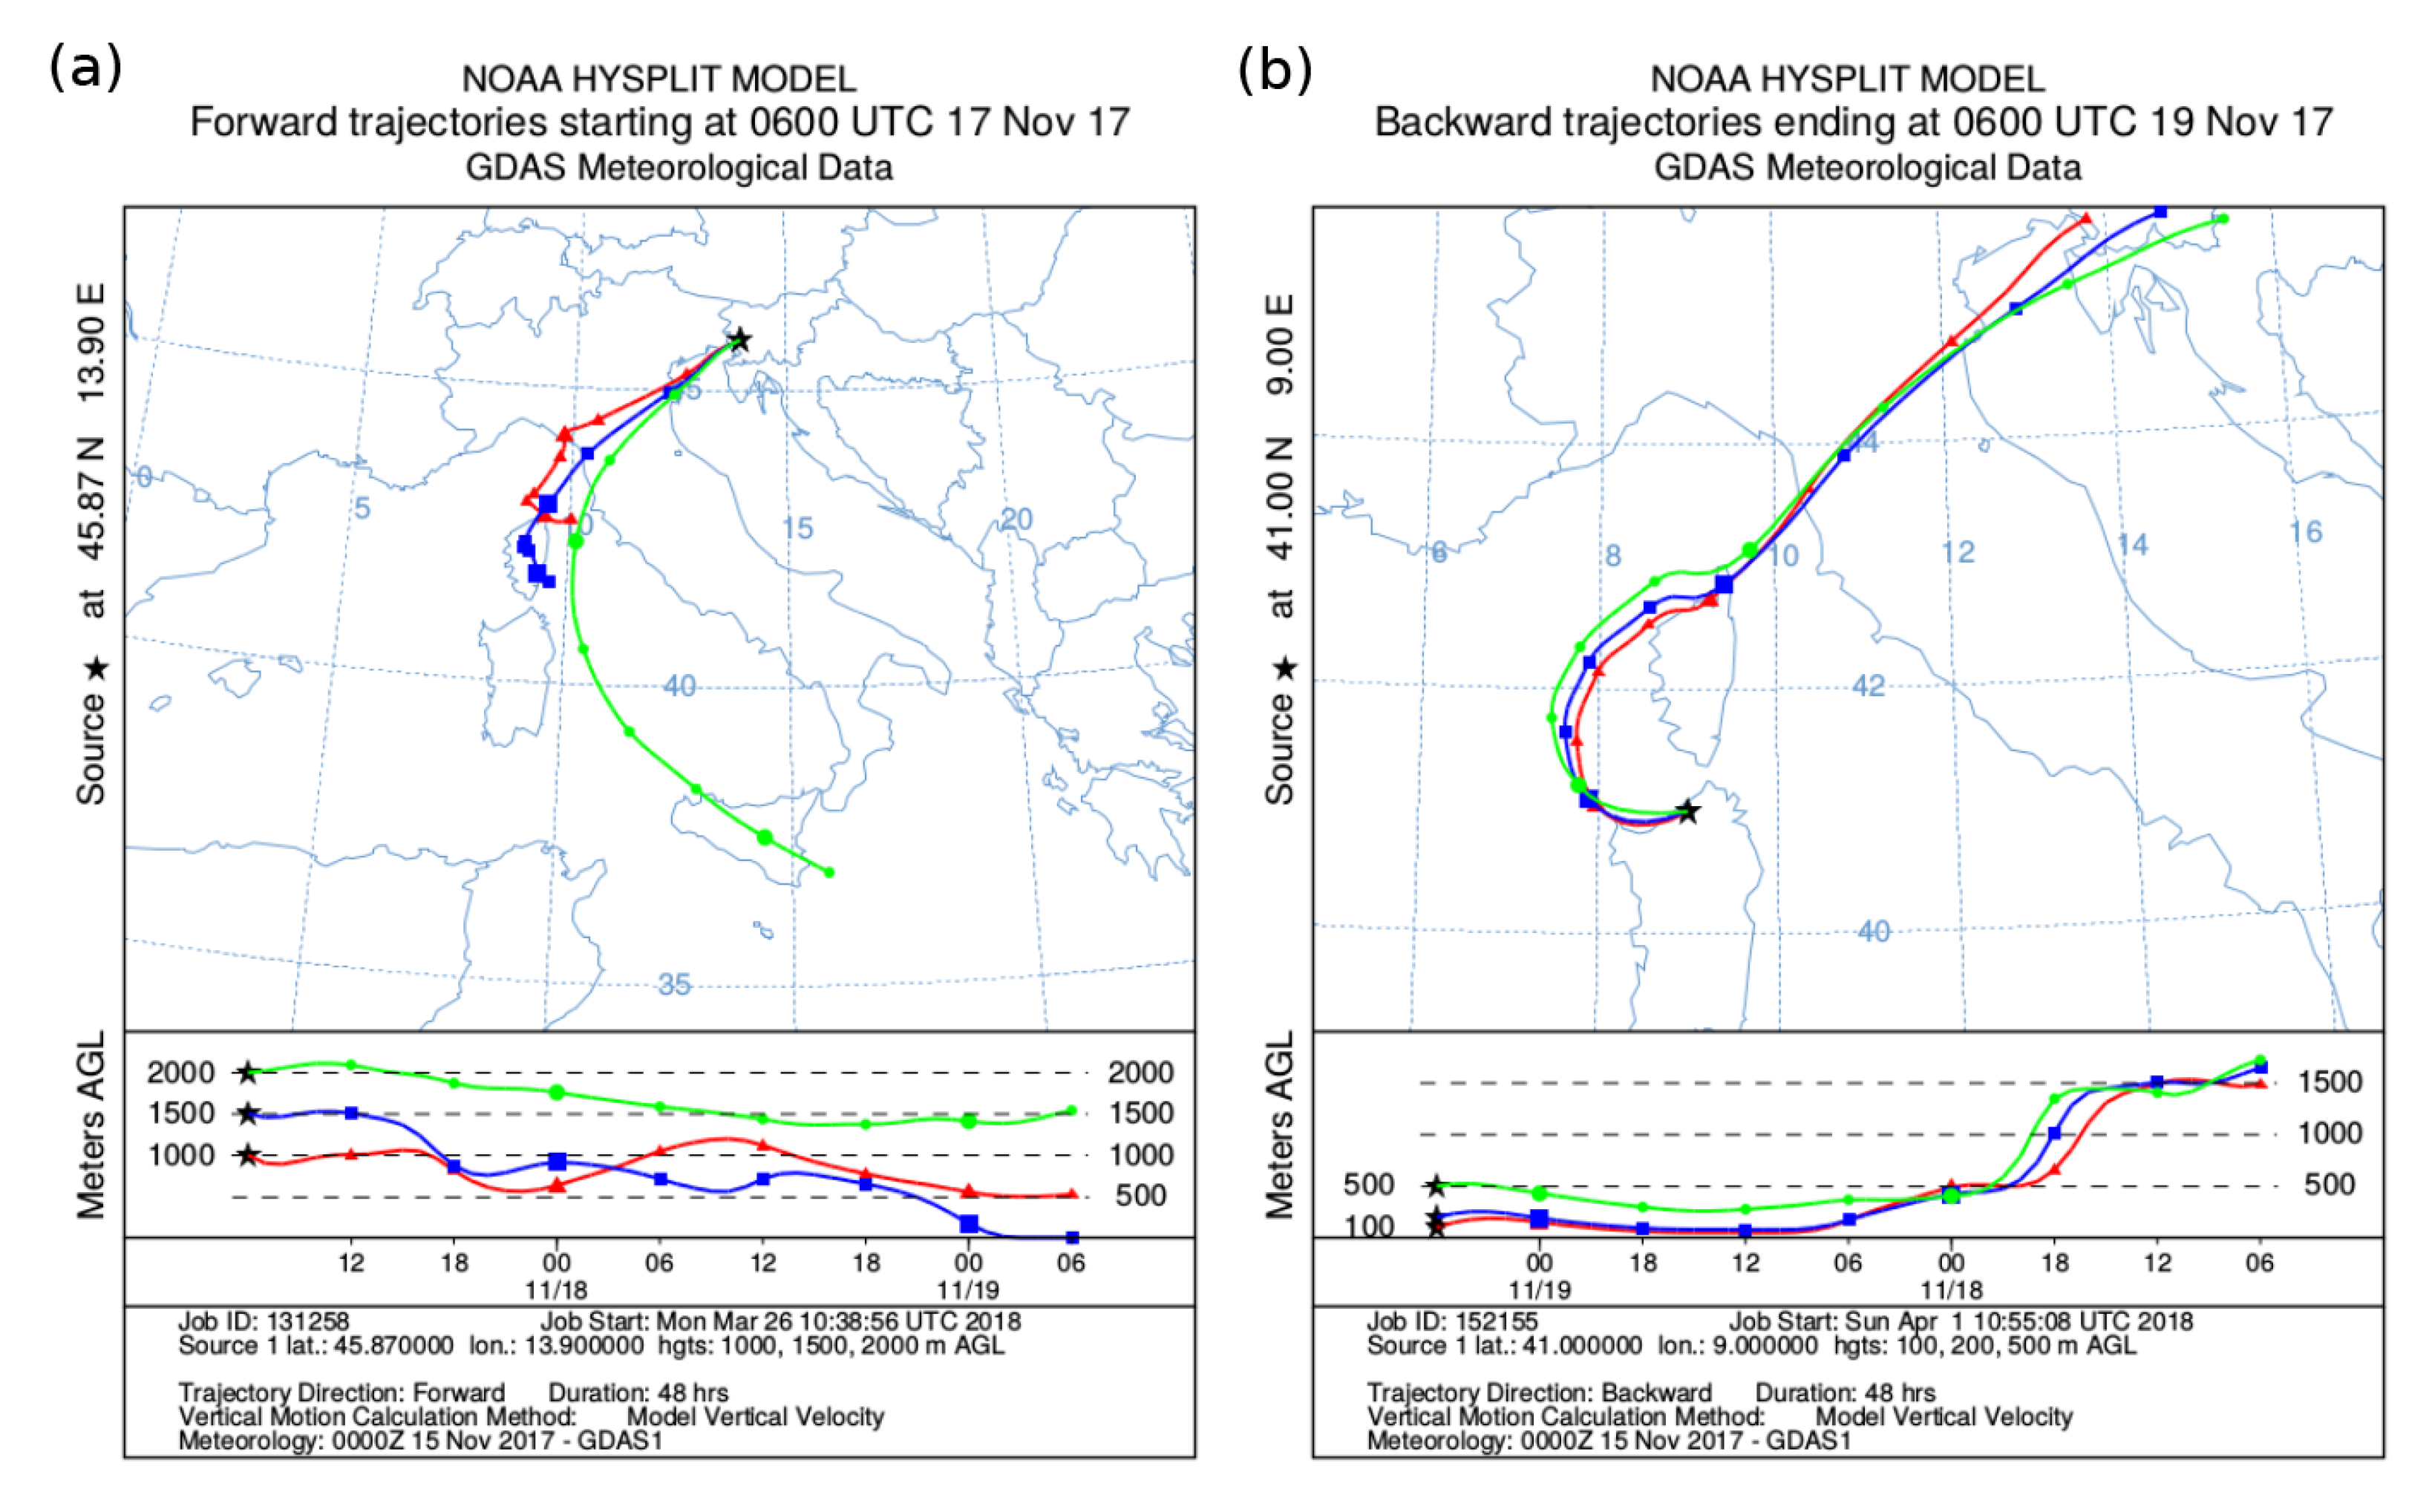
2.3. Hybrid Single Particle Lagrangian Integrated Trajectory Model (HYSPLIT)

The Hybrid Single Particle Lagrangian Integrated Trajectory Model (HYSPLIT) backward trajectories (http://www.ready.noaa.gov/HYSPLIT.php, accessed on 26 June 2022) analysis was used to investigate the long-range transport of air-masses. Backward airmass trajectories obtained from the HYSPLIT model [38] were used to identify long-range transport of air-masses into the Vipava valley region.

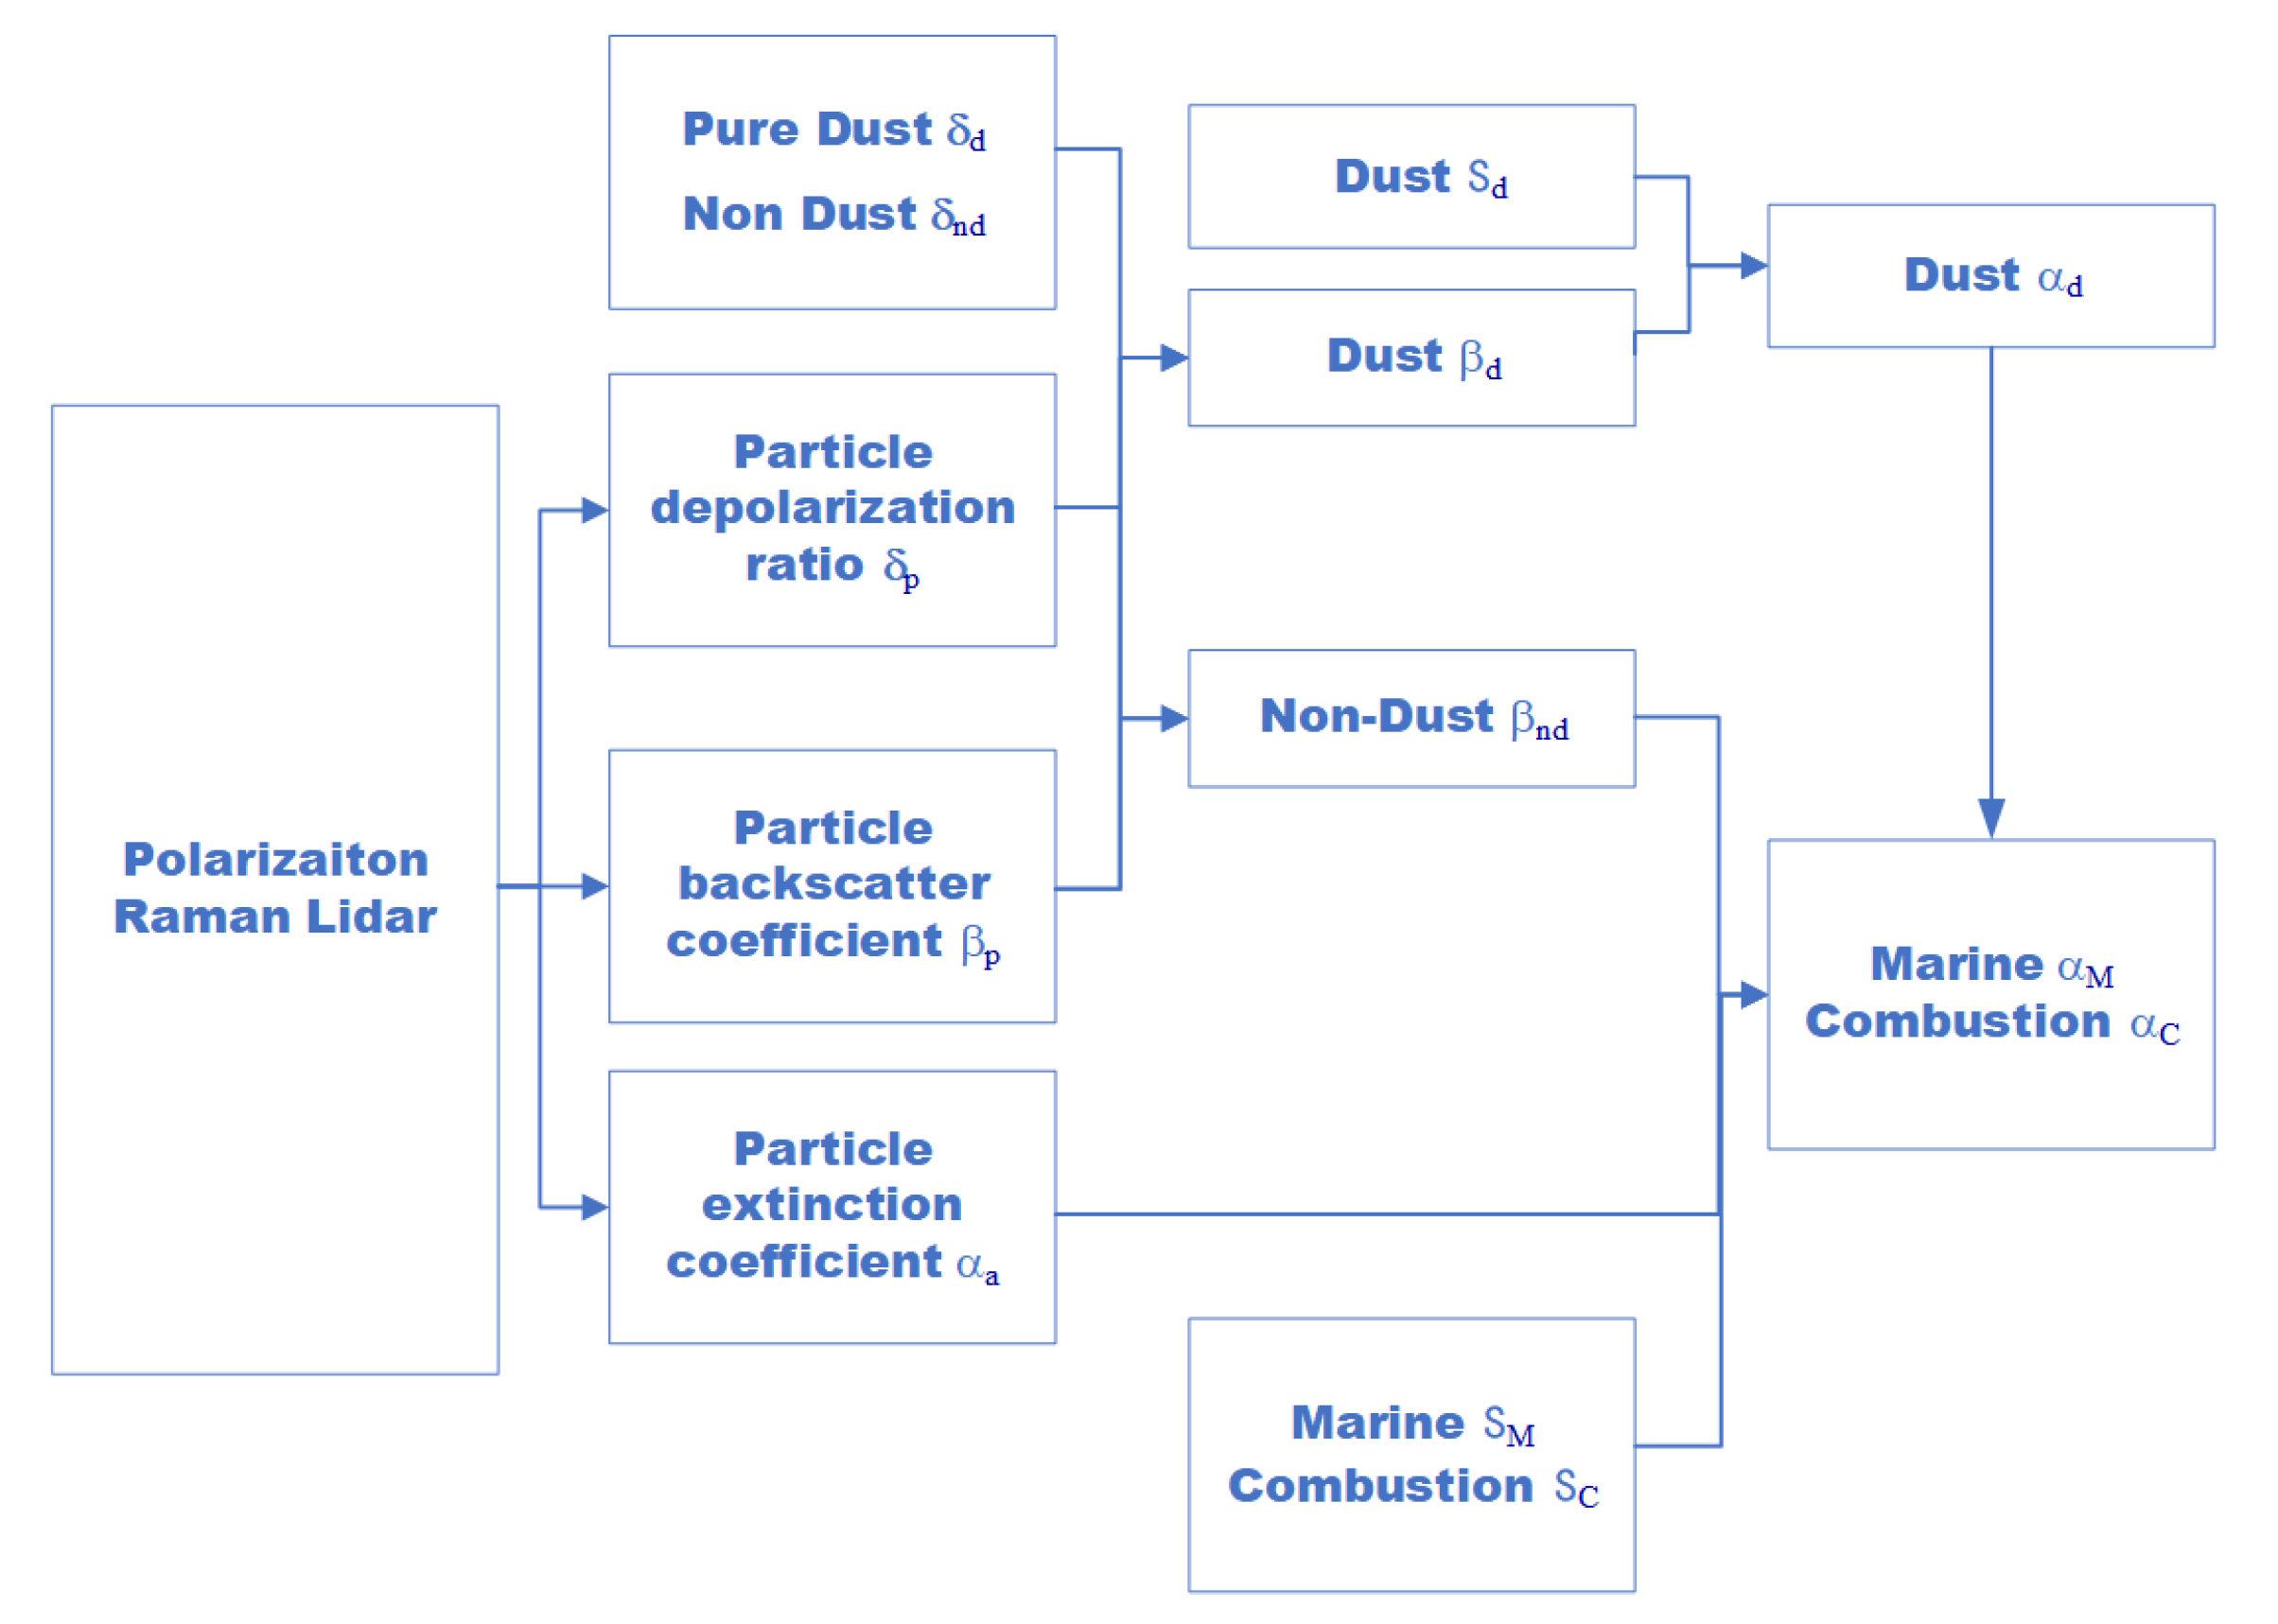
2.4. Aerosol Typing Methods

In order to obtain contributions of individual aerosol type to total aerosol loading, different aerosol types have to be identified by their optical properties. Several methods to separate profiles of particle backscatter and extinction, related to small size or fine aerosols (biomass burning smoke, urban haze) have been developed [7,39,40,41,42,43,44]. Most of these algorithms use a predetermined log-normal aerosol model, which consists of a fine mode and a coarse mode part with fixed size distributions and refractive index characteristics. For the retrieval of the fine-mode and the coarse-mode related backscatter and extinction profiles, radiative transfer calculations are performed with varying particle concentrations for each mode separately. In contrast, the method used in the framework of this study is based on the particle depolarization ratio (PDR) [45,46,47] rather than particle size distribution. PDR depends on both aerosol size and shape and was measured by the polarization Raman lidar, used in the campaign, which was also used to retrieve the particle backscatter and extinction profiles at 355 nm. Aerosol backscatter coefficient profiles at 1064 nm were extracted with an assumed fixed lidar ratio of 50 sr using the Fernald method [48]. The extinction and backscattering coefficients at 355 nm were retrieved in the nighttime based on the Raman method [49,50], which was also used to determine the lidar ratio (LR). Backscatter related Ångström exponent (BAE) was calculated from the backscatter coefficients measured at 355 nm and 1064 nm. The technique of dust retrievals is similar to the one used for separating molecular and particle contributions to the VDR [46]. Particle backscatter coefficient ( β p ) was assumed to contain contributions from mineral dust ( β d ) and less depolarizing aerosols ( β nd ). The linear PDR ratio δ p , which is due to both dust and non-dust particle backscattering can be defined [46] as
δ p = β p β p = β d + β nd β d + β nd .
In order to consider dust and non-dust particles independently, we introduce dust PDR δ d and non-dust PDR δ nd as δ d = β d / β d and δ nd = β nd / β nd . It can now be solved for δ d
δ d = β nd ( δ p δ nd ) + δ p β d ( 1 + δ nd ) β nd ( δ nd δ p ) + β d ( 1 + δ nd ) .
The relationship between dust particle and non-dust particle backscatter coefficients is
β p = β d + β nd .
After combining the Equations (2) and (3), the dust backscatter coefficient can be obtained as
β d = ( δ p δ nd ) ( 1 + δ d ) ( δ d δ nd ) ( 1 + δ p ) β p .
The value of δ d was taken to be 30%, and the value of δ nd was taken to be 5% according to the previous studies [46], thus the dust backscatter coefficient β d can be derived with the measured β p and δ p . In case of the presence of pure non-dust aerosol types (which were assumed to be either marine or anthropogenic, the later originating from either local traffic or biomass burning in the Vipava valley) or even the mixture of these two classes of aerosol types, the composition can be inferred using the Raman lidar retrieved aerosol extinction coefficient α a at 355 nm as [45]
α a = α d + α M + α c = S d β d + f M S M β nd + f c S c β nd ,
where S M and S c denote the lidar ratios of marine and combustion aerosols, while f M and f c are their extinction coefficient fractions relative to the non-dust aerosols, which are to be extracted. In our case, the lidar ratios for typical aerosol types ( S M and S c ) were adopted from our measurements in the predominant presence of the above aerosol types, which are verified by the PDR, in situ aethalometer measurements and backward trajectories, and the lidar ratio for pure dust aerosol was adopted from the case study of Saharan dust [46]. The sum of f M and f c was taken to be 1, thus
f c = α a S d β d S c β nd β nd ( S c S M ) .
An overview of the polarization Raman lidar data analysis for aerosol type separations is given in Figure 2.
Pure lidar-based observables were supplemented by single-scattering albedo (SSA), the ratio of scattering efficiency to total extinction efficiency, which was obtained using combination of the extinction coefficient α and absorption coefficient b abs [51] as
SSA ( λ 1 ) = 1 b abs ( λ 1 ) α ( λ 2 ) λ 1 λ 2 a ext ,
where b abs at λ 1   = 370 nm is obtained from the aethalometer, and α at λ 2 = 355 nm is taken from Raman lidar measurements at the same height as the aethalometer (841 m relative to the valley floor). Due to the wavelength difference between the two measurements, α needed to be recalculated to 370 nm using the Ångström exponent a ext . As the two wavelengths were very close, the uncertainty induced by extinction in the range from 0.5 to 2 for most aerosol types was negligible [51], therefore a ext was taken to be 1. The SSA uncertainty depends on the uncertainties of b abs and α as well as the level of pollution. It was suggested that higher aerosol loading with higher value of the SSA has lower uncertainty [51].

3. Results

3.1. Campaign Overview

In four months of data, taken from September to December 2017, we observed two predominant types of local weather, identified in a long-term statistical study of wind conditions in the valley, and four types of aerosol sources. For the weather types, one category refers to Bora (gusty downslope wind) episodes, which are very common in the Vipava valley. In this case, there is a strong and turbulent airflow present close to the valley floor and periodic structures can be found at the approximate height of the orographic barrier [52,53]. The second category refers to calm and stable atmospheric conditions, which are often accompanied by elevated aerosol loading within the valley and stratified atmospheric structure. Aerosols were found to be both from natural and anthropogenic sources, where the natural sources refer to mineral dust and marine aerosols, and the anthropogenic sources refer to biomass burning and traffic emissions (combustion sources). Weather and aerosol conditions were changing during the campaign and are presented in representative cases and statistics for entire periods.

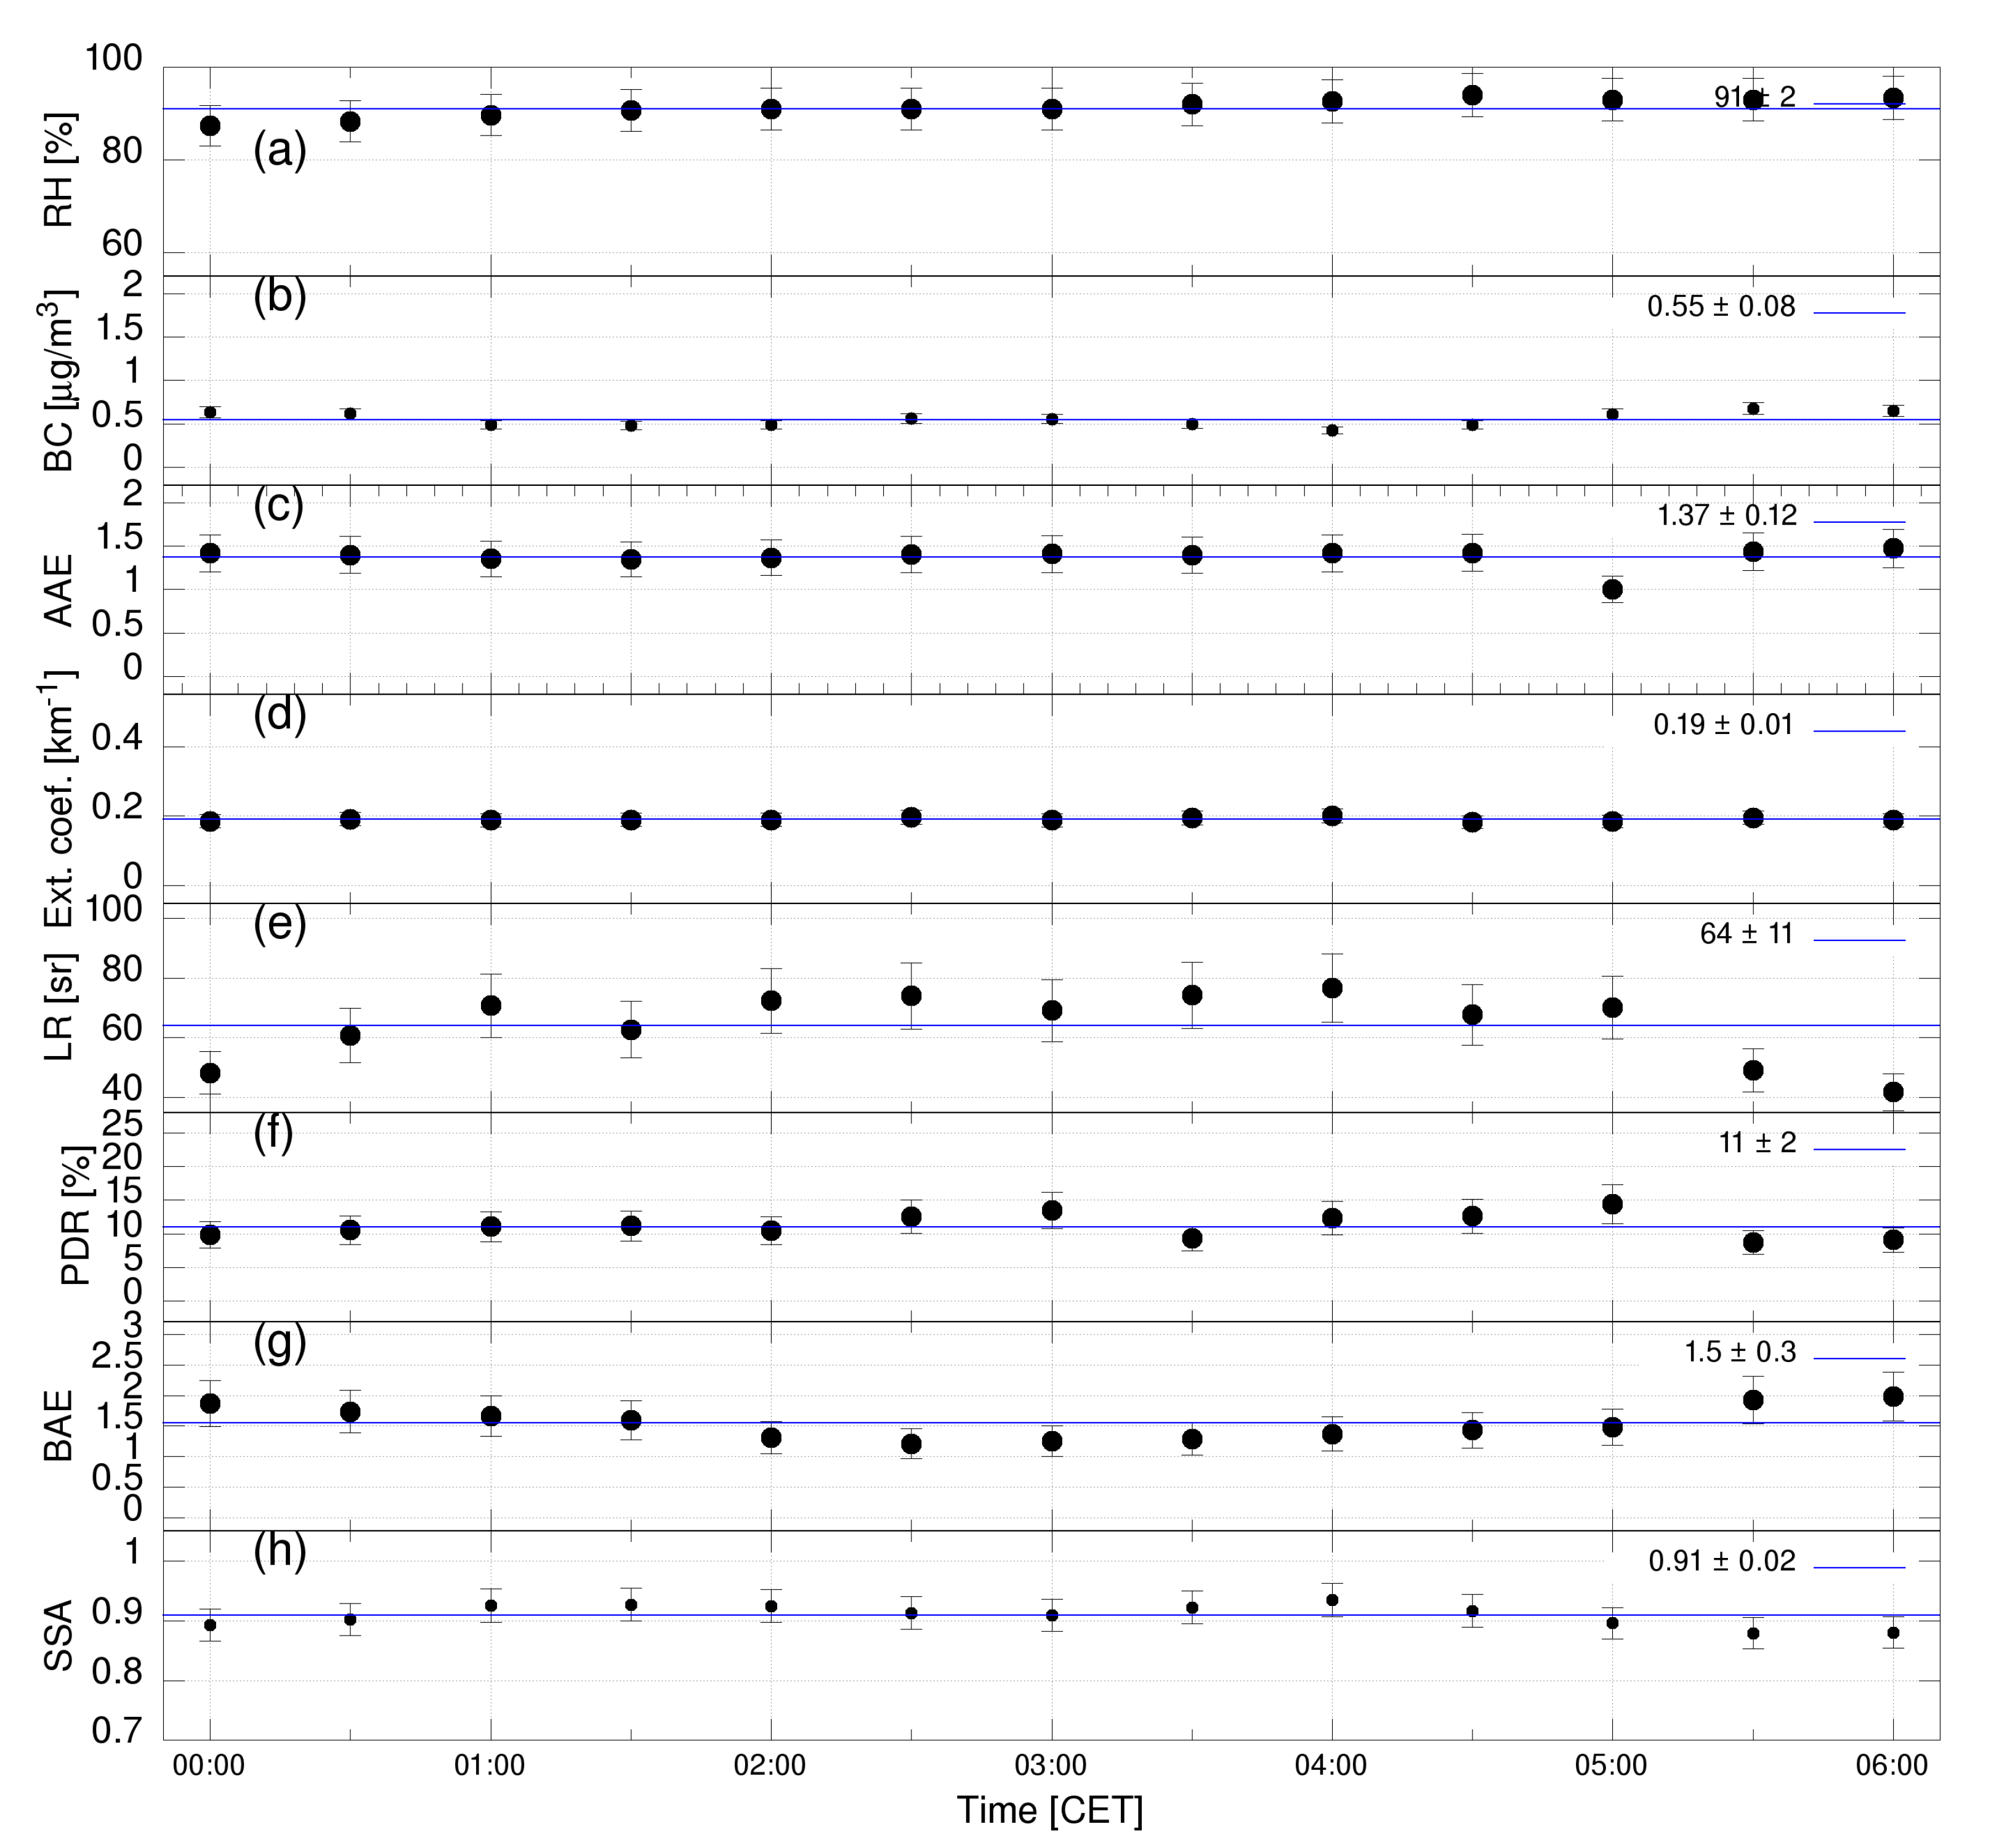
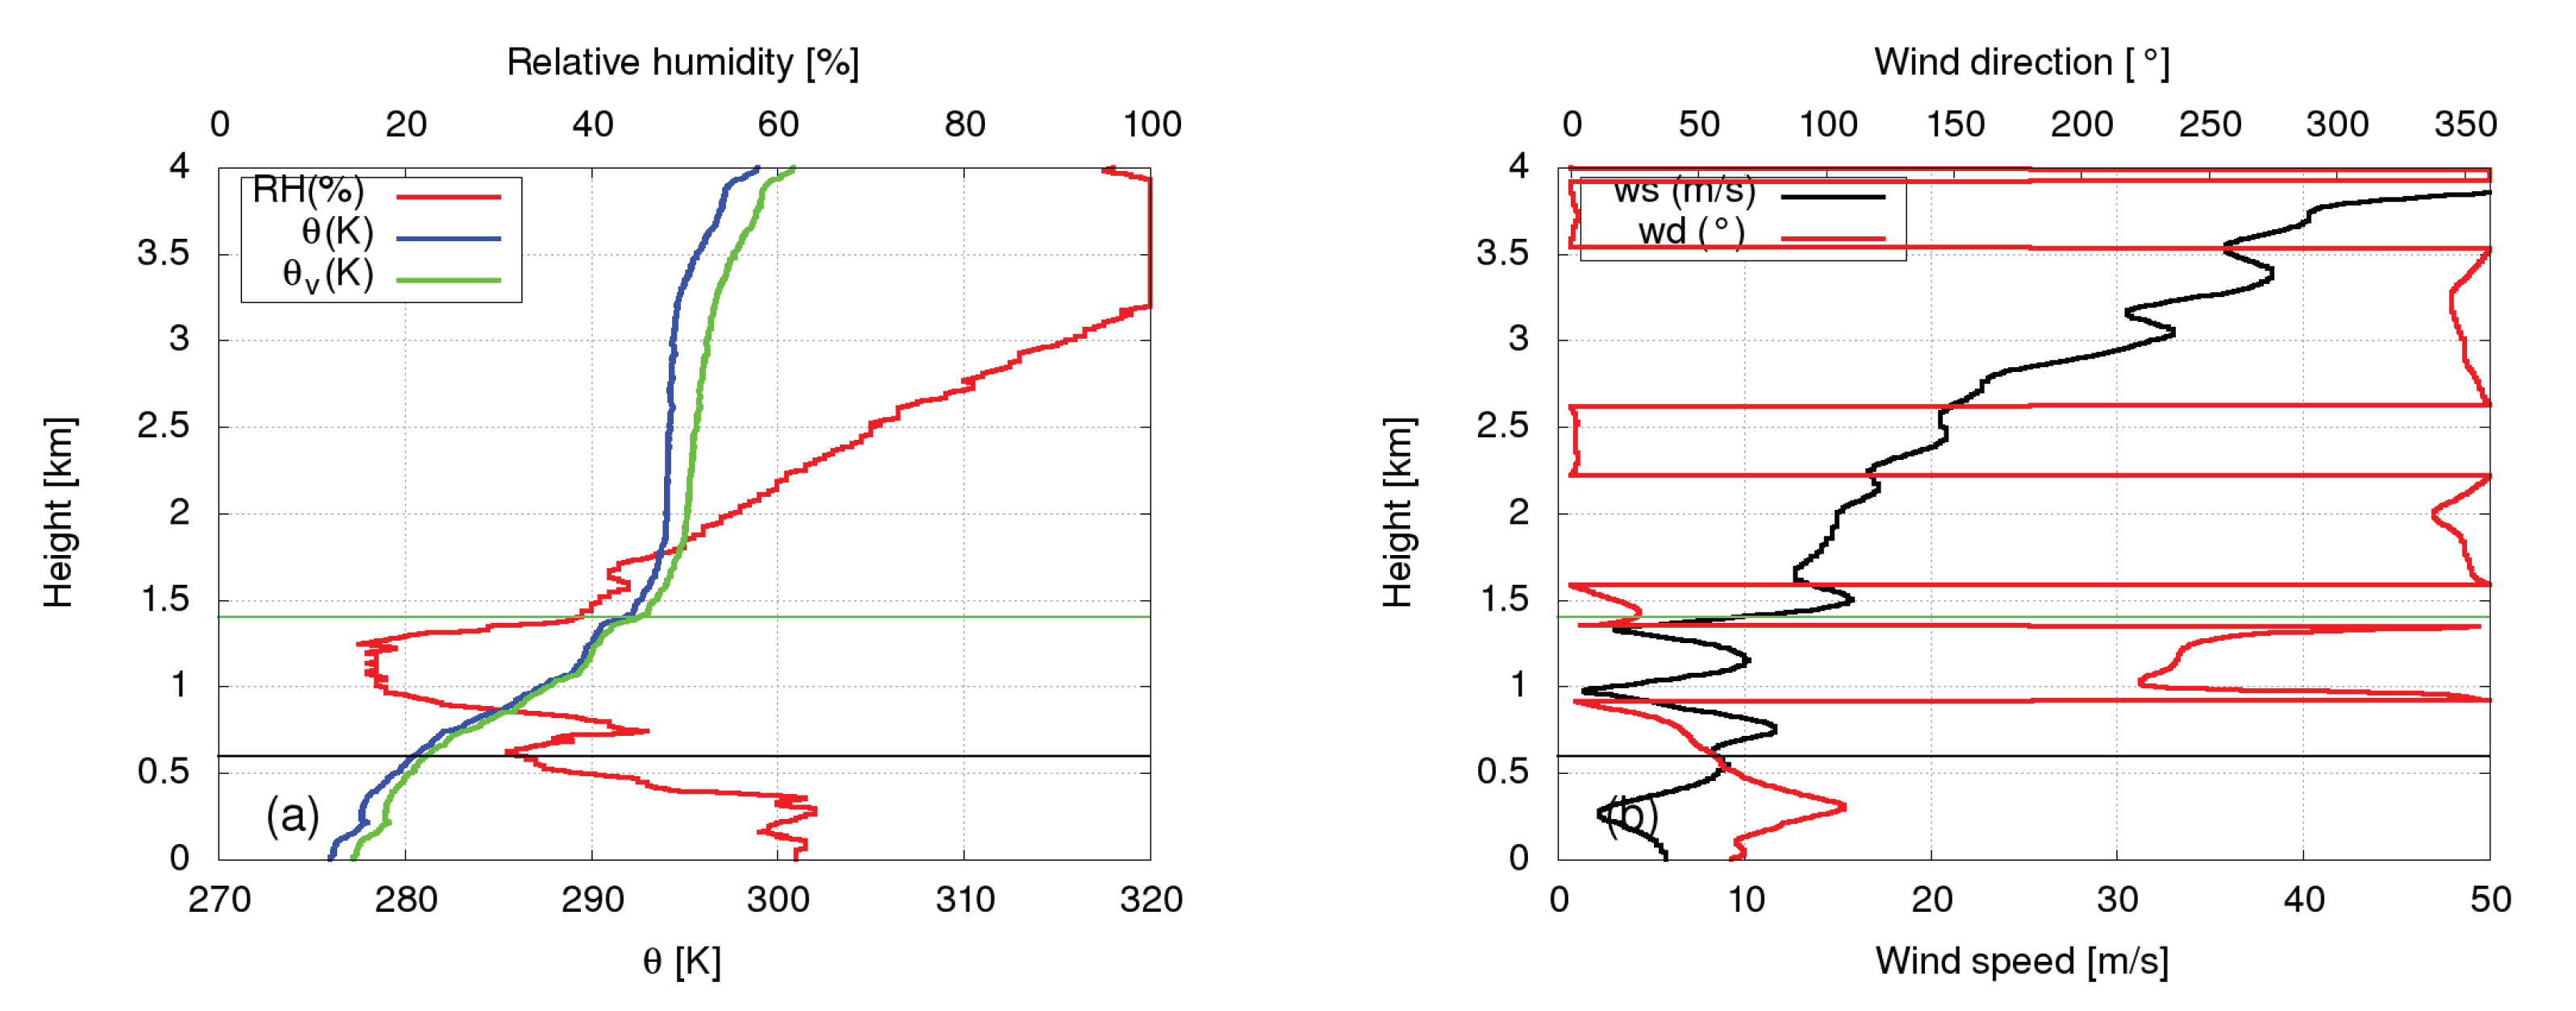
3.1.1. Case Study: Combustion Mixture Aerosols on 17 November 2017

The first presented Bora event took place on 17 November 2017, when the gust speeds of the NE downslope wind reached peak velocities of about 24 m/s (Figure 3). Lidar observations were combined with in situ measurements to reveal the effects of Bora winds on aerosol properties and vertical structures.
The investigation of aerosol structures and properties in the nighttime between 00:00 to 06:00 CET during this event was conducted. In this case, we expected to observe a complex mixture of aerosols due to the presence of a variety of combustion based aerosols due to heating. We did not expect to see a significant fraction of lifted soil dust due to low temperatures (below 0 ° C on 17 November) and rainfall on previous days (18 mm on 14 and (0.2 mm on 16 November 2017). Lidar data shows three distinct aerosol layers, including the PBL, an elevated aerosol layer (at about 1.5 km above the surface) and a cloud layer (Figure 4). The first occurrence of a large gradient in the IR lidar return signal was taken to correspond to the top of the PBL, which was in this case at about 0.4 km above the surface. Scattered clouds were observed at the height of 3–4 km. The elevated aerosol layer, which was best visible after 02:00 CET (Figure 4), was also seen in radiosonde data from Rivolto, obtained during the lidar measurement (Figure 5). Radiosonde data shows a strong change in relative humidity as well as wind speed and direction just above the elevated aerosol layer. Furthermore, increasing the potential temperature with height indicates stably stratified conditions and suppression of vertical air motion above 1.5 km. Despite horizontal displacement of the two measurements, the Rivilto measurement is representative for atmospheric conditions at Ajdovščina for heights above 1.5 km [52].
Aerosol optical properties were investigated based on the retrieved extinction coefficient, backscatter coefficients, LR, VDR, PDR and BAE between 355 and 1064 nm profiles (Figure 6). Largest values of the backscatter and extinction coefficients were found immediately after the complete overlap of the lidar, indicating that highest aerosol loading values were, as expected, within the PBL. At 2 km, just above the height of the elevated aerosol layer, there is a gradient change of the PDR, BAE and LR. Within the elevated layer and down to the top of the PBL, the variations of the PDR and LR parameters are within the expected errors and consistent with almost constant values, indicating the presence of the mixture of the same type of aerosols throughout this height range. Low PDR values (below 8%) confirmed our assumption on the absence of mineral dust. LR of 50   ±   10 sr together with PDR of 7 ± 2% indicated the presence of aerosols from anthropogenic combustion sources [54]. The predominant aerosol type was assessed by comparing our LR and PDR values to those from previous experiments, where known aerosol sources were being observed [18,19,20,54,55,56]. The values of aerosol properties obtained in our case correspond well to those from cases describing biomass burning (Figure 7).
These were further categorized by the in situ aethalometer measurements of the AAE at Otlica, 841 m above the lidar site (Figure 8). AAE value of about 1.35 indicated that primary aerosol sources were biomass burning and traffic emissions [36]. The BAE, decreasing with height, suggested increasing aerosol size, which was, due to increasing humidity (Figure 5a), caused by aerosol hygroscopic growth in humid atmosphere. The value of SSA was found to be between 0.85 and 0.94 (Figure 8h). Based on comparison with AERONET studies, it is indicative for combustion aerosols [57,58,59].
Temporal variations of the retrieved observables were small before 05:00 CET, which suggests that there were no significant changes in aerosol conditions. The relative humidity was also almost constant (89–93%), so there were no significant changes in aerosol properties due to variations in hygroscopic growth either [59]. The abrupt changes of the LR, PDR and BAE at around 05:00 CET indicate new anthropogenic emissions of smaller size particles. The change, which was also seen in the AAE at Otlica, can be explained by regular daily increase in human activities.
To determine the possibility of long range transport of local aerosols from the Vipava valley, transport paths of air-masses originating at the heights of the elevated aerosol layer were investigated using HYSPLIT backward/forward trajectory modeling, which may be due to the turbulence caused by Bora wind. Both the 48 h forward and 48 h backward trajectories show (Figure 9) that aerosols carried by air-masses were transported to Corsica (41.0 ° N, 9.0 ° E).

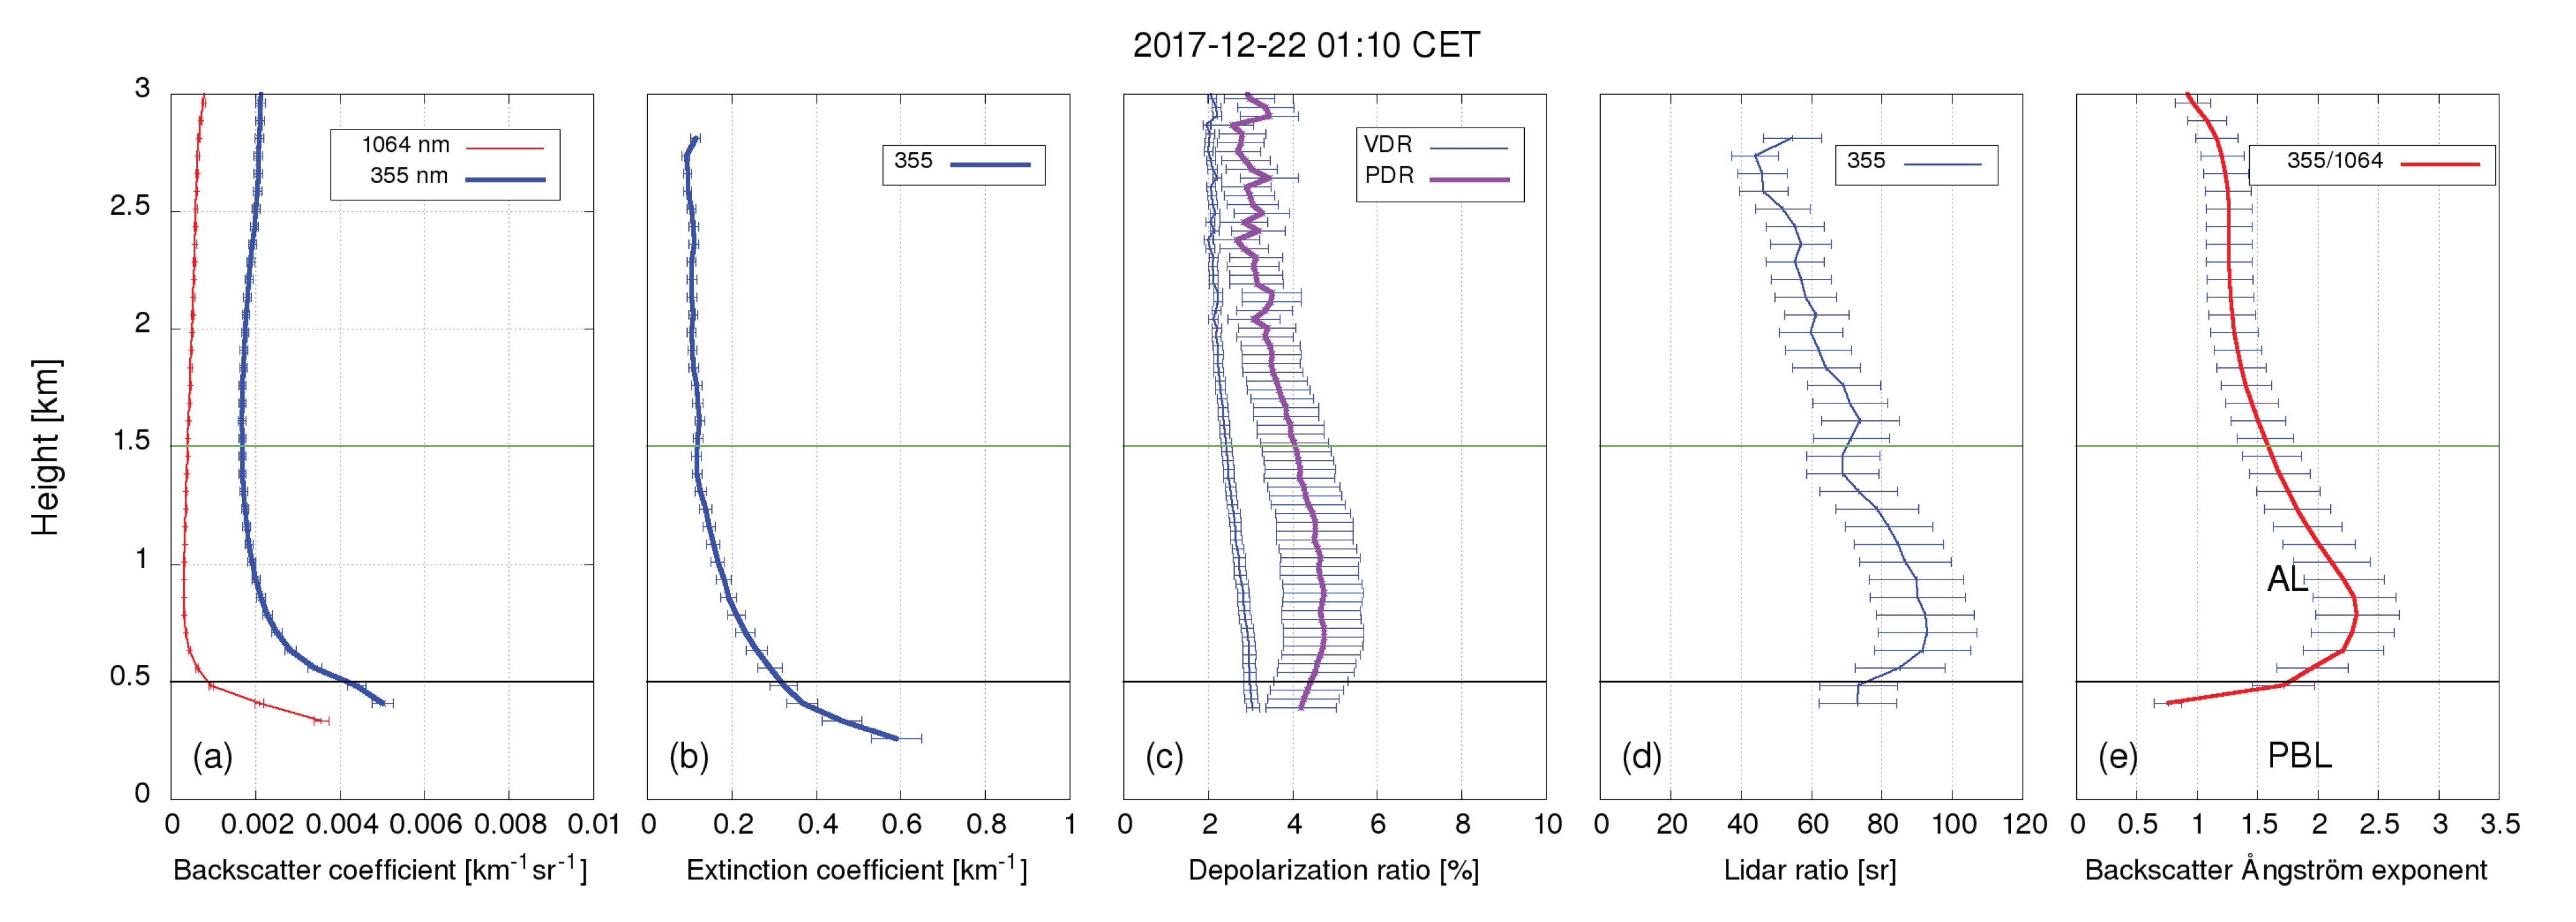
3.1.2. Case Study: Biomass Burning Smoke on 22 December 2017

This case covers the study of aerosol characteristics and structures that were expected to be dominated by biomass burning aerosols in stable atmospheric conditions. A cloudy and cold (below −2 ° C) night on 22 December 2017 with no expected long range aerosol transport was selected as a representative example. The main aerosol sources were expected to be local biomass burning emissions. Lidar return data, taken from 00:00 to 06:00 CET on 22 December 2017, shows three distinct aerosol layers (Figure 10). The PBL is visible below 0.5 km and the residual aerosol layer (AL) between 0.5 km and 1.5 km. The layer of scattered clouds was present above 2.5 km with the largest backscattering coefficient values appearing between 00:00 to 02:00 CET.
Atmospheric stability and the observed atmospheric structure was verified using radiosonde data from Rivolto, obtained at 01:00 CET on 22 December 2017, during the lidar measurement (Figure 11). The layers are evident from radiosonde data as well. Their boundaries can be identified by large changes in the gradient of the RH and potential temperature. In addition to low RH, the observed residual aerosol layer between 0.5 km and 2 km also has different wind properties. Due to spatial displacement of lidar and radiosonde measurements, the radiosonde wind data above the orographic features is not representative the Vipava valley especially under 1 km [52].
Vertical distributions of optical aerosol properties were investigated based on the retrieved extinction coefficient, backscatter coefficients, PDR, BAE and LR profiles (Figure 12 and Table 1). Above 1 km, the values of PDR, LR and BAE were decreasing with height while the RH was increasing, which may have been due to aerosol hygroscopic growth [8]. The aerosols may have aged faster under higher RH conditions.
Based on all the retrieved information, we attempted to identify predominant aerosol types within observed layers. Backscatter coefficients and the extinction coefficient were used for the estimation of aerosol loading, while LR, PDR and BAE were used for the characterization of aerosol types. Generally, low PDR values (below 6%) indicate absence of mineral dust. The predominant type of aerosols in each layer was assessed by comparing the obtained LR, PDR and BAE values to those from previous experiments, where known aerosol sources were observed (Figure 13). They correspond well to those from biomass burning [18,19,20,55,56].
The choice of aerosol type was additionally verified using the combination of lidar results and in-situ measurements of AAE and RH at Otlica (Figure 14). Due to atmospheric stability and absence of mineral dust at the height of Otilca site, local sources from the Vipava valley were expected to be predominant. AAE values of about 1.53 ± 0.11 after 01:00 CET, indicate predominant presence of aerosols from biomass burning. Temporal variations of all retrieved observables except RH and LR were small (Figure 14). RH was below 70%, which could not cause significant hygroscopic growth of aerosols. As RH and LR are correlated, RH might have somewhat affected aerosol scattering properties. SSA values were found to be from 0.96 to 0.98, in comparison to 0.85 to 0.94 found by other studies of biomass burning [57,58,59]. The discrepancy is most probably due to the uncertainties of extinction coefficient measurements (lidar) and very low absorption coefficients (aethalometer).

3.2. Aerosol Classification

In the 33 daily cases (192 h) between September and December 2017, lidar data was used to classify aerosol types present in the Vipava valley. To benefit from in situ weather and aerosol absorption data (aethalometer) from Otlica (841 m above Ajdovščina) lidar data at the height of Otlica was used. For the three cases with an expected presence of marine aerosols at higher altitudes, additional lidar data at 2 km height was used. All the data used for classification was taken during the night time (00:00 to 6:00), when the stable weather conditions were expected. Different aerosol types and their mixtures were determined based on the values of aerosol-type-dependent parameters (LR, PDR and BAE) by performing contour cuts in two-dimensional distributions of the LR and PDR or LR and BAE (Figure 15). There were less cases in the Figure 15b than Figure 15a due to the absences of backscatter coefficients at 1064 nm, which were caused by signal distortion in the higher atmosphere at 1064 nm nm in these cases. We confirmed that days with similar aerosol types, grouped together in LR vs. PDR plot, were grouped in the LR vs. BAE as well.
Based on the retrieved parameter values, three main aerosol types (mineral dust, marine aerosols, combustion aerosols) and their mixtures were present in the investigated cases. In a natural environment, aerosols always appear in a mixture. Predominance of a specific aerosol type was defined by additional criteria. Mineral dust was considered as predominant if PDR was larger than 30%. Marine aerosols were considered as predominant if PDR was less than 5% and LR was lower than 40 sr. Combustion aerosols were considered as predominant if PDR was less than 10% and LR was higher than 40 sr and black carbon presence was confirmed, as well as additionally check using the method described in Section 2.4. When combustion aerosols were predominant, their source was additionally determined by the in situ measured AAE. AAE larger than 1.7 was considered as biomass burning (primary and secondary), while AAE close to 1 was considered as traffic. All aerosol mixtures were considered as external, where individual aerosol properties are preserved.
Aerosol optical properties can change in different weather conditions, especially due to complex physical and chemical processes, which govern aerosol aging in the atmosphere. These changes introduce variability of any given aerosol type or mixture of aerosol types in the LR vs. PDR parameter space, used for their identification. Distributions of different mixtures can therefore overlap, which introduces systematic uncertainty in aerosol identification. In general, the results of aerosol properties (LR and PDR at 355 nm) found in the Vipava valley are similar to the aerosol identified in Europe [8,20,45,54,60,61,62,63,64,65].

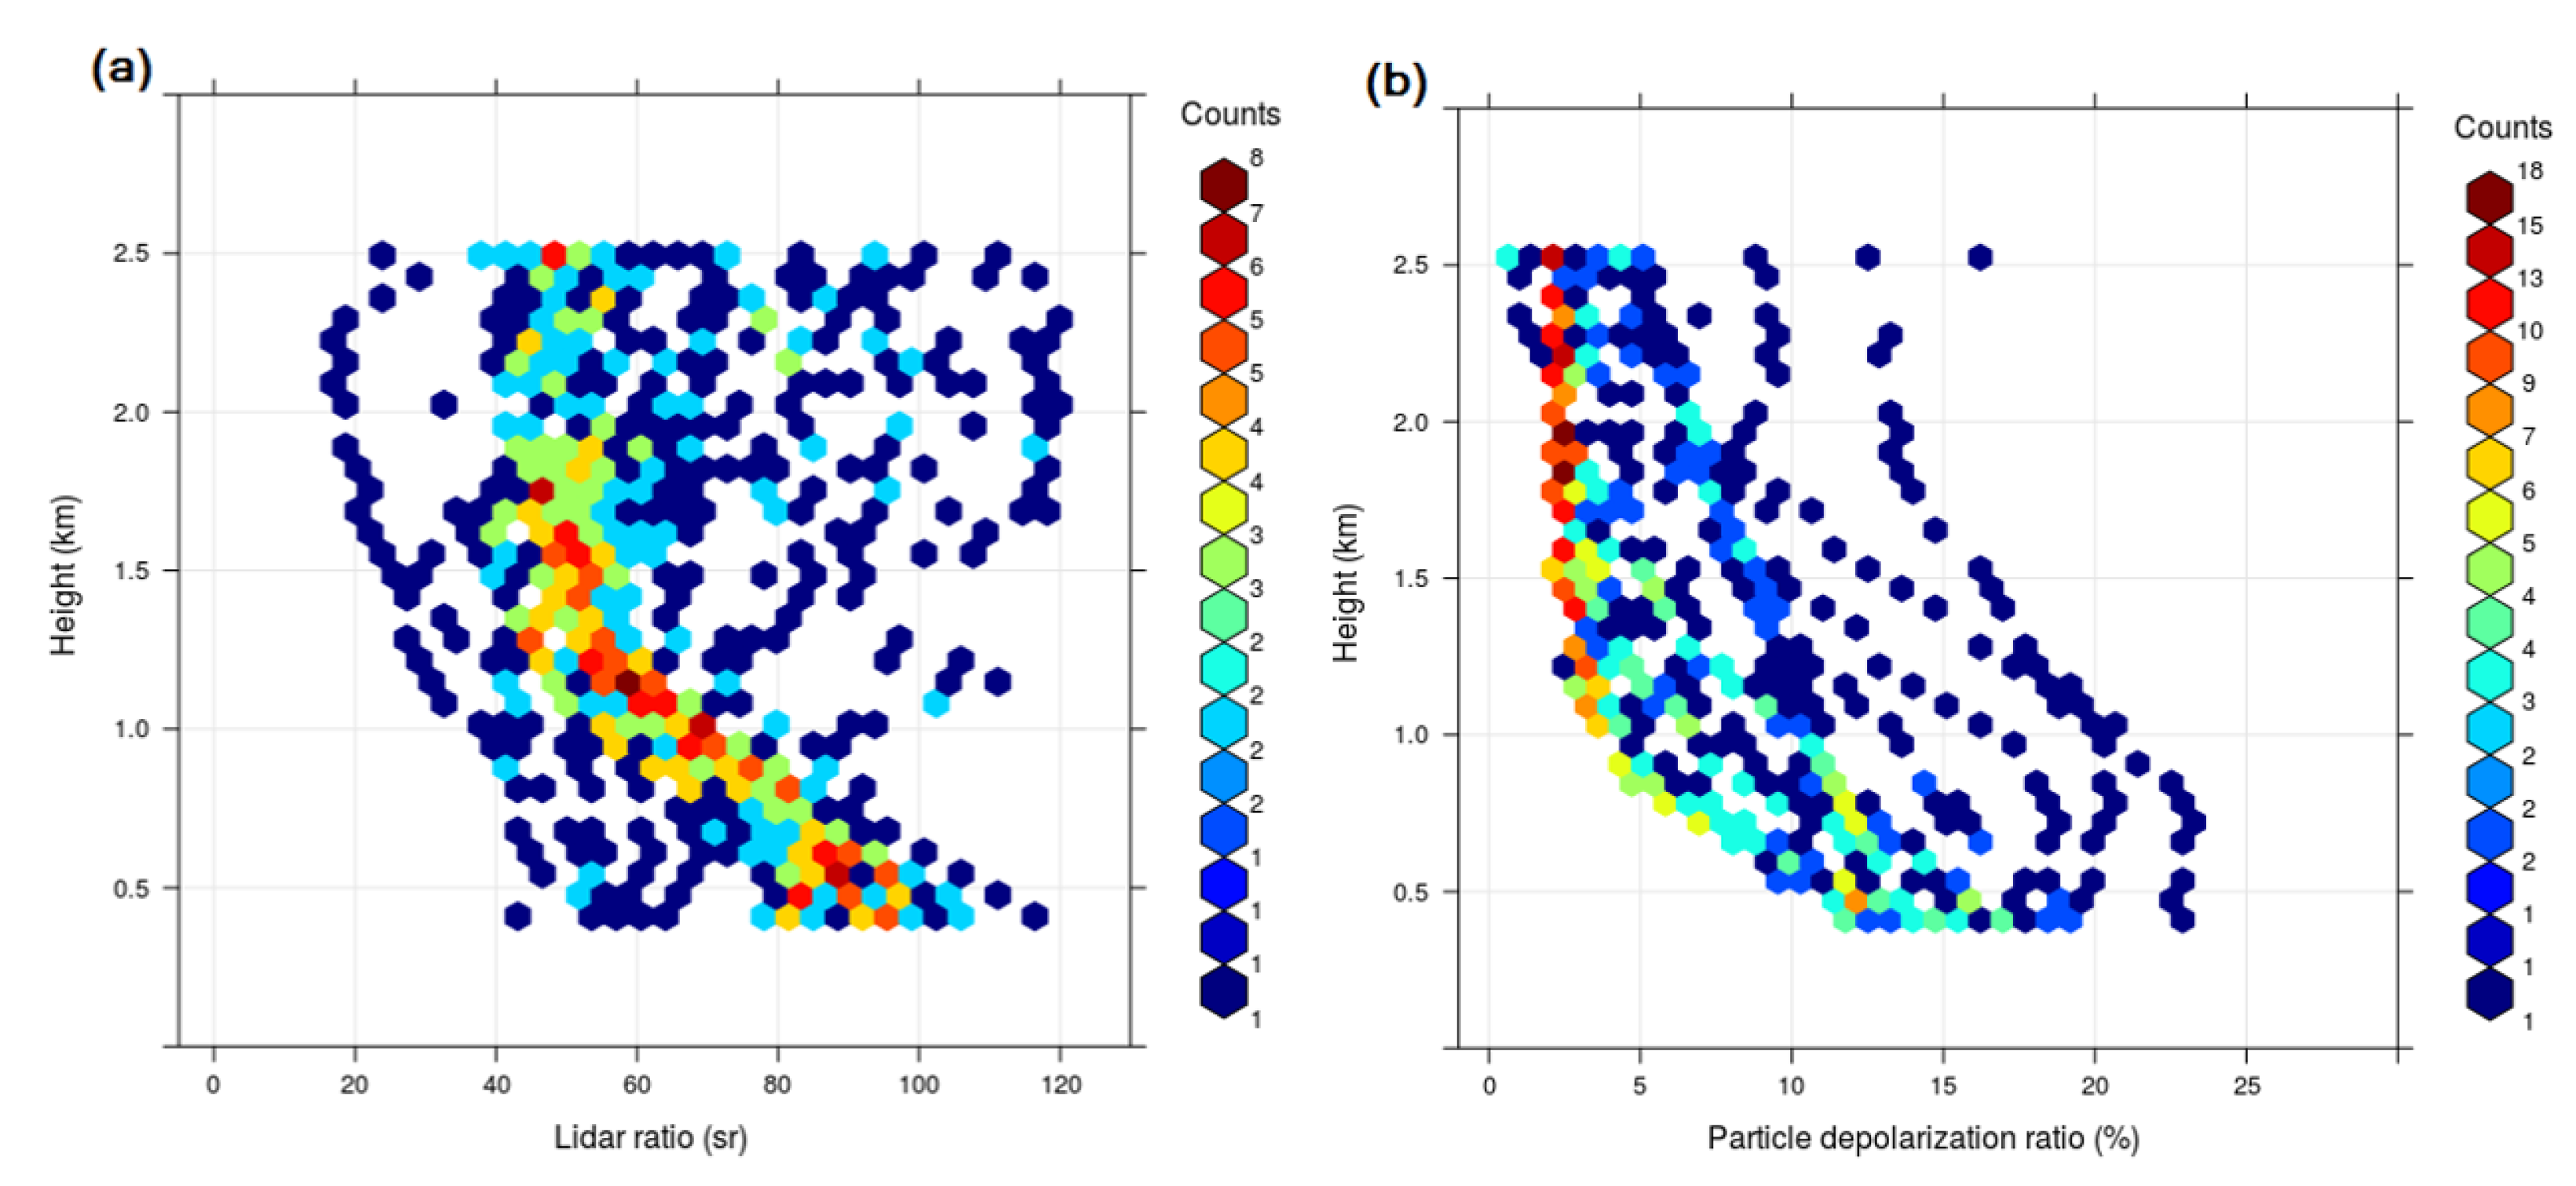
3.3. Occurrence Distribution of Characterization Observables
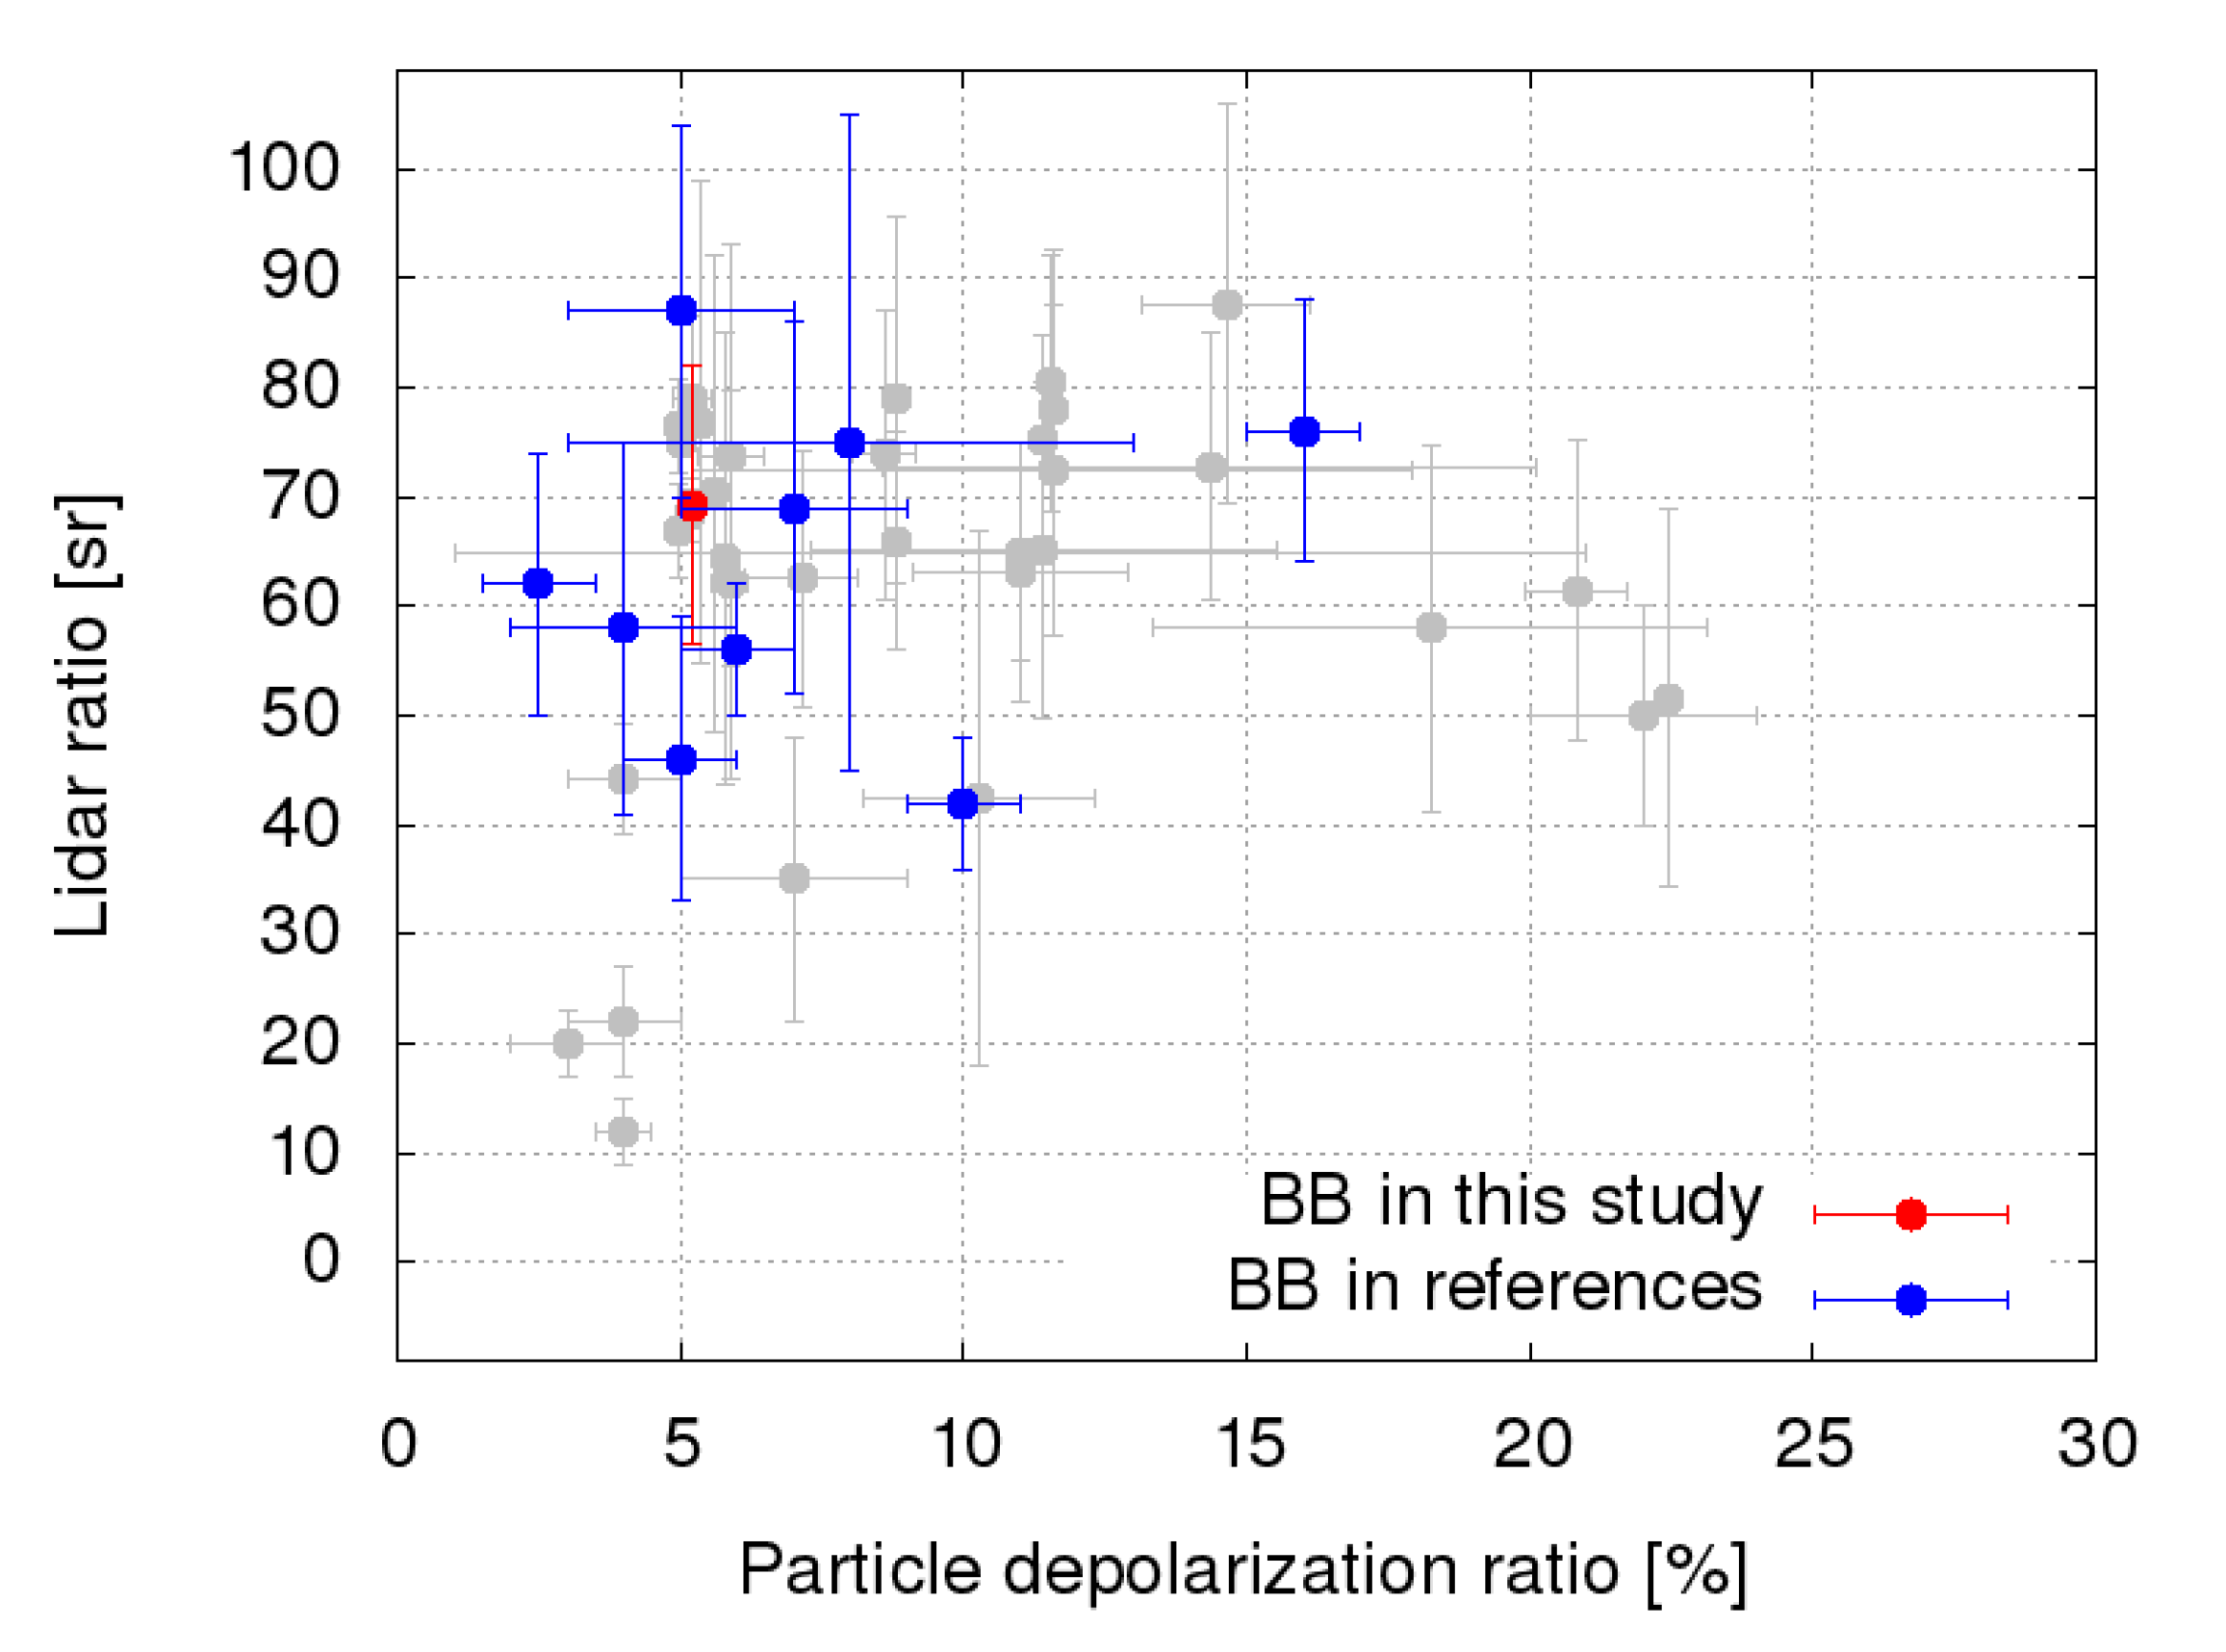
In addition to case studies, we also investigated the occurrence distribution of characterization observable profiles for the LR and PDR using the entire datasets (33 days of lidar measurements). The height range between 0.4 km and 2.5 km was selected, as it is not effected by incomplete overlap (after correction) and while most aerosols were present below 2.5 km. LR was found to be distributed between 20–120 sr and PDR distributed between 3–23%. Large ranges of LR and PDR values indicate the presence of various aerosol types, including marine, dust, biomass burning and traffic aerosols as well as their mixtures. The LR and PDR occurrence distributions for the entire dataset are shown in Figure 16. Based on Equations (4)–(6), the measured lidar observables also allow us to separate backscatter contributions for three aerosol categories (dust, marine and combustion) in the total aerosol backscatter and extinction coefficients. Fractions of backscatter contributions for these categories as well as their extinction contributions are shown in Figure 17.
Aerosol categories were defined so that pure non-dust (combustion and marine) have PDR less than 8%, and pure dust has PDR value of 30%. Further separation of marine and combustion category is based on Equation (6). Lidar ratios S c = 25 ± 5 sr and S M = 70 ± 10 sr were taken as average values for combustion and marine aerosols from Figure 15, while S d was taken to be 55 ± 5 sr [45]. Based on all available data, the category of combustion aerosols was found to predominant in the valley (Figure 17e), and contributed to aerosol extinction with average extinction coefficient of 0.2 km 1 (Figure 17h). Mineral dust was generally observed close to the ground (Figure 17c) and marine aerosols at high altitudes (Figure 17d). Their average extinction coefficients were very low (0.08 km 1 for the dust and 0.05 km 1 for marine). The extinction coefficient for each category could be converted into mass concentration once the mass extinction efficiency (MEE) for that category is known. From the whole statistics results, the anthropogenic combustion aerosol was found to be the most frequently predominant aerosol in the valley (Table 2). Although the marine aerosol had a small mount of contribution for local, it was also frequently arrived and has to be considered as one of main aerosol sources in the Vipava valley. The mineral dust was also considerable, with a 34% occurrence frequency but contributing the even larger extinction coefficient compared to marine aerosol for the Vipava valley.

4. Discussion

PDR at 355 nm is as an important parameter for aerosol identification, in particular for mineral dust. However, it cannot be used as a standalone indicator, especially for combustion and marine aerosols. LR is also an important aerosol type-dependent parameter, particularly suited for the separation of marine aerosols, while weak in the separation of combustion and dust. Therefore, two-dimensional selection criteria in the PDR and LR at 355 nm parameter space were employed in this work, and it was shown that LR can be used together with BAE as well. However, in the present work, PDR was preferred, as the BAE (355/1064) was not generally used in other experiments and could therefore not be used for direct comparison of the obtained results. For our lidar system, its other deficiency is the absence of direct LR information at 1064 nm, which causes higher uncertainty in BAE measurement as compared to the PDR. Uncertainties of the retrieved LR and PDR inevitably lead to mis-identification of aerosol types. Final aerosol identification was made based on a combination of all available parameters (RH, LR, PDR, BAE, AAE and SSA).
As the Vipava valley is located about 25 km from the Adriatic coast, it is possible to occasionally observe marine aerosols as well. Predominant marine aerosols were found only at heights above 2 km, which was assumed mainly due to the blocking role of mountains. In a mixture with local anthropogenic aerosols, they were also observed within the valley, which proves that the aerosols can be transported downward to the surface by the mountain downslope wind processes. All the above findings were evidenced by both statistical and case studies. In this winter observation campaign, the mineral dust was only observed from regional sources, thus it mainly remained in the lower layers. Due to regular south-west winds, the Sahara desert is the main source of mineral dust in this region. It appears mainly in spring and summer. Saharan dust was not observed during this campaign, which took place in fall and winter. We expect to be able to investigate the properties of pure mineral dust in one of the future Saharan dust episodes, where an elevated layer will be detected in the free troposphere. For the local anthropogenic combustion aerosols, clear aerosol types are impossible to find. In this campaign, we were only able to observe cases with predominant biomass burning related aerosols. Among the anthropogenic combustion aerosols, primary particles are directly emitted by processes such as biomass burning, incomplete combustion of fossil fuels, and secondary particles are formed by gas from fossil fuels or biomass burning produced in the process of gas-to-particle. Mixture of both primary and secondary aerosols are always present, they can however not be distinguished in this study. It will be particularly challenging to identify primary and secondary combustion aerosols separately, using a combination lidars and advanced in situ sensors, which would have the capability to identify them in real time. Such instruments still need to be developed.

5. Conclusions

We demonstrated that aerosols in the Vipava valley can be successfully identified using the method of combining aerosol optical properties (PDR, LR and BAE) and vertical structure information, retrieved from lidar data. The data was obtained by a ground-based dual-wavelength Raman polarization lidar system as a standalone tool. Aerosols over the Vipava valley during this campaign were identified as mixtures of marine aerosols, mineral dust, traffic emissions and particles from biomass burning. In our analysis, we attempted to assess this mis-identification by checking additional information on the specific aerosol sources, such as model forecasts (HYSPLIT and DREAM (http://www.bsc.es/ESS/bsc-dust-daily-forecast, accessed on 26 June 2022)) as well as by performing additional in situ measurements (AAE, SSA, RH). The AAE is particularly valuable, as it can be used to determine the source of combustion aerosols. The additional information and comparison with previous studies proves that this method can be successfully applied for the aerosol typing in the southern Alpine region, but also in some other regions with similar topography and meteorological conditions. The vertical distributions of the aerosol types indicated the downward and upward dispersion mechanisms, which were effected by the features of mountain regions. Such dispersion mechanisms could transport the local pollutants to the other regions, while bringing the long-range transported pollutants to local regions. As the information of aerosol optical properties at 355 nm is very limited, in particular in a complex terrain of southern Alpine region in Europe, this study provides a reference for further research, and can also be a useful document for future similar studies as well as satellite validations (e.g., Aeolus and the Earthcare missions).

Author Contributions

All the authors made contributions to this research work and manuscript. In particular; data curation, L.D., M.B.M. and A.G.; investigation, L.W., S.S. and M.B.M.; methodology, L.W., S.S., G.M., L.D., Z.Y. and A.G.; project administration, L.W., S.S., G.M. and X.W.; software, L.W. and Z.Y.; supervision, S.S. and D.M.; writing—original draft, L.W.; writing—review and editing, S.S., K.B., M.B.M., Z.Y., Y.Y., G.M., D.M., X.W. and A.G. All authors have read and agreed to the published version of the manuscript.

Funding

This work was supported by the National Natural Science Foundation of China (grant Nos. 62105248 and 62005201) and by Slovenian Research Agency (grants No. P1-0385 and I0-0033).

Institutional Review Board Statement

Not applicable.

Informed Consent Statement

Not applicable.

Data Availability Statement

The datasets generated during and/or analyzed during the current study are available from the corresponding author on reasonable request.

Acknowledgments

We are grateful to Aerosol d.o.o., the manufacturer of the Aethalometer instruments, which were provided by them for the Aethalometer data in the study, and to Agostino Manzanato and Stefano Micheletti for help with sounding data from Rivolto.

Conflicts of Interest

The authors declare no conflict of interest. At the time of the research, A.G., G.M. and L.D. were part-time employed by Aerosol d.o.o., the manufacturer of the Aethalometer instruments, which were provided by them in the study. Funding agencies or Aerosol d.o.o. had no role in the design of the study; in the collection, analyses, or interpretation of data; in the writing of the manuscript, and in the decision to publish the results.

References

  1. Masson-Delmotte, V.; Zhai, P.; Pirani, A.; Connors, S.; Péan, C.; Berger, S.; Caud, N.; Chen, Y.; Goldfarb, L.; Gomis, M.; et al. IPCC, 2021: Climate Change 2021: The Physical Science Basis. Contribution of Working Group I to the Sixth Assessment Report of the Intergovernmental Panel on Climate Change; Cambridge University Press: Cambridge, UK; New York, NY, USA, 2021. [Google Scholar] [CrossRef]
  2. Levin, Z.; Teller, A.; Ganor, E.; Yin, Y. On the interactions of mineral dust, sea-salt particles, and clouds: A measurement and modeling study from the Mediterranean Israeli Dust Experiment campaign. J. Geophys. Res. Atmos. 2005, 110. [Google Scholar] [CrossRef] [Green Version]
  3. Andreae, M.O. Climatic effects of changing atmospheric aerosol levels. World Surv. Climatol. 1995, 16, 347–398. [Google Scholar]
  4. Liu, B.; Ma, Y.; Shi, Y.; Jin, S.; Jin, Y.; Gong, W. The characteristics and sources of the aerosols within the nocturnal residual layer over Wuhan, China. Atmos. Res. 2020, 241, 104959. [Google Scholar] [CrossRef]
  5. Ma, Y.; Fan, R.; Jin, S.; Ma, X.; Zhang, M.; Gong, W.; Liu, B.; Shi, Y.; Zhang, Y.; Li, H. Black Carbon over Wuhan, China: Seasonal Variations in Its Optical Properties, Radiative Forcing and Contribution to Atmospheric Aerosols. Remote Sens. 2021, 13, 3620. [Google Scholar] [CrossRef]
  6. Saliba, G.; Chen, C.L.; Lewis, S.; Russell, L.M.; Quinn, P.K.; Bates, T.S.; Bell, T.G.; Lawler, M.J.; Saltzman, E.S.; Sanchez, K.J.; et al. Seasonal differences and variability of concentrations, chemical composition, and cloud condensation nuclei of marine aerosol over the North Atlantic. J. Geophys. Res. Atmos. 2020, 125, e2020JD033145. [Google Scholar] [CrossRef]
  7. Sugimoto, N.; Lee, C. Characteristics of dust aerosols inferred from lidar depolarization measurements at two wavelengths. Appl. Opt. 2006, 45, 7468–7474. [Google Scholar] [CrossRef]
  8. Müller, D.; Ansmann, A.; Mattis, I.; Tesche, M.; Wandinger, U.; Althausen, D.; Pisani, G. Aerosol-type-dependent lidar ratios observed with Raman lidar. J. Geophys. Res. Atmos. 2007, 112. [Google Scholar] [CrossRef]
  9. Mona, L.; Amodeo, A.; D’Amico, G.; Giunta, A.; Madonna, F.; Pappalardo, G. Multi-wavelength Raman lidar observations of the Eyjafjallajökull volcanic cloud over Potenza, southern Italy. Atmos. Chem. Phys. 2012, 12, 2229–2244. [Google Scholar] [CrossRef] [Green Version]
  10. Saito, M.; Yang, P. Advanced Bulk Optical Models Linking the Backscattering and Microphysical Properties of Mineral Dust Aerosol. Geophys. Res. Lett. 2021, 48, e2021GL095121. [Google Scholar] [CrossRef]
  11. Sassen, K. The polarization lidar technique for cloud research: A review and current assessment. Bull. Am. Meteorol. Soc. 1991, 72, 1848–1866. [Google Scholar] [CrossRef]
  12. Weitkamp, C. Lidar: Range-Resolved Optical Remote Sensing of the Atmosphere; Springer Science & Business: Berlin, Germany, 2006; Volume 102. [Google Scholar]
  13. Qin, K.; He, Q.; Zhang, Y.; Cohen, J.B.; Tiwari, P.; Lolli, S. Aloft Transport of Haze Aerosols to Xuzhou, Eastern China: Optical Properties, Sources, Type, and Components. Remote Sens. 2022, 14, 1589. [Google Scholar] [CrossRef]
  14. Liu, B.; Ma, Y.; Gong, W.; Zhang, M.; Yang, J. Study of continuous air pollution in winter over Wuhan based on ground-based and satellite observations. Atmos. Pollut. Res. 2018, 9, 156–165. [Google Scholar] [CrossRef]
  15. Althausen, D.; Müller, D.; Ansmann, A.; Wandinger, U.; Hube, H.; Clauder, E.; Zörner, S. Scanning 6-wavelength 11-channel aerosol lidar. J. Atmos. Oceanic Technol. 2000, 17, 1469–1482. [Google Scholar] [CrossRef]
  16. Papayannis, A.; Mamouri, R.; Amiridis, V.; Remoundaki, E.; Tsaknakis, G.; Kokkalis, P.; Veselovskii, I.; Kolgotin, A.; Nenes, A.; Fountoukis, C. Optical-microphysical properties of Saharan dust aerosols and composition relationship using a multi-wavelength Raman lidar, in situ sensors and modelling: A case study analysis. Atmos. Chem. Phys. 2012, 12, 4011–4032. [Google Scholar] [CrossRef] [Green Version]
  17. Cattrall, C.; Reagan, J.; Thome, K.; Dubovik, O. Variability of aerosol and spectral lidar and backscatter and extinction ratios of key aerosol types derived from selected Aerosol Robotic Network locations. J. Geophys. Res. Atmos. 2005, 110. [Google Scholar] [CrossRef]
  18. Alados-Arboledas, L.; Müller, D.; Guerrero-Rascado, J.; Navas-Guzmán, F.; Pérez-Ramírez, D.; Olmo, F. Optical and microphysical properties of fresh biomass burning aerosol retrieved by Raman lidar, and star-and sun-photometry. Geophys. Res. Lett. 2011, 38. [Google Scholar] [CrossRef]
  19. Groß, S.; Tesche, M.; Freudenthaler, V.; Toledano, C.; Wiegner, M.; Ansmann, A.; Althausen, D.; Seefeldner, M. Characterization of Saharan dust, marine aerosols and mixtures of biomass-burning aerosols and dust by means of multi-wavelength depolarization and Raman lidar measurements during SAMUM 2. Tellus B 2011, 63, 706–724. [Google Scholar] [CrossRef]
  20. Kanitz, T.; Ansmann, A.; Engelmann, R.; Althausen, D. North-south cross sections of the vertical aerosol distribution over the Atlantic Ocean from multiwavelength Raman/polarization lidar during Polarstern cruises. J. Geophys. Res. Atmos. 2013, 118, 2643–2655. [Google Scholar] [CrossRef] [Green Version]
  21. Ferrero, L.; Castelli, M.; Ferrini, B.S.; Moscatelli, M.; Perrone, M.G.; Sangiorgi, G.; D’Angelo, L.; Rovelli, G.; Moroni, B.; Scardazza, F.; et al. Impact of black carbon aerosol over Italian basin valleys: High-resolution measurements along vertical profiles, radiative forcing and heating rate. Atmos. Chem. Phys. 2014, 14, 9641–9664. [Google Scholar] [CrossRef] [Green Version]
  22. Diémoz, H.; Gobbi, G.P.; Magri, T.; Pession, G.; Pittavino, S.; Tombolato, I.K.F.; Campanelli, M.; Barnaba, F. Transport of Po Valley aerosol pollution to the northwestern Alps – Part 2: Long-term impact on air quality. Atmos. Chem. Phys. 2019, 19, 10129–10160. [Google Scholar] [CrossRef] [Green Version]
  23. Quan, J.; Dou, Y.; Zhao, X.; Liu, Q.; Sun, Z.; Pan, Y.; Jia, X.; Cheng, Z.; Ma, P.; Su, J.; et al. Regional atmospheric pollutant transport mechanisms over the North China Plain driven by topography and planetary boundary layer processes. Atmos. Environ. 2020, 221, 117098. [Google Scholar] [CrossRef]
  24. Fasano, G.; Diémoz, H.; Fountoulakis, I.; Cassardo, C.; Kudo, R.; Siani, A.M.; Ferrero, L. Vertical profile of the clear-sky aerosol direct radiative effect in an Alpine valley, by the synergy of ground-based measurements and radiative transfer simulations. Bull. Atmos. Sci. Technol. 2021, 2, 1–24. [Google Scholar] [CrossRef]
  25. Ferrero, L.; Mocčnik, G.; Cogliati, S.; Gregoricč, A.; Colombo, R.; Bolzacchini, E. Heating rate of light absorbing aerosols: Time-resolved measurements, the role of clouds, and source identification. Environ. Sci. Technol. 2018, 52, 3546–3555. [Google Scholar] [CrossRef]
  26. Mao, S.; Wang, A.; Yi, Y.; Yin, Z.; Zhao, Y.; Hu, X.; Wang, X. Polarization Raman lidar for atmospheric correction during remote sensing satellite calibration: Instrument and test measurements. Opt. Express 2022, 30, 11986–12007. [Google Scholar] [CrossRef] [PubMed]
  27. Bedka, K.M.; Nehrir, A.R.; Kavaya, M.; Barton-Grimley, R.; Beaubien, M.; Carroll, B.; Collins, J.; Cooney, J.; Emmitt, G.D.; Greco, S.; et al. Airborne lidar observations of wind, water vapor, and aerosol profiles during the NASA Aeolus calibration and validation (Cal/Val) test flight campaign. Atmos. Meas. Tech. 2021, 14, 4305–4334. [Google Scholar] [CrossRef]
  28. Baars, H.; Radenz, M.; Floutsi, A.A.; Engelmann, R.; Althausen, D.; Heese, B.; Ansmann, A.; Flament, T.; Dabas, A.; Trapon, D.; et al. Californian wildfire smoke over Europe: A first example of the aerosol observing capabilities of Aeolus compared to ground-based lidar. Geophys. Res. Lett. 2021, 48, e2020GL092194. [Google Scholar] [CrossRef]
  29. He, T.; Stanič, S.; Gao, F.; Bergant, K.; Veberič, D.; Song, X.; Dolžan, A. Tracking of urban aerosols using combined LIDAR-based remote sensing and ground-based measurements. Atmos. Meas. Tech. 2012, 5, 891–900. [Google Scholar] [CrossRef] [Green Version]
  30. Gao, F.; Stanič, S.; Bergant, K.; Li, Y.; Li, S.; Hua, D.; Wang, L. Application of the Ultraviolet Scanning Elastic Backscatter LiDAR for the Investigation of Aerosol Variability. Remote Sens. 2015, 7, 6320–6335. [Google Scholar] [CrossRef] [Green Version]
  31. Wang, L.; Stanič, S.; Bergant, K.; Eichinger, W.; Močnik, G.; Drinovec, L.; Vaupotič, J.; Miler, M.; Gosar, M.; Gregorič, A. Retrieval of Vertical Mass Concentration Distributions—Vipava Valley Case Study. Remote Sens. 2019, 11, 106. [Google Scholar] [CrossRef] [Green Version]
  32. Gregorič, A.; Drinovec, L.; Ježek, I.; Vaupotič, J.; Lenarčič, M.; Grauf, D.; Wang, L.; Mole, M.; Stanič, S.; Močnik, G. The determination of highly time-resolved and source-separated black carbon emission rates using radon as a tracer of atmospheric dynamics. Atmos. Chem. Phys. 2020, 20, 14139–14162. [Google Scholar] [CrossRef]
  33. Milinković, A.; Gregorič, A.; Grgičin, V.D.; Vidič, S.; Penezić, A.; Kušan, A.C.; Alempijević, S.B.; Kasper-Giebl, A.; Frka, S. Variability of black carbon aerosol concentrations and sources at a Mediterranean coastal region. Atmos. Pollut. Res. 2021, 12, 101221. [Google Scholar] [CrossRef]
  34. Glojek, K.; Močnik, G.; Alas, H.D.C.; Cuesta-Mosquera, A.; Drinovec, L.; Gregorič, A.; Ogrin, M.; Weinhold, K.; Ježek, I.; Müller, T.; et al. The impact of temperature inversions on black carbon and particle mass concentrations in a mountainous area. Atmos. Chem. Phys. 2022, 22, 5577–5601. [Google Scholar] [CrossRef]
  35. Drinovec, L.; Močnik, G.; Zotter, P.; Prévôt, A.; Ruckstuhl, C.; Coz, E.; Rupakheti, M.; Sciare, J.; Müller, T.; Wiedensohler, A.; et al. The “dual-spot” Aethalometer: An improved measurement of aerosol black carbon with real-time loading compensation. Atmos. Meas. Tech. 2015, 8, 1965. [Google Scholar] [CrossRef] [Green Version]
  36. Sandradewi, J.; Prévôt, A.S.; Szidat, S.; Perron, N.; Alfarra, M.R.; Lanz, V.A.; Weingartner, E.; Baltensperger, U. Using aerosol light absorption measurements for the quantitative determination of wood burning and traffic emission contributions to particulate matter. Environ. Sci. Technol. 2008, 42, 3316–3323. [Google Scholar] [CrossRef] [PubMed]
  37. Wang, L.; Stanič, S.; Eichinger, W.; Song, X.; Zavrtanik, M. Development of an automatic polarization raman LiDAR for aerosol monitoring over complex terrain. Sensors 2019, 19, 3186. [Google Scholar] [CrossRef] [PubMed] [Green Version]
  38. Stein, A.; Draxler, R.; Rolph, G.; Stunder, J.; Cohen, M.; Ngan, F. NOAA’s HYSPLIT atmospheric transport and dispersion modeling system. Bull. Am. Meteorol. Soc. 2015, 96, 2059–2077. [Google Scholar] [CrossRef]
  39. Kaufman, Y.; Tanré, D.; Léon, J.; Pelon, J. Retrievals of profiles of fine and coarse aerosols using lidar and radiometric space measurements. IEEE Trans. Geosci. Remote Sens. 2003, 41, 1743–1754. [Google Scholar] [CrossRef]
  40. Léon, J.; Tanré, D.; Pelon, J.; Kaufman, Y.; Haywood, J.; Chatenet, B. Profiling of a Saharan dust outbreak based on a synergy between active and passive remote sensing. J. Geophys. Res. Atmos. 2003, 108. [Google Scholar] [CrossRef]
  41. Sugimoto, N.; Uno, I.; Nishikawa, M.; Shimizu, A.; Matsui, I.; Dong, X.; Chen, Y.; Quan, H. Record heavy Asian dust in Beijing in 2002: Observations and model analysis of recent events. Geophys. Res. Lett. 2003, 30. [Google Scholar] [CrossRef]
  42. Shimizu, A.; Sugimoto, N.; Matsui, I.; Arao, K.; Uno, I.; Murayama, T.; Kagawa, N.; Aoki, K.; Uchiyama, A.; Yamazaki, A. Continuous observations of Asian dust and other aerosols by polarization lidars in China and Japan during ACE-Asia. J. Geophys. Res. Atmos. 2004, 109. [Google Scholar] [CrossRef]
  43. Nishizawa, T.; Okamoto, H.; Sugimoto, N.; Matsui, I.; Shimizu, A.; Aoki, K. An algorithm that retrieves aerosol properties from dual-wavelength polarized lidar measurements. J. Geophys. Res. Atmos. 2007, 112. [Google Scholar] [CrossRef]
  44. Huneeus, N.; Boucher, O. One-dimensional variational retrieval of aerosol extinction coefficient from synthetic LIDAR and radiometric measurements. J. Geophys. Res. Atmos. 2007, 112. [Google Scholar] [CrossRef] [Green Version]
  45. Mamouri, R.; Ansmann, A. Potential of polarization/Raman lidar to separate fine dust, coarse dust, maritime, and anthropogenic aerosol profiles. Atmos. Meas. Tech. 2017, 10, 3403. [Google Scholar] [CrossRef] [Green Version]
  46. Tesche, M.; Ansmann, A.; Müller, D.; Althausen, D.; Engelmann, R.; Freudenthaler, V.; Groß, S. Vertically resolved separation of dust and smoke over Cape Verde using multiwavelength Raman and polarization lidars during Saharan Mineral Dust Experiment 2008. J. Geophys. Res. Atmos. 2009, 114. [Google Scholar] [CrossRef]
  47. Tesche, M.; Mueller, D.; Gross, S.; Ansmann, A.; Althausen, D.; Freudenthaler, V.; Weinzierl, B.; Veira, A.; Petzold, A. Optical and microphysical properties of smoke over Cape Verde inferred from multiwavelength lidar measurements. Tellus B 2011, 63, 677–694. [Google Scholar] [CrossRef] [Green Version]
  48. Fernald, F.G. Analysis of atmospheric lidar observations-Some comments. Appl. Opt. 1984, 23, 652–653. [Google Scholar] [CrossRef]
  49. Ansmann, A.; Riebesell, M.; Weitkamp, C. Measurement of atmospheric aerosol extinction profiles with a Raman lidar. Opt. Lett. 1990, 15, 746–748. [Google Scholar] [CrossRef]
  50. Whiteman, D.N. Examination of the traditional Raman lidar technique. II. Evaluating the ratios for water vapor and aerosols. Appl. Opt. 2003, 42, 2593–2608. [Google Scholar] [CrossRef] [Green Version]
  51. Markowicz, K.; Ritter, C.; Lisok, J.; Makuch, P.; Stachlewska, I.; Cappelletti, D.; Mazzola, M.; Chilinski, M. Vertical variability of aerosol single-scattering albedo and equivalent black carbon concentration based on in-situ and remote sensing techniques during the iAREA campaigns in Ny-Ålesund. Atmos. Environ. 2017, 164, 431–447. [Google Scholar] [CrossRef] [Green Version]
  52. Mole, M. Study of the Properties of Air Flow over Orographic Barrier. Ph.D. Thesis, University of Nova Gorica, Rožna Dolina, Slovenia, 2017. [Google Scholar]
  53. Bervida, M.; Stanič, S.; Močnik, G.; Wang, L.; Bergant, K.; Song, X. Bora Flow Characteristics in a Complex Valley Environment. Remote Sens. 2021, 13, 4363. [Google Scholar] [CrossRef]
  54. Groß, S.; Esselborn, M.; Weinzierl, B.; Wirth, M.; Fix, A.; Petzold, A. Aerosol classification by airborne high spectral resolution lidar observations. Atmos. Chem. Phys. 2013, 13, 2487–2505. [Google Scholar] [CrossRef] [Green Version]
  55. Illingworth, A.; Barker, H.; Beljaars, A.; Ceccaldi, M.; Chepfer, H.; Clerbaux, N.; Cole, J.; Delanoë, J.; Domenech, C.; Donovan, D.; et al. The EarthCARE satellite: The next step forward in global measurements of clouds, aerosols, precipitation, and radiation. Bull. Am. Meteorol. Soc. 2015, 96, 1311–1332. [Google Scholar] [CrossRef] [Green Version]
  56. Baars, H.; Kanitz, T.; Engelmann, R.; Althausen, D.; Heese, B.; Komppula, M.; Preißler, J.; Tesche, M.; Ansmann, A.; Wandinger, U.; et al. An overview of the first decade of PollyNET: An emerging network of automated Raman-polarization lidars for continuous aerosol profiling. Atmos. Chem. Phys. 2016, 16, 5111–5137. [Google Scholar] [CrossRef] [Green Version]
  57. Nikonovas, T.; North, P.; Doerr, S. Smoke aerosol properties and ageing effects for northern temperate and boreal regions derived from AERONET source and age attribution. Atmos. Chem. Phys. 2015, 15, 7929–7943. [Google Scholar] [CrossRef] [Green Version]
  58. Lee, J.; Hsu, N.C.; Bettenhausen, C.; Sayer, A.; Seftor, C.; Jeong, M.; Tsay, S.; Welton, E.; Wang, S.; Chen, W. Evaluating the height of biomass burning smoke aerosols retrieved from synergistic use of multiple satellite sensors over Southeast Asia. Aerosol Air Qual. Res. 2016, 16, 2831. [Google Scholar] [CrossRef]
  59. Carrico, C.; Gomez, S.; Dubey, M.; Aiken, A. Low hygroscopicity of ambient fresh carbonaceous aerosols from pyrotechnics smoke. Atmos. Environ. 2018, 178, 101–108. [Google Scholar] [CrossRef]
  60. Dieudonné, E.; Chazette, P.; Marnas, F.; Totems, J.; Shang, X. Lidar profiling of aerosol optical properties from Paris to Lake Baikal (Siberia). Atmos. Chem. Phys. 2015, 15, 5007–5026. [Google Scholar] [CrossRef] [Green Version]
  61. Amiridis, V.; Balis, D.; Kazadzis, S.; Bais, A.; Giannakaki, E.; Papayannis, A.; Zerefos, C. Four-year aerosol observations with a Raman lidar at Thessaloniki, Greece, in the framework of European Aerosol Research Lidar Network (EARLINET). J. Geophys. Res. Atmos. 2005, 110. [Google Scholar] [CrossRef] [Green Version]
  62. Amiridis, V.; Balis, D.; Giannakaki, E.; Stohl, A.; Kazadzis, S.; Koukouli, M.; Zanis, P. Optical characteristics of biomass burning aerosols over Southeastern Europe determined from UV-Raman lidar measurements. Atmos. Chem. Phys. 2009, 9, 2431–2440. [Google Scholar] [CrossRef] [Green Version]
  63. Giannakaki, E.; Balis, D.; Amiridis, V.; Zerefos, C. Optical properties of different aerosol types: Seven years of combined Raman-elastic backscatter lidar measurements in Thessaloniki, Greece. Atmos. Meas. Tech. 2010, 3, 569–578. [Google Scholar] [CrossRef] [Green Version]
  64. Papagiannopoulos, N.; Mona, L.; Amiridis, V.; Binietoglou, I.; D’Amico, G.; Guma-Claramunt, P.; Schwarz, A.; Alados-Arboledas, L.; Amodeo, A.; Apituley, A.; et al. An automatic aerosol classification for earlinet: Application and results. In EPJ Web of Conferences; EDP Sciences: Les Ulis, France, 2018; Volume 176, p. 09012. [Google Scholar]
  65. Janicka, L.; Stachlewska, I.; Veselovskii, I.; Baars, H. Temporal variations in optical and microphysical properties of mineral dust and biomass burning aerosol derived from daytime Raman lidar observations over Warsaw, Poland. Atmos. Environ. 2017, 169, 162–174. [Google Scholar] [CrossRef]
Figure 1. Terrain configuration of study region. The study stations are marked by the red points, including the Trnovo plateau, the Vipava valley and the Karst plateau.
Remotesensing 14 03482 g001
Figure 2. An overview of the polarization Raman lidar data analysis for aerosol type separations.
Remotesensing 14 03482 g002
Figure 3. Wind rose for downslope wind outbreak on 17 November 2017. The main wind direction was NE, with the peak wind speeds exceeding 24 m/s.
Remotesensing 14 03482 g003
Figure 4. Temporal variation of the IR lidar return on 17 November 2017 between 00:00 CET and 06:00 CET shows a stratified atmosphere with no apparent mixing between different layers. PBL was found to be below 0.4 km, the residual layer (RL) between 0.7 km and 2 km. The data was re-sampled to 18.75 m range resolution and plotted within the complete overlap range. The heights are relative to Ajdovščina.
Remotesensing 14 03482 g004
Figure 5. Radiosonde profiles from Rivolto, obtained on 17 November 2017 at 00:00 CET. (a) shows potential temperature (blue), virtual potential temperature (green) and RH (red). (b) shows wind speed (black) and wind direction (red). Horizontal lines 1.5 km denote significant gradient changes in the RH, potential temperature and wind speed profiles. The height is relative to Ajdovščina.
Remotesensing 14 03482 g005
Figure 6. Results of simultaneous measurements in the IR Mie−Rayleigh, UV Mie−Rayleigh and UV Raman channels on 17 November, 2017, 02:30−03:00 CET. Figure (a) shows the retrieved backscatter coefficients 1064 nm (red) and at 355 nm (blue); (b) the retrieved extinction coefficient at 355 nm; (c) the VDR and PDR at 355 nm; (d) LR at 355 nm and (e) the BAE between 355 and 1064 nm. The range resolution of backscatter coefficients, VDR, PDR and BAE, is 37.5 m, while the extinction coefficients retrieved using Raman method and LR were calculated with a 150 m height smoothed window. The error bars stand for the uncertainties of each measured quantities; the two horizontal lines (black and green) stratified the aerosol layers.
Remotesensing 14 03482 g006
Figure 7. Distribution of LR and PDR values for 33 days with different atmospheric conditions and aerosol composition (grey). Data for Case (17 November 2017) is marked with red. LR and PDR values for biomass burning aerosols (blue) and urban pollution (green) were obtained from [18,19,20,54,55,56].
Remotesensing 14 03482 g007
Figure 8. Temporal variation of the retrieved aerosol observables on 17 November 2017 between 00:00 and 06:00 CET. (a) RH, (b) BC concentration and (c) AAE between 470 and 950 nm were obtained at Otlica site, and (d) extinction coefficient, (e) LR, (f) PDR at 355 nm and (g) Backscatter BAE between 355 and 1064 nm were obtained from lidar measurements at the same height with Otlica site, while the SSA at 370 nm (h) was calculated combining lidar and aethalometer measurements. All the data was re-sampled over 30 min. Error bars of each points indicate the uncertainties of corresponding parameters. Horizontal lines indicate the mean value of each corresponding parameters.
Remotesensing 14 03482 g008
Figure 9. Air-mass flow trajectories for a period of 48 h, obtained by the HYSPLIT model. (a) Forward trajectories originating over Vipava valley at 07:00 CET (UTC + 1) on 17 November 2017 at the altitudes of 1000 m, 1500 m and 2000 m (blue, red and green); (b) backward trajectories arriving over Corsica at 07:00 CET (UTC + 1) on 19 November 2017 at the altitudes of 100 m, 300 m and 500 m (blue, red and green), the trajectories were mainly from above the Viapva valley.
Remotesensing 14 03482 g009
Figure 10. Temporal variation of the IR lidar return on 22 December 2017 between 00:00 CET and 06:00 CET shows stratified atmosphere with no apparent mixing between different layers. PBL was found to be below 0.5 km, the residual aerosol layer (AL) between 0.5 km and 1.5 km and cloud layer (EAL) above 2.5 km with peak backscattering at about 00:00 to 02:00 CET. The data was re-sampled to 18.75 m range resolution and plotted within the complete overlap range. The heights are relative to Ajdovščina.
Remotesensing 14 03482 g010
Figure 11. Radiosonde profiles from Rivolto, obtained on 22 December 2017 at 00:00 CET. Left: (a) potential temperature (blue), virtual potential temperature (green) and RH (red). Right: (b) wind speed (blue) and wind direction (red). Horizontal lines at 0.7 km and 1.4 km denote significant slope changes in the RH, potential temperature and wind speed profiles. The height is relative to Ajdovščina.
Remotesensing 14 03482 g011
Figure 12. Results of simultaneous measurements in the IR Mie-Rayleigh, UV Mie-Rayleigh and UV Raman channels on 22 December 2017, 01:10–01:40 CET. (a) Backscatter coefficients at 1064 nm (red) and at 355 nm (blue); (b) extinction coefficient at 355 nm; (c) the VDR and PDR at 355 nm; (d) LR at 355 nm and (e) the BAE between 355 and 1064 nm. Range resolution of the backscatter coefficients retrieved using Klett method, VDR, PDR and BAE is 37.5 m, while the backscatter and extinction coefficients retrieved using Raman method and LR were calculated with a 150 m height smoothed window. Error bars stand for the uncertainties of the measured quantities and the two horizontal lines (black and green) denote stratified aerosol layers.
Remotesensing 14 03482 g012
Figure 13. Distribution of LR and PDR values for 33 days with different atmospheric conditions and aerosol composition (gray). Data for case (22 December 2017) is marked with red. LR and PDR values for biomass burning aerosols (blue) were obtained from references [18,19,20,55,56].
Remotesensing 14 03482 g013
Figure 14. Temporal variation of the observed aerosol observables on 22 December 2017 between 00:00 and 06:00 CET. (a) RH, (b) BC concentration and (c) AAE between 470 and 950 nm were obtained at Otlica site, and (d) extinction coefficient, (e) LR, (f) PDR at 355 nm and (g) BAE between 355 and 1064 nm were obtained from lidar measurements at the equivalent height with Ot site, while the SSA at 370 nm (h) was calculated combining lidar and aethalometer measurements. All data was re-sampled over 30 min. Error bars indicate the uncertainties and horizontal lines the mean value of corresponding quantities.
Remotesensing 14 03482 g014
Figure 15. (a) Aerosol classification for 33 investigated cases based on the LR and PDR at 355 nm in a number of different weather conditions and with different predominant aerosols (marine, marine mixed with local, local combustion, local biomass burning, local aged biomass burning, mineral dust mixed with local); (b) distributions of BAE between 355 and 1064 nm and LR at 355 nm in the same constituent of aerosol corresponding with (a).
Remotesensing 14 03482 g015
Figure 16. Occurrence distribution of vertical LR profiles (a) and vertical PDR profiles (b), both retrieved at 355 nm. The number of occurrences in each bin is color-coded.
Remotesensing 14 03482 g016
Figure 17. Occurrence distributions of (a) total aerosol backscatter coefficient, (b) total aerosol extinction coefficient, (c) dust fraction in total aerosol backscatter coefficient, (d) marine fraction in total aerosol backscatter coefficient, (e) combustion fraction in total aerosol backscatter coefficient, (f) dust extinction coefficient, (g) marine extinction coefficient, (h) combustion extinction coefficient. Color indicates occurrence frequency.
Remotesensing 14 03482 g017
Table 1. Aerosols in the observed aerosol layers (EAL and PBL) were characterized using observables sensitive to intrinsic aerosol properties. PDR and LR were obtained at 355 nm, while the BAE was retrieved using both 355 nm and 1064 nm backscatter coefficients. Predominant aerosol type was chosen based on the values of aerosol optical properties of particular aerosol types, investigated in reference papers, and listed in the last column.
LayerHeight [km]PDR [%]LR [sr]BAEAerosol TypeReference
EAL 0.5 1.5 4–570–100 1.5 –2biomass burning[18,55,56]
PBL<0.54701biomass burningsame ref.
Table 2. The mean occurrence frequency of presence, predominance (fraction in total aerosol backscatter coefficient is bigger than 50%) and absence in total aerosol for marine, combustion and mineral dust aerosols throughout whole investigated profiles are listed.
Aerosol TypePresence [%]Predominance [%]Absence [%]
marine631737
combustion100740
mineral dust34966
Publisher’s Note: MDPI stays neutral with regard to jurisdictional claims in published maps and institutional affiliations.

