Article

A New Algorithm of Atmospheric Boundary Layer Height Determined from Polarization Lidar

1
Key Laboratory for Semi-Arid Climate Change of the Ministry of Education, College of Atmospheric Sciences, Lanzhou University, Lanzhou 730000, China
2
Collaborative Innovation Center for Western Ecological Safety, Lanzhou University, Lanzhou 730000, China
3
Institute of Desert Meteorology, China Meteorological Administration, Urumqi 830002, China
*
Author to whom correspondence should be addressed.
Remote Sens. 2022, 14(21), 5436; https://doi.org/10.3390/rs14215436
Submission received: 31 July 2022 / Revised: 21 October 2022 / Accepted: 23 October 2022 / Published: 28 October 2022

Abstract

:
Accurately determining the atmospheric boundary layer height (ABLH) is needed when one is addressing the air quality-related issues in highly urbanized areas, as well as when one is investigating issues that are related to the emission and transport of dust aerosols over the source region. In this study, we propose a new ABLH retrieval method, which is named ADEILP (ABLH that is determined by polarization lidar); it is based on the short-term polarized lidar observation that took place during the intensive field campaign in July 2021 in Tazhong, the hinterland of Taklimakan Desert. Furthermore, we conducted comparisons between the ABLH that was identified using a radiosonde (ABLHsonde), the ABLH that was identified by ERA5 (ABLHERA5) and the ABHL that was identified by ADELIP (ABLHADELIP), and we discussed the implications of the dust events. The ADELIP method boasts remarkable advancements in two parts: (1) the lidar volume linear depolarization ratio (VLDR) that represented the aerosol type was adopted, which is very effective in distinguishing between the different types of boundary layers (e.g., mixing layer and residual layer); (2) the idea of breaking up the entire layer into sub-layers was applied on the basis of the continues wavelet transform (CWT) method, which is favorable when one is considering the effect of fine stratification in an aerosol layer. By combining the appropriate height limitations, these factors ensured that there was good robustness of the ADELIP method, thereby enabling it to deal with complex boundary layer structures. The comparisons revealed that ABLHADELIP shows good consistency with ABLHsonde and ABLHERA5 for non-dust events. Nevertheless, the ADELIP method overestimated the stable boundary layer and underestimated the heights of the mixing layer. The dust events seem to be a possible reason for the great difference between ABLHERA5 and ABLHsonde. Thus, it is worth suggesting that the influence that is caused by the differences of the vertical profile in the ERA5 product should be carefully considered when the issues on dust events are involved. Overall, these findings support the climatological analysis of the atmosphere boundary layer and the vertical distribution characteristics of aerosols over typical climatic zones.

1. Introduction

The atmospheric boundary layer (ABL) is defined as the lowest part of the atmosphere that is directly associated with and strongly affected by Earth’s surface. It plays a crucial role in the exchanges of energy and material between the free atmosphere and Earth’s surface that take place [1]. Based on the thermodynamic stability in the lower atmosphere, the ABL can be classified into three dominant types: (1) the stable boundary layer (SBL); (2) the neutral boundary layer (NBL); (3) the convective boundary layer (CBL, also a mixing layer that is derived from a tracer) [2,3,4]. Over land, diurnal surface heating produces a clear cycle in the ABL height [4]. After sunrise, the surface heating drives convective processes that generate labile conditions to form the CBL, which can be as high as 5 km under extreme conditions [5,6]. After sunset, ground cooling induces the SBL. Due to the reduced solar input and decaying buoyancy, the CBL degrades and decouples from the ground during this period and converts to the residual layer (RL) that is located above the SBL. The ABL height (ABLH) is a meteorological variable that is commonly used to characterize the vertical extent of near-surface transport and the process of dispersion, as well as the height at which the exchange with the free troposphere takes place [7,8]. Therefore, ABL is also a key parameter in weather, climate and air quality models [7,9,10]. Typically, the ABLH affects the available volume that anthropogenic pollutants which are emitted at the surface can occupy, thereby affecting their concentration, and consequently, the air quality [11]. For this reason, a shallow ABLH leads to an increase in the air pollutants, meanwhile, the understandable rise of the ABLH induces the decline of the pollutants [12]. In addition, the ABLH is involved in many predictive and diagnostic methods and models that assess pollutant concentrations [7,12,13]. Over the dust source regions, the variation in the ABLH deeply impacts the emission and transport of dust aerosols [14]. For instance, the development of the ABLH transports aerosol particles of various sizes in a vertical direction, while the small-sized aerosol particles remain at high altitudes and are transported horizontally with the free atmosphere; the larger particles finally fall back to the ground [15]. Therefore, accurately determining the ABLH is needed for one to tackle air quality-related issues in highly urbanized area and investigate the emission and transport of dust aerosol issues over the dust source regions.
The ABLH can be determined using the different measurements, which are based on various physical basics. The traditional approach for the identification of the ABLH is conducted using in situ observations of the air temperature, humidity and wind using a radiosonde [7], and subsequently, the ABLH can be identified according to the thermodynamic vertical structure. The ABLH, which is retrieved using a radiosonde, has been considered as a reference for evaluating the results from other measurements and models [16]. The regular radiosondes are often launched only twice a day [7], although these instruments can be used up to eight times per day during the intensity observation period; the spatial coverage and temporal resolution of the radiosonde is usually limited for revealing the ABLH temporal-spatial variability [17]. Ground-based remote sensing equipment is widely used to determine the ABLH, owing to their high-resolution of temporal data and good vertical spatial resolution. According to the different modes of detection of the physical quantities, these instruments can be divided into three categories: (1) thermodynamic observation, such as Raman lidar, radio-acoustic sounding systems and radiometers, which are used to identify the ABLH by the brightness temperature, the potential temperature and the humidity; (2) Dynamics or turbulence observation, such as sodar, radar wind profiler and Doppler wind lidar, which are used to identify the ABHL by the velocity components of the wind vector and turbulent kinetic energy, etc.; (3) Tracer observations, e.g., aerosol lidar, which are used to identify the ABHL using a backscatter coefficient, a depolarization ratio or a color ratio [3]. The Slope Detection and Ranging (SLODAR) technique [18] can also been used to develop methods to identify the ABLH by detecting turbulence variation [19]. It should be noted that the ABLHs that are defined by these three types of physical quantities are different. Beyrich and Leps [20] realized that there were systematic differences among the three types of ABLH as the result of turbulent inhomogeneity of the SBL. Similarly, it is common in studies that the CBL height from the aerosol-based methods peaks up to 2 h later than that which was diagnosed from the turbulence data [21,22].
Among the aforementioned methods, aerosol lidar is the most commonly used one to detect the ABLH. There are two foundations that the lidar-derived method for ABLH retrieval is predominately based on: (1) Aerosol particles are concentrated in the boundary layer, which are significantly more concentrated than the particles in the free atmosphere are [23]. (2) In the transition zone between the boundary layer and the free atmosphere, the entrainment process involves the upper dry and clean atmosphere into the boundary layer, thereby resulting in an obvious time fluctuation in the aerosol concentration locally, moreover, the lidar signal shows a strong time variation, that is to say that a large variance exists in the time domain [24]. On this basis, five classical methods have been developed using the lidar return signal profile: (1) The gradient method considers that the height where the extremum exists as the ABLH, including the first-order gradient method [25,26], the inflection point method [27], the logarithm gradient method [28] and the cubic root gradient method [12]. (2) The threshold method generally defines the ABLH as the height of the lidar backscattering signal or the signal gradient exceeding the certain threshold [23,29,30]. (3) The ideal profile method, also known as the curve fitting method, constructs the ideal signal profile to fit the measured lidar signal profile [31,32], and subsequently, the gradient method, or other ones, are applied to this ideal profile to retrieve the ABLH. (4) The variance method defines the height of the maximum variance which appears in the vertical profile of the variance or standard deviation as the ABLH [24,33,34]. (5) The continuous wavelet transform (CWT) method has already been proved to be a suitable tool for an automatic and minimal supervised identification of the ABLH [35,36]. The wavelet transform coefficients in this method can quantify the similarity between the lidar signal and the wavelet profile to examine the ABLH. Often, the wavelet functions of Haar [37] and Mexican hat (MHAT) [36,38] are used because their shapes are similar to that of the lidar signal profile. In addition to the five classical methods, more developed methods have been proposed to deal with the ABLH retrieval of complex aerosol structures, such as the newly announced MR-IP (multilayer recognition and idealized-profile) method, which divides the ABL aerosols from the non-ABL aerosols by identifying multiple extremes in the backscattering derivative [39] and backscattering-based image processing [11,40]. As mentioned above, the lidar backscatter signal is only highlighted among the existing literature. However, other variables (e.g., the depolarization ratio) provided by lidar are rarely considered.
The volume linear depolarization ratio (VLDR), which can indicate the shape of atmospheric particles, is a key parameter to distinguish the aerosol types. It is defined as the ratio of the perpendicular component to the parallel component in the lidar return signals. The lower the VLDR is, then the more regular (or spherical) the particle shape is; the higher the VLDR is, then the more irregular (or elongated shape) the particle shape is. Occasionally, to a certain extent, the size of aerosol particles can also contribute to the VLDR. For example, the study that was conducted by Kandler et al. [15] showed that the larger aerosol particles tended to be acicular or irregular over the Sahara Desert, which reflects a higher VLDR, while the smaller aerosol particles tended to be spherical or regular in shape, which resulted in a lower VLDR. The different aerosol types exhibit a clear difference in the VLDR, moreover, the VLDR of a particular aerosol also varies, depending on how long it remains in the atmosphere [41,42,43,44,45]. Because of this, the VLDR can be considered to determine the ABLH, together with the lidar return signal. Firstly, it is generally difficult to identify weak aerosol layers using the lidar return signal, while the VLDR is capable of clearly capturing the temporal-spatial variation of the weak aerosol layers and the fine stratification of the aerosol layer. Secondly, the aerosol particles in the CBL are fresher than those in the RL because there is a longer suspension time for the aerosol particles in the RL than there is for the CBL. The length of the suspended duration will affect the aerosol ageing process, which can be indicated by the particle shape. Thus, this difference of VLDR in the mixing layer and RL provides favorable conditions for the ABLH retrieval, especially when the mixing layer has developed vigorously. As shown by the previous study, a novel method called POLARIS, which combines the lidar return signal and the VLDR, was initially developed to estimate the ABLH of the respective case in Granada, Spain [46]. The same technique was also used to study the ABLH in Beijing [16]. Owing to the limitations of the algorithm basis and the application scenarios, the POLARIS method can be ambiguous when it is utilized to determine the ABLH in the scenarios of complex aerosol vertical structures, especially over dust sources. Therefore, it is necessary to develop a new approach of accurately determining the ABLH using extra variables to meet the needs of dealing with complicated situations.
In addition, the desert region is one of the major emission sources of global dust aerosol particles, and the evolution of the ABLH over this region significantly affects the emission and transport of dust aerosols [14,15]. However, due to the relatively scarce meteorological observation activities over desert areas, our understanding of the characteristics of the ABL in these regions is very limited. Usually, the reanalysis dataset products are used to replace the radiosonde measurements. Consequently, the accuracy of the reanalysis dataset becomes very important. As pointed out by a previous study that evaluated four reanalysis products and investigated the global climatology of the ABLHs, there were great differences in the ABLH which was provided by the reanalysis products and the radiosonde measurements over the arid and semiarid regions of China (e.g., Taklimakan desert dust source) when it was compared with that of other climatic zones [47]. Additionally, Huang et al. [42] revealed a large error near the ground between the radiosonde and the reanalysis dataset products. However, as of yet, studies have not focused any attention on the cause that produces these differences in these studies. Thus, the study of the ABL, based on the observations over desert or dust regions, is critical to improve the understanding of issues that are associated with it.
Based on the above, a new approach was developed using the ground-based polarization lidar measurement that was taken during a field observation period at Tazhong, the hinterland of the Taklimakan Desert. The evaluation and validation of the new approach were also conducted using the radiosonde data and the ERA5 reanalysis product. Furthermore, the potential cause of the differences between the ABLH that was identified using ERA5 (ABLHERA5) and the ABLH that was identified using the radiosonde (ABLHsonde) is given. In Section 2, the overviews of the campaign, the instruments that were used, as well as the new method are described. The description of the effects of each method on the different types of cases, the validation of new methods and the main results are also included in Section 3. Finally, the discussion and summary are stated in Section 4.

2. Data and Methods

2.1. Field Campaign

As shown in Figure 1, Tazhong is located in the center of the Taklimakan Desert, which is the second largest mobile desert in the world. The maximum temperature that was observed during our campaign was 44.2 ℃, while the minimum temperature was 18.6 ℃. The observation station is mainly surrounded by mobile sand dunes with almost no vegetation cover.
With the aim of investigating the aerosol vertical distribution in the dust source area, the field campaign was carried out from 1 July 2021 to 31 July 2021. The major instruments included ground-based dual-wavelength polarization lidar, a radiosonde, an automatic weather station and an unmanned aerial vehicle (UAV) platform that was loaded with multiple atmospheric composition sensors. The lidar was installed at the Tazhong meteorological station, which is about 7 km away from the location where the radiosonde and UAV observation were executed. In this study, the observations from the lidar and radiosonde were only used to develop the ABLH identification algorithm.

2.2. Instruments

2.2.1. Radiosonde

The GPS radiosonde system was manufactured by Beijing Changfeng Microelectronics Technology Co., Ltd., Beijing, China. The system mainly consists of GPS radiosonde, model CF-06, and a ground antenna receiving system. The frequency of data acquisition was 1 Hz, and the average speed of the sounding balloon was 300 m/min. The meteorological elements that were provided by the system included air temperature, air pressure, relative humidity, and wind speed/direction. The sounding observation was carried out every 6 h between 1 July and 31 July in Beijing time: 01:15, 07:15, 13:15 and 19:15. In addition, the intensive observations were also carried out at 04:15 and 22:15 between 6 July and 15 July and at 10:15 and 16:15 between 12 July and 21 July. In this study, the data were aggregated and they were averaged with the vertical resolution of 10 m.

2.2.2. Lidar

The dual-wavelength polarization lidar that was used here was developed by Lanzhou University. It can be used for the long-term continuous automatic and unattended detection of the vertical profiles of aerosols and clouds. The system emits laser pulses at 532 nm and 1064 nm wavelengths, and collects the return signals from the atmosphere in the vertical direction; the parallel and perpendicular components at a 532 nm wavelength in addition to the total return signal at a 1064 nm wavelength were, respectively, detected. The maximum detection altitude was 20 km, and the temporal and spatial resolutions were 3 min and 7.5 m, respectively. The blind area of the system was 225 m in height. According to the methods that were recommend by previous studies [48,49,50], a series of corrections including a background noise correction, an overlap correction, and a range square correction were conducted. The effects of gain ratio of the two channels on the VLDR was also corrected. Then, the attenuated backscattering coefficient (ABC) was calculated to avoid the effects of the differences among the profiles of the backscatter signal due to the variation in the emitting laser energy. Thus, ABC is a more suitable option for the identification of the ABLH. Unfortunately, the observation data at a 532 nm wavelength from 11 July to 17 July 2021 were only used due to the lack of observations at the other time points in this study. The detailed parameters of the lidar are shown in Table 1.

2.2.3. ERA5

ERA5 was released in 2017 by ECMWF, which was a new and updated global reanalysis. Compared with it being 79 km in ERA-I, the horizontal resolution of ERA5 was 0.25° × 0.25°, which also makes it one of the reanalysis databases with the highest horizontal accuracy when it is compared with those of MERRA-2, JRA-55 and NCEP-2. In addition, the vertical resolution was increased from 60 to 137 model levels, which is up to 0.01 hPa. In addition to this, ERA5 can provide reanalysis data with a 1-h resolution. As suggested by previous studies, the ERA5 reanalysis products match the radiosonde observations well and the ABLH, which is provided by ERA5, is the least affected by the complexity of the terrain, and it is also the close to the ABLH that is retrieved using radiosonde data [42,47]. For this reason, the ERA5 reanalysis data were incorporated in our study.

2.3. Determination of ABLH

2.3.1. Richardson Number Method

Using the Richardson number (Ri) method has been demonstrated to be one of the best ways to conduct an analysis of the ABLH climatology [51]. This method considers the first height as the ABLH when the Ri is usually equal to 0.25 [52]. The Ri represents the ratio of the atmospheric static stability to the vertical wind shear, which is expressed as:
R i z = 𝛳 v s g 𝛳 v z 𝛳 v s z z s u z u s 2 + v z v s 2 + b u * 2
where z represents the height above the ground and s represents the surface, 𝛳 v represents the virtual potential temperature, u and v represent the component wind speeds. u * represents the surface friction velocity. The value b is a coefficient that is to be determined. Due to the fact that the bulk wind shear term ( u and v ) is much larger than u * , the term of b u * 2 was often ignored [52], and according to Seidel et al. [51], the surface wind was set to zero. It was suggested that 0.25 was optimum in ABLH estimation by contrasting three Ri values of 0.20, 0.25 and 0.30 [53]. The comprehensive effects of temperature, humidity, air pressure and wind were considered in this method. Therefore, it can identify the ABLH according to the thermodynamic characteristics to the greatest extent. In this study, 0.25 for Ri was applied to retrieve the ABLH.
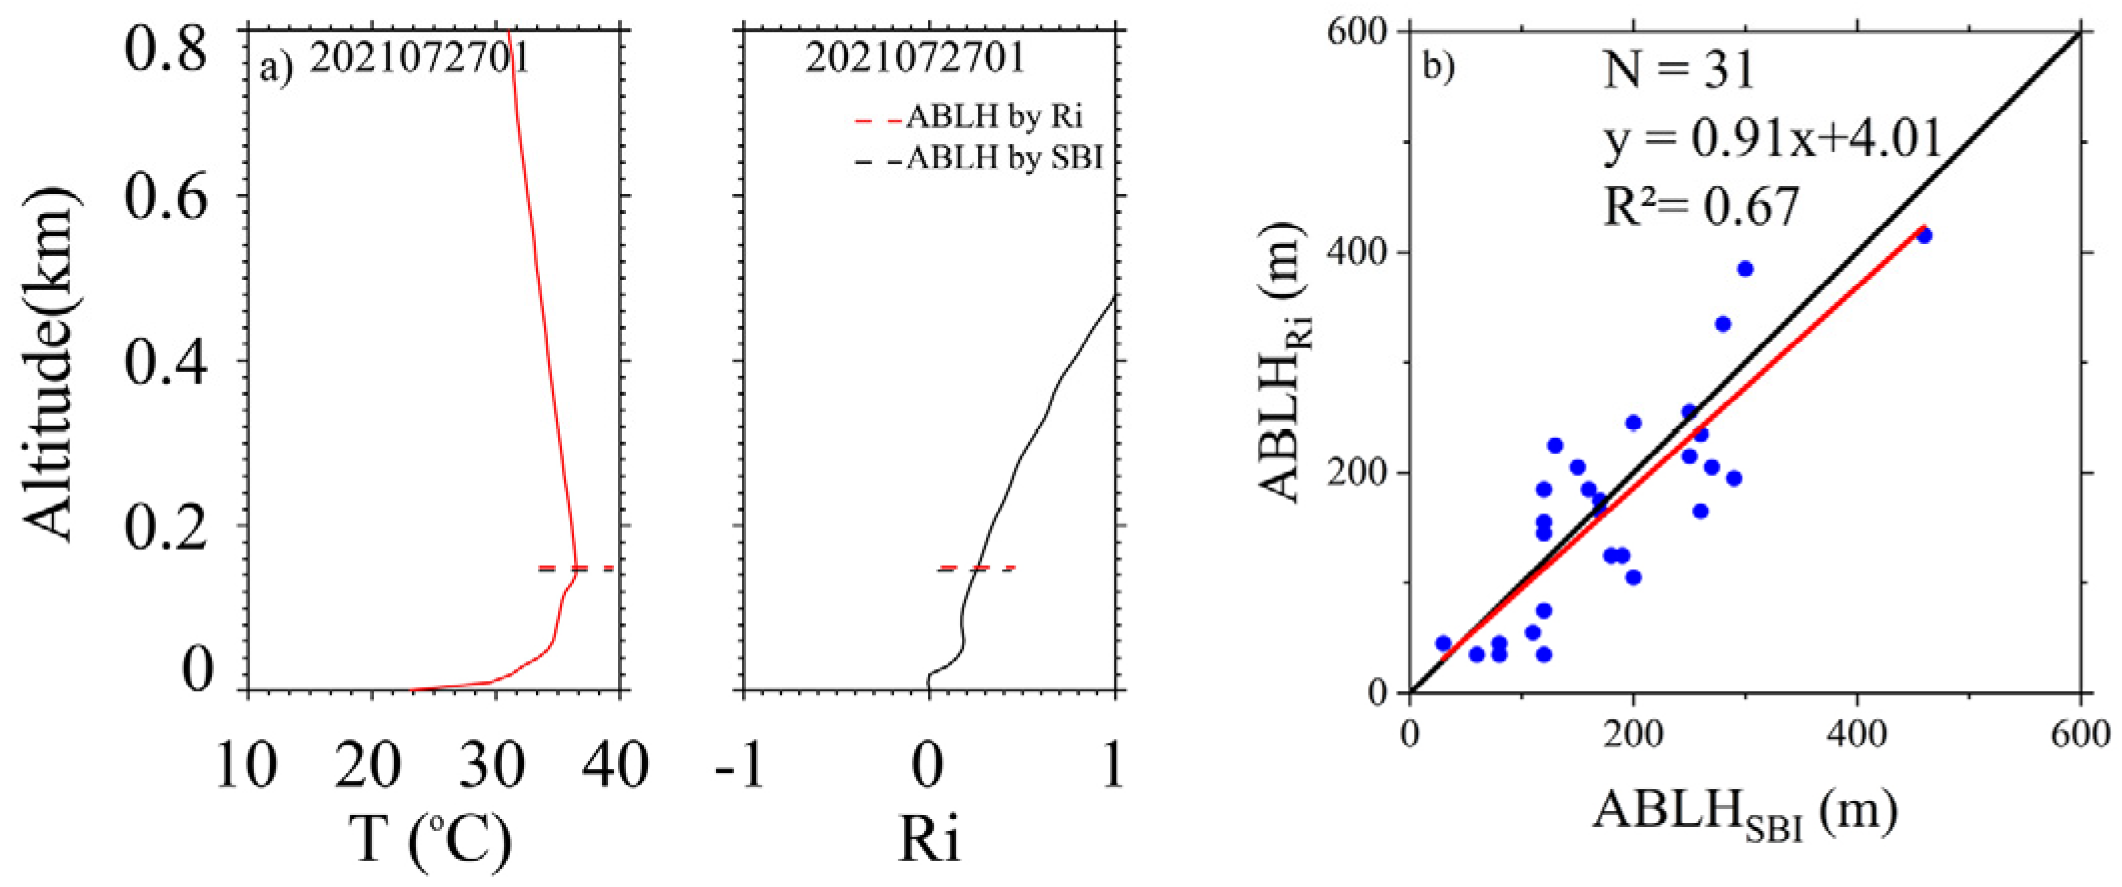
The surface-based inversion (SBI) is the most accurate criterion for judging the SBL height at night [1,54]. When the SBI is carried out, the top height of the inversion layer is defined as the SBL height. As shown in Figure 2b, the ABLHs were derived from the SBI and Ri methods, respectively, and they have been compared. The difference between the ABLHs is 5 m in Figure 2a. We made a comparison of the SBL height in all of the SBI cases that occurred during our campaign. The Ri method reveals that there is a good agreement with an R2 of 0.67. These also confirmed the reliability of the Ri method to identify the ABLH.

2.3.2. CWT Method

The CWT has been used widely because the advantage of its automatic operation and because it is less affected by the signal-to-noise ratio. The CWT processes the profile data with different wavelet functions to generate the convoluted data with different scales. Here, the CWT with the MHAT wavelet function is calculated as:
g z b a = 1 z b a 2 e 1 2 z b a 2
w f a , b = 1 a z 0 z t f z g z b a d z
where g represents the MHAT wavelet functions, which is defined as the second derivative of the Gaussian function [36,38], a represents the dilation of the MHAT wavelet and b represents translation factor. f z represents the first-order gradient of the signal profile and w f represents the wavelet coefficient. The shape of the MHAT wavelet reveals that is has a significant similarity to that of the lidar return signal when the cloud and aerosol layers are present [36]. Compared with the Haar wavelet function, the CWT with the MHAT wavelet function is more suitable to be used to differentiate the sub-layers within the aerosol layer [55], and this is the significant foundation of our new method in this study that we have presented. Notice that the selection of the a value is not easy in the context of the ABLH determination. The smaller the a value that is selected is, then the changes that are reflected in the wavelet coefficient profile are more subtle. On the contrary, when the a value is greater, it can lead to one missing the fine structures. The covariance of wavelet coefficient profile has been defined to find the optimal a value [56]. According to the result of the wavelet profile, the choice of the values of a (such as 1 km and 32 times of (32×) height resolution, while if the height resolution was 10 m, then 32× height resolution for a was 320 m) were made in some previous research studies [6,57]. Additionally, the three a values of 420 m, 435 m and 450 m were simultaneously used to retrieve the ABLH and calculate an average value [58]. In this study, we chose a 16x height resolution as the a value based on our actual observations.
Within the frame of the CWT method, almost all of the studies emphasized the most significant feature of the wavelet coefficient profile. Furthermore, some fine stratifications within the thick aerosol layer were often given less attention. Thus, the influences of the residual aerosol layer and the elevated aerosol layer will have a pronounced disruption of the retrieval of the ABLH. This may not identify the ABLH well in complex aerosol vertical structure scenes, especially over the desert region.

2.3.3. New Algorithm: ADELIP

The combination of the advantages of the different methods is more conducive to the determination of the ABLH. In this study, the ADELIP method (the ABLH that is determined by polarization lidar) was developed on the basis of the following four considerations: (1) The height limit: the ABLHs which are retrieved by the POLARIS method are more suitable when we were representing the aerosol-derived boundary layer heights in our practical operation. This method can effectively exclude the effects of the elevated aerosol layer above the ABL during the subsequent processes of identifying the ABLH. So, these ABLHs can be used as the upper limit for the potential ABLHs. (2) The aerosol sub-layer: when the CWT with the MHAT wavelet function was applied to the first-order gradient profile of the normalized attenuated backscattering coefficient (NAB), all of the aerosol sub-layers between the blind area height and the limited height were marked by the maximum and the minimum in the CWT profile. Here, the maximum and the minimum correspond to the bottom and top of the aerosol sub-layer on a fine scale, respectively. In addition, the zones range from the blind area to the extremum, with the lowest height and range from the extremum, and where the highest height to the upper limited height were considered as the bottom-most and top-most sub-layers, respectively. (3) The aerosol type: NAB and VLDR can characterize the aerosol loading and type, respectively. The gradient profiles can sharpen the variation of the NAB and VLDR profiles on a fine scale. That is to say that there were obvious variations in the gradient profiles of NAB and VLDR once they met other aerosol layer. Meanwhile, the assumption of the homogeneous aerosol type was considered within one aerosol sub-layer. Therefore, the variance and mean values of the first-order gradients of NAB and VLDR were calculated for each aerosol sub-layer. (4) The diurnal cycle: in order to ensure that the final ABLHs are reasonable, it is necessary to constrain the preliminary ABLHs again by setting the upper limits to the diurnal cycle of the observation location.
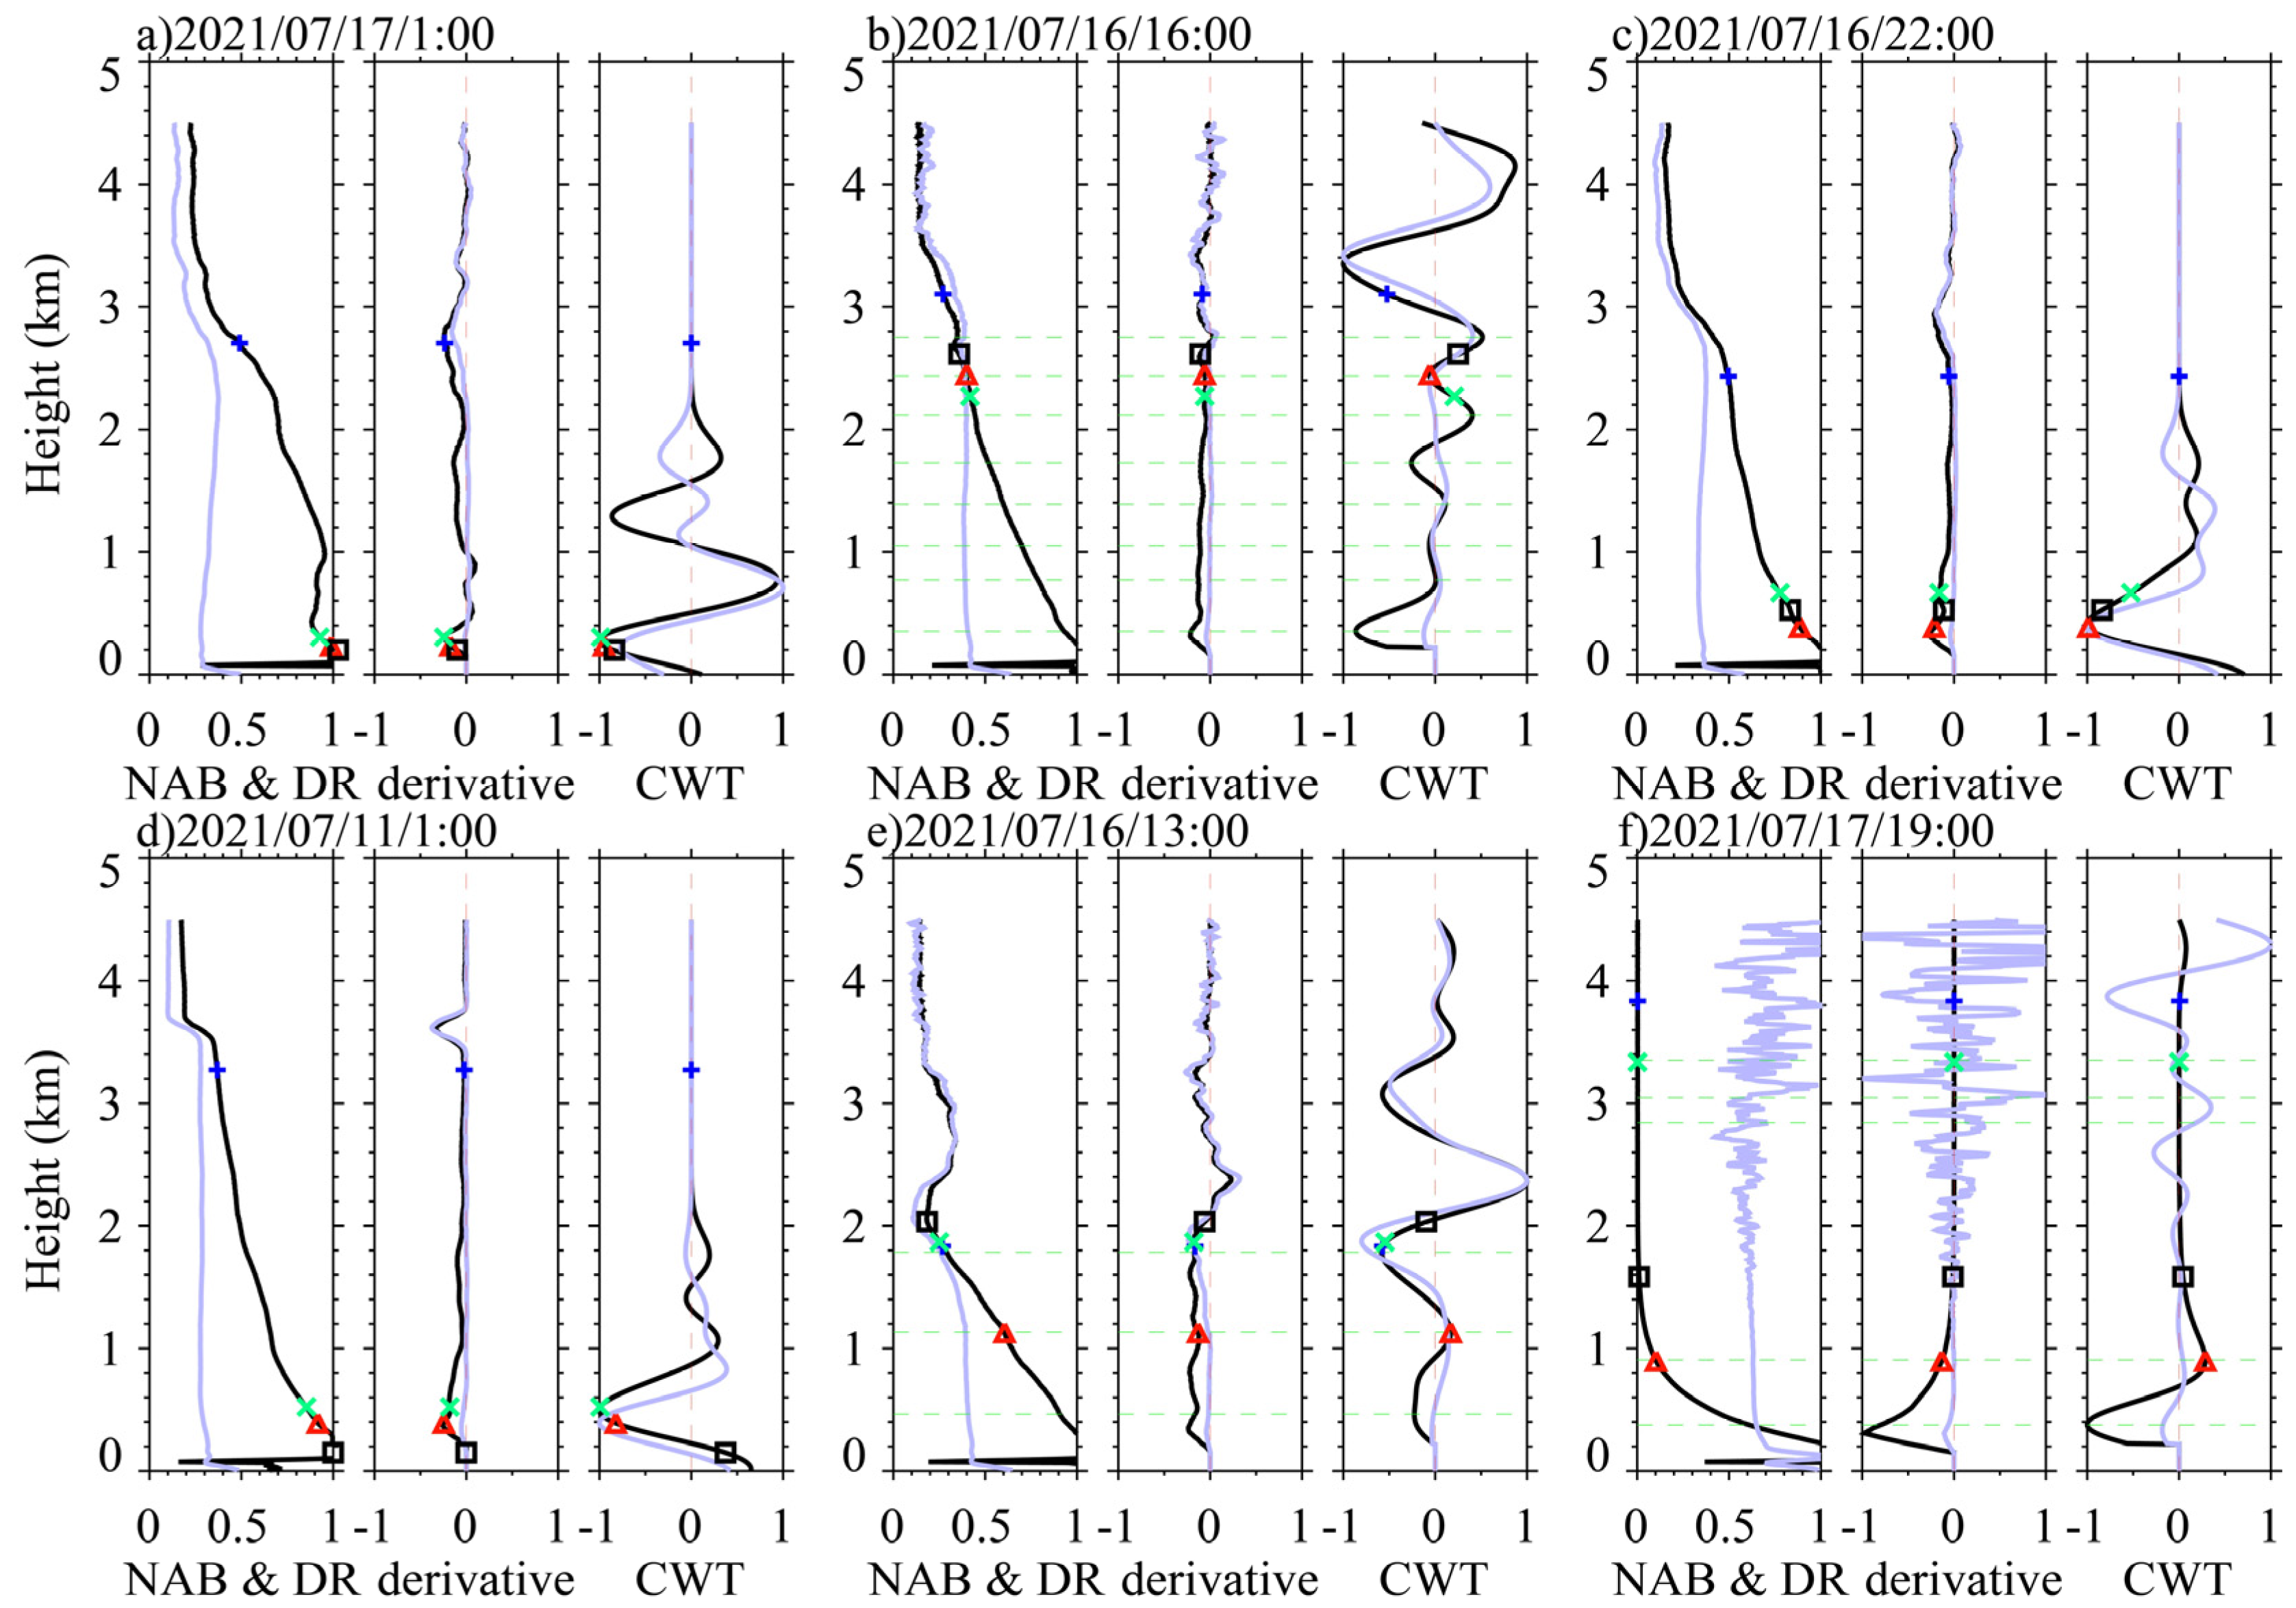
As for the response relating to the lidar return signal and to the atmosphere particles, there are two main patterns in the ABC profile that were considered when we were formulating this new algorithm. The first pattern is that the ABC increases with the height when the elevated aerosol layer appears (e.g., in Figure 3a). In this situation, the bulge in the ABC profile will lead to a large range of positive gradients. The second pattern occurs in most cases in the lidar profiles where the ABC decreases with the height, without the elevated aerosol layer existing. In fact, due to the different vertical distributions of the aerosols, there are more complex sub-types in the second pattern. As shown in Figure 3, the profile represents the uniform mixing of the aerosols in the mixing layer (Figure 3b), the residual aerosol layer (with simple structure above the SBL) (Figure 3d), the coexistence of mixing layer and the RL (Figure 3e), the decoupling of the mixing layer and the stable boundary layer around the time of the sunset (Figure 3c), as well as the smooth exponential declining profile during a dust storm (Figure 3f), respectively. Regarding the first pattern, as POLARIS could already eliminate most of the elevated aerosol layer, the positive gradient represents the bottom of the fine aerosol layer below the ABLHPOLARIS. It suggests that the actual ABLH should be lower than or equal to the bottom of the fine aerosol layer. Although almost all of the aerosol particles that are observed in the desert are dominated by dust aerosols, notably the aerosol types, concentrations, residence time in the air, as well as other physical properties in mixing layer are significantly different from those that are in the RL. These differences are exhibited in the NAB and VLDR profiles. For example, the mixing layer and the RL are seen to coexist; Figure 3e shows the small derivative variance in the VLDR profile within the mixing layers as a result of the sufficient convective mixing of the aerosols that were transported vertically from the surface, meaning that a larger variance occurred above the mixing layer. In addition, dust events of different intensities will cause a varying degree of interference too with the lidar signals. During severe dust storms, the lidar laser beam may be incapable of penetrating the dense dust layer. The maximum value of the wavelet coefficient on the NAB derivative represents the top of the dust layer.
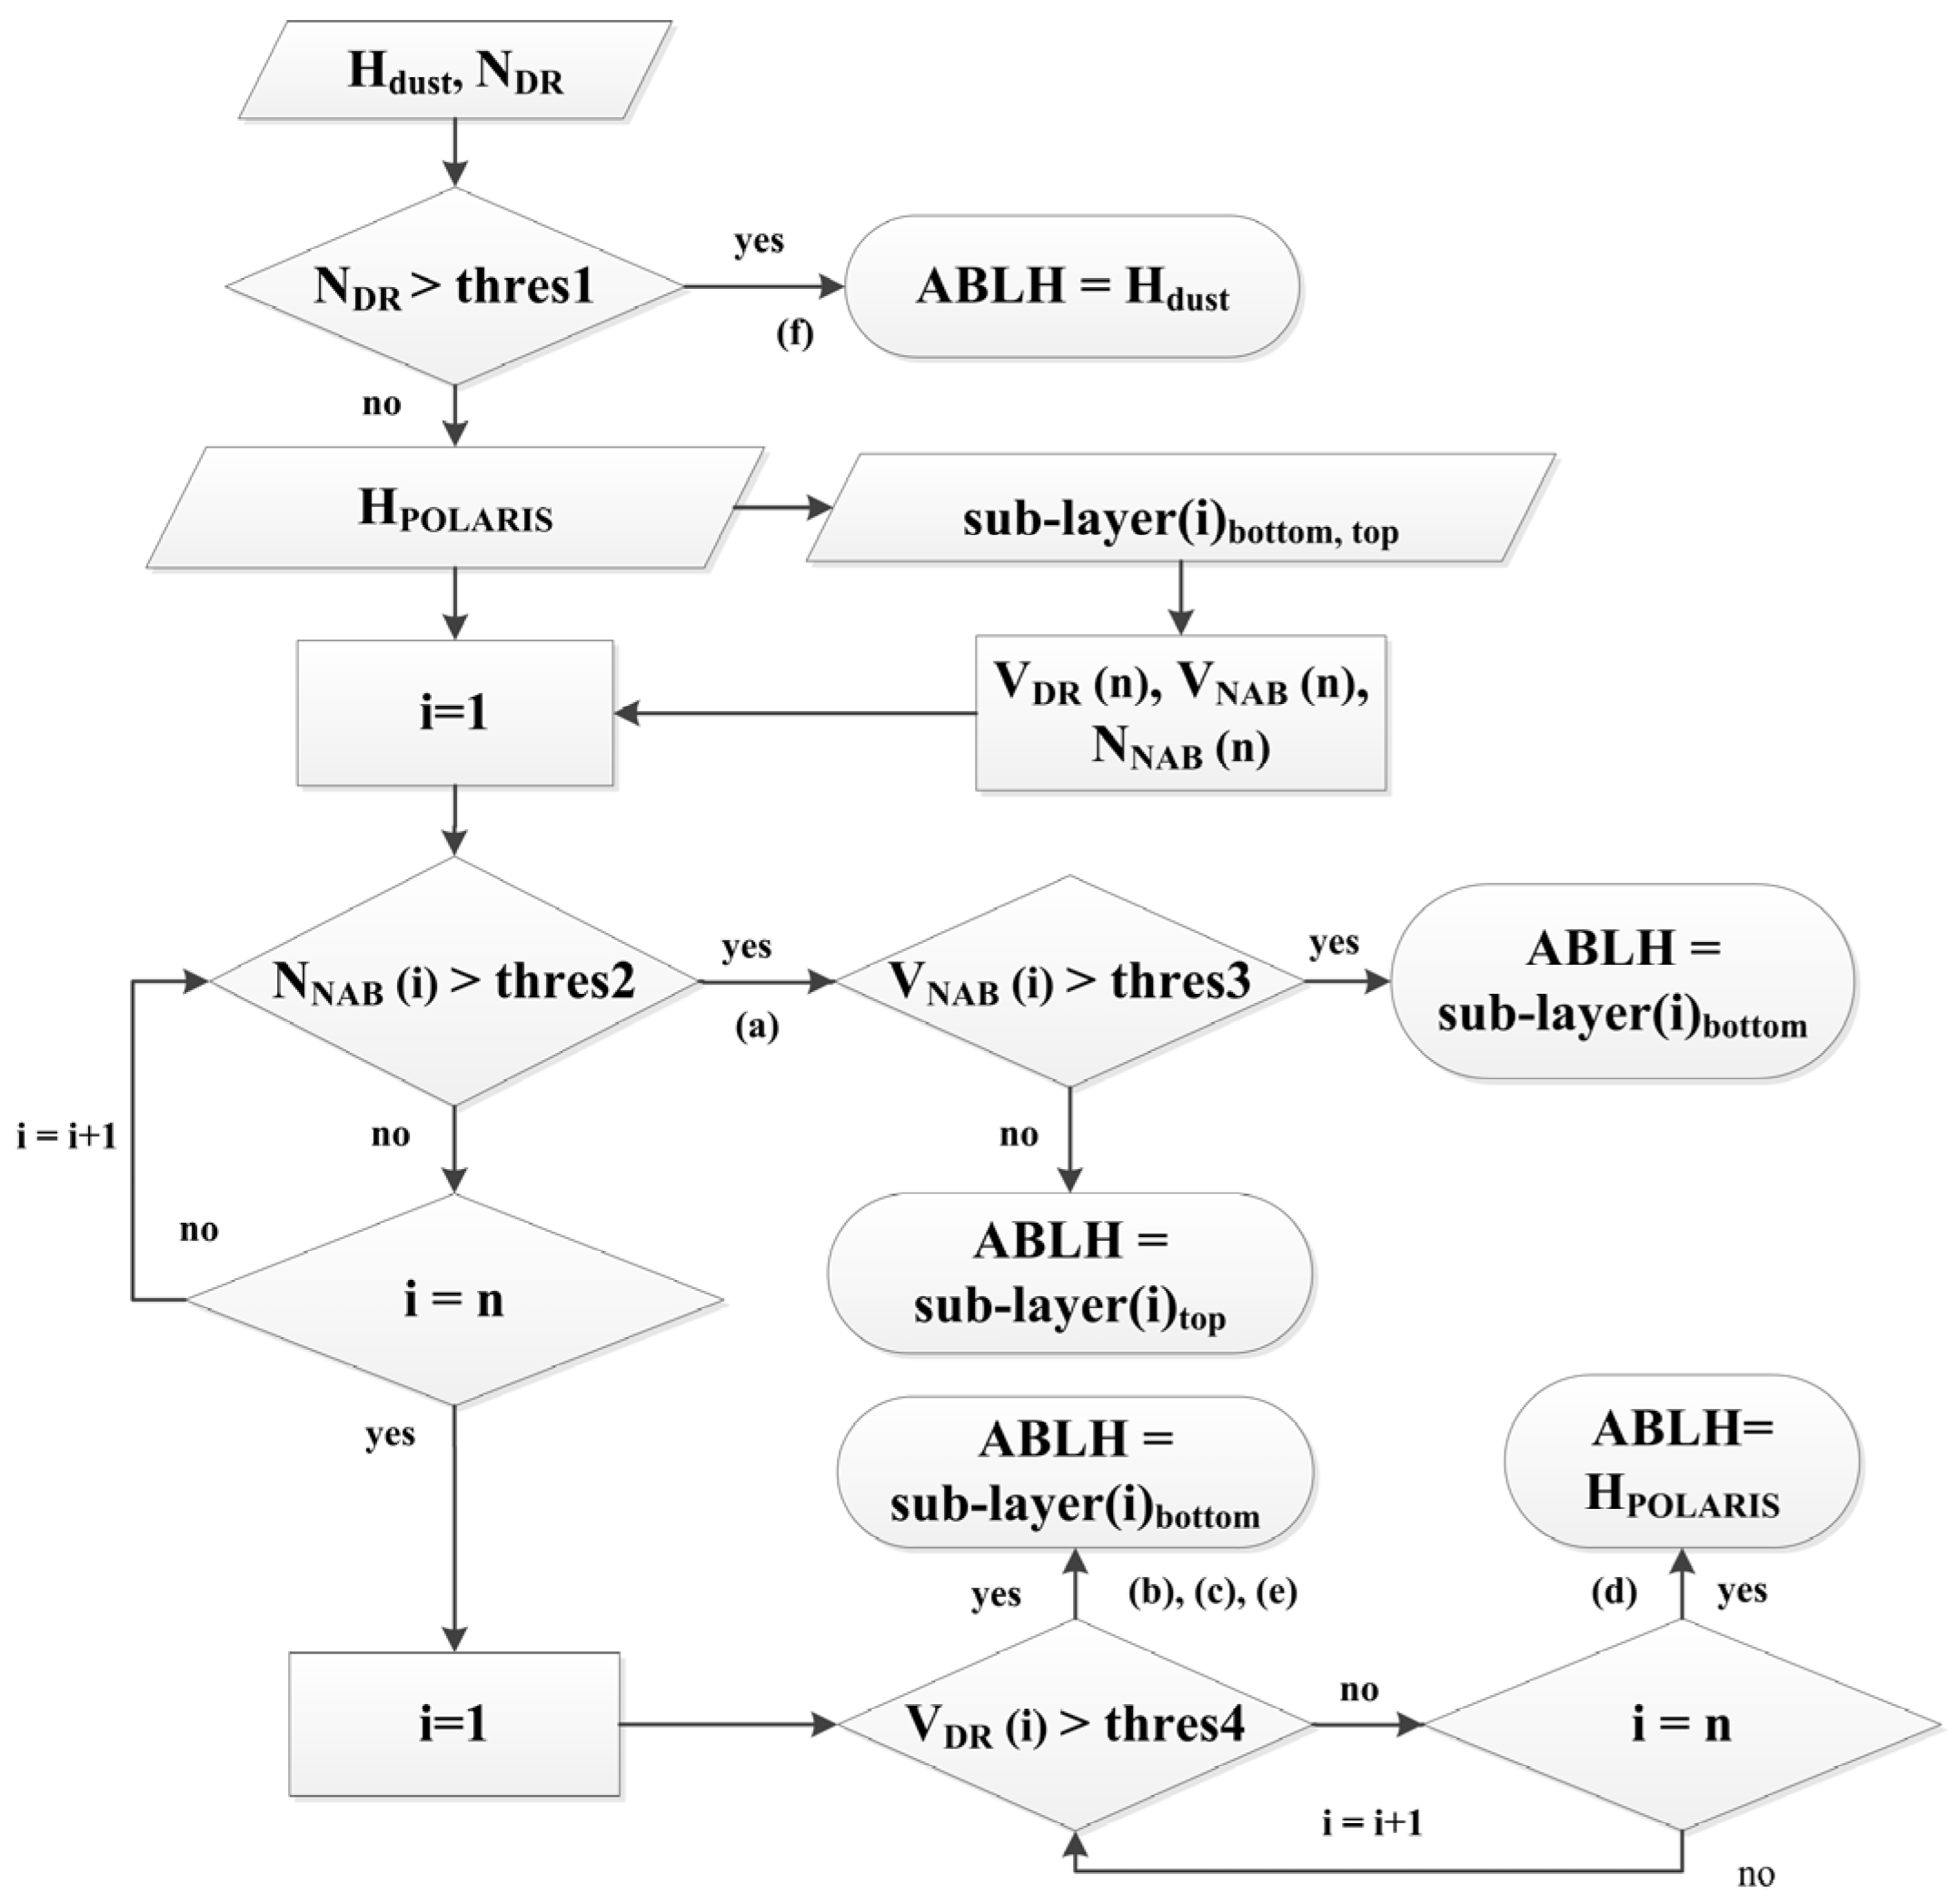
Unless it is otherwise specified, the following processes are bottom-up scanning ones. As shown in the flow chart in Figure 4, the ABLH was retrieved according to the following rules:
A positive gradient was detected in the first-order gradient of the NAB profile within the sub-layer. If the variance of the first-order gradient was greater than the threshold was, then the bottom of the sub-layer was considered as the ABLH, otherwise the top of the sub-layer was considered as the ABLH.
There was no positive gradient in the first-order gradient of the NRB profile within the sub-layer. This situation ensures the decrease in the NAB profile according to the height. Hence, the variance of VLDR derivatives was further applied. As shown in Figure 4b and Figure 5e, a large variance within the sub-layer reveals a distinct difference between the aerosol particle types. So, the bottom of the sub-layer was considered as the ABLH. This case is a hybrid, with the mixing layer having been separated with the SBL as seen in Figure 3c, thus, the bottom of the sub-layer was considered as the ABLH.
Dust events were considered separately. As shown in Figure 3f, below 2 km, if the VLDRs are greater than the dust threshold is (thresdust), then the height of the maximum value in the wavelet coefficient profile of the NAB signal was selected as the ABLH. That is, the maximum height of the dust layer thickness can be detected by lidar.
To further constrain the retrieved ABLHs, the height limitation was again set. The max height between 10:00 and 22:00 was 4.5 km, while the max height for the remaining times of the day was 1.5 km.
In addition, ADELIP sets double thresholds, the cloud bottom/top threshold and the cloud maximum threshold, to identify the base height of the middle and high clouds, which can be used to remove the influences from the clouds. As shown in Figure 6b, the dust plumes in the mixing layer could affect the temporal consistency of the ABLH during the daytime. This is because these intermittent dust plumes resulted in poor mixing within the mixing layer when they were transported vertically by the strong convective process. Therefore, the ABLH that was derived from the procedures above was further filtered and smoothened to ensure that there is temporal consistency. Each ABHL should be compared with their adjacent points to eliminate the interference from the extreme values.

3. Result and Discussion

3.1. Case Studies

Although there we only took short-term lidar measurements during the campaign, we were fortunate enough to capture the different weather conditions. Here, the three typical cases are given to evaluate the ADELIP method.

3.1.1. Case 1: A Clear Day

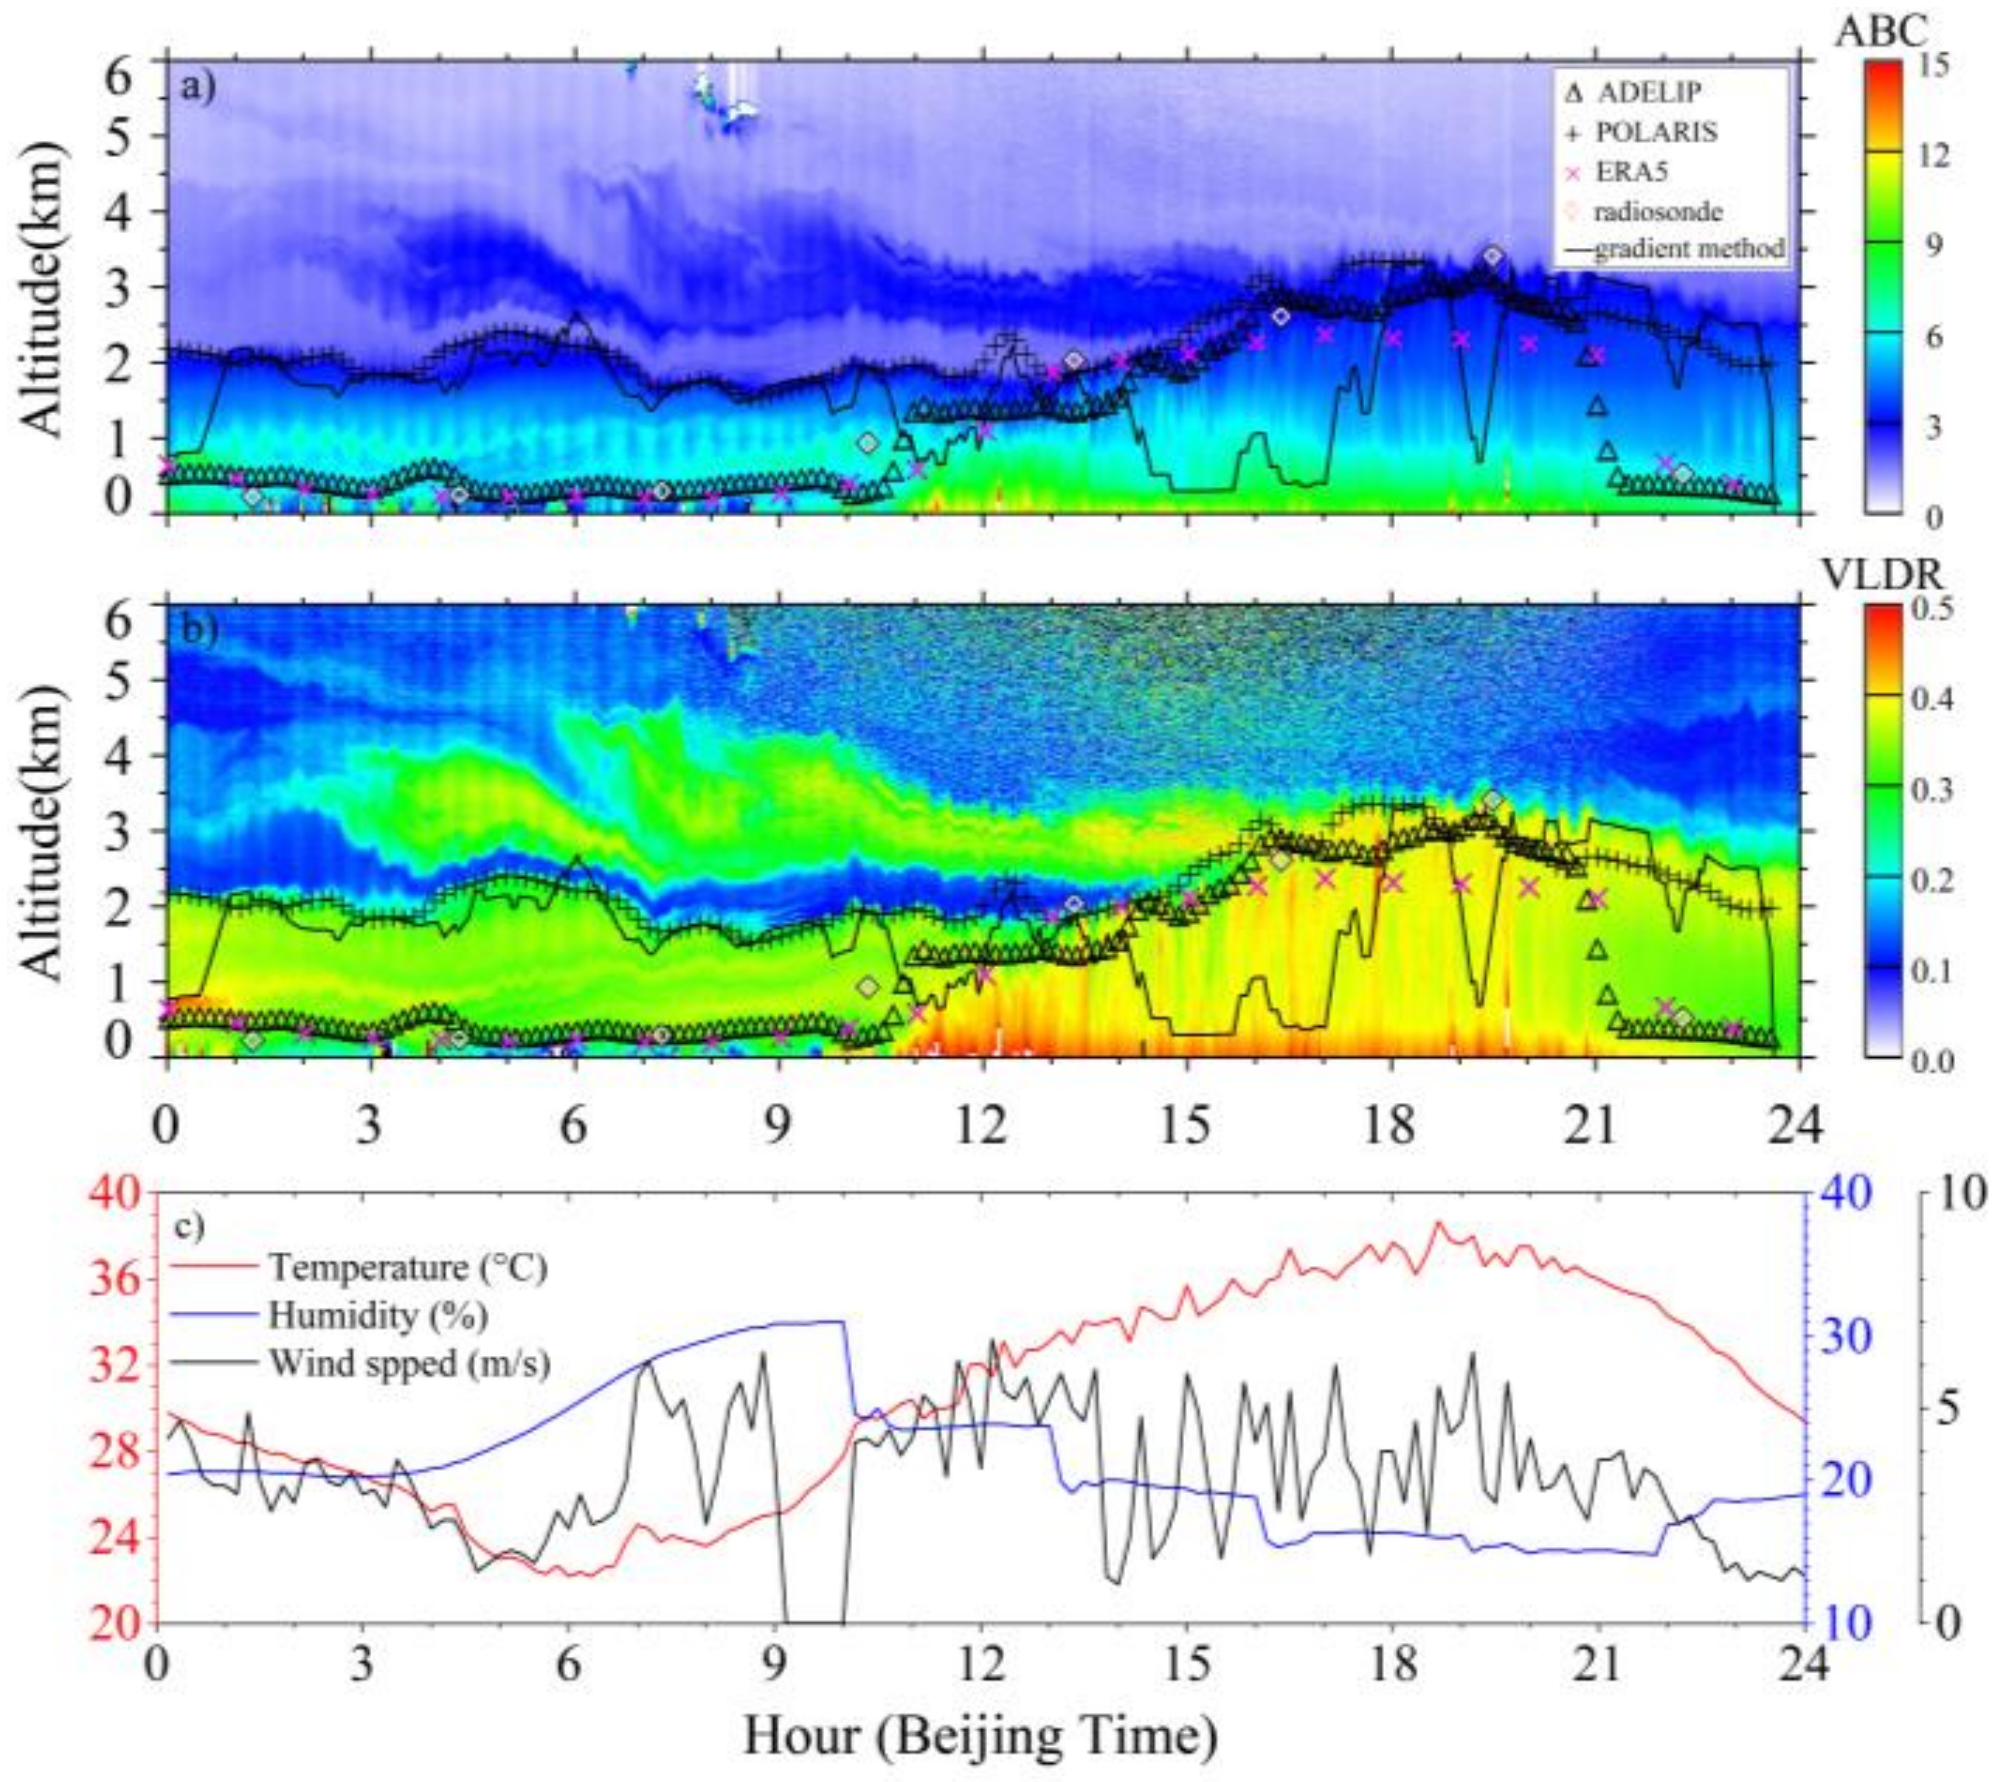
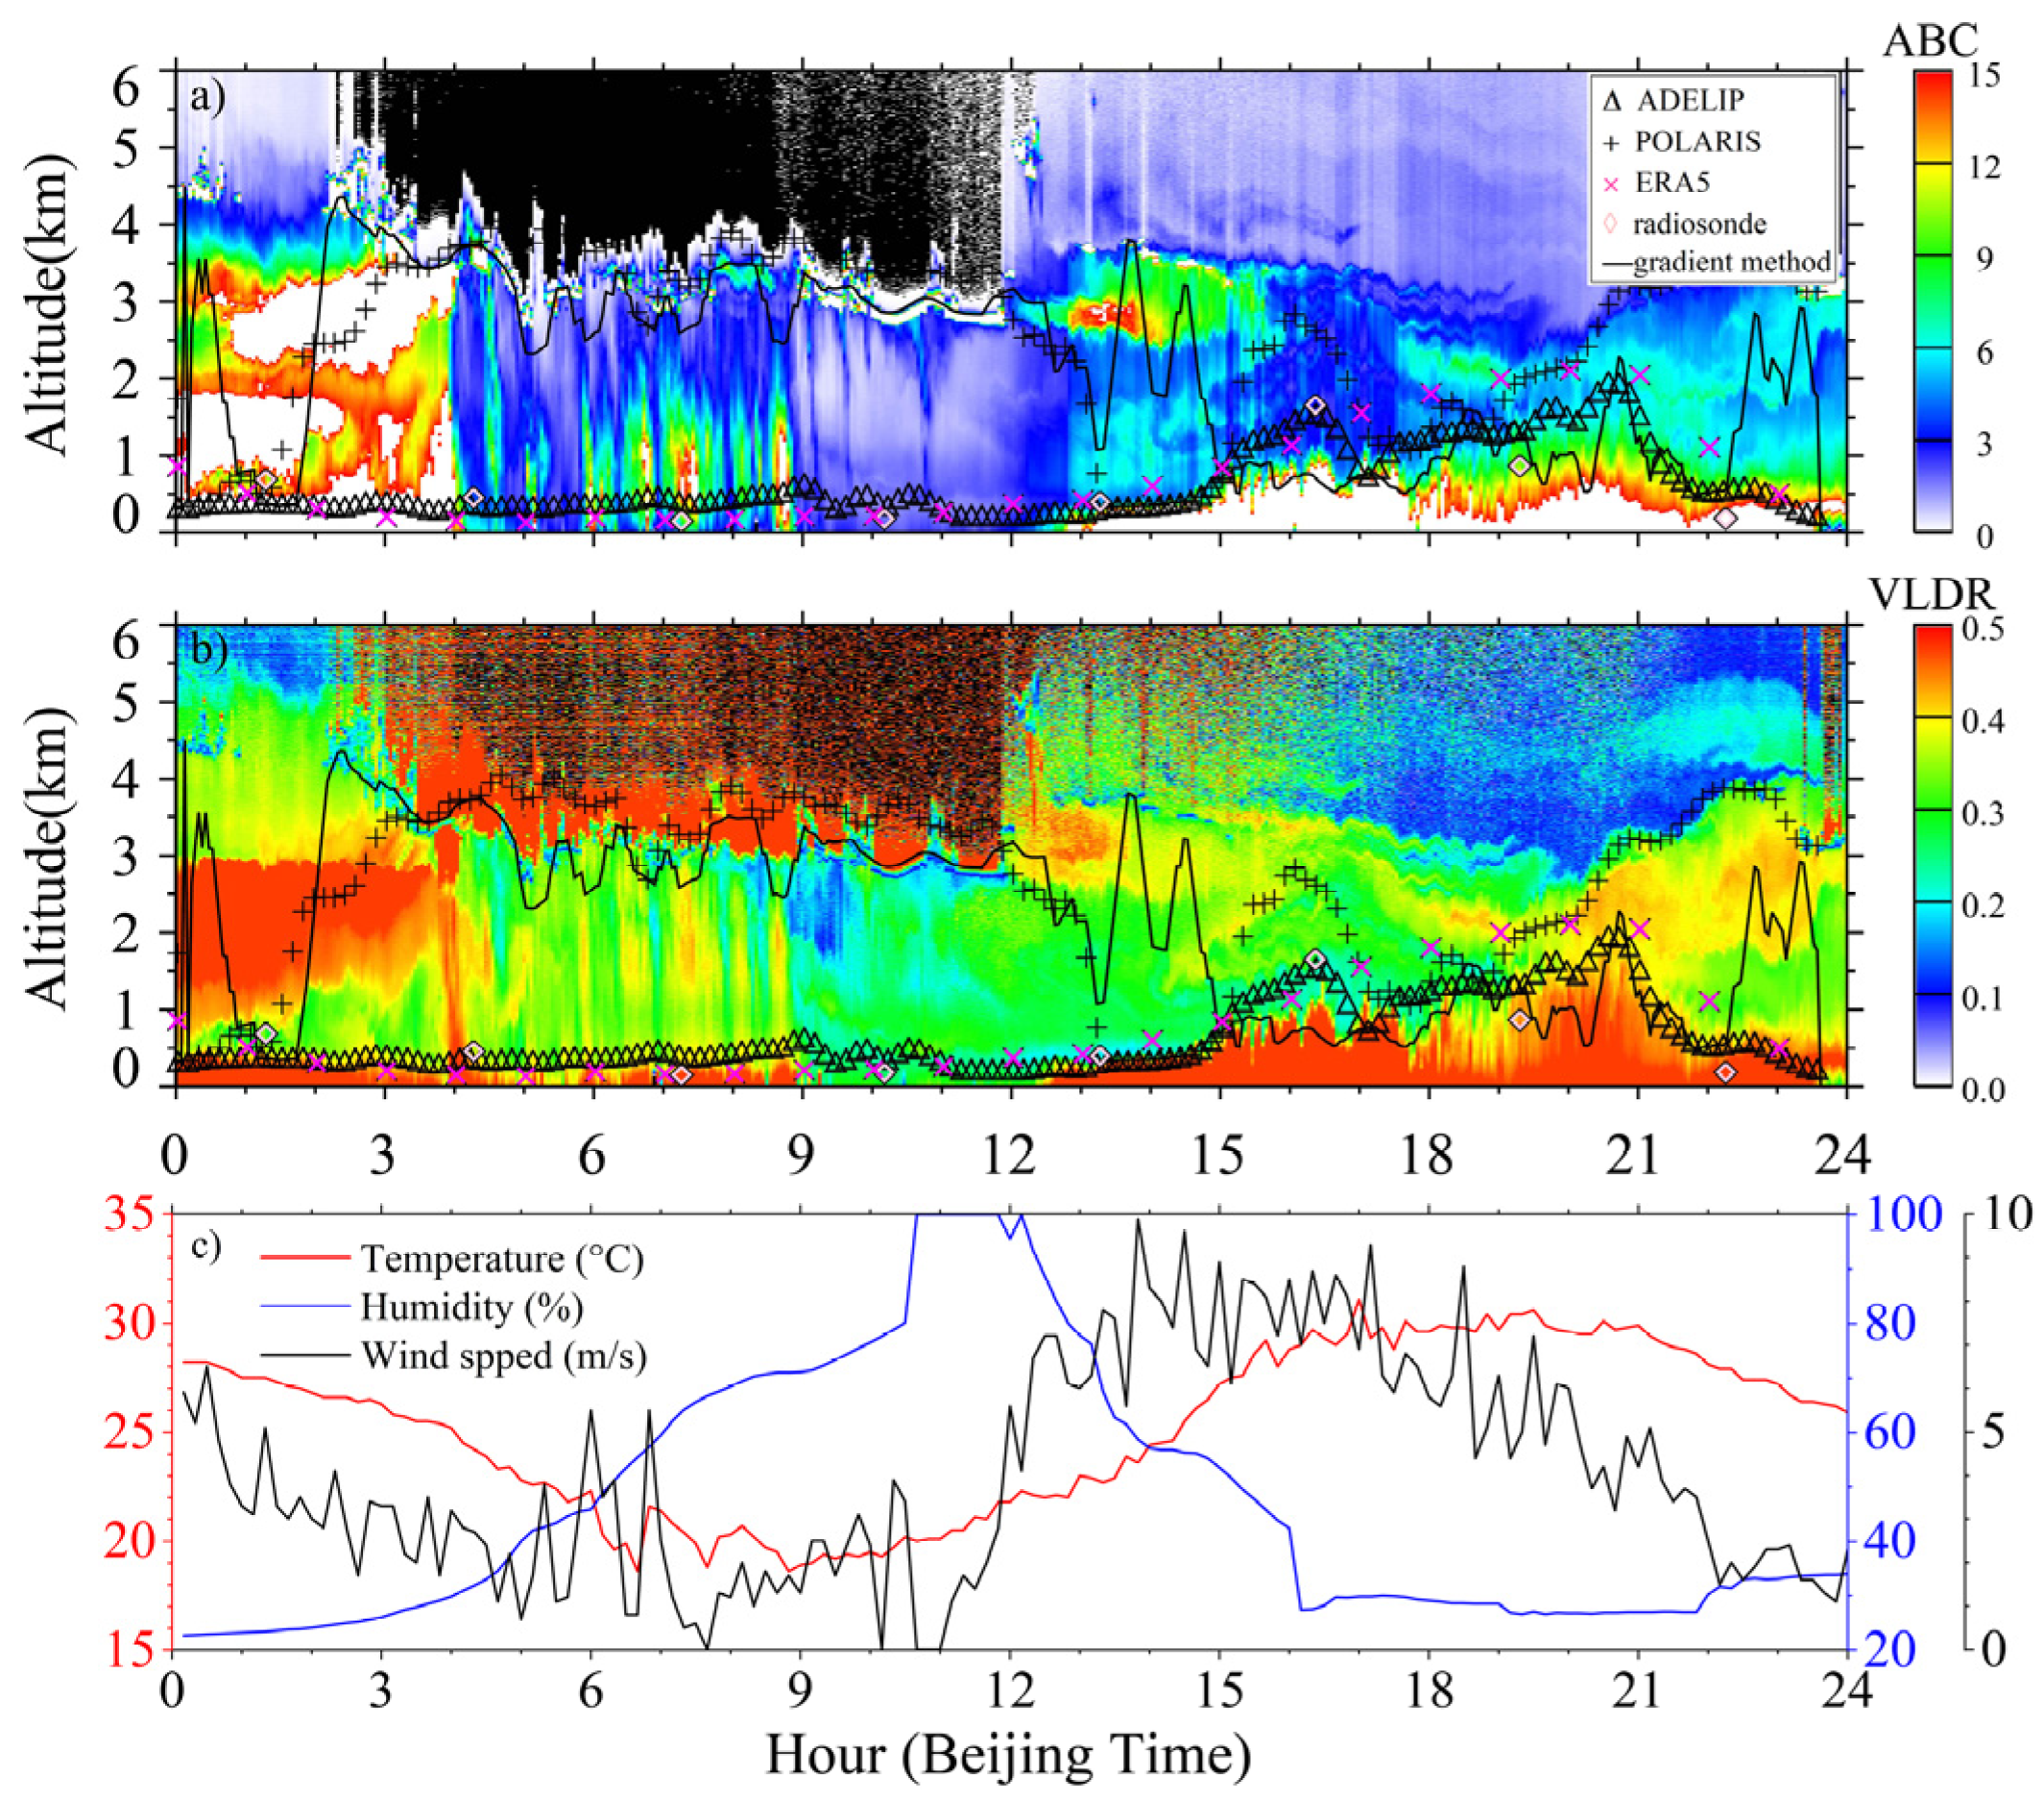
From the ground-based polarization lidar perspective, cases that are similar to that which is shown in Figure 5 are common over deserts and Gobi areas. The advantage of VLDR when one is representing the atmosphere boundary layers were fully exhibited, and they were even clearer than the ABC ones. As shown in Figure 5, the RL was almost maintained within 2 km until the development of the mixing layer completely disrupted the height of the RL at about 14:00. At the beginning of the mixing layer’s development, the clear boundary between the mixing layer and the RL was captured based on the difference of their VLDRs during the times between 10:00 and 14:00. Additionally, an elevated dust layer coexisted from about 2.5 to 4.5 km in height between 02:00 and 14:00, but it decoupled with the RL. After 14:00, the mixing layer that was mixed with the elevated dust layer and lasted until nearly 21:00. During this period, the maximum temperature and minimum relative humidity were also measured (Figure 5c). After sunset, there was no obvious vertical dust plumes which was shown by VLDR; moreover, an aerosol layer with a higher VLDR remained between 2 and 3 km. Clearly, the advection transport fine aerosol layers in the RL at night and the vertical transported dust plume within the mixing layer and the weak aerosol layer remained at a high altitude due to the stagnation of the mixing layer’s development. The entire aerosol evolution process can be represented more intuitively by the VLDR rather than by the ABC method.
Referring to the POLARIS’ principle, it merely reflected the most prominent signal part of the backscattering and VLDR profiles. As a result, this method almost only identified that the top of the RL before 14:00 and the upper boundary of the elevated dust layer after about 17:00 were the ABLHs. Certainly, the POLARIS method more accurately captured the development of the mixing layer from 14:00 to 17:00. In this case, the ABLHPOLARIS was the highest one among that of four approaches that were used throughout the day. Below the ABLHPOLARIS, the ADELIP method effectively avoided the influence of the fine structures in the RL (shown in Figure 5b). During the night, the highest ABLHADELIP value of 607 m was determined at nearly 04:00, and it was about 363 m higher than the adjacent ABLHsonde and ABLHERA5 ones. During other times, the ABLHADELIP and ABLHERA5 showed a good agreement with each other, however, the ABLHsonde at 01:00 was 230 m lower than these. Compared with those that were observed during the night, the differences among the ABLH methods were larger during the daytime. The ABLHADELIP and ABLHERA5 could stimulate the development process of the mixing layer during the morning, but ABLHERA5 seemed to be systematically lower than ABLHADELIP and ABLHsonde when the mixing layer was mixed with the elevated dust layer. The highest values of ABLHADELIP and ABLHsonde reached about 3.16 km and 3.42 km, respectively. While the highest values of ABLHERA5 was only 2.37 km. After about 21:00, the ABLHADELIP had a mean height of 345 m, which was slightly lower than that of ABLHERA5 (mean height of 530 m). Notably, ABLHsonde was recorded as 525 m whilst ABLHPOLARIS had a mean height of 2.26 km.

3.1.2. Case 2: Cloudy Day

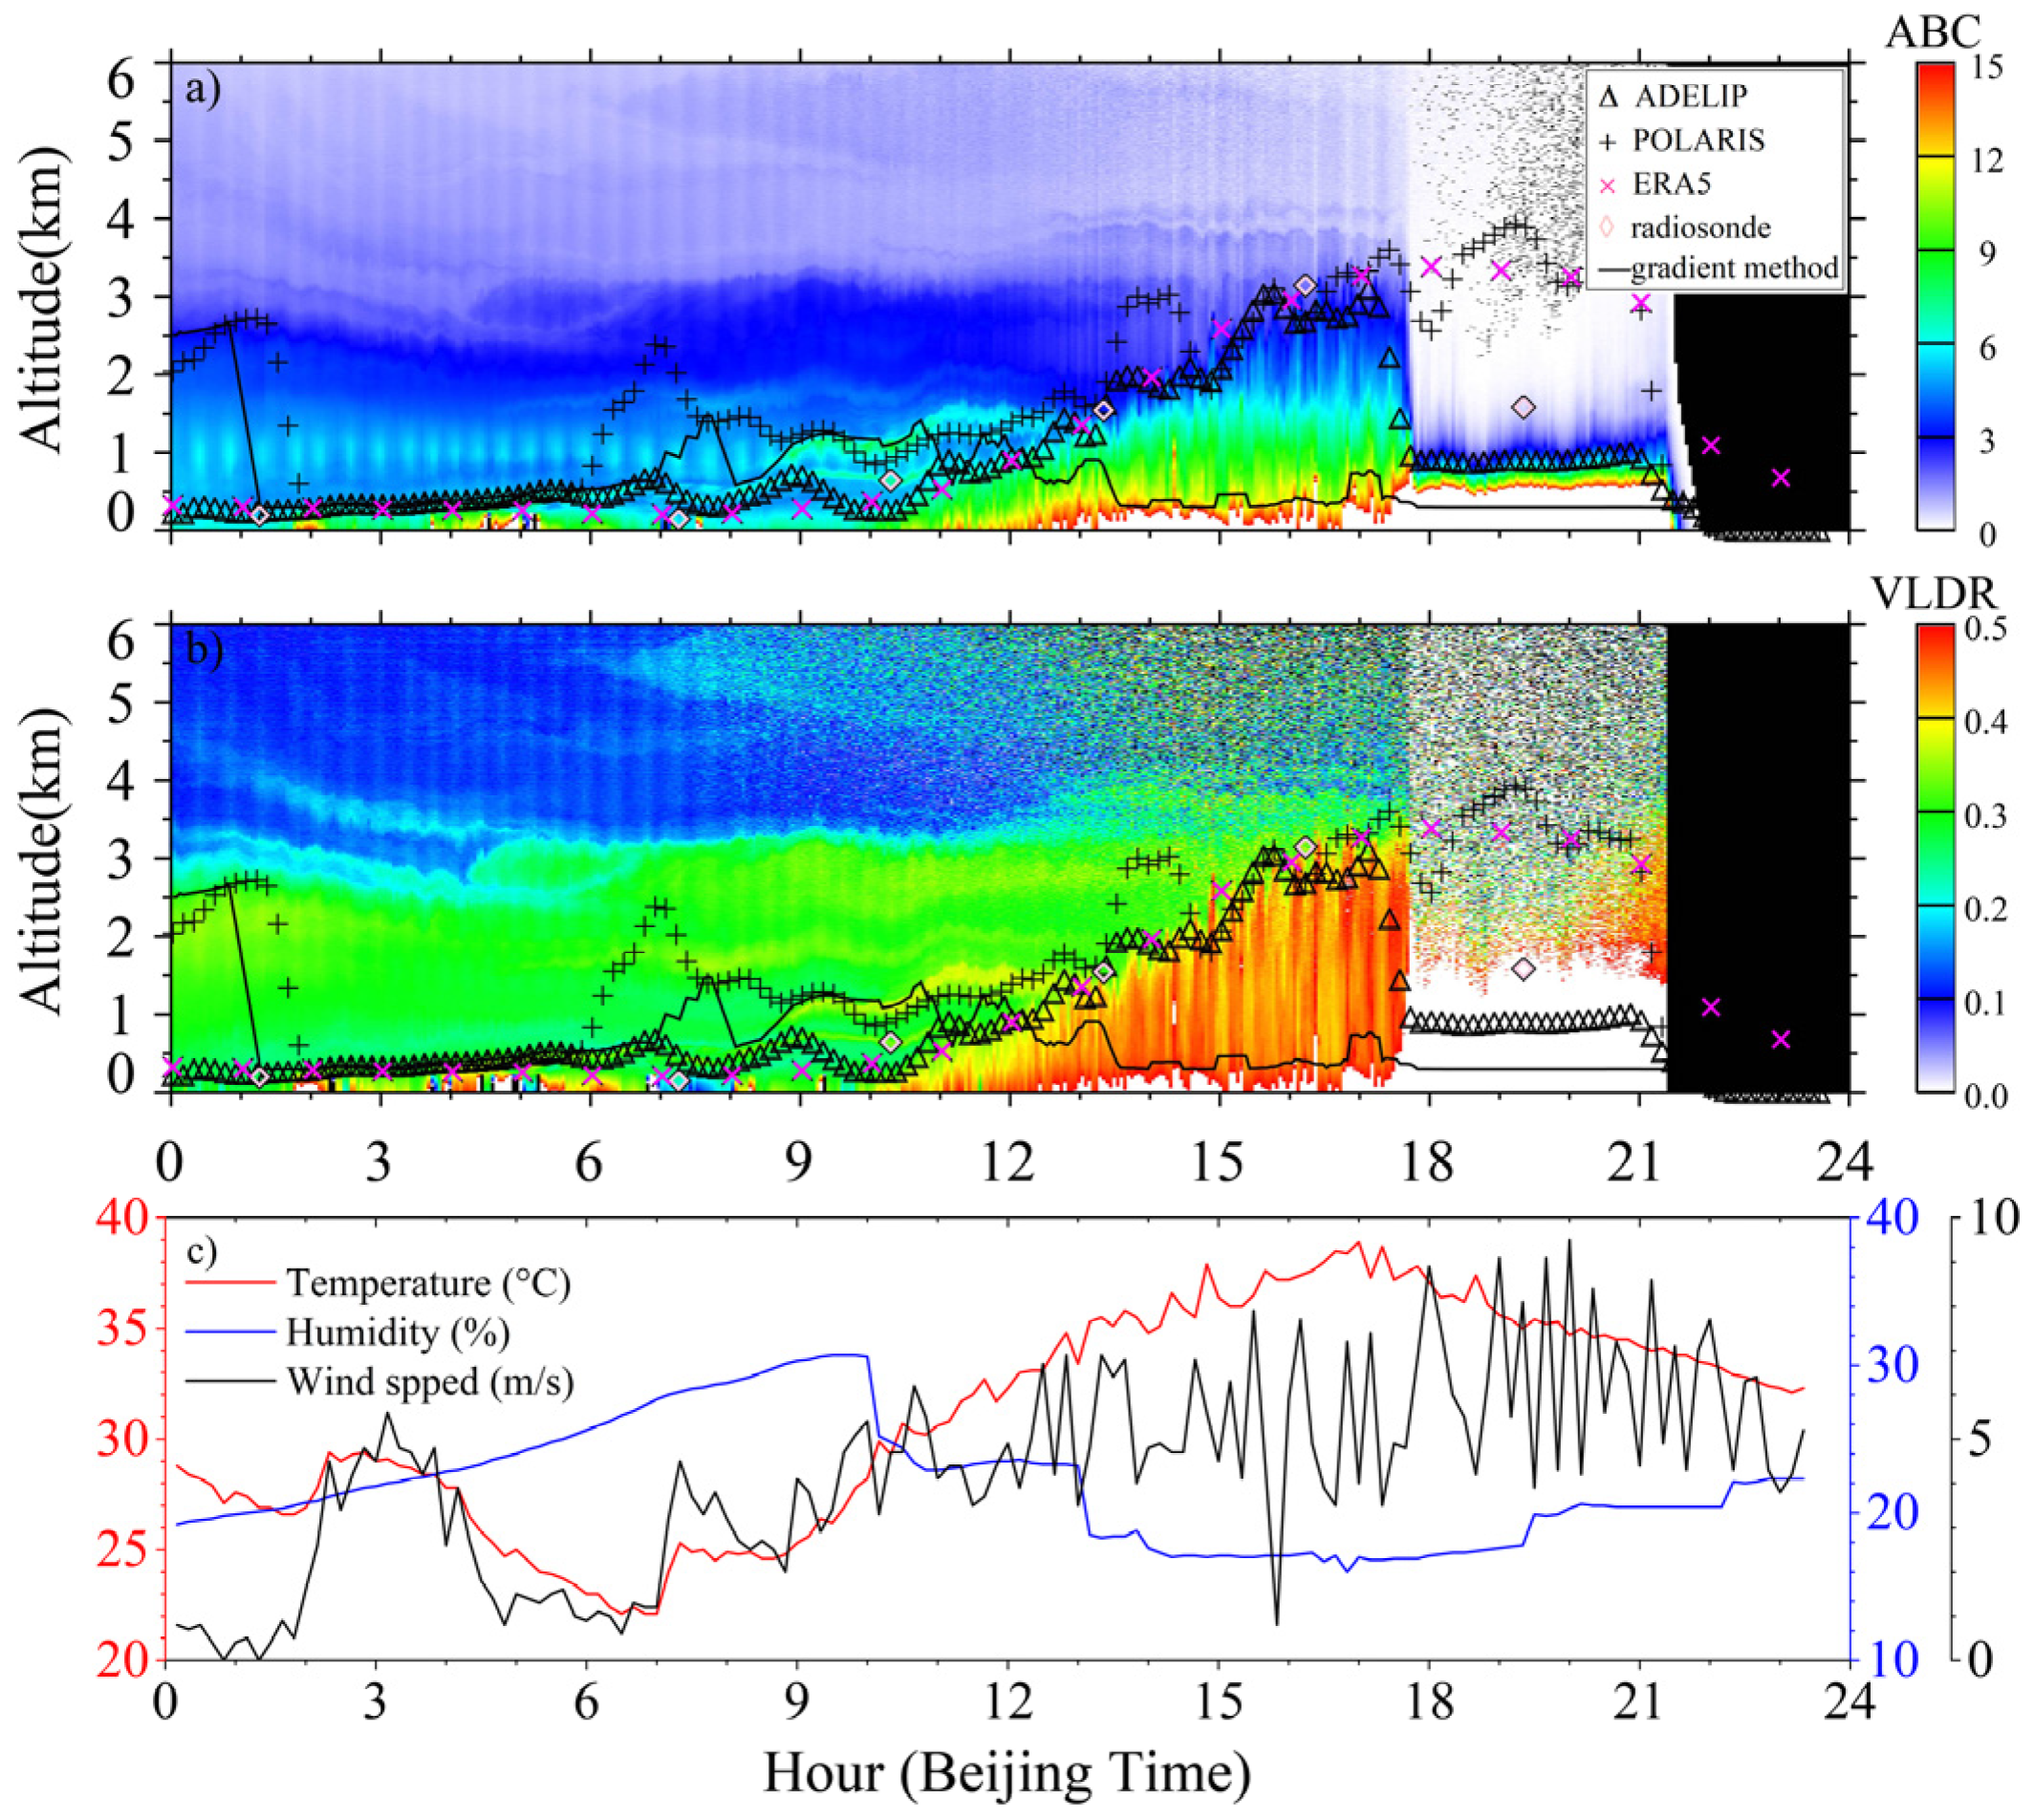
As shown in Figure 6, a rare precipitation process over the desert was captured during the time from 4:00 to 9:00, and the relative humidity had changed greatly during this day (Figure 6c). The appearance of the maximum relative humidity value after 9:00 was probably because sunrise increases the rate of evaporation. The temperature also decreased slightly during the whole day. In this case, there was a more complex aerosol vertical structure owing to the multiple elevated dust layers and several fine layer structures, for example, the layers that were located between 1 and 4 km from the times of 00:00 to 04:00, the layers between 2.5 and 3.5 km from 12:00 to 16:00, and between 1.6 and 4 km during the times from 20:00 to 24:00, respectively. As indicated by VLDR and ABC, the mixing layer did not develop until about 12:30. Before about 15:00, the ABLHs were maintained at a low height. The averaged ABLHs that were identified using ERA5, a radiosonde and ADELIP were 318 m, 373 m and 375 m, respectively. Even so, ABLHADELIP did not show the decline into an upward trend of the SBL that was similar to those of ABLHERA5 and ABLHsonde. In the development of the mixing layer from 13:00 to 15:00, the ABLHs that were retrieved by the four methods showed a good consistency among them. After 15:00, there were two obvious mixing processes in the mixing layer; the highest ABLH was found between about 16:30 and 20:30. ABLHADELIP and ABLHsonde reflected the detailed changes in the mixing layer during this period effectively. However, those of ABLHERA5 were systematically higher than those of ABLHADELIP and ABLHsonde, so much so that the largest difference between ABLHERA5 and ABLHsonde reached about 1100 m at 19:00. ABLHERA5 appeared to have a general trend of diurnal variation in the ABLHs, but it did not reveal a more subtle variation in the vertical direction. During the mixing process at around 21:00, the coupling between the mixing layer and the elevated dust layer was well identified by the ADELIP method, and ABLHsADELIP showed a good agreement with ABLHERA5. The highest ABLHs were 2104 m and 1975 m, respectively. For most of this case, due to the influence of the elevated dust layers and clouds, the POLARIS method determined the top heights of the cloud and elevated aerosol layers as the ABLHs. Certainly, ABLHADELIP and ABLHPOLARIS had almost identical values for mixing layer’s development from about 13:00 to 15:00.

3.1.3. Case 3: A Dust Storm

In actuality, the case on 17 July 2021 was also a clear day like it was in Case 1, and their ground meteorological elements were also similar. Compared with the previous two cases, the vertical structures of the aerosol layer were simpler, as shown in Figure 7a,b. The top of the RL reached about 3 km, and the aerosol layer was relatively uniform by referring to the VLDR at night. Only a small amount of fine aerosol layers existed during the morning. Obviously, a more significant difference between the RL and the mixing layer were presented by the VLDR. Until at about 17:30, the mixing layer developed up to 3.6 km, and it almost completely broke out of the RL. After that time, a severe dust storm occurred, which was accompanying by high and violent fluctuating wind speeds with a slightly decreased temperature (Figure 7c), and this caused the laser beam to be completely attenuated at about 1 km. Influenced by the near-surface dense aerosol layer, the consistency of the ABLHs, which were obtained by ADELIP and POLARIS methods, was very good from 02:00 to 06:00. After this, as shown by the ABC, the ADELIP method identified the bottom of the fine elevated aerosol layer as the ABLH of about 500 m, and this meant that the ABLHADELIP values were higher than the ABLHERA5 and ABLHsonde ones, while the ABLHPOLARIS ones were affected by the fine aerosol layers at a height between 1 and 2 km. From the beginning of the development of the mixing layer to the arrival of the dust process, the ABLHs which were determined by ADELIP, ERA5 and the radiosonde were almost identical, with the exception of ABLHPOLARIS. When the dense dust layer was formed, the lidar did not capture the actual information of the dust layer. As a result, the values for ABLHADELIP were all determined as the top of the visible lidar signal. Above this height, POLARIS identified the ABLH to be higher than this, owing to the low signal-noise ratio. The ABLHERA5 and ABLHsonde values also presented a large difference. At about 19:00, ABLHERA5 was 1751 m higher than ABLHsonde was, and ABLHADELIP was only 900 m.

3.2. Comparisons of the ABLHs

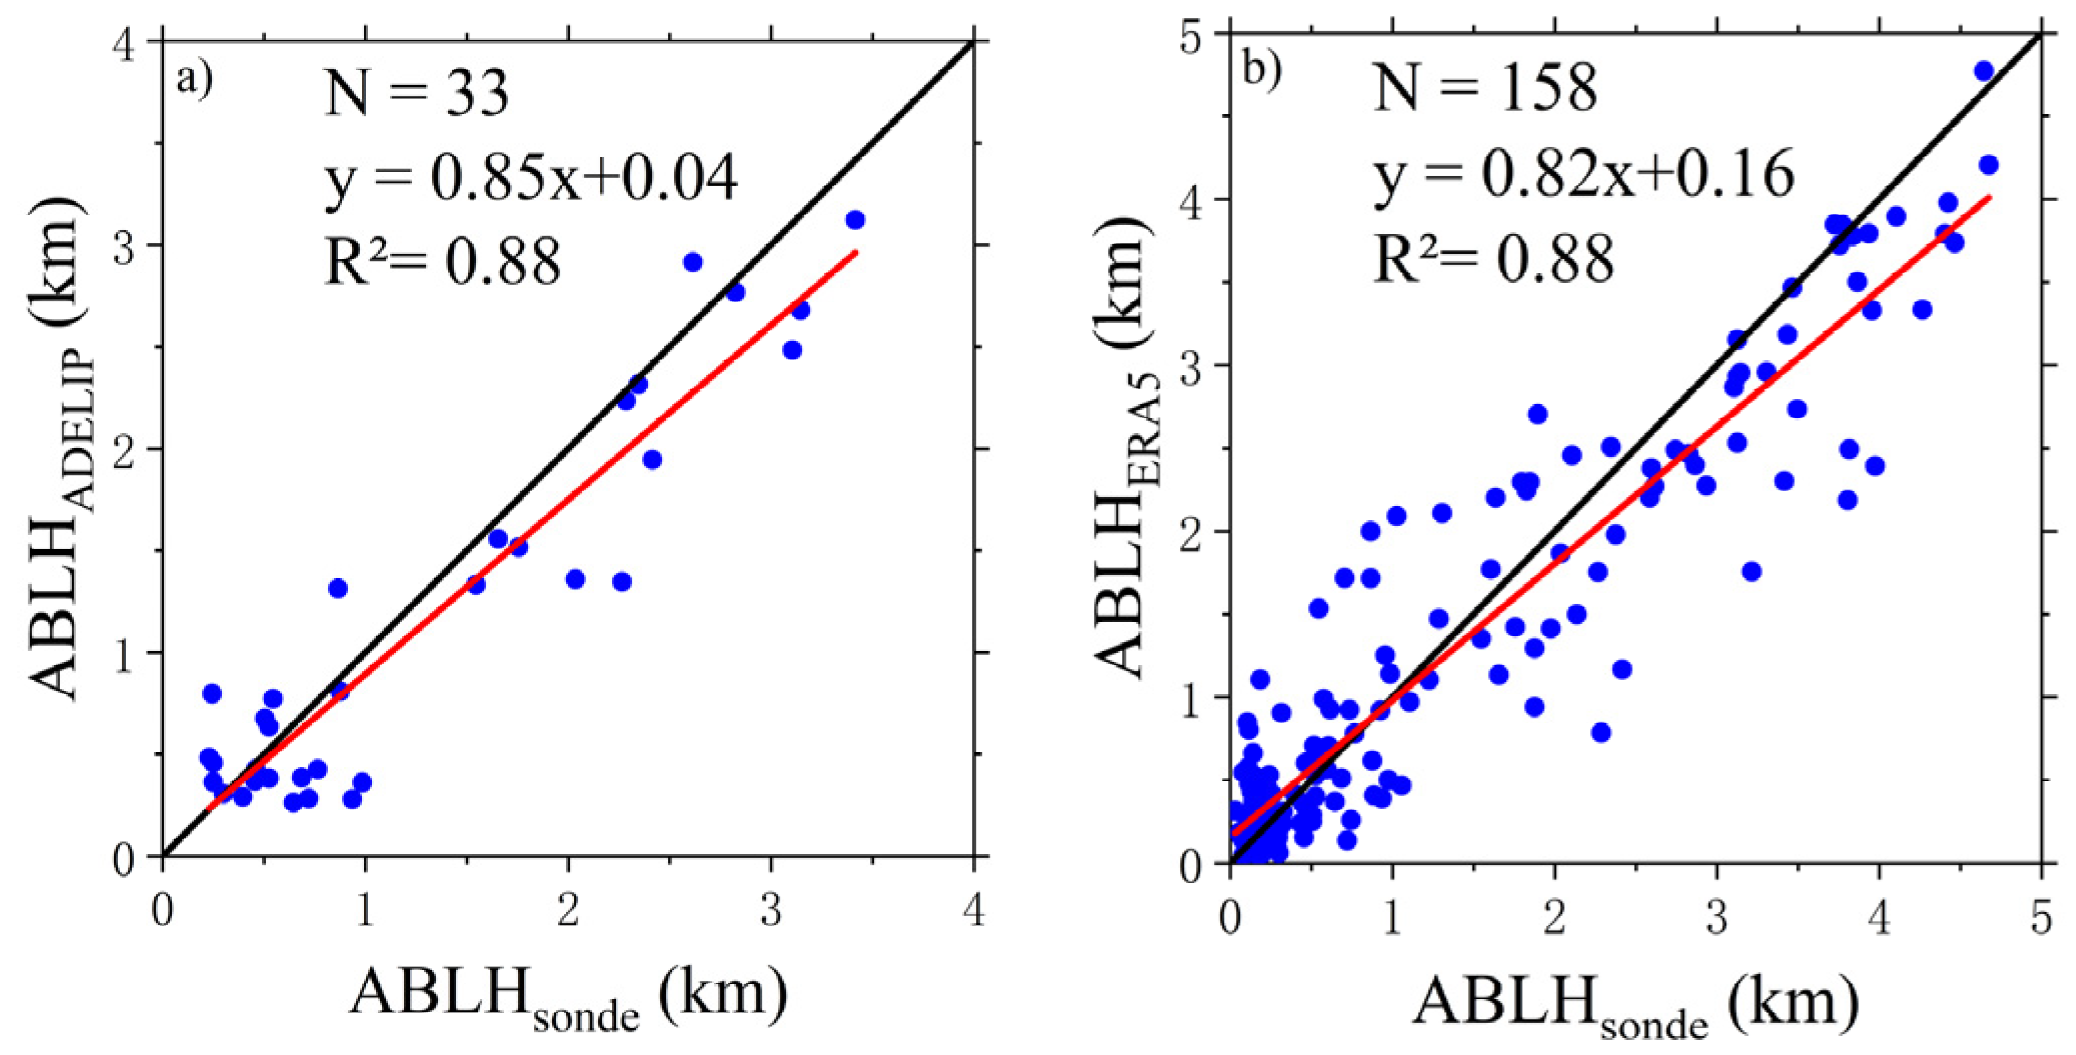
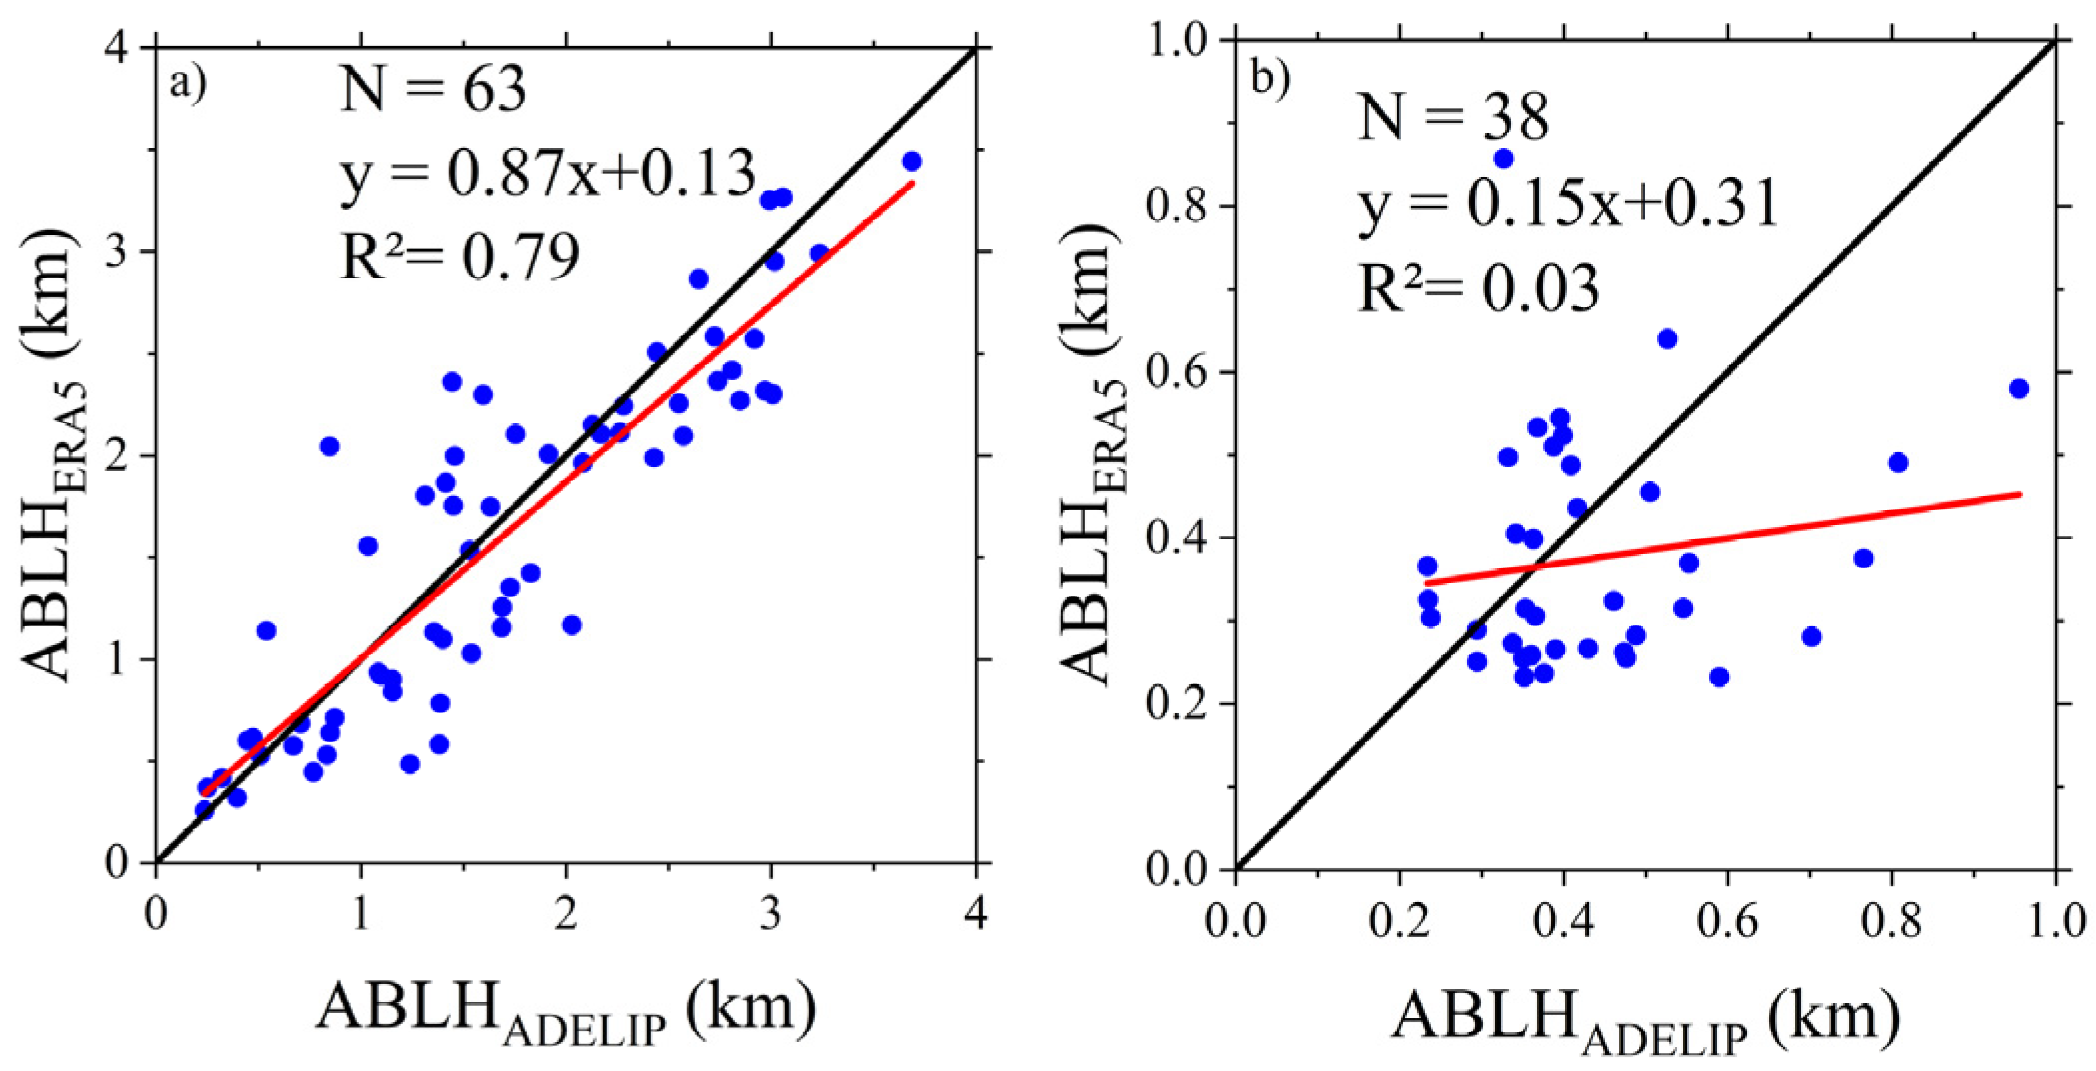
Considering the large uncertainty of ABLHADELIP during the dust storm in Figure 7, these ABLHs were not included when the performance of the ADELIP method was evaluated in the subsequent scatterplots. In addition, the cases with an ABLH that was below 225 m were also excluded when we were comparing ABLHERA5 and ABLHsonde with ABLHADELIP due to the lidar blind area. As shown in Figure 7a, there were only 33 radiosonde observations from 11 July to 17 July. The correlation coefficient between ABLHADELIP and ABLHsonde is 0.88. About 70% of ABLHADELIP is slightly lower than the ABLHsonde; the largest difference between them is about 920 m. Below 1 km, the scenes when ABLHsonde was higher than ABLHADELIP usually occurred at the initial periods of the mixing layer process as well as during the evening. According to the VLDR, at the beginning of the development of the mixing layer in Cases 1 and 3, the ABLHsonde seemed to be affected by the fine structures in the RL. As for the higher ABLHs, ABLHADELIP was almost lower than ABLHsonde. As reported by the previous study [47], the ABLH of the ERA5 product were assessed to be closest to the radiosonde observations with the correlation coefficient of 0.88 on a global scale. As shown in Figure 8b, the scatterplot between ABLHERA5 and ABLHsonde revealed a significant correlation (R2 = 0.88). Likewise, ABLHERA5 was also almost lower than ABLHsonde for the higher ABLHs. As a result, a good correlation between ABLHADELIP and ABLHERA5 exists. According to the frequency of the radiosonde observations, no matter whether they regarded ABLHADELIP, ABLHERA5 or ABLHsonde, although there were differences in the specific ABLHs, the presence of good correlations indicated their high similarity in their variation trends over the entire short-term campaign scale, as can be seen from Figure 8. Certainly, the ERA5 product also confirmed that it is an important approach for the verification of the ABLHs that were retrieved by the lidar observation when it lacked an abundance of co-located radiosonde observations, as well as other observations. By viewing the smaller time scales from a high-resolution perspective, the ABLHERA5 with a 1-hour resolution scale were further used to assess the ABLHADELIP during the daytime (from 11:00 to 21:00) and during the nighttime (from 0:00 to 10:00). As shown in Figure 9, the correlation during the daytime (with 0.79) was much better than the one during the nighttime (only 0.03). This suggested that although their ABLHs were relatively close, the ADELIP method is an inadequate one to capture the ABLHs that are closer to the actual fine variation trends during the night.
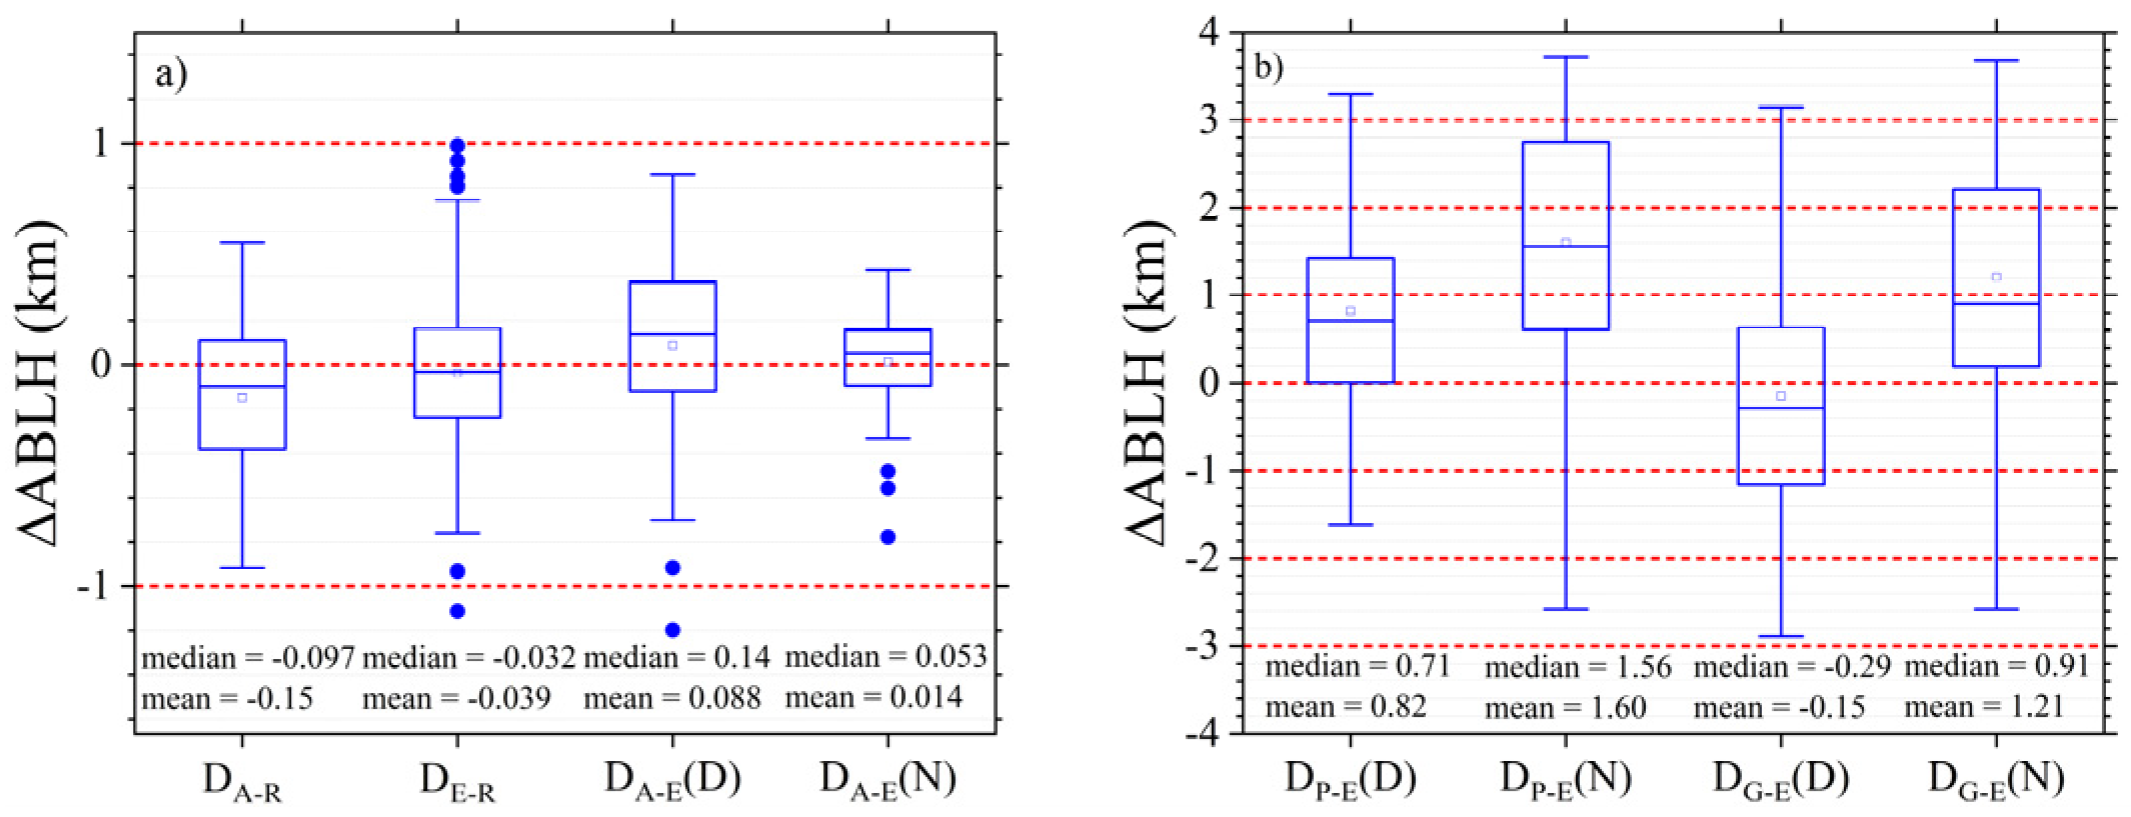
The statistical analysis of the differences among ABLHADELIP, ABLHsonde and ABLHERA5 are shown in Figure 10a. Compared with ABLHsonde, the ADELIP method on average underestimated the ABLHs by 150 m. This was similar to several previous studies that showed the underestimation of the value using the lidar method when they were compared with those of the radiosonde method [6,8,59]. In a recent study, the similar results that were derived from the MR-IP method also showed a high correlation between ABLHMR-IP and ABLHsonde (R = 0.81), moreover, the mean of ABLHMR-IP (635.4 m) was lower than that of the radiosonde (665.3 m) [39]. A conflicting conclusion was drawn, in that there were ABLH overestimations of 41 ± 72 m (p < 0.05) and 66 ± 96 m (p > 0.05) for the lidar during the winter [60]. After removing the clouds and the elevated aerosol layers, Morille et al. [36] reported the mean difference between the STRAT methods. Here, the radiosonde was 99 m with a standard deviation of 452 m [36]. Additionally, which is shown in Figure 10a, the mean ABLHERA5 is slightly lower than the mean ABLHsonde (39 m), which further proves the reliability of the ERA5 product as the verifier of the ABLH when it is identified by the lidar method. In relation to the daytime and the nighttime, it was clear that the mean deviation during the daytime (88 m) was larger than that during the nighttime (14 m). This was because the diurnal ABLHs were higher than nocturnal the ABLHs, and the higher ABLHs lead to a higher deviation [47]. The ABLHs that were derived by POLARIS and by GM all presented great deviations to ABLHERA5, as shown in Figure 10b. POLARIS overestimated the ABLH in general, and the overestimation during the night was higher than it was during the daytime, which is consistent with the results in Figure 11. GM overestimated the ABLH during the nighttime, and it underestimated the ABLH during the daytime. One possible reason is that the ABC mutation at a low height was caused by a daytime horizontal high wind speed, which is very common during experimental observation and which significantly interferes with the performance of GM. Additionally, during the nighttime, the RL also caused a high ABC mutation above the SBL and misled GM.
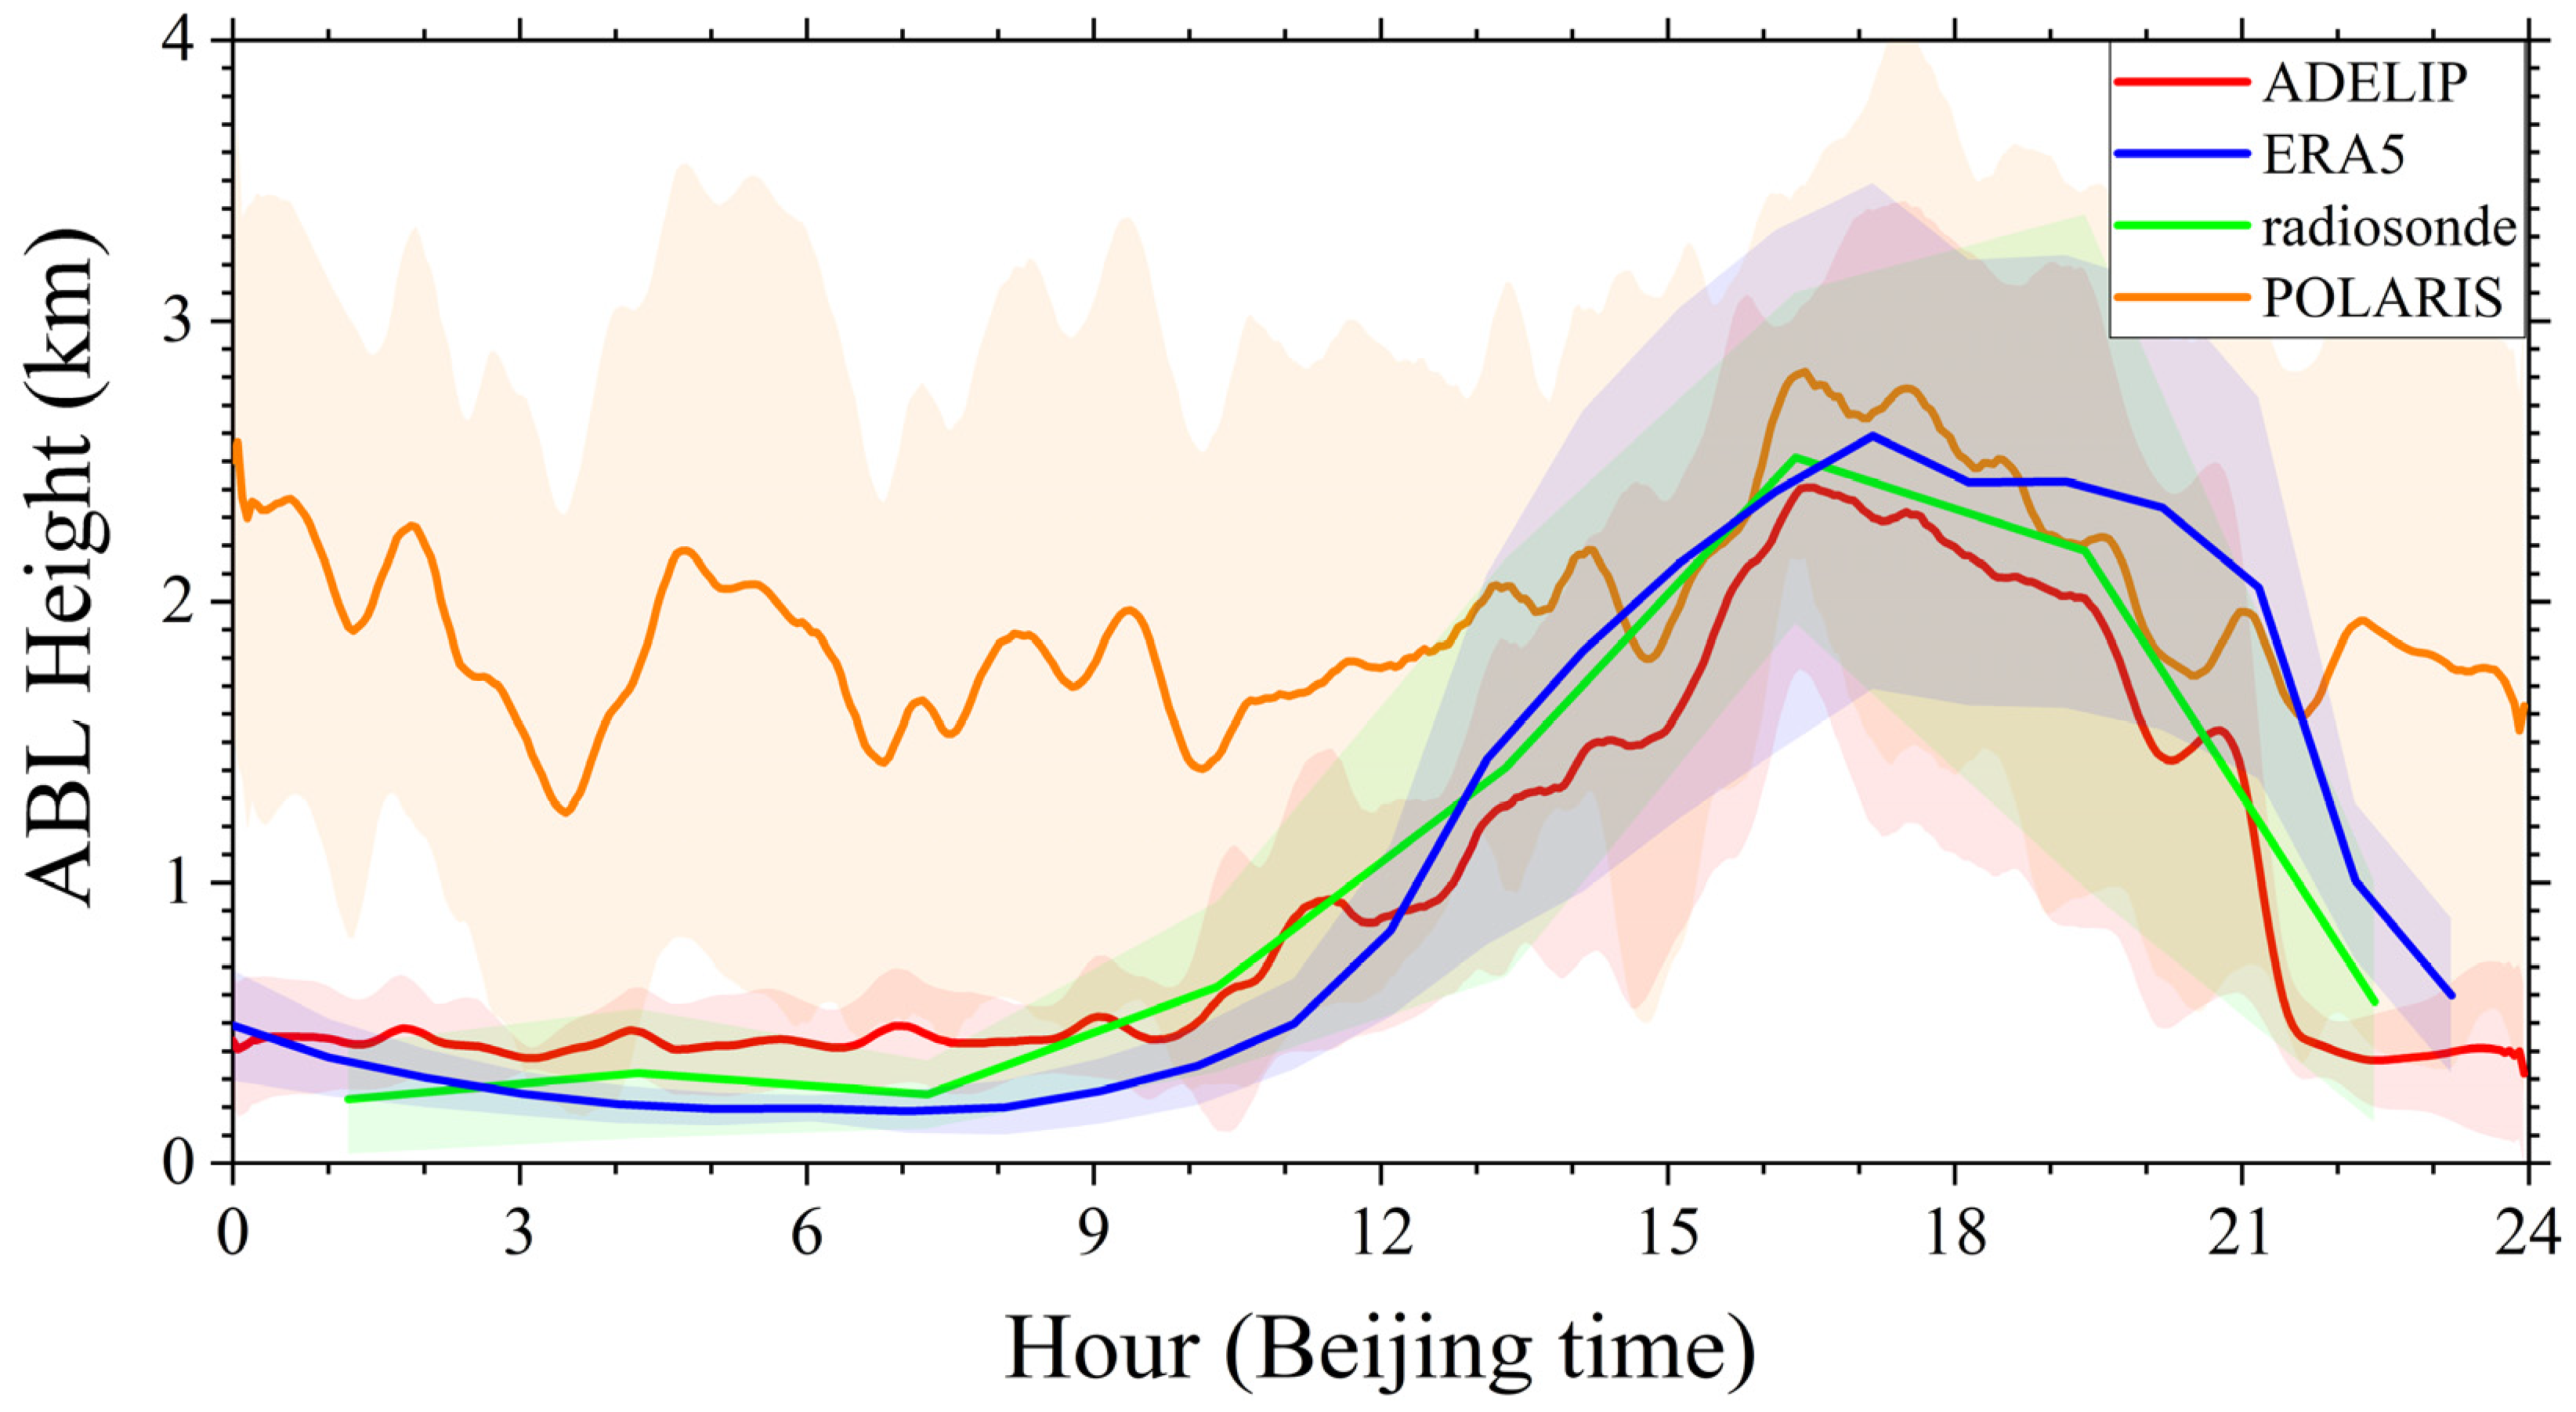
As shown in Figure 11, overall, the POLARIS method overestimated the ABLHs during the night and the ABLHs during the growth period of the mixing layer, and it maintained the higher standard deviation. Around noon, the ABLHPOLARIS had a similar trend with the other three ABLHs, and the heights were also very close. The average diurnal variation of the ABLH in Tazhong during the summer was displayed well by ABLHADELIP, ABLHsonde and ABLHERA5. ABLHsonde and ABLHERA5 revealed that the minimum ABLH occurred at around 05:00–07:00. The mixing layer began to grow after about 10:00, and it reached the maximum growth between 16:00 and 17:00, until the SBL began to develop at around 21:00. These three methods acquired a greater deviation during the mixing layer period. The convective intensity during the daytime changed greatly due to the meteorological conditions, while the air temperature was lower during the night, which led to the diversity of the deviation during the daytime and the nighttime. Similar summaries that document higher ABLH deviations that generally occurred during the afternoon have also been reported by Moreira et al. [61]. Overall, the ABLH results of this study are similar to those of Wang et al. [16] in Tazhong, who figured out that during the summer, the ABLH in the Taklimakan Desert can reach 4km, and the ABLH during the night is generally kept below 650 m. Other studies also discovered an extreme high ABLH (over 5 km) during the summer and spring in Tazhong [57,62]. The research of Zhang et al. [63] found that the ABLH could reach 3.5 km during the summer in Dunhuang. A similar research study found an extreme high ABLH (over 5 km) during the summer and spring in the Dunhuang and Minqin regions [64].
ABLHADELIP showed a high degree of similarity with ABLHsonde and ABLHERA5. Nevertheless, when it was compared with ABLHsonde and ABLHERA5, the ADELIP method overestimated the SBL height in most cases and underestimated the heights of the mixing layer during the daytime. For the cases with a ABLHsonde or ABLHERA5 that is less than 225 m, the lidar was unable to reveal the vertical distribution of the aerosol layer within the blind area. It was especially notable that an overestimation occurred during the period from 5:00 to 7:00 when the ABLH reached its minimum. In this situation, the ADELIP method usually determined either the bottom of the lowest elevated aerosol layers or the top of the lowest aerosol layers as the ABLH. The underestimations mainly occurred when the mixing layer was coupled with the elevated dust layer. For these cases, the two aerosol layers may not be well distinguished using ABC, which means the aerosol loading of the two layers may be very similar. As a result, both of the layers were treated as one layer. Thus, a relatively strong inversion, which was caused by the upper boundary of the elevated dust layer, may induce the radiosonde to retrieve this height as the ABLH, consequently, this may result in a slight rise in the ABLHsonde. The VLDR is capable to clearly reflect the difference between both of the layers. In ADELIP, the ABLH was determined as the bottom of the sub-layer where the variance of VLDR derivations is greater than the threshold is, while the real ABLH was possibly located in the middle of the sub-layer. So, it is necessary that the underestimated ABLHs, which were derived from the ADELIP method during the daytime, require further improvement.

3.3. Discussion

3.3.1. ADELIP Robustness

A large number of previous studies have confirmed that it is difficult to deal with the complex boundary layer cases using a single approach. Either the combination of different methods or an enhanced method is an effective solution when one is dealing with more complex scenarios [10,65,66]. In this study, both of these aspects were involved in the ADELIP method. On the one hand, the ADELIP method combined different methods such as CWT, the gradient method and the threshold method, while also allowing for the full use of their advantages to examine the profile characteristics. On the other hand, a new variable of VLDR was adopted in ADELIP, which can provide an extra dimension of the aerosol type to determine accurate ABLHs. When we are comparing it with previous applications on the CWT that choose the maximum/minimum in the CWT coefficients profiles [67,68,69], the ADELIP method did not stop there, but it attempted to establish the sub-layers that were below the maximum/minimum to reveal the fine aerosol structures. Furthermore, the height limitation of the simple diurnal variation ensures reasonable ABLHs [67,70]. Through the results that are shown above, it was clear that the ADELIP was able to deal with the ABLHs when there was a complex structure in the aerosol layer.
In addition, the initial upper limit of the ABLHs that were provided by the POLARIS method also had the potential to be replaced by the ABLHs that were retrieved by the other methods that can provide the height of aerosol-derived boundary layer well. According to the principle of the ADELIP method, it is applicable to any lidar observation and it is capable of providing the VLDR over different zones, and it is not limited to desert regions. For the advanced multi-wavelength lidar, more different variables can also be introduced to determine the ABLHs based on the fundamentals of ADELIP. Therefore, these results have proven that ADELIP has a good degree of compatibility.

3.3.2. ADELIP Limitation

Certainly, there were still some limitations of the ADELIP method. These mainly include the following four aspects: (1) The lidar blind area: when the SBL was below the lidar blind area, the aerosol lidar method observations were unlikely to overcome this problem. During the intensity observation period, the UAV observation platform can be proposed as a supplement to the lidar blind area due to it is low cost and flexible characteristics. The sensors that are aboard the UAV can provide the vertical profiles of the air temperature, relatively humidity and particulate matter concentration near the ground surface. (2) Severe dust events: during the periods of severe dust events where a laser beam was completely attenuated, the lidar signal could not reveal the real vertical structure of the dust aerosol layers. Hence, the accurate ABLHs cannot be captured by the lidar methods, although we also set the judgment of the dust storm in this study. (3) Tailoring the sub-layer: in most of the cases, the sub-layers, which were based on the CWT coefficient profile of the VLDR, were consistent with the ones that were based on the ABC, so the sub-layers that were based on VLDR were not fully considered in this work. In fact, the VLDR CWT coefficient profile should be included to provide more detailed sub-layers and acquire the ABLHs that are closer to reality, especially where the mixing layer and elevated aerosol layer were coupled and where their ABC and VLDR were also similar. (4) The effect of the dust plume during the convective activities: as shown in Figure 5, the VLDR indicated the dust plumes accompanying the convection processes, which were intermittent. This causes the large deviation of the ABLH during the growth period of the mixing layer at the minute-level temporal resolution. It also suggested that the method that was associated with the image processing and temporal consistency testing was needed to deal with this situation [71,72]. In addition, for the applications of ADELIP in different regions, the localization factor should be considered. For example, the VLDR varies with a large magnitude at some places, and thus, the role of the VLDR should be treat carefully under low VLDR values. In fact, the ADELIP method has been improving according to this direction.

3.3.3. Potential Effect of Dust Event on ABLHERA5

Here, the three different scenarios are provided: The non-dust storm case (Figure 12a), after the severe dust storm case (Figure 12b), which is when the peak of the dust storm and the laser beam was just enough to penetrate the dust layer, and during the severe dust storm case (Figure 12c), where the laser beam was completely attenuated. These cases suggested that when the dust event was stronger, the variation trends of the temperature and wind speed profiles of the ERA5 product and the radiosonde were more inconsistent, and they were even opposite to each other and below about 3 km in Figure 12c. As given in Formula (1), the quantities that were used to calculate the Richardson number mainly included the temperature, atmospheric pressure, humidity and wind vector. So, the large deviation between ERA5 and the radiosonde in the trends of the temperature and wind speed may lead to the difference in the ABLH retrieval. A similar scenario was reported by Huang et al. [42], who pointed out that multiple reanalysis products deviated greatly from the radiosonde when they were close to the surface in the Taklimakan desert. His team suggested that this is attributed to the complex interactions between the land surface and the atmosphere. For the cases that are shown in this study, the dust storm destroyed the thermal structure of the ABL by weakening the cooling of ground surface [14], and this resulted in a higher static instability of the tropospheric bottom, consequently leading to a higher deviation [47].
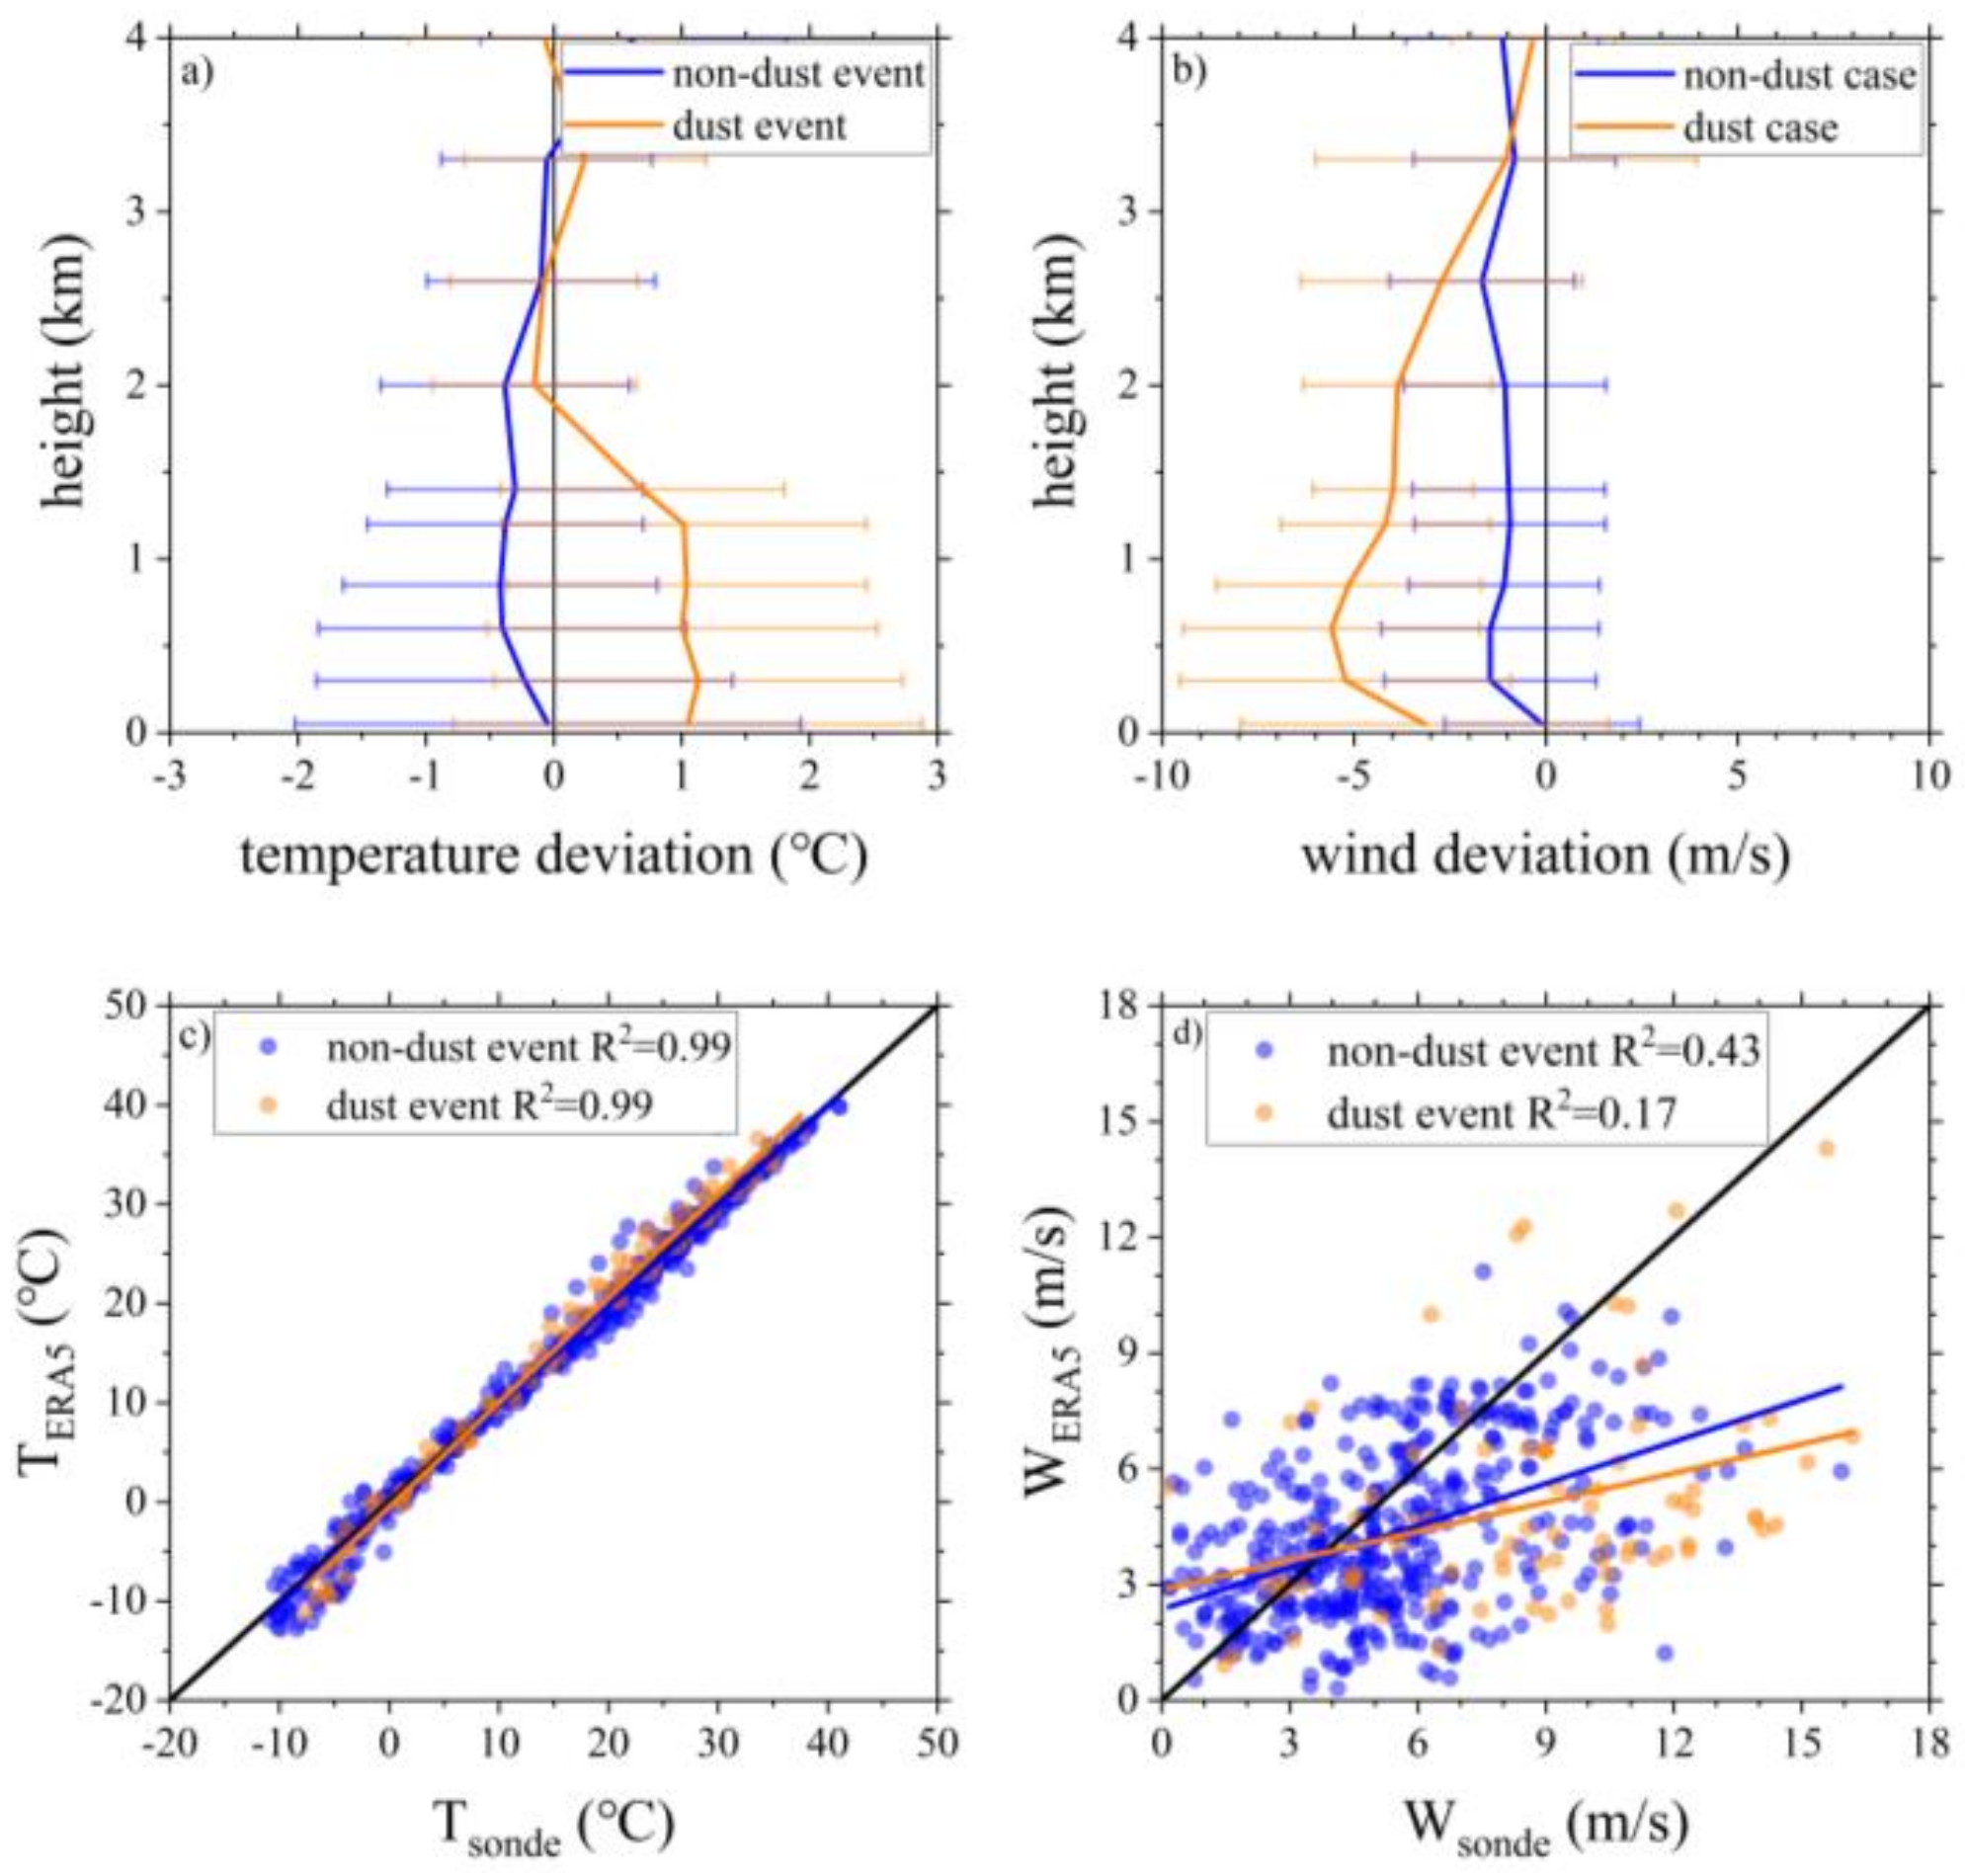
In order to confirm the difference that was induced by the dust storm, we classified all of the radiosonde observations during the entire campaign as non-dust event situations and dust event situations according to the PM records and meteorological elements (our other work). As shown in Figure 13a,b, the mean difference profiles of the temperature and wind speed revealed that the differences in the dust event situations are larger than those of the non-dust events. In detail, the temperature of ERA5 was higher by about 1 ℃ than that of the radiosonde, and it was below by about 1.5 km in the dust event situations. Meanwhile, there was a difference of about −0.5 ℃ when it was below 2 km in the non-dust event situations. In both of the situations, the wind speeds of ERA5 were all lower than those of the radiosonde, but the difference when it was below 2 km in dust event situations was roughly 3–5 times greater than that of the non-dust event situations. The correlation coefficient of 0.99 in Figure 13c implied that although there is a small temperature disturbance, it did not affect the basic trend of the temperature, which declined with height for both of the situations. For both of the situations that are shown in Figure 13d, the correlation for the wind speed between EAR5 and the radiosonde was not as strong. A higher coefficient was obtained for the non-dust event situations, but this may also have been caused by the difference in the sample number. It will take a larger dataset to confirm these findings in future studies. In general, it can be seen that the ERA5 product is insufficient to reflect the complex thermodynamic vertical structure of the dust storm, which is the possible reason why the great difference between ABLHsonde and ABLHERA5 exists.

4. Conclusions

In this study, we proposed a new ABLH retrieval method (named ADEILP), which is based on the polarized lidar observations that were made during the intensive field observation campaign in July 2021 in Tazhong, in the hinterland of Taklimakan Desert. Currently, polarization lidar is widely used, but when one is using these lidar data to determine the ABLH, the information that is provided by the VLDR is rarely considered, especially in the arid and semi-arid regions where there are abundant non-spherical particles in the atmosphere. The ADELIP method is a remarkable advancement because of two factors: Firstly, the aerosol type that is identified by lidar VLDR was considered to determine the ABLH, which helps to distinguish the different types of boundary layers, especially the mixing layer and the RL. Secondly, the idea of breaking up the whole layer into sub-layers was applied on the basis of the frequently used CWT skills, which is favorable to produce fine stratification in the aerosol layer for the determination of the ABLH. In addition, the appropriate height limitations also ensured a good robustness of the ADELIP method to deal with complex boundary layer structures.
The performance of the ADELIP method was assessed using a radiosonde and ERA5 reanalysis products based on short-term observations. The results showed that: excluding the dust storm and the lidar blind area, there was a good correlation of 0.88 between ABLHADELIP and ABLHsonde. The ADELIP method underestimated the ABLHs by 150 m on average, and the largest difference among them was about 920 m. The deviation of 32 m and the correlation coefficient of 0.88 between ABLHERA5 and ABLHsonde confirmed that ABLHERA5 was a feasible way to validate ABHLlidar when the co-located observations of the radiosonde and other instruments were insufficient. The correlation between ABLHADELIP and ABLHERA5 during the daytime (with 0.79) was much better than the one that was observed during the nighttime (only 0.03). Similar to the ABLHsonde and ABLHERA5, the ABLHADELIP also reflected the average diurnal variation of the ABLHs well. Nevertheless, in most of the cases, the ADELIP method overestimated the SBL height and underestimated the heights of the mixing layer.
As for the severe dust storm that completely attenuated the laser beam, the methods that were based on lidar observation were ineffective to determine the ABLH, while the dust event seemed to be a possible reason for the great difference between ABLHERA5 and the ABLHsonde because the ERA5 reanalysis product was insufficient to reflect the complex thermodynamic vertical structure of the dust storm. So, it is worth suggesting that the influence that was caused by the difference in the vertical profiles in ERA5 product should be carefully considered when the related issues of dust events are involved. Although there are still some limitations in this study, such as us using only a short-term lidar observation and the realized shortcomings of the ADELIP method, it does not prevent the ADELIP method from being applied to polarization lidar observations in different regions, especially advanced lidar systems. These findings surely will also motivate our efforts to further improve future studies relating to climatology of ABLH variation.

Author Contributions

Conceptualization, T.Z.; Data curation, X.Z.; Formal analysis, B.H. and T.Z.; Funding acquisition, J.H. and Z.H.; Investigation, B.H., T.Z., X.Z. and S.F.; Methodology, B.H.; Project administration, J.H.; Resources, Q.H., Z.H. and M.W.; Software, B.H.; Supervision, T.Z.; Visualization, S.F.; Writing—original draft, B.H.; Writing—review & editing, T.Z. All authors have read and agreed to the published version of the manuscript.

Funding

This work was supported by the Second Tibetan Plateau Scientific Expedition and Research Program (STEP) (2019QZKK0602), the National Natural Science Foundation of China (41975019, 41830968, 42030612) and the Fundamental Research Funds for the Central University (lzujbky-2019-42).

Data Availability Statement

The lidar and radiosonde data used in this article is not applicable. The reanalysis data (ERA5) can be applied through this link: https://cds.climate.copernicus.eu/cdsapp#!/search?type=dataset (accessed on 22 October 2022).

Acknowledgments

We acknowledge the colleagues (Fan Yang, Jiantao Zhang, Lu Meng and Chenglong Zhou) at Institute of Desert meteorology Urumqi for their selfless help and suggestions for our field campaign. We also acknowledge all of the anonymous reviewers for their insightful and valuable comments.

Conflicts of Interest

The authors declare no conflict of interest.

References

  1. Stull, R.B. An Introduction to Boundary Layer Meteorology; Springer: Dordrecht, The Netherlands, 1988. [Google Scholar]
  2. Garratt, J.R. The atmospheric boundary-layer—Review. Earth Space Sci. 1994, 37, 89–134. [Google Scholar] [CrossRef]
  3. Kotthaus, S.; Bravo-Aranda, J.A.; Collaud Coen, M.; Guerrero-Rascado, J.L.; Costa, M.J.; Cimini, D.; O’Connor, E.J.; Hervo, M.; Alados-Arboledas, L.; Jiménez-Portaz, M.; et al. Atmospheric boundary layer height from ground-based remote sensing: A re-view of capabilities and limitations. Atmos. Meas. Tech. Discuss. 2022. [preprint], in review. [Google Scholar] [CrossRef]
  4. Liu, S.; Liang, X.-Z. Observed Diurnal Cycle Climatology of Planetary Boundary Layer Height. J. Clim. 2010, 23, 5790–5809. [Google Scholar] [CrossRef]
  5. Ma, M.; Pu, Z.; Wang, S.; Zhang, Q. Characteristics and Numerical Simulations of Extremely Large Atmospheric Boundary-layer Heights over an Arid Region in North-west China. Bound.-Layer Meteorol. 2011, 140, 163–176. [Google Scholar] [CrossRef]
  6. Sawyer, V.; Li, Z. Detection, variations and intercomparison of the planetary boundary layer depth from radiosonde, lidar and infrared spectrometer. Atmos. Environ. 2013, 79, 518–528. [Google Scholar] [CrossRef]
  7. Seibert, P.; Beyrich, F.; Gryning, S.-E.; Joffre, S.; Rasmussen, A.; Tercier, P. Chapter 20 Review and intercomparison of operational methods for the determination of the mixing height. Dev. Environ. Sci. 2002, 1, 569–613. [Google Scholar]
  8. Summa, D.; Di Girolamo, P.; Stelitano, D.; Cacciani, M. Characterization of the planetary boundary layer height and structure by Raman lidar: Comparison of different approaches. Atmos. Meas. Tech. 2013, 6, 3515–3525. [Google Scholar] [CrossRef] [Green Version]
  9. Haeffelin, M.; Angelini, F.; Morille, Y.; Martucci, G.; Frey, S.; Gobbi, G.P.; Lolli, S.; O’Dowd, C.D.; Sauvage, L.; Xueref-Rémy, I.; et al. Evaluation of Mixing-Height Retrievals from Automatic Profiling Lidars and Ceilometers in View of Future Integrated Networks in Europe. Bound.-Layer Meteorol. 2011, 143, 49–75. [Google Scholar] [CrossRef]
  10. Zhong, T.; Wang, N.; Shen, X.; Xiao, D.; Xiang, Z.; Liu, D. Determination of Planetary Boundary Layer height with Lidar Signals Using Maximum Limited Height Initialization and Range Restriction (MLHI-RR). Remote Sens. 2020, 12, 2272. [Google Scholar] [CrossRef]
  11. Vivone, G.; D’Amico, G.; Summa, D.; Lolli, S.; Amodeo, A.; Bortoli, D.; Pappalardo, G. Atmospheric boundary layer height estimation from aerosol lidar: A new approach based on morphological image processing techniques. Atmos. Chem. Phys. 2021, 21, 4249–4265. [Google Scholar] [CrossRef]
  12. Yang, T.; Wang, Z.; Zhang, W.; Gbaguidi, A.; Sugimoto, N.; Wang, X.; Matsui, I.; Sun, Y. Technical note: Boundary layer height determination from lidar for improving air pollution episode modeling: Development of new algorithm and evaluation. Atmos. Chem. Phys. 2017, 17, 6215–6225. [Google Scholar] [CrossRef]
  13. Li, Z.; Guo, J.; Ding, A.; Liao, H.; Liu, J.; Sun, Y.; Wang, T.; Xue, H.; Zhang, H.; Zhu, B. Aerosol and boundary-layer interactions and impact on air quality. Natl. Sci. Rev. 2017, 4, 810–833. [Google Scholar] [CrossRef]
  14. Wang, M.; Wei, W.; He, Q.; Yang, Y.; Fan, L.; Zhang, J. Summer atmospheric boundary layer structure in the hinterland of Taklimakan Desert, China. J. Arid Land 2016, 8, 846–860. [Google Scholar] [CrossRef] [Green Version]
  15. Kandler, K.; Schuetz, L.; Deutscher, C.; Ebert, M.; Hofmann, H.; Jaeckel, S.; Jaenicke, R.; Knippertz, P.; Lieke, K.; Massling, A.; et al. Size distribution, mass concentration, chemical and mineralogical composition and derived optical parameters of the boundary layer aerosol at Tinfou, Morocco, during SAMUM 2006. Tellus B Chem. Phys. Meteorol. 2009, 61, 32–50. [Google Scholar] [CrossRef] [Green Version]
  16. Yu, S.; Liu, D.; Xu, J.; Wang, Z.; Wu, D.; Qian, L.; Mao, M.; Wang, Y. Optimization method for planetary boundary layer height retrieval by lidar. Acta Opt. Sin. 2021, 41, 0728002. [Google Scholar]
  17. Su, T.; Li, J.; Li, C.; Xiang, P.; Lau, A.; Guo, J.; Yang, D.; Miao, Y. An intercomparison of long-term planetary boundary layer heights retrieved from CALIPSO, ground-based lidar, and radiosonde measurements over Hong Kong. J. Geophys. Res. Atmos. 2017, 122, 3929–3943. [Google Scholar] [CrossRef]
  18. Wilson, R.W.; Butterley, T.; Sarazin, M. The Durham/ESO SLODAR optical turbulence profiler. Mon. Not. R. Astron. Soc. 2009, 399, 2129–2138. [Google Scholar] [CrossRef] [Green Version]
  19. Shikhovtsev, A.Y. A Method of Determining Optical Turbulence Characteristics by the Line of Sight of an Astronomical Telescope. Atmos. Ocean. Opt. 2022, 35, 303–309. [Google Scholar] [CrossRef]
  20. Beyrich, F.; Leps, J.-P. An operational mixing height data set from routine radiosoundings at Lindenberg: Methodology. Meteorol. Z. 2012, 21, 337–348. [Google Scholar] [CrossRef] [Green Version]
  21. Barlow, J.F.; Dunbar, T.M.; Nemitz, E.G.; Wood, C.R.; Gallagher, M.W.; Davies, F.; O’Connor, E.; Harrison, R.M. Boundary layer dynamics over London, UK, as observed using Doppler lidar during REPARTEE-II. Atmos. Chem. Phys. 2011, 11, 2111–2125. [Google Scholar] [CrossRef] [Green Version]
  22. Kotthaus, S.; Halios, C.H.; Barlow, J.F.; Grimmond, C.S.B. Volume for pollution dispersion: London’s atmospheric boundary layer during ClearfLo observed with two ground-based lidar types. Atmos. Environ. 2018, 190, 401–414. [Google Scholar] [CrossRef] [Green Version]
  23. Melfi, S.H.; Spinhirne, J.D.; Chou, S.-H.; Palm, S.P. Lidar Observations of Vertically Organized Convection in the Planetary Boundary Layer over the Ocean. J. Clim. Appl. Meteorol. 1985, 24, 806–821. [Google Scholar] [CrossRef]
  24. Hooper, W.P.; Eloranta, E.W. Lidar measurements of wind in the planetary boundary-layer—The method, accuracy and results from joint measurements with radiosonde and kytoon. J. Appl. Meteorol. Clim. 1986, 25, 990–1001. [Google Scholar] [CrossRef]
  25. Flamant, C.; Pelon, J.; Flamant, P.H.; Durand, P. Lidar determination of the entrainment zone thickness at the top of the unstable marine atmospheric boundary layer. Bound.-Layer Meteorol. 1997, 83, 247–284. [Google Scholar] [CrossRef]
  26. Hennemuth, B.; Lammert, A. Determination of the Atmospheric Boundary Layer Height from Radiosonde and Lidar Backscatter. Bound.-Layer Meteorol. 2006, 120, 181–200. [Google Scholar] [CrossRef]
  27. Menut, L.; Flamant, C.; Pelon, J.; Flamant, P.H. Urban boundary-layer height determination from lidar measurements over the Paris area. Appl. Opt. 1999, 38, 945–954. [Google Scholar] [CrossRef]
  28. Martucci, G.; Matthey, R.; Mitev, V.; Richner, H. Comparison between Backscatter Lidar and Radiosonde Measurements of the Diurnal and Nocturnal Stratification in the Lower Troposphere. J. Atmos. Ocean. Technol. 2007, 24, 1231–1244. [Google Scholar] [CrossRef] [Green Version]
  29. Frioud, M.; Mitev, V.; Matthey, R.; Häberli, C.; Richner, H.; Werner, R.; Vogt, S. Elevated aerosol stratification above the Rhine Valley under strong anticyclonic conditions. Atmos. Environ. 2003, 37, 1785–1797. [Google Scholar] [CrossRef]
  30. Münkel, C.; Eresmaa, N.; Räsänen, J.; Karppinen, A. Retrieval of mixing height and dust concentration with lidar ceilometer. Bound.-Layer Meteorol. 2006, 124, 117–128. [Google Scholar] [CrossRef]
  31. Eresmaa, N.; Karppinen, A.; Joffre, S.M.; Räsänen, J.; Talvitie, H. Mixing height determination by ceilometer. Atmos. Chem. Phys. 2006, 6, 1485–1493. [Google Scholar] [CrossRef] [Green Version]
  32. Steyn, D.G.; Baldi, M.; Hoff, R.M. The Detection of Mixed Layer Depth and Entrainment Zone Thickness from Lidar Backscatter Profiles. J. Atmos. Ocean. Technol. 1999, 16, 953–959. [Google Scholar] [CrossRef]
  33. Piironen, A.K.; Eloranta, E.W. Convective boundary layer mean depths and cloud geometrical properties obtained from volume imaging lidar data. J. Geophys. Res. Earth Surf. 1995, 100, 25569–25576. [Google Scholar] [CrossRef]
  34. Marques, M.T.A.; Gregori, D.A.M.; Maciel, P.; Amauri, P.O.; Eduardo, L. Estimating the planetary boundary layer height from radiosonde and Doppler lidar measurements in the city of Sao Paulo. In Proceedings of the Brazil 28th International Laser Radar Conference, Bucharest, Romania, 25 June 2017; EDP Sciences: Les Ulis, France, 2018; p. 06015. [Google Scholar]
  35. Mallat, S.; Hwang, W. Singularity detection and processing with wavelets. IEEE Trans. Inf. Theory 1992, 38, 617–643. [Google Scholar] [CrossRef]
  36. Morille, Y.; Haeffelin, M.; Drobinski, P.; Pelon, J. STRAT: An Automated Algorithm to Retrieve the Vertical Structure of the Atmosphere from Single-Channel Lidar Data. J. Atmos. Ocean. Technol. 2007, 24, 761–775. [Google Scholar] [CrossRef] [Green Version]
  37. Gamage, N.; Hagelberg, C. Detection and Analysis of Microfronts and Associated Coherent Events Using Localized Transforms. J. Atmos. Sci. 1993, 50, 750–756. [Google Scholar] [CrossRef]
  38. Collineau, S.; Brunet, Y. Detection of turbulent coherent motions in a forest canopy part I: Wavelet analysis. Bound.-Layer Meteorol. 1993, 65, 357–379. [Google Scholar] [CrossRef]
  39. Pan, Y.; Wang, Q.; Ma, P.; Jia, X.; Liao, Z.; Dou, Y.; Cheng, Z.; Zhang, Z.; Li, L.; Xin, J.; et al. A new algorithm for planetary boundary layer height calculation based on multilayer recognition. Atmos. Environ. 2022, 271, 118919. [Google Scholar] [CrossRef]
  40. Lewis, J.R.; Welton, E.J.; Molod, A.M.; Joseph, E. Improved boundary layer depth retrievals from MPLNET. J. Geophys. Res. Atmos. 2013, 118, 9870–9879. [Google Scholar] [CrossRef]
  41. Huang, J.; Ge, J.; Weng, F. Detection of Asia dust storms using multisensor satellite measurements. Remote Sens. Environ. 2007, 110, 186–191. [Google Scholar] [CrossRef]
  42. Huang, J.; Yin, J.; Wang, M.; He, Q.; Guo, J.; Zhang, J.; Liang, X.; Xie, Y. Evaluation of Five Reanalysis Products With Radiosonde Observations Over the Central Taklimakan Desert During Summer. Earth Space Sci. 2021, 8, e2021EA001707. [Google Scholar] [CrossRef]
  43. Xie, H.; Zhou, T.; Fu, Q.; Huang, J.; Huang, Z.; Bi, J.; Shi, J.; Zhang, B.; Ge, J. Automated detection of cloud and aerosol features with SACOL micro-pulse lidar in northwest China. Opt. Express 2017, 25, 30732–30753. [Google Scholar] [CrossRef] [PubMed]
  44. Zhou, T.; Huang, J.; Huang, Z.; Liu, J.; Wang, W.; Lin, L. The depolarization–attenuated backscatter relationship for dust plumes. Opt. Express 2013, 21, 15195–15204. [Google Scholar] [CrossRef] [PubMed]
  45. Zhou, T.; Xie, H.; Bi, J.; Huang, Z.; Huang, J.; Shi, J.; Zhang, B.; Zhang, W. Lidar Measurements of Dust Aerosols during Three Field Campaigns in 2010, 2011 and 2012 over Northwestern China. Atmosphere 2018, 9, 173. [Google Scholar] [CrossRef] [Green Version]
  46. Bravo-Aranda, J.A.; Moreira, G.D.A.; Navas-Guzmán, F.; Granados-Muñoz, M.J.; Guerrero-Rascado, J.L.; Pozo-Vázquez, D.; Arbizu-Barrena, C.; Reyes, F.J.O.; Mallet, M.; Arboledas, L.A. A new methodology for PBL height estimations based on lidar depolarization measurements: Analysis and comparison against MWR and WRF model-based results. Atmos. Chem. Phys. 2017, 17, 6839–6851. [Google Scholar] [CrossRef] [Green Version]
  47. Guo, J.; Zhang, J.; Yang, K.; Liao, H.; Zhang, S.; Huang, K.; Lv, Y.; Shao, J.; Yu, T.; Tong, B.; et al. Investigation of near-global daytime boundary layer height using high-resolution radiosondes: First results and comparison with ERA5, MERRA-2, JRA-55, and NCEP-2 reanalyses. Atmos. Chem. Phys. 2021, 21, 17079–17097. [Google Scholar] [CrossRef]
  48. Shimizu, A.; Sugimoto, N.; Matsui, I.; Arao, K.; Uno, I.; Murayama, T.; Kagawa, N.; Aoki, K.; Uchiyama, A.; Yamazaki, A. Continuous observations of Asian dust and other aerosols by polarization lidars in China and Japan during ACE-Asia. J. Geophys. Res. Atoms. 2004, 109, D19S17. [Google Scholar] [CrossRef]
  49. Shimizu, A.; Nishizawa, T.; Jin, Y.; Kim, S.-W.; Wang, Z.; Batdorj, D.; Sugimoto, N. Evolution of a lidar network for tropospheric aerosol detection in East Asia. Opt. Eng. 2016, 56, 031219. [Google Scholar] [CrossRef]
  50. Zhou, T.; Xie, H.; Jiang, T.; Huang, J.; Bi, J.; Huang, Z.; Shi, J. Seasonal characteristics of aerosol vertical structure and autumn enhancement of non-spherical particle over the semi-arid region of northwest China. Atmos. Environ. 2020, 244, 117912. [Google Scholar] [CrossRef]
  51. Seidel, D.J.; Zhang, Y.; Beljaars, A.; Golaz, J.-C.; Jacobson, A.R.; Medeiros, B. Climatology of the planetary boundary layer over the continental United States and Europe. J. Geophys. Res. Atoms. 2012, 117, D17106. [Google Scholar] [CrossRef]
  52. Vogelezang, D.H.P.; Holtslag, A.A.M. Evaluation and model impacts of alternative boundary-layer height formulations. Bound.-Layer Meteorol. 1996, 81, 245–269. [Google Scholar] [CrossRef]
  53. Guo, J.; Miao, Y.; Zhang, Y.; Liu, H.; Li, Z.; Zhang, W.; He, J.; Lou, M.; Yan, Y.; Bian, L.; et al. The climatology of planetary boundary layer height in China derived from radiosonde and reanalysis data. Atmos. Chem. Phys. 2016, 16, 13309–13319. [Google Scholar] [CrossRef] [Green Version]
  54. Bradley, R.S.; Keimig, F.T. Recent changes in the North American Arctic boundary layer in winter. J. Geophys. Res. Atmos. 1993, 98, 8851–8858. [Google Scholar] [CrossRef]
  55. Moreira, G.D.A.; Lopes, F.J.D.S.; Guerrero-Rascado, J.L.; Granados-Muñoz, M.J.; Bourayou, R.; Landulfo, E. Comparison between two algorithms based on different wavelets to obtain the Planetary Boundary Layer height. In Proceedings of the Techniques and Measurements for Atmospheric Remote Sensing X. International Society for Optics and Photonics, Amsterdam, The Netherlands, 20 October 2014; p. 92460D. [Google Scholar]
  56. Wang, M.; Xu, X.; Xu, H.; Lenschow, D.H.; Zhou, M.; Zhang, J.; Wang, Y. Features of the Deep Atmospheric Boundary Layer Over the Taklimakan Desert in the Summertime and its Influence on Regional Circulation. J. Geophys. Res. Atmos. 2019, 124, 12755–12772. [Google Scholar] [CrossRef]
  57. Mao, F.; Gong, W.; Song, S.; Zhu, Z. Determination of the boundary layer top from lidar backscatter profiles using a Haar wavelet method over Wuhan, China. Opt. Laser Technol. 2012, 49, 343–349. [Google Scholar] [CrossRef]
  58. Wang, H.; Li, Z.; Lv, Y.; Zhang, Y.; Xu, H.; Guo, J.; Goloub, P. Determination and climatology of the diurnal cycle of the atmospheric mixing layer height over Beijing 2013–2018: Lidar measurements and implications for air pollution. Atmos. Chem. Phys. 2020, 20, 8839–8854. [Google Scholar] [CrossRef]
  59. Caicedo, V.; Rappenglück, B.; Lefer, B.; Morris, G.; Toledo, D.; Delgado, R. Comparison of aerosol lidar retrieval methods for boundary layer height detection using ceilometer aerosol backscatter data. Atmos. Meas. Tech. 2017, 10, 1609–1622. [Google Scholar] [CrossRef] [Green Version]
  60. Zhang, M.; Tian, P.; Zeng, H.; Wang, L.; Liang, J.; Cao, X.; Zhang, L. A Comparison of Wintertime Atmospheric Boundary Layer Heights Determined by Tethered Balloon Soundings and Lidar at the Site of SACOL. Remote Sens. 2021, 13, 1781. [Google Scholar] [CrossRef]
  61. Moreira, G.D.A.; Lopes, F.J.D.S.; Guerrero-Rascado, J.L.; Ortiz-Amezcua, P.; Cazorla, A.; De Oliveira, A.P.; Landulfo, E.; Alados-Arboledas, L. Comparison Among the Atmospheric Boundary Layer Height Estimated From Three Different Tracers. In Proceedings of the 29th International Laser Radar Conference (ILRC), Hefei, China, 24 June 2019; p. 03009. [Google Scholar]
  62. Zhang, L.; Zhang, H.; Li, Q.; Wei, W.; Cai, X.; Song, Y.; Mamtimin, A.; Wang, M.; Yang, F.; Wang, Y.; et al. Turbulent Mechanisms for the Deep Convective Boundary Layer in the Taklimakan Desert. Geophys. Res. Lett. 2022, 49, e2022GL099447. [Google Scholar] [CrossRef]
  63. Zhang, Q.; Zhang, J.; Qiao, J.; Wang, S. Relationship of atmospheric boundary layer depth with thermodynamic pro-cesses at the land surface in arid regions of China. Sci. China Earth Sci. 2011, 54, 1586–1594. [Google Scholar] [CrossRef]
  64. Ma, M.; Tan, Z.; Ding, F.; Chen, Y.; Yang, Y. Spatial Characteristics of Deep-Developed Boundary Layers and Numerical Simulation Applicability over Arid and Semi-Arid Regions in Northwest China. Atmosphere 2019, 10, 195. [Google Scholar] [CrossRef] [Green Version]
  65. Liu, F.; Yi, F.; Yin, Z.; Zhang, Y.; He, Y.; Yi, Y. Measurement report: Characteristics of clear-day convective boundary layer and associated entrainment zone as observed by a ground-based polarization lidar over Wuhan (30.5°N, 114.4°E). Atmos. Chem. Phys. 2021, 21, 2981–2998. [Google Scholar] [CrossRef]
  66. Su, T.; Li, Z.; Kahn, R. Relationships between the planetary boundary layer height and surface pollutants derived from lidar observations over China: Regional pattern and influencing factors. Atmos. Chem. Phys. 2018, 18, 15921–15935. [Google Scholar] [CrossRef]
  67. Gan, C.-M.; Wu, Y.; Madhavan, B.; Gross, B.; Moshary, F. Application of active optical sensors to probe the vertical structure of the urban boundary layer and assess anomalies in air quality model PM2.5 forecasts. Atmos. Environ. 2011, 45, 6613–6621. [Google Scholar] [CrossRef]
  68. Kim, M.-H.; Yeo, H.; Park, S.; Park, D.-H.; Omar, A.; Nishizawa, T.; Shimizu, A.; Kim, S.-W. Assessing CALIOP-Derived Planetary Boundary Layer Height Using Ground-Based Lidar. Remote Sens. 2021, 13, 1496. [Google Scholar] [CrossRef]
  69. Toledo, D.; Córdoba-Jabonero, C.; Adame, J.A.; De La Morena, B.; Gil-Ojeda, M. Estimation of the atmospheric boundary layer height during different atmospheric conditions: A comparison on reliability of several methods applied to lidar measurements. Int. J. Remote Sens. 2017, 38, 3203–3218. [Google Scholar] [CrossRef]
  70. Dang, R.; Yang, Y.; Li, H.; Hu, X.-M.; Wang, Z.; Huang, Z.; Zhou, T.; Zhang, T. Atmosphere Boundary Layer Height (ABLH) Determination under Multiple-Layer Conditions Using Micro-Pulse Lidar. Remote Sens. 2019, 11, 263. [Google Scholar] [CrossRef] [Green Version]
  71. Knepp, T.; Szykman, J.; Long, R.; Duvall, R.; Krug, J.; Beaver, M.; Cavender, K.; Kronmiller, K.; Wheeler, M.; Delgado, R.; et al. Assessment of mixed-layer height estimation from sin-gle-wavelength ceilometer profiles. Atmos. Meas. Tech. 2017, 10, 3963–3983. [Google Scholar] [CrossRef] [PubMed] [Green Version]
  72. Su, T.; Li, Z.; Kahn, R. A new method to retrieve the diurnal variability of planetary boundary layer height from lidar under different thermodynamic stability conditions. Remote Sens. Environ. 2020, 237, 111519. [Google Scholar] [CrossRef]
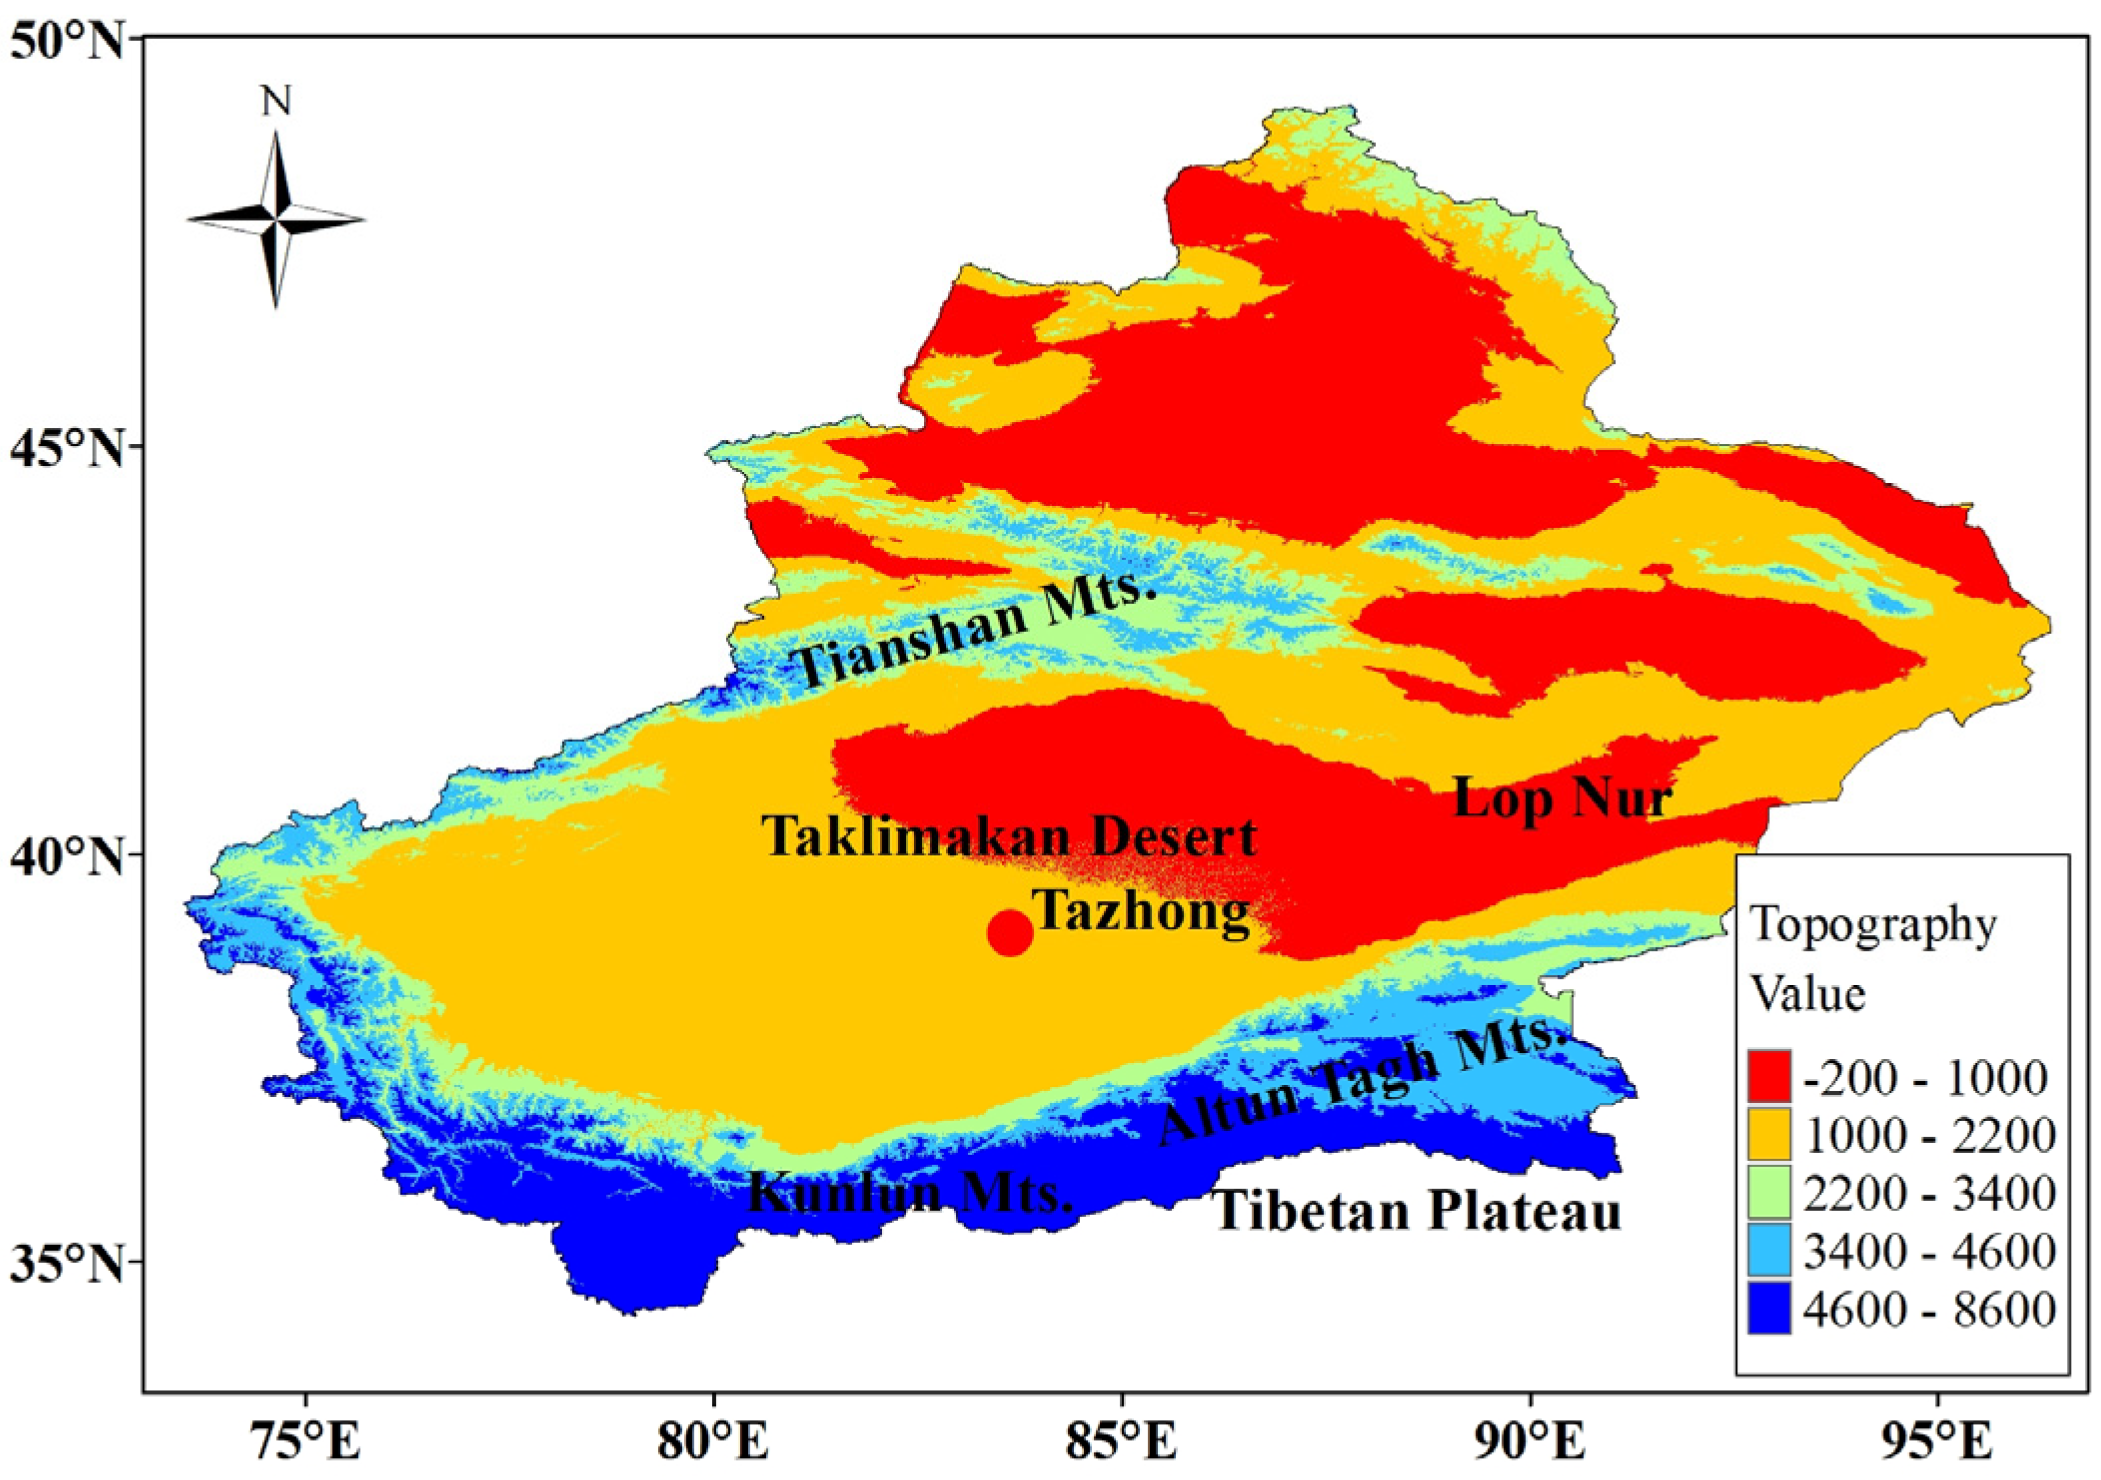
Figure 1. Topographical map of Xinjiang Province, China. The red solid dot marks the location of Tazhong.
Remotesensing 14 05436 g001
Figure 2. (a) Profile of the temperature (left) and Ri (right) calculated using radiosonde data. Dotted line represents the ABLH identified by SBI and Ri methods. Additionally, (b) Scatterplot of the ABLH determined by Ri method and SBI based on radiosonde observations, respectively.
Remotesensing 14 05436 g002
Figure 3. Profiles of six situations mentioned by ADELIP are as follows: (a) Represents the case during night, which reveals the SBL and inversion on backscatter profile. (b) Represents the case wherein the mixing layer developed. (c) Represents the transition case of the mixing layer dropping down. (d) Represents the SBL. (e) Represents the mixing layer developing and revealing differences with RL in VLDR profile. (f) Represents the case therein the dust event appeared. The black profile is associated with lidar return signal, whilst the grey profile is associated with VLDR. The red triangle represents the ABLHADELIP identified by ADELIP; the blue plus sign represents the ABLHPOLARIS identified by POLARIS; the black square represents the ABLHsonde; and the green cross represents the ABLHERA5. The green dashed lines represent the stratification of sub-layers.
Remotesensing 14 05436 g003
Figure 4. Flow chart of ADELIP to retrieve the ABLH that was used in this study. HPOLARIS is the ABLH provided by the POLARIS method, which is applied as the height limitation. Hdust represents the height retrieved by the maximum wavelet coefficient of the MHAT based CWT on NAB in dust event. VDR and VNAB, respectively, represent the variance of VLDR derivatives and NAB derivatives in certain sub-layers; n represents the number of sub-layers; NDR represents the number of VLDR data points where VLDR is greater than 0.5; NNAB represents the number of NAB derivatives that are greater than 0.
Remotesensing 14 05436 g004
Figure 5. The time-height indications of the sunny day on 16 July 2021. (a) Attenuated backscattering coefficient (ABC); (b) Volume liner depolarization ratio (VLDR) at a 532 nm wavelength; (c) The ground meteorological elements of temperature, relative humidity and wind speed. The atmospheric boundary layer height (ABLH) of different approaches were indicated by using corresponding labels: Black plus: POLARIS; Black triangle: ADELIP; Pink diamond: radiosonde; Purple cross: ERA5. Local noon time is 14:26 (Beijing time).
Remotesensing 14 05436 g005
Figure 6. The time-height indications of the sunny day on 13 July 2021. (a) Attenuated backscattering coefficient (ABC); (b) Volume liner depolarization ratio (VLDR) at a 532 nm wavelength; (c) The ground meteorological elements of temperature, relative humidity and wind speed. The atmospheric boundary layer height (ABLH) of different approaches were indicated by using corresponding labels: Black plus: POLARIS; Black triangle: ADELIP; Pink diamond: radiosonde; Purple cross: ERA5. Local noon time is 14:26 (Beijing time).
Remotesensing 14 05436 g006
Figure 7. The time-height indications of the sunny day on 17 July 2021. (a) Attenuated backscattering coefficient (ABC); (b) Volume liner depolarization ratio (VLDR) at a 532 nm wavelength; (c) The ground meteorological elements of temperature, relative humidity and wind speed. The atmospheric boundary layer height (ABLH) of different approaches were indicated by using corresponding labels: Black plus: POLARIS; Black triangle: ADELIP; Pink diamond: radiosonde; Purple cross: ERA5. Local noon time is 14:26 (Beijing time).
Remotesensing 14 05436 g007
Figure 8. Scatter plots of: (a) ABLHADELIP and ABLHsonde; (b) ABLHsonde and ABLHERA5. The red line represents the fitting line.
Remotesensing 14 05436 g008
Figure 9. Similar to Figure 8, but it relates to ABLHADELIP and ABLHERA5 during different times (Beijing time). (a) Period from 11:00 to 21:00 and (b) period from 0:00 to 10:00.
Remotesensing 14 05436 g009
Figure 10. (a) Boxplot of ABLH differences between ADELIP and radiosonde (DA-R: ABLHADELIP minus ABLHsonde), ERA5 and radiosonde (DE-R: ABLHERA5 minus ABLHsonde), ADELIP and ERA5 during the daytime (DA-E(D): ABLHADELIP minus ABLHERA5), ADELIP and ERA5 during the nighttime (DA-E(N)). (b) boxplot of ABLH differences between POLARIS and ERA5 during the daytime (DP-E(D): ABLHPOLARIS minus ABLHERA5) and the nighttime (DP-E(N): ABLHPOLARIS minus ABLHERA5), with the difference between gradient method to ERA5 during the daytime (DG-E(D): ABLHPOLARIS minus ABLH derived by gradient method) and the nighttime (DG-E(N): ABLHPOLARIS minus ABLH derived by gradient method). Median and mean values of each box are given.
Remotesensing 14 05436 g010
Figure 11. Diurnal variation of ABLHs retrieved by four methods from 11 July to 17 July 2021. The red and orange lines indicate the averaged ABLHADELIP and ABLHPOLARIS based on lidar measurements, respectively. The green and bule lines represent the ABLHsonde and ABLHERA5 using the Ri method, respectively. The shadows represent the standard deviations. Local noon time is 14:26 (Beijing time).
Remotesensing 14 05436 g011
Figure 12. The profiles of four variables for non-dust storm case ((a) 22:00 on 11 July 2021), after the severe dust storm case ((b) 22:00 on 12 July 2021) and during the severe dust storm case ((c) 19:00 on 17 July 2021). From left to right, these variates are: ABC and VLDR from lidar, air temperature, wind speed and Richardson number from radiosonde and ERA5.
Remotesensing 14 05436 g012
Figure 13. Profiles of mean difference between ERA5 and radiosonde (take radiosonde data as true value) in non-dust events and dust events of (a) temperature and (b) wind speed, with error bars exhibited. In addition, scatterplot of ERA5 and radiosonde in non-dust events and dust events of (c) temperature and (d) wind speed.
Remotesensing 14 05436 g013
Table 1. Detailed information of the RM-04 Polarization Lidar.
Technical IndicatorParameter
=Laser typeNd: YAG
Laser wavelength532 nm, 1064 nm
Receive channel532 nm ‖, 532 nm ⊥, 1064 nm
DetectorAPD, PMT
TelescopeCassegrain
FOV2 mrad
Pulse frequency20 HZ
Pulse energy100 mJ
Maximum detectable range15 km
Time resolution3 min
Vertical resolution7.5 m
Publisher’s Note: MDPI stays neutral with regard to jurisdictional claims in published maps and institutional affiliations.