Article

Long-Term Performance Evaluation of the Latest Multi-Source Weighted-Ensemble Precipitation (MSWEP) over the Highlands of Indo-Pak (1981–2009)

1
State Key Laboratory of Desert and Oasis Ecology, Xinjiang Institute of Ecology and Geography, Chinese Academy of Sciences, Urumqi 830011, China
2
University of Chinese Academy of Sciences, Beijing 100049, China
3
Institute of Geographical Information Systems (IGIS), National University of Sciences and Technology (NUST), Islamabad 44000, Pakistan
4
State Key Laboratory of Geomechanics and Geotechnical Engineering, Institute of Rock and Soil Mechanics, Chinese Academy of Sciences, Wuhan 430071, China
*
Author to whom correspondence should be addressed.
Remote Sens. 2022, 14(19), 4773; https://doi.org/10.3390/rs14194773
Submission received: 12 August 2022 / Revised: 11 September 2022 / Accepted: 21 September 2022 / Published: 24 September 2022

Abstract

:
The paucity of in-situ records, particularly in the glaciated mountainous region, is an obstacle in cryosphere ecology and environmental studies. Generally, available gauge station data is fragmented and covers valleys; thus, the use of gridded precipitation products (GPPs) is crucial in such complex terrains. However, these GPPs suffer from systematic biases and uncertainties owing to parameterization deficiencies. Therefore, the main goal of this research is to systematically evaluate the long-term performance and differences of the newly launched MSWEP in comparison to APHRO, CHIRPS, ERA-5, and PGMFD over the transboundary region of Indo-Pak (1981–2009) at spatial (whole to sub-basins) and temporal (daily to seasonal) scales. Findings reveal (1) overall, five GPPs produced well annual spatial precipitation variability with high magnitudes in the northwestern and low in the northeastern region. (2) The estimations from GPPs also divulged better correlation with in-situ observations (MSWEP = 0.86, APHRO = 0.76, ERA-5 = 0.81, CHIRPS = 0.57 and PGMFD = 0.68) at daily span. Better performance was observed during the monsoon compared to winter and pre-monsoon seasons. (3) Lately, estimates from MSWEP are more reliable for all the seasons, especially in the winter season, with the highest CC (0.90) and lowest relative bias (3.03%). (4) All GPPs (excluding ERA-5) overestimated light precipitation (0–1 mm/day) and underestimated moderate to heavy precipitation, in contrast to the ERA-5 that tended to underestimate the light but overestimate moderate (1–20 mm/day) and heavy precipitation (>20 mm/day) events. The CHIRPS was less accurate in detecting most of the precipitation events. The MSWEP product captured all precipitation intensities more accurately than other GPPs. The current research indicates considerable implications for product improvement and data users for choosing better alternative precipitation data at a local scale.

Graphical Abstract

1. Introduction

Precipitation is a substantial constituent of the hydrological cycle that plays a crucial role in sustaining hydro-climatic balance and ecological processes. As precipitation varies in space and time, thus the accurate acquisition of precipitation data on desirable spatiotemporal resolutions is essential for the relevant applications, particularly in data-scarce catchments [1,2]. However, acquiring the most reliable precipitation data on finer spatiotemporal scales is still challenging for researchers [3,4]. The in-situ gauges can generally provide accurate and reliable measurements at gauge sites. Still, their scarce distribution, especially in mountainous regions, usually constrains the spatial representation of precipitation patterns [5,6]. Moreover, hydro-meteorological studies are restricted by inhomogeneity, irregular distribution, and poor spatial coverage of ground-based observations. In recent years, satellite-based datasets have been introduced as an ancillary alternative source to detect spatio-temporal variation of precipitation with better spatio-temporal resolutions compared to conventional observations [7,8,9]. They are being used in different scientific research. Although, these datasets vary in design objectives (temporal homogeneity, instantaneous accuracy), source (analysis, reanalysis, gauge, radar satellite, or merged), spatial resolution and coverage (0.05° to 2.5° regional to worldwide), sequential span (~1 to 115 years), and computing (~half-hour to various years). These products are derived from a variety of sources. In general, such products are divided into the following four primary groups: (1) gauging-based datasets: which are created from observed station data using various interpolation methods and are being widely used, for instance, at the Global Precipitation Climatology Centre (GPCC); However, the spatial resolution of these products is low (0.5°), always argued particularly in data-scarce glaciated regions; (2) atmospheric model-based datasets, or numerical weather estimations, are derived from coupling both in-situ observations and satellite data, considering various atmospheric properties as input. The European Centre for Medium-Range Weather Forecasts (ECMWF) is an example of this product group; (3) satellite-based datasets, which mainly use infrared (IR), microwave (MV), or a combination of both IR and MV algorithms. Validation and assimilation with rain-gauge data are required primarily to increase the precision of these products. Furthermore, systematic biases in satellite rainfall data are common and can be largely pronounced in regions with low precipitation amounts or in snow and ice-covered areas. Tropical Rainfall Measuring Mission (TRMM) Multi-Satellite Precipitation Analysis (TMPA) is an example of this group. (4) Satellite-gauged datasets, such as Climate Hazards Group Infrared Precipitation with Stations (CHIRPS), merge both satellite and gauge datasets using diverse techniques [10,11]. Hence, using the GPPs, either individually or in combination, offers a promising solution to the unavailability of climate data. These products have great worth in sparse and glaciated mountainous regions, especially in developing countries, where the distribution of conventional observations is heterogeneous [12]. At present, a variety of products are available at finer spatio-temporal resolutions and have been applied in multiple applications, for instance, hydrological modeling [13,14,15,16], drought analysis [17], and agronomy [18]. However, these datasets still have some constraints, for instance, the topographical influences, retrieval algorithms, clouds, and inadequate sensibility of electromagnetic signals [19,20,21]. However, in a windy atmosphere and rugged terrain, detecting and measuring precipitation occurrences at high altitudes is a challenge for satellites as reflectivity from snow and ice reduces the effectiveness of passive sensing in mountainous regions [22]. In cryosphere areas, the atmosphere is typically dry and does not contribute to satellite measurements [23], which can produce more uncertainties and biases that could limit our understanding of hydro-meteorological studies. Therefore, the accuracy of these products is questionable [24]. Thus, the credibility of GPPs should be evaluated against an appropriate dataset before it can be reinforced as input. Their credibility is beneficial for developers and users, where developers can diagnose the problems from feedback and improve the quality of products. On the other hand, analyzed results will enable the data users to consider the possible uncertainties related to a specific dataset and select an appropriate product for particular applications in a specific area of interest.
Since the launch of GPPs, the majority of these products have been assessed based on their suitability and usability for a particular region. Most of these assessments are carried out in different parts of the world. Still, very few studies are conducted for the Hindukush, Karakorum, and Himalayas (HKH), including the upper Indus Basin (UIB) region [2,11,25,26]. This region is termed the third pole as it stores the largest amount of (frozen) water after polar regions, which feeds the rivers with fresh water and accommodates millions of people living downstream. Previous studies revealed the mass balance of this region had been significantly altered by significant atmospheric warming, which has also impacted the water resources of countries downstream [26,27,28]. Thus, precise and accurate precipitation measurements are required to develop actionable, sustainable water resource management policies. Henceforth, this study is carried out (1) to provide more information about bias and uncertainties in datasets, specifically in the glaciated mountain region. Therefore, the primary purpose of our research is (2) to evaluate the performance and differences of the newly launched Multi-Source Weighted-Ensemble Precipitation (MSWEP) parallel to four other GPPs over the JRB. The selected four products are European Atmospheric Reanalysis (ERA5), APHRODITE, Princeton Global Meteorological Forcing Dataset for Land Surface Modeling (PGMFD), and Climate Hazards Group Infrared Precipitation with Stations (CHIRPS). We aimed (3) to recognize the datasets with the best performance combined with available gauged data to procure finer quality data than individual products. Such rectified precipitation products are essential for operational applications and ongoing research. The study findings would be significant in understanding the accuracy and error characteristics of multiple products for algorithm developers and users that could be used as baseline information for similar research, particularly in snow-fed mountainous watersheds.

2. Materials and Methods

2.1. Study Area Description

The Jhelum River Basin (JRB) is one of the most crucial sub-basins (SBs) of the Upper Indus River Basin (UIB), located within the longitude of 73°–75.62°E and latitude of 33°–35°N, covers the western mountainous region of Himalayas (Figure 1). The entire basin has large spatio-temporal climate variability with an annual average precipitation of 835.83 mm and an annual mean temperature of 13.5 °C, with increasing elevation from south to north decreasing the temperature of the basin. For instance, Narran (situated northern part of the basin) and Mangla (situated southern portion) experience the coldest and hottest areas, having annual mean temperatures of 7.16 °C and 26.54 °C, respectively. Generally, the climate of the JRB is influenced by two central rainfall systems, south Asian summer monsoon (atmospheric circulation) and winter westerlies circulations (anticyclonic circulation). Furthermore, JRB is the main eastern tributary of the Indus River, that flows toward the south slopes of the Himalayan and Pir Panjal, which drainage 33,468 km2 of area, and finally dammed up through Mangla reservoir, which is the second largest storage reservoir of Pakistan and seventh in the world, having 7.29 km3 of gross storage capacity [29]. This dammed water is primarily utilized for two primary purposes, (i) for irrigation, which helps to irrigate 60,000 km2 of land, and (ii) used for the generation of electricity. Its entire installed capacity is 1000 MW, which is 6% of the country’s total installed capacity [30].
The area above the Mangla reservoir is called Mangla catchment; about 14.97% area of the basin is located above 6000 m above sea level (a.s.l.) (Figure 1b, Table 1). Thus, in the JRB catchment, snow and glacier melt plays a significant role in runoff in early summer (April-mid-June), while amasses in the winter owing to westerlies influences, whereas, during the summer season (end of June to August), monsoon precipitation is dominated [31]. Also, JRB is a straddling river basin distributed between Pakistan and India. About 56% (18,965 km2) of the area is in the territory of India, while 46% (14,965 km2) is in Pakistan.

2.2. Conventional Observation from Rain Gauged Stations

The daily observed precipitation data of 12 gauging stations in Pakistan was collected from Water and Power Development Authority (WAPDA) and Pakistan Meteorological Department (PMD) from January 1981 to December 2009. However, JRB is characterized as a highly complex and transboundary (India and Pakistan) catchment whose accurate information is substantial to water resources management. At the same time, it’s hard to collect in-situ observation data due to geopolitical issues. Thus, we used daily summaries of observed precipitation at ten referenced stations provided by the NOAA National Climatic Data Center, accessed from https://www.ncdc.noaa.gov/cdo-web/ (accessed on 25 June 2020). Geographical information of in-situ weather stations used in the current study is given in Table S1. The organizations that operate weather stations in the research area follow the WMO standards for meteorological data collection. The distribution of meteorological stations is scarce in the study area (Figure 1c). These stations were installed at different elevations, i.e., Mangla is located at the minimum elevation of 335 m (a.s.l.), while Store is at the elevation of approximately 5432.32 m (a.s.l.) Table S1. These meteorological stations use tipping bucket rain gauges to measure liquid precipitation. In cases of infrequent snowfall, the manually calculated water equivalent is traditionally applied to the daily rainfall data. During 1994–1995, WAPDA installed automatic data collection platforms (DCPs) in high-altitude areas [26]. These DCPs use snow pillows to record solid and liquid precipitation as water equivalents. Due to possible ice bridging and rupture effects, mostly installed snow pillows experienced technical problems with transmission system interfacing and unexpected “jumps.” Even though these problems were greatly alleviated in 1996 by attaching a highly precise potentiometer to convert the shaft encoders from digital to analog output, wind-induced errors continue to affect the quality of precipitation records at higher altitudes of >3000 m [31]. As a result, underestimation of precipitation by gauging observations due to wind-induced errors at higher altitudes may cause a slight positive bias in GPPs [25,26]. Most of the evaluated products integrate rain gauge data from various sources and employ multiple algorithms. Therefore, to ensure an independent evaluation, gauging stations used as ground truth should not be used in the development of these products to be evaluated. Thus, it is worth noting that the gauging stations used in this assessment were not included in the Global Precipitation Climatology Centre (GPCC) network products [25,26], which justifies the independent evaluation in the present research. In addition, the in-situ gauge-based precipitation estimates are typically regarded as the authoritative source of precipitation data for validating satellite-based precipitation products [32]. Thus, the five GPPs data were evaluated against in-situ gauge-based data. Furthermore, keeping in view the uncertainties in gauge-based data, the quality checks have also been carried out by using the standard normalized homogeneity test (SNHT) method [33] by following the procedure proposed by [34]. According to the normality and homogeneity tests at a 0.05 significant level, overall, the time series was normalized.

2.3. Detailed Information on Gridded Precipitation Products (GPPs)

During the last three decades, the construction of the analyzed fields of precipitation across the globe has been extensively improved. As documented in the introduction, several global/regional scale GPPs are now accessible for hydro-meteorological studies. Giving importance to a primary group of datasets, thus, at least one product from each dataset category has been selected in this study to evaluate their accuracy and highlight intrinsic errors associated with these products. The attributes of selected GPPs are summarized in Table 2. The selection criteria were: (I) a good cross-section of their sources and methods of generation; (II) ease of accessibility and availability as final products in published datasets; (III) possible appropriateness for regional-scale applications; and (IV) potential usefulness for hydrological modeling research.
The Multi-Source Weighted-Ensemble Precipitation (MSWEP) data version 2.2 is derived from the gauge, reanalysis, and satellite datasets, providing global data from 1979 to the present with a high spatial resolution of 0.1° × 0.1°, at the temporal resolution of 3-h near to real-time, particularly developed for hydrological modeling. The MSWEP dataset is unique owing to it combines gauged, for instance, Global Precipitation Climatology Centre (GPCC), Global Summary of the Day (GSOD), Global Historical Climatology Network-Daily (GHCN-D), and WorldClim, atmospheric model-based reanalyzes, i.e., interim reanalysis (ERA-Interim), Japanese 55-year Reanalysis (JRA-55) and European Centre for Medium-Range Weather Forecasts (ECMWF), satellites, for instance, Tropical Rainfall Measuring Mission (TRMM) Multi-satellite Precipitation Analysis (TMPA) 3B42RT), Gridded Satellite (GridSat), Global Satellite Mapping of Precipitation (GSMaP), and Climate Prediction Center morphing technique (CMORPH) precipitation measures to exhibit better performance in both homogeneous gauged and scarcely gauged region. A more exhaustive overview of algorithm development of MSWEP is given in [35]. It provides good opportunities to investigate the spatio-temporal variations in precipitation to understand hydrological processes and their parameterization better and enhance hydrological model performance. We accessed the latest and improved version of MSWEP data (version 2.2) which was released in March 2018 for the period spanning from 1979 to 2009. The MSWEP data is available at http://www.gloh2o.org/mswep (accessed on 21 November 2020).
The European Atmospheric Reanalysis (ERA-5), the 5th generation global atmospheric reanalysis product with an upgraded atmospheric model and assimilation system, provides data from 1950–1978 (preliminary version) and from 1979 up to now at the spatial resolution of 0.25°. The European Centre released the product for Medium-Range Weather Forecasts (ECMWF) [36,37]. ERA-5 provides hourly data on several land-surface, atmospheric, and sea-state variables, along with uncertainty estimates [38,39]. It produces atmospheric variables at 139 pressure levels using a more advanced 4D-var integration scheme and is available at hourly steps [40]. As the ERA-Interim reanalysis is substituted by ERA-5 dated 31 August 2019, it is important to evaluate whether ERA-5 can increase performance compared to ERA-Interim before it can be used in any application. ERA-5 data is available at the ECMWF portal https://cds.climate.copernicus.eu/#!/search?text=ERA5&type=dataset (accessed on 19 October 2020). More detailed information is written in [36]. Here, we accessed the total precipitation data on single levels (1981–2009) at hourly timestep and summed it up to a daily timescale. Nevertheless, ERA-5 provides total precipitation in equivalent meter units; hence the unit conversion from meter to millimeter is substantial compared to gauge observation.
APHRODITE stands for the Asian Precipitation-high Resolved Observational Data Integration Towards Evaluation of Water Resources. It is advanced with a high-resolution daily precipitation product that was elaborated by the collaboration of the Research Institute for Humanity and Nature (RIHN) Japan and the Meteorological Research Institute of Japan Meteorological Agency (JMA/MRI) derived from a dense rain gauges observational network in Asia. It has been used by serval researchers, specifically in the UIB region [26,41,42]. More detail about the algorithm can be found in [43]. However, the high-resolution (0.05°) precipitation product is prohibited for public use and is available only for partner institutes. Henceforth, we accessed the latest improved daily dataset for Monsoon Asia (APHRO_MA_V1101 and APHRO_MA_V1101EX_R1), covering 60.0E–150.0E, 15.0S–55.0N at a high spatial extent of 0.25° for the periods extending from 1981–2007 and 2007–2009 respectively. It is accessible from http://www.chikyu.ac.jp/precip/ (accessed on 8 September 2020).
Princeton Global Meteorological Forcing Dataset (PGMFD) for land surface modeling is a blend of gauge and reanalysis data developed by Princeton University. The PGMFD product provides various climatic variables, including precipitation at the spatial resolutions of 1.0°, 0.5°, and 0.25° and temporal resolutions of 3 h, daily and monthly, from 1948 to 2010 for a global scale. This dataset is created by combining reanalysis from the National Centers for Environmental Prediction–National Center for Atmospheric Research (NCEP–NCAR), also denoted as (NCEP reanalysis) and a group of globally gauged-based products. To generate the final PGMFD precipitation dataset, four products such as TRMM 3-h real-time data, NCEP reanalysis, Climatic Research Unit (CRU) monthly precipitation data, and GPCP daily precipitation data, are used in various processing mechanisms [44]. The PGMFD data has high spatial resolutions and global coverage that shows this product has multiple potential applications and has been used only in the UIB region [45], where JRB was excluded; therefore, we selected this product in our study to evaluate its credibility. The PGMFD data is available at http://hydrologyprinceton.edu/data.pgf.php (accessed on 28 September 2020).
The Climate Hazards Center Infrared Precipitation with Station (CHIRPS) is a quasi-global precipitation product belonging to the satellite-gauge category, covering 50°S–50°N. It provides daily precipitation data at various spatial resolutions, i.e., 0.25° and 0.05°, and from 1981 to the present [46]. The CHIRPS product is constructed using primary datasets such as monthly precipitation climatology (CHPclim), which is erected using gauge observations obtained from GHCH and FAO, Cold Cloud Duration (CCD) information based on thermal infrared data archived from CPC and NOAA National Climate Data Center (NCDC), the Version 2 atmospheric model rainfall field from the NOAA Climate Forecast System (CFS), and the rain gauge stations data from multiple sources. To produce the 5-daily CCD-based precipitation estimates, at the first stage, CCD data is calibrated with TRMM 3B42 and then converted to the fraction of the long-term average precipitation estimations. After that, those fractions are multiplied with CHPclim data to eliminate systematic errors. Finally, the CHIRPS data is combined with gauge data using an improved inverse distance weighting algorithm to generate the final CHIRPS product. The CHIRPS dataset has been used in various hydroclimatic studies across the globe because of the high quality of the datasets [47,48,49]. Thus, we used and evaluated daily CHIRPS V2.0 precipitation data at the spatial extent of 0.05° from 1981 to 2009. The data are available at: https://data.chc.ucsb.edu/products/CHIRPS-2.0 (accessed on 23 October 2020).

2.4. Methodology

The difference in spatial resolution of gauge-based (point) data and GPPs is a typical scale mismatch problem that needs to be addressed prudently. The primary cause of this issue is the difference in their source of spatial coverages. For instance, rain gauge stations provide point data, whereas GPPs exhibit the grid-scale precipitation measures (for example, 0.25° and 0.1° for the APHRO, CHIRPS, ERA5, PGMFD, and MSWEP datasets, respectively). For a fine comparison among GPPs, the datasets (i.e., MSWEP and CHIRPS 0.10°, 0.05°, respectively) were resampled to the standard grids (0.25) following [50]. However, serval methods are available for comparing GPPs data with gauging observations, case-in-point upscaling (US) [51], downscaling (DS) [52], and direct comparison (DC) [53] methods. In recent decades several interpolation methods have been applied for the upscaling point data, which include the Kriging Interpolation, Thiessen polygon, and the Inverse Distance Weighting (IDW) methods [9,54,55]. For the US method, many meteorological stations are required to create a high-resolution gridded dataset consisting of observations because coarser grids cannot resolve the processes at fine scales [56]. In contrast, the DS method can downscale the GPPs and compare them to the observed precipitation. However, the results from both US and DC have argued that these methods could contain significant errors and uncertainties [19,57]. To overcome the uncertainties caused by US or DS, a third (DC) method is introduced [53]. In the DC method, the precipitation from a single station or the average of all stations within a grid cell is compared to the corresponding grid of the gridded dataset. DC method is regarded as the most appropriate method as it avoids the uncertainties caused by US or DS, particularly in the region where the distribution of gauging stations is heterogeneous. Considering the complexity of the basin (small number of gauging stations, topography, and influence of two different precipitation systems), the DC method suites the performance evaluation of GPPs against gauge-based observations. Hence, the performance of GPPs was assessed at different spatial (basin to basin) and temporal (daily, monthly, and annual) scales.
For the credibility evaluation of the five GPPs against rain gauge data, various error evaluation metrics such as Correlation coefficient/CC, Root Mean square Error/RMSE, relative bias, and relative BIAS in percentage/rBIAS% were applied. The statistical metric CC was computed to appraise the degree of collinearity between reference rain gauge data and GPPs estimations. The RMSE was used to estimate the mean error magnitude (mm per unit) between reference data and GPPs; having smaller RMSE values of GPPs estimations indicates it is closer to the reference data. The BIAS (in millimeter) was applied to evaluate systematic bias in precipitation amounts procured by two data sources. Bias (in percent) was applied to quantify the differences between reference data and GPPs. These four continuous statistical metrics were conducted using the following equations:
C C = i = 1 n ( O i O ¯ ) ( G i G ¯ ) i = 1 n ( O i O ¯ ) 2 i = 1 n ( G i G ¯ ) 2
R M S E = 1 n i = 1 n ( G i O i ) 2
B i a s = [ 1 n i = 1 n ( G i O i ) ]
r B I A S = [ i = 1 n ( G i O i ) i = 1 n O i × 100 ]
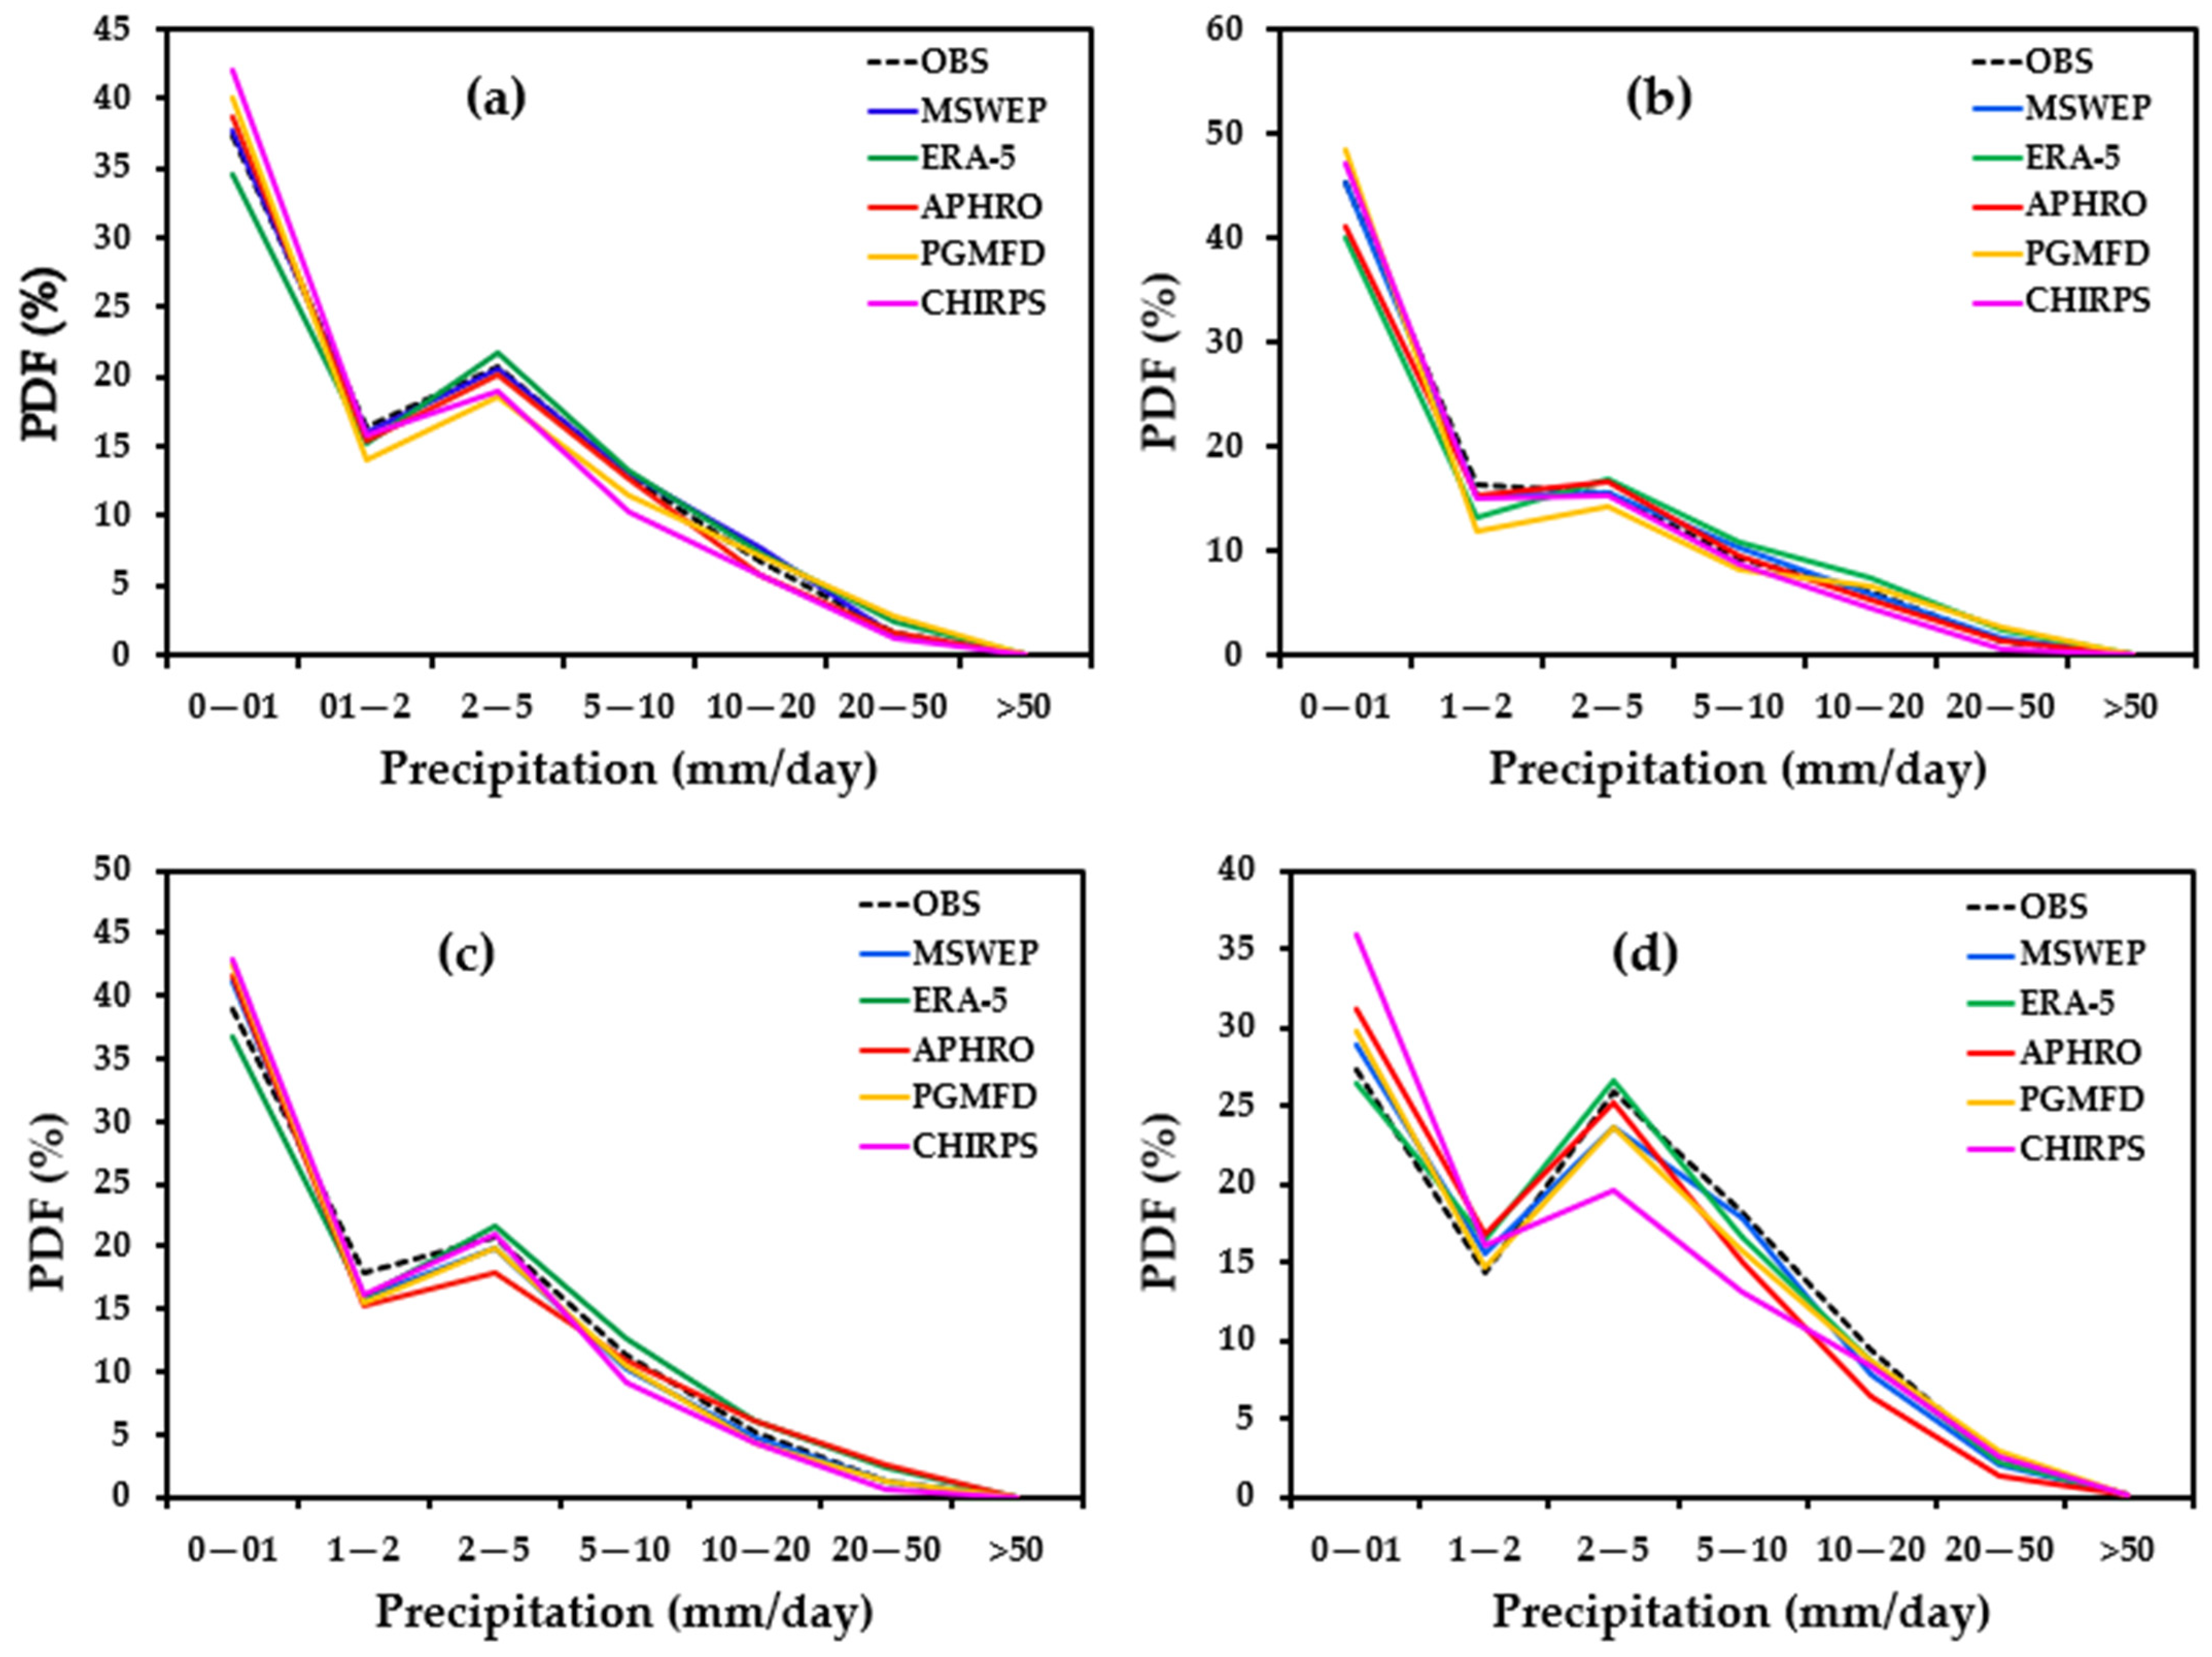
where, n = number of samples, G i = GPPs, O i = gauge Observation data and G ¯ and O ¯ are the averages of GPPs and gauges Observation data, respectively. The GPPs are deemed perfect once the optimal values of CC, RMSE, Bias, and rBIAS are 1,0,0 and 0, respectively. Furthermore, some criteria for the performance acceptance of GPPs [58,59]. Consistent with those criteria, the Correlation coefficient values must be > 0.7 while rBIAS must be between −10 to 10, whereas positive and negative values indicate both over/underestimation, respectively. The seasonal assessment was conducted by dividing the year into three seasons, for instance, winter (October–February), pre-monsoon (March–June), and Monsoon (July–September). Furthermore, the Probability Density Function (PDF) method was used to evaluate the different precipitation intensities of respective GPPs. Those intensities were divided into seven classes (mm/day) for example, (1) 0–1; (2) 1–2; (3) 2–5; (4) 5–10; (5) 10–20; (6) 20–50; (7) >50 following World Meteorological Organization (WMO) standards with slight amendment owing to the local climate system.
To assess the precipitation detection capabilities of GPPs in contrast to ground truth data, the categorical statistical metrics, including Probability of Detection (POD), False Alarm Ratio (FAR), and Critical Success Index (CSI), were applied [60,61]. The calculation of these metrics is well defined by [62]. The POD is also termed the hit rate, which indicates the ratio of precipitation events correctly sensed by the GPPs to the number of actual precipitation incidents; its optimal values show mostly precipitation incidents were detected. The FAR shows the ratio of precipitation occurrences wrongly sensed as the number of actual precipitation events. The CSI is known as the function of POD and FAR, which defines the overall skills of precipitation incidents accurately sensed by GPPs. To distinguish precipitation and non-precipitation days, the threshold of 1 mm/day was used following [63]. These categorical skill indices were calculated using the following equations [64]:
POD = H H + M
FAR = F H + F
CSI = H H + M + F
where H indicates the number of precipitation events correctly captured by respective products, M shows the number of precipitation occurrences missed (lost) by GPPs, and F represents the number of incidents falsely estimated as precipitation events by GPPs. The perfect value of POD and CSI is 1, whereas 0 is for the FAR.

3. Results

3.1. Evaluation at Annual and Monthly Scales

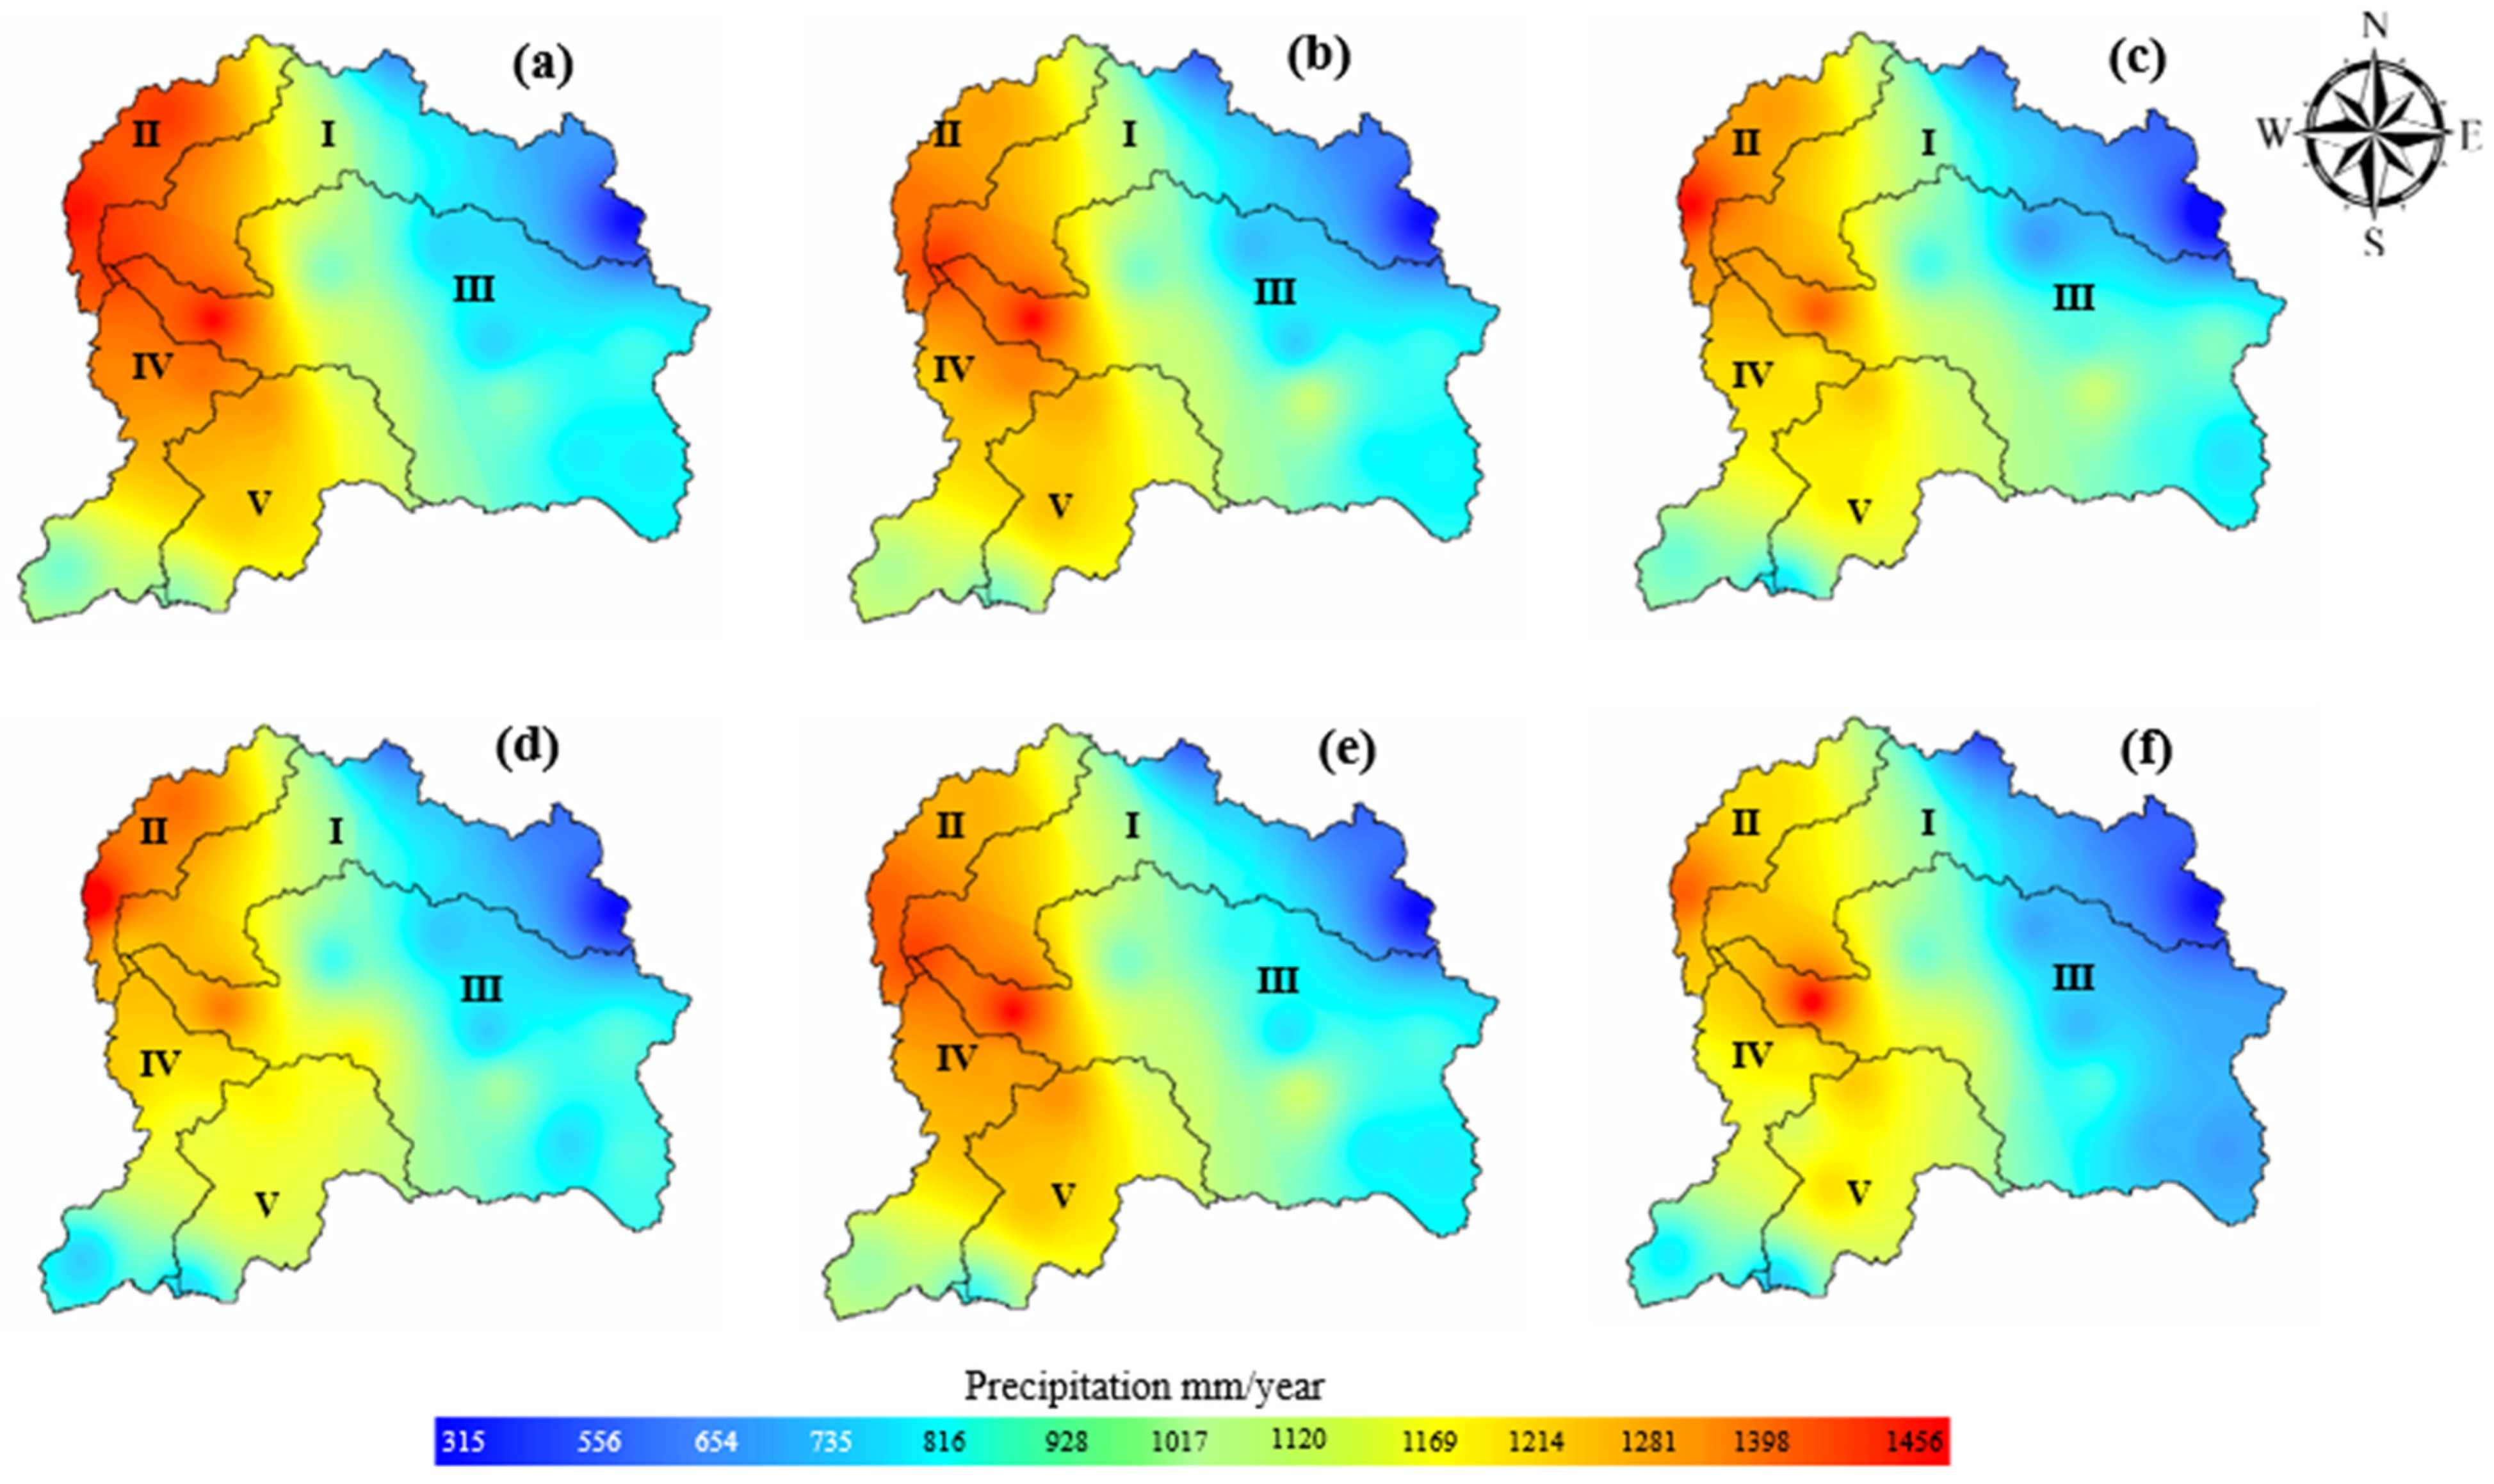
The annual average precipitation (835.83 mm/year) in JRB is computed from all available gauging stations from 1981 to 2009. The annual average precipitation, on the other hand, varied greatly between the observed and selected GPPs (Figure S1). The selected GPPs over/underestimated annual precipitation amounts. Four GPPs (MSWEP, APHRO, PGMFD, and CHIRPS) exhibited underestimation (−2.61%, −5.43%, −5.75%, and −10.56%, respectively), whereas ERA-5 showed significant overestimation (9.23%). Figure 2. depicts the horizontal spatial distribution of mean annual precipitation from gauges and GPPs over JRB. The spatial distribution of gauges showed that the higher annual average amount of precipitation was generally found in the western (from Northwest to southwest, mostly between Ⅱ and Ⅳ) parts of the JRB. In contrast, lower precipitation was distributed in the eastern region (from northeast to southeast, particularly Ⅰ and Ⅲ SBs, while SB Ⅴ has moderate precipitation) with west to east inclination (Figure 2a). Overall, all GPPs were somehow able to capture such precipitation patterns, especially the MSWEP, which offers a better spatial resolution. Likewise, the pattern of gauges, MSWEP, captured an almost concrete pattern that indicated the lower annual precipitation over the eastern part of the basin (Figure 2b). Although ERA-5, APHRO, PGMFD, and CHIRPS exhibited a higher annual distribution in the western regions. Still, these datasets were less accurate in showing the spatial pattern concerning gauge precipitation in JRB. Mainly ERA-5 is represented by the significantly higher amount of annual precipitation compared to the rest of the GPPs (Figure 2c–f).
Table 3 represents the metrics list such as CC, RMSE, Bias, and rBIAS (%) of monthly precipitation estimation, which exhibits that the MSWEP and ERA-5 have better performance with higher CC (0.92 and 0.91) and lower RMSE (23.26, 25.48 mm/month), Bias (−0.30, 0.84 mm/month) and rBias (−10.48%, 28.06%) compared to other GPPs. In particular, the CHIRPS dataset has the highest value of RMSE, followed by the PGMFD and APHRO (35.09, 32.81, and 28.25 mm/month, respectively). Among all GPPs, the MSWEP, ERA-5, APHRO, and PGMFD had relatively fewer errors in the 12 months. In comparison, the CHIRPS dataset had higher values of −1.10 Bias mm/month.
Figure S2a depicts the monthly comparison of temporal precipitation trends estimated by the GPPs against reference data from January 1981 to December 2009. According to Figure S2a. all GPPs generally have similar trends and are capable of seizing the temporal variability of gauge-based precipitation across the basin. The higher peaks of precipitation in March and July confirm the influence of westerlies and summer monsoons in the region. The slight overestimations were explicitly observed in December with the value of 4.21%, 5.46%, 2.70%, and 1.66% by MSWEP, APHRO CHIRPS, and PGMFD, respectively, and remain underestimated for the rest of the months. Furthermore, in the case of ERA-5 temporal precipitation trends were overestimated throughout all the months. Overall, the GPPs have good agreement in monthly precipitation assessments with the value of CC > 0.7 and lower rBias, except CHIRPs, which showed larger biases and lower correlation. However, the seasonal precipitation distribution revealed that the contribution of the monsoon season to annual precipitation was the greatest (42.16%) among all seasons for all GPPs (Figure S2b). For all datasets, the combined winter and pre-monsoon precipitation contribution to annual precipitation was between 25% to 32%; this is collectively called winter precipitation [2] as it mainly occurs because of the dominance of westerlies in the region.

3.2. Daily Scale Assessment

The performance of GPPs was further evaluated at the daily scale with insight into different seasons in JRB. Table 4. shows the daily and seasonal statistics of GPPs estimates in contrast to gauges throughout the entire study period. The MSWEP showed a better correlation with gauges precipitation having a CC value of 0.86, followed by ERA-5 (0.81), APHRO (0.77), PGMFD (0.68), and CHIRPS (0.57). This correction revealed good agreements between GPPs and gauges data. However, the selected GPPs underestimated daily precipitation over the JRB, with rBias values ranging from −5.94% to −25.76%, except the ERA-5, which showed an overestimation with the rBias value of 26.43%. These results are similar to other studies that have concluded similar findings of over and underestimations by ERA-5 and APHRO, PGMFD, and CHIRPS, respectively, in different regions of the world [2,19,26,65,66]. In addition, the CHIRPS exhibited high Bias values (−1.36 mm/day), ensuring more systematic errors still exist. Regarding RMSE, all GPPs displayed error magnitudes ranging from 2.29 to 3.99 mm/day. All GPPs could detect the precipitation occurrence in different seasonal periods over the whole basin. The MSWEP could detect the precipitation occurrence with the highest POD value of 0.75 (75%), whereas ERA-5, APHRO, PGMFD, and CHIRPS captured 71%, 61%, 60%, and 52% of precipitation occurrence, respectively. In terms of FAR, the MSWEP showed the lowest FAR value (0.14), indicating good performance in the detection of a limited number of unrealistic precipitation events, followed by ERA-5 (0.15) and APHRO (0.17), PGMFD (0.19). The CHIRPS additionally (0.25) detected precipitation days falsely; these events are not recorded by in situ gauges. Concerning CSI, the MSWEP dataset also revealed the highest value (0.72), suggesting the best performance compared to other GPPs. A similar assessment was carried out to analyze the credibility of the GPPs in estimating seasonal precipitation. Overall, the MSWEP demonstrated good performance than other GPPs in all seasons. Precisely, it showed the higher performance in winter season with highest values of CC (0.90), POD (0.86), CSI (0.83) and lower values of RMSE (1.80 mm/day), Bias (0.10 mm/day), rBias (3.03%), and FAR (0.06). In the case of ERA-5, that overestimated the observed daily precipitation amounts in entire seasons. However, it showed better performance in monsoon indicated highest values of CC (0.85), POD (0.81), CSI (0.78) and lowest values of RMSE (3.24 mm/day), Bias (0.58 mm/day), rBias (24.18%), and FAR (0.09).The performance of other products such as APHRO and PGMFD was also good in all seasons, whereas APHRO performed better than PGMFD during all seasons; particularly, it exhibited the best performance in monsoon season with the highest values of CC (0.78), POD (0.77), CSI (0.76) and lowest RMSE (3.35 mm/day) Bias (−0.33 mm/day), rBias (−10.96%) and FAR (0.10). While PGMFD exhibited the highest CC (0.71) and smallest values of RMSE (3.61 mm/day), specifically during monsoon season, suggesting moderate agreement with the reference data. The CHIRPS product consistently indicated poor performance in seven statistical indices throughout all seasons. Based on its individual performance, it was just satisfied, particularly in monsoon with the value of CC (0.59), RMSE (3.86 mm/day), Bias (−1.30 mm/day), rBias (−23.71%), POD (0.58), FAR (0.13) and CSI (0.57) compared to other seasons. Overall, the CHIRPS product’s performance was poor and can be categorized as a poor-performing dataset among all GPPs in the JRB. In contrast to all GPPs, the MSWEP exhibited good performance in detecting precipitation incidence, as substantiated by significant values of CSI ranging from 0.72 to 0.83.
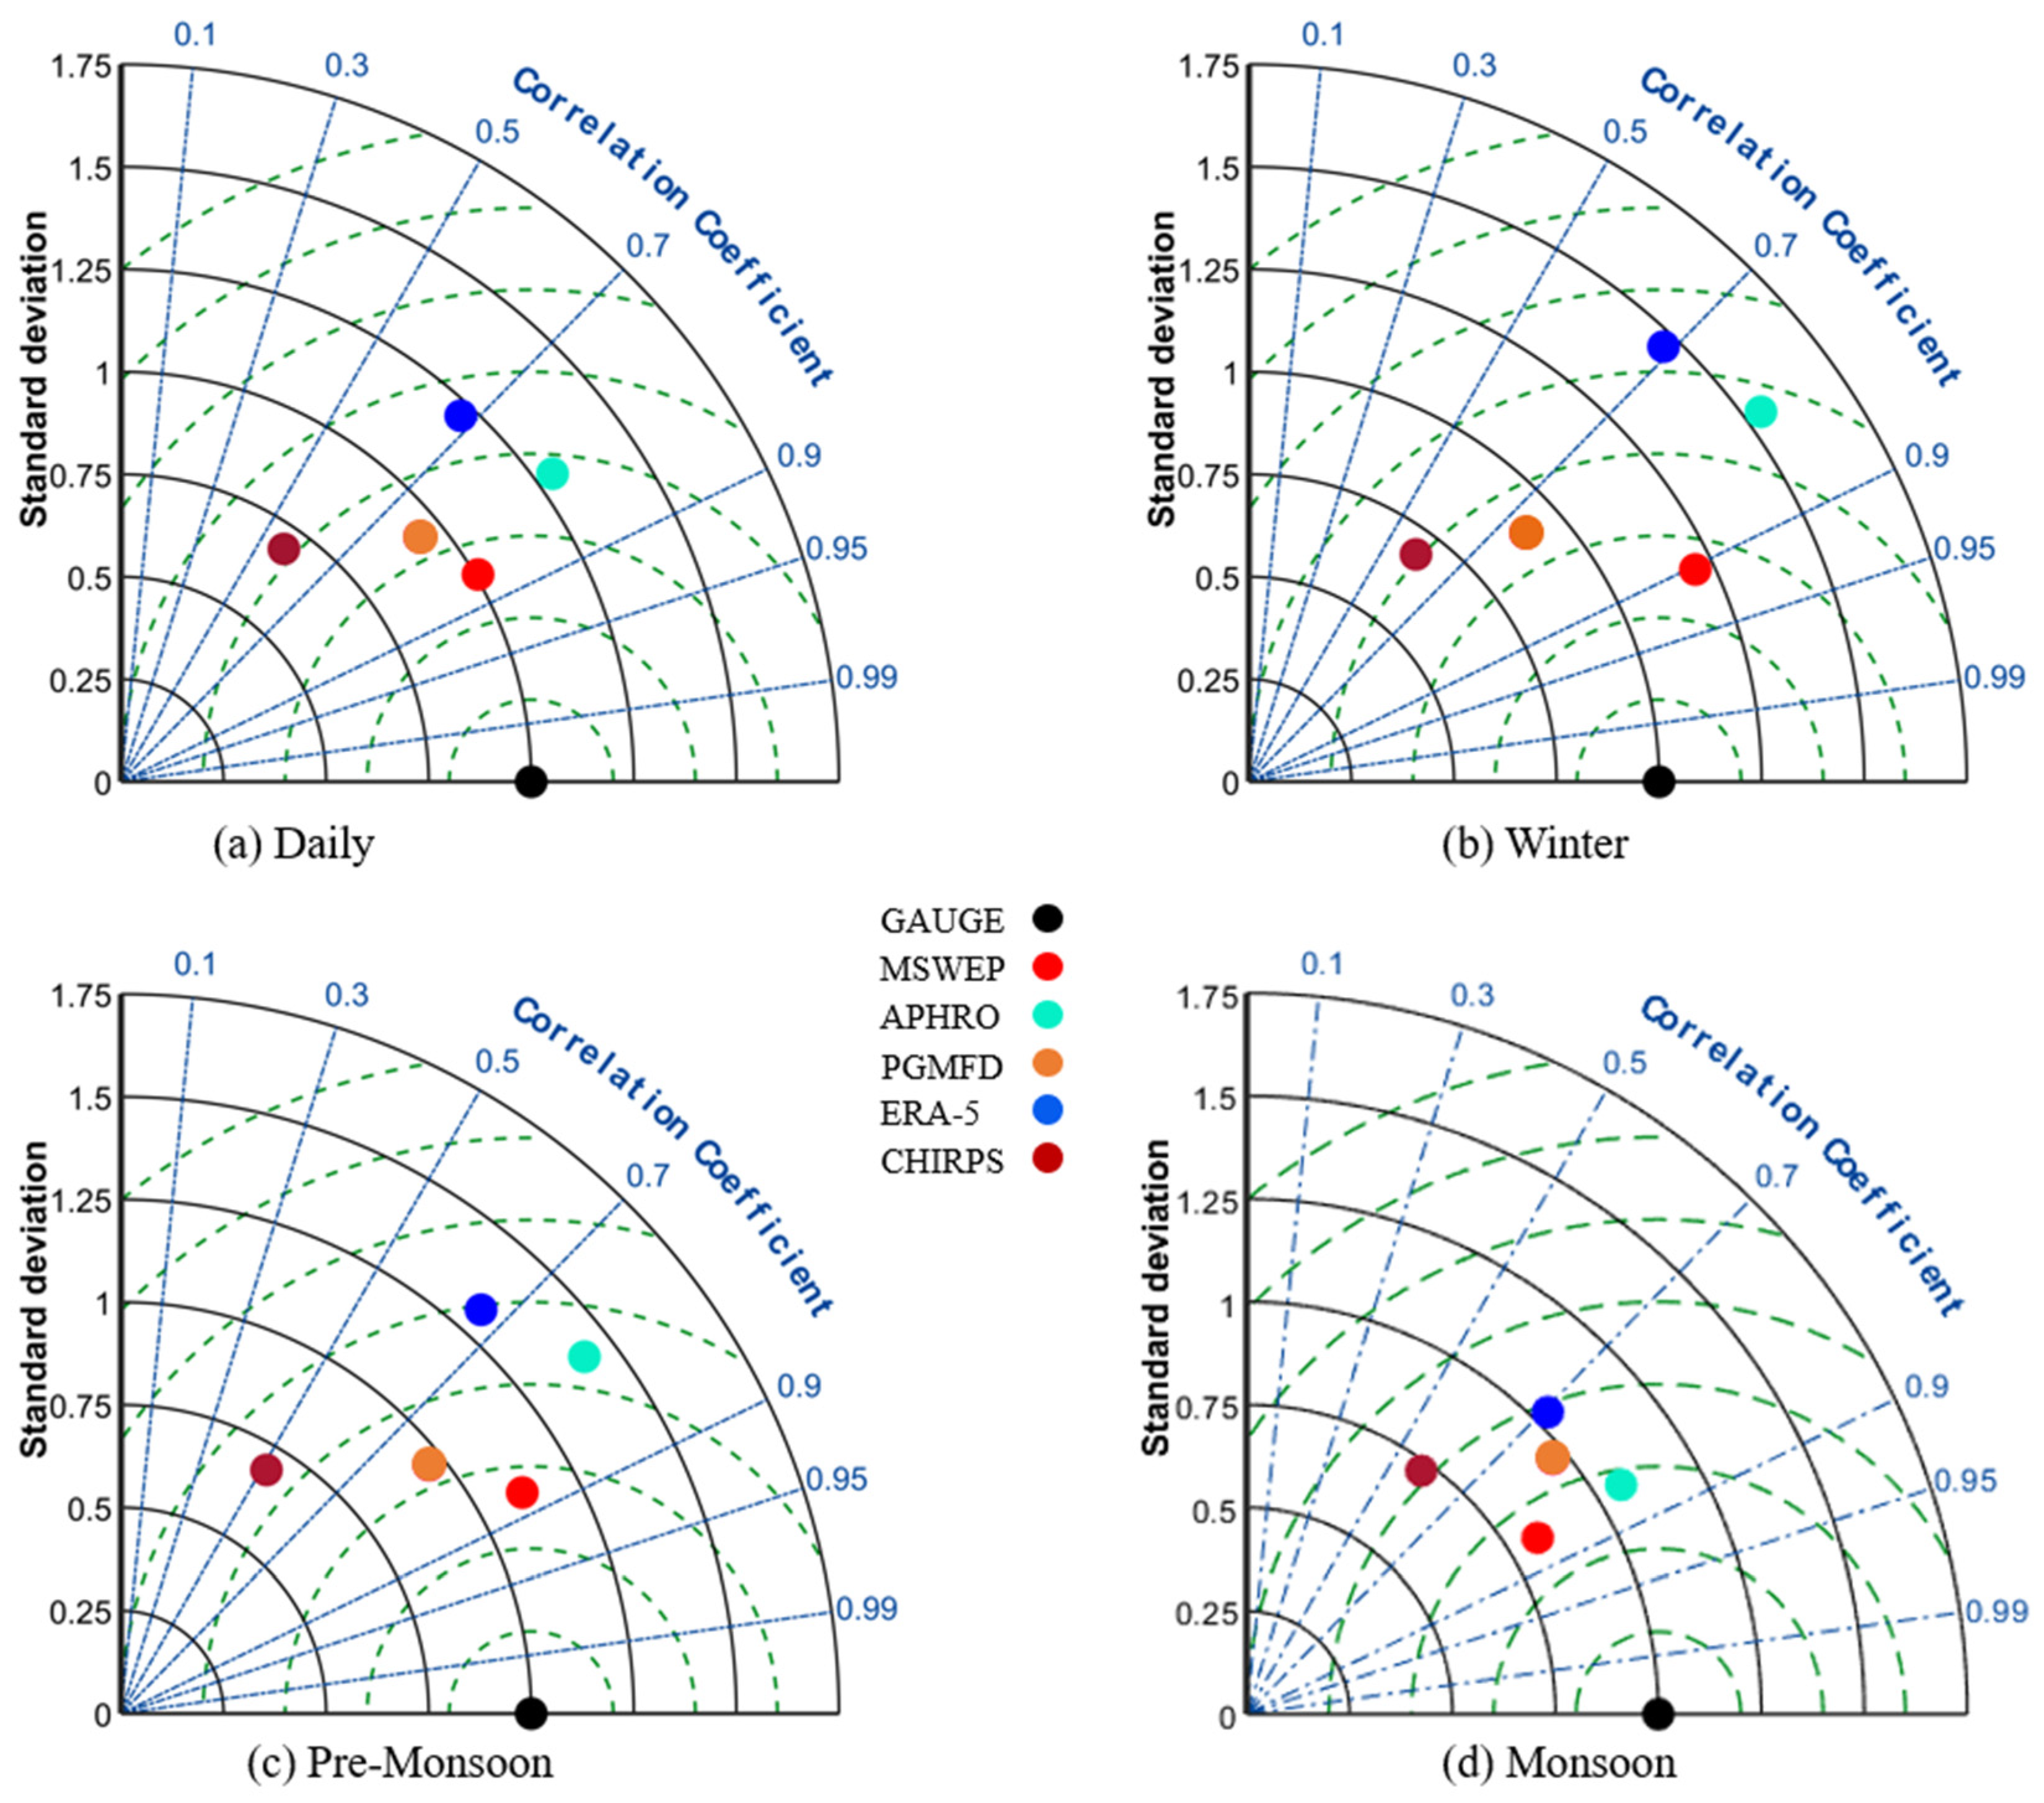
As a way to determine which dataset gives more precisely precipitation estimations over the JRB, thus, we conspired Taylor diagrams [67] to assess the degree of closeness between GPPs and gauge data about CC, RMSE, and standard deviation SD (SD shows the deviation of data from its mean value) at different time scales (Figure 3). In the Taylor diagrams, the angular coordinates (congress blue dashed lines) represent the CC values, and the RMSE values are illustrated by the concentric semi-circles (green color). In comparison, the radical coordinates (black dashed lines) are the standard deviation. In Taylor diagrams, the dataset is considered a better product when the point of GPPs is closer to the reference point. Based on Figure 3, the MSWEP performed better than other products throughout all periods. However, other products showed moderate performance in RMSE and SD during all time scales, except CHIRPS, which exhibits comparatively poor performance in terms of both RMSE and SD. In comparison, the MSWEP illustrates the lowest values of RMSE and SD at all timeframes.
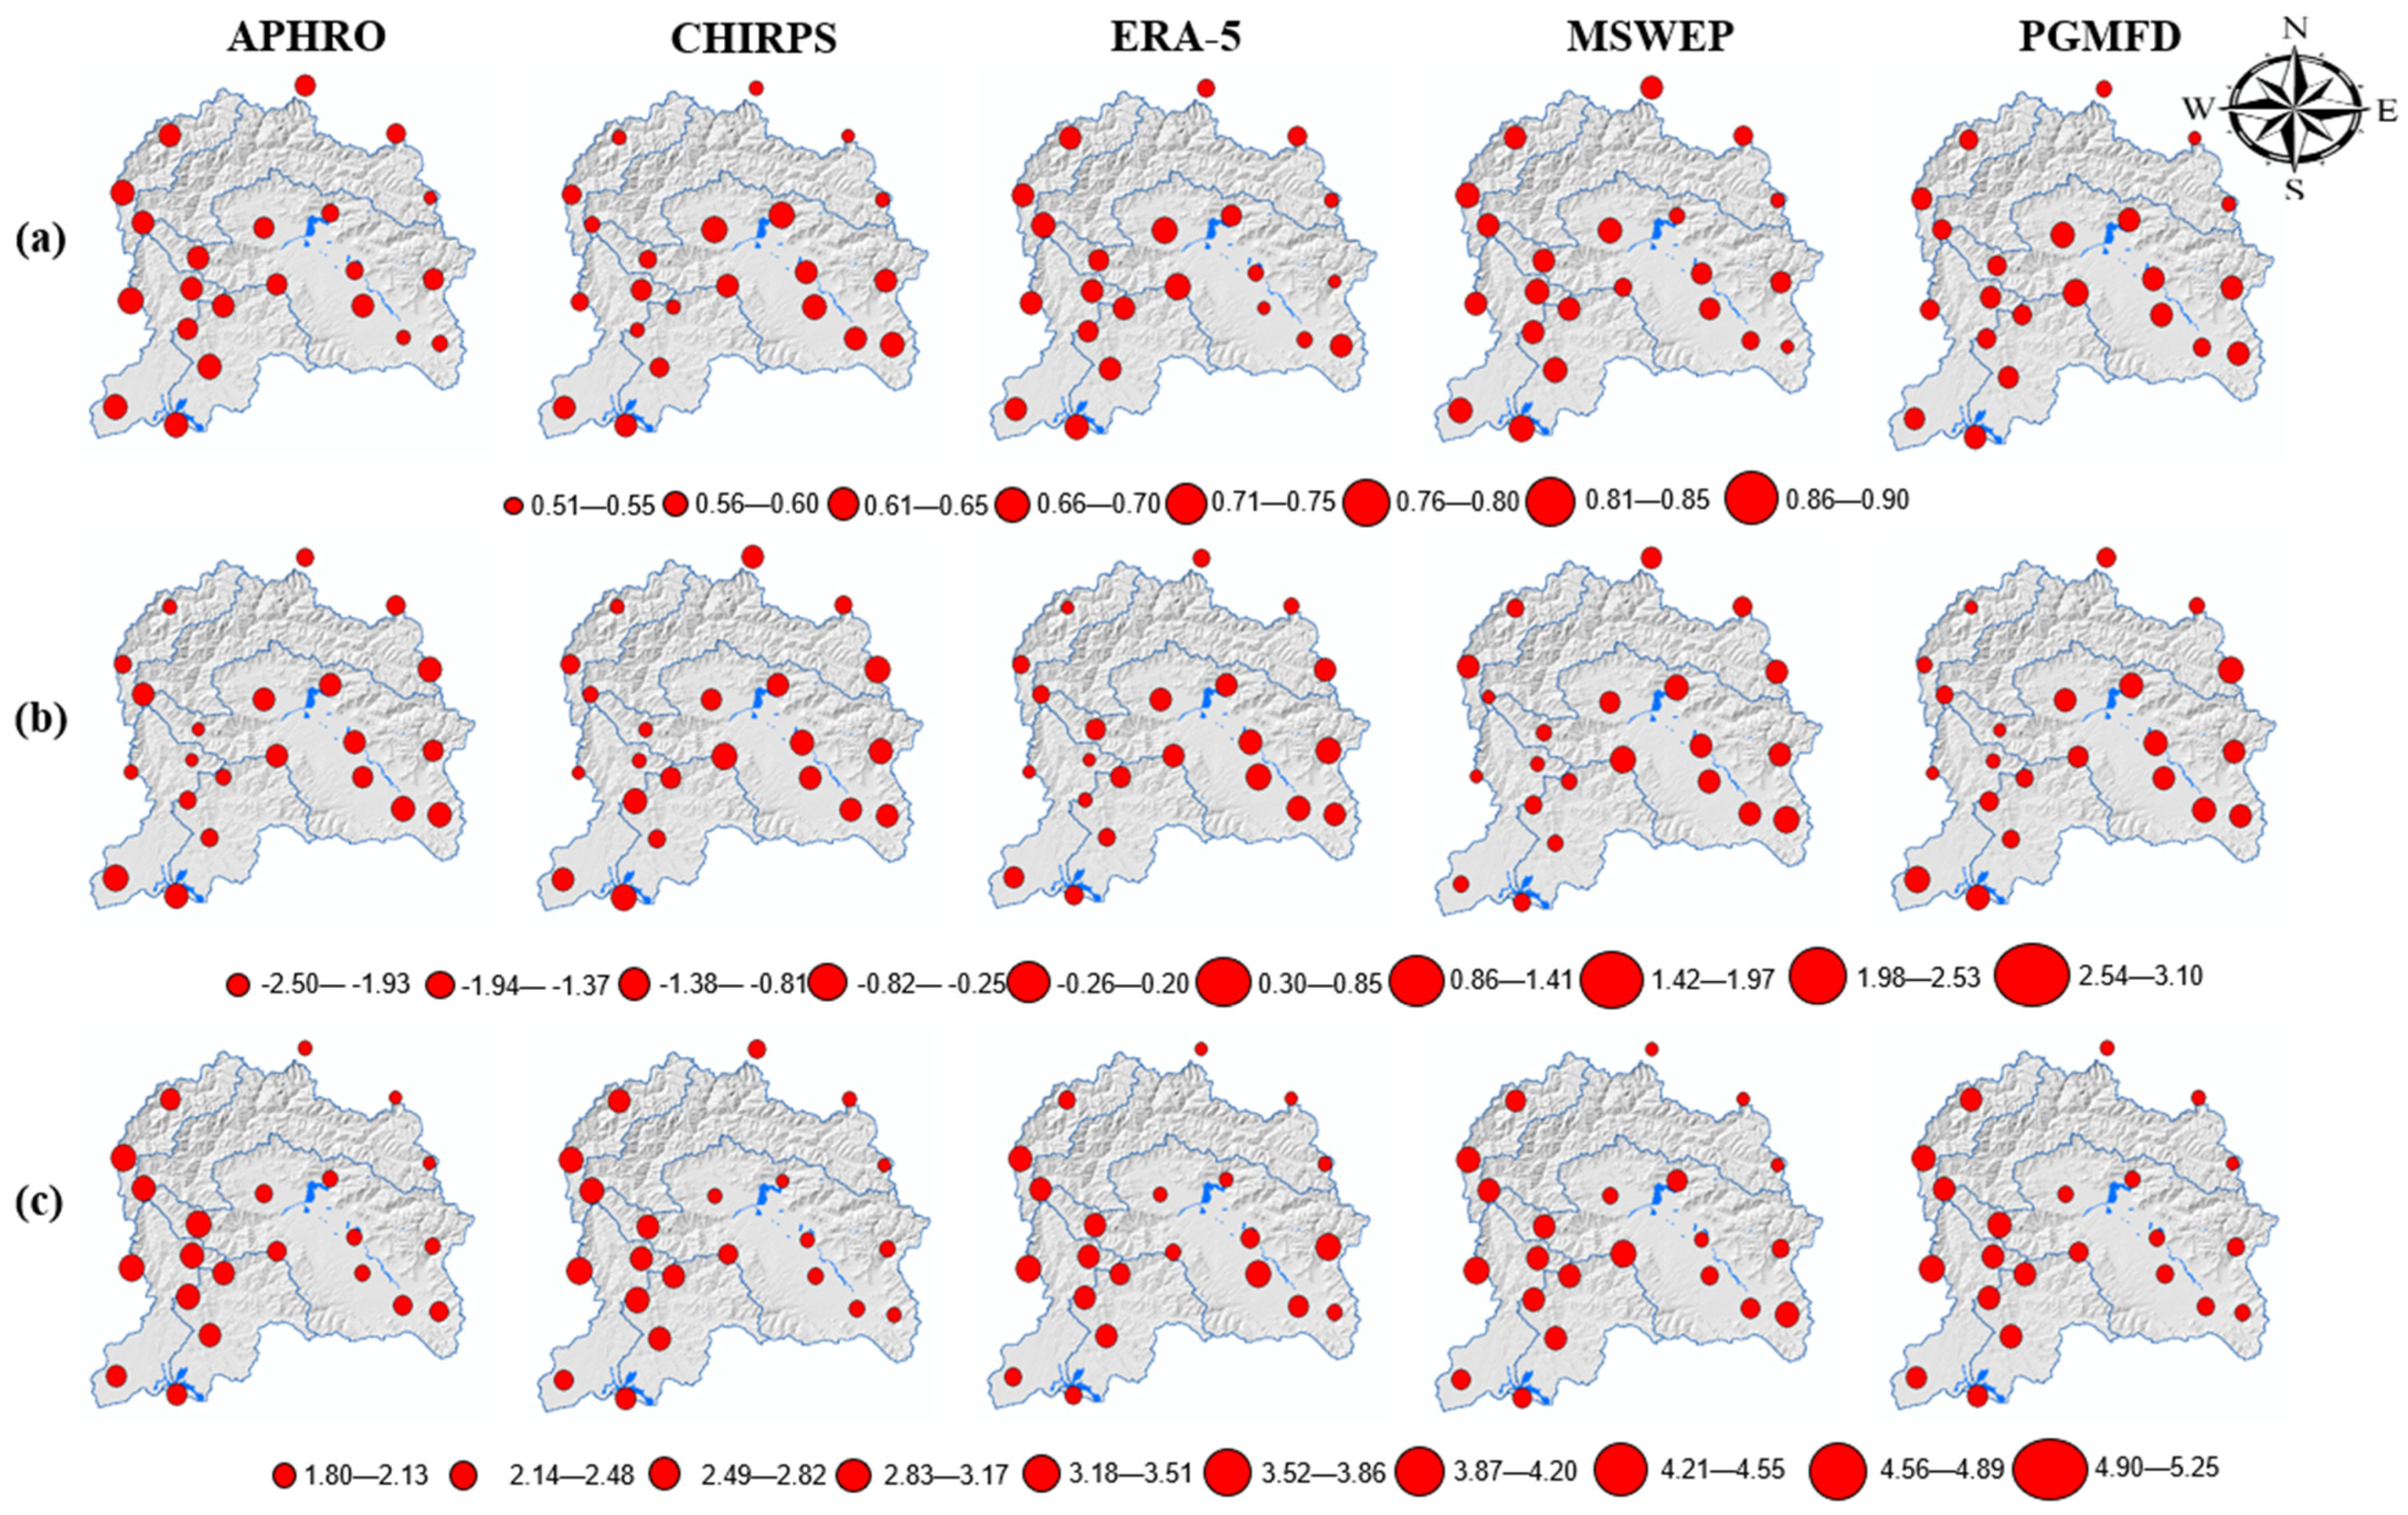
Figure 4 depicts the spatial distribution of evaluated statistical metrics such as CC, Bias, and RMSE of selected GPPs with reference data during the entire period of daily precipitation over different parts of the JRB (Indo-Pak). Generally, the estimates from MSWEP showed the highest CC values and smaller values of Bias and RMSE across the basin (at lower and higher altitudes), suggesting a strong similarity with gauges data. In contrast, the CHIRPS exhibited the lowest degree of agreement (higher Bias and RMSE values), specifically in the western part of the basin from mid to high altitudes. However, some moderate CC values are observed in the center, stretching to the southeastern part of the basin at lower and middle latitudes. In addition to MSWEP, the ERA-5, APHRO, and PGMFD all display higher and lower correlation values in the western and eastern zones, respectively (Figure 4a). The selected GPPs showed Biases over the highlands of JRB, mainly in the western parts (Figure 4b). The overestimations by ERA-5 are owing to erroneous numerical models and observations in the data integration system [68]. However, one of the plausible explanations for the underestimation findings of GPPs (except ERA-5) is high evaporation rates. Thus, liquid water in the atmospheric profile doesn’t entirely fall as precipitation in this region [69]. Many researchers have also reported significant rates of evaporation in the highlands of Hindukush Karakurm and the Himalayas [25,70,71]. The GPPs estimates showed fewer Biases at lower altitudes (in the western region) of the basin. In general, MSWEP displayed substantial signs of progress in estimating the precipitation occurrences than the other four products. The findings divulged that the newly developed precipitation dataset (MSWEP) improved all statistical evolution indices across the JRB more than other GPPs.

3.3. Comparison at the Sub-Catchment Scale

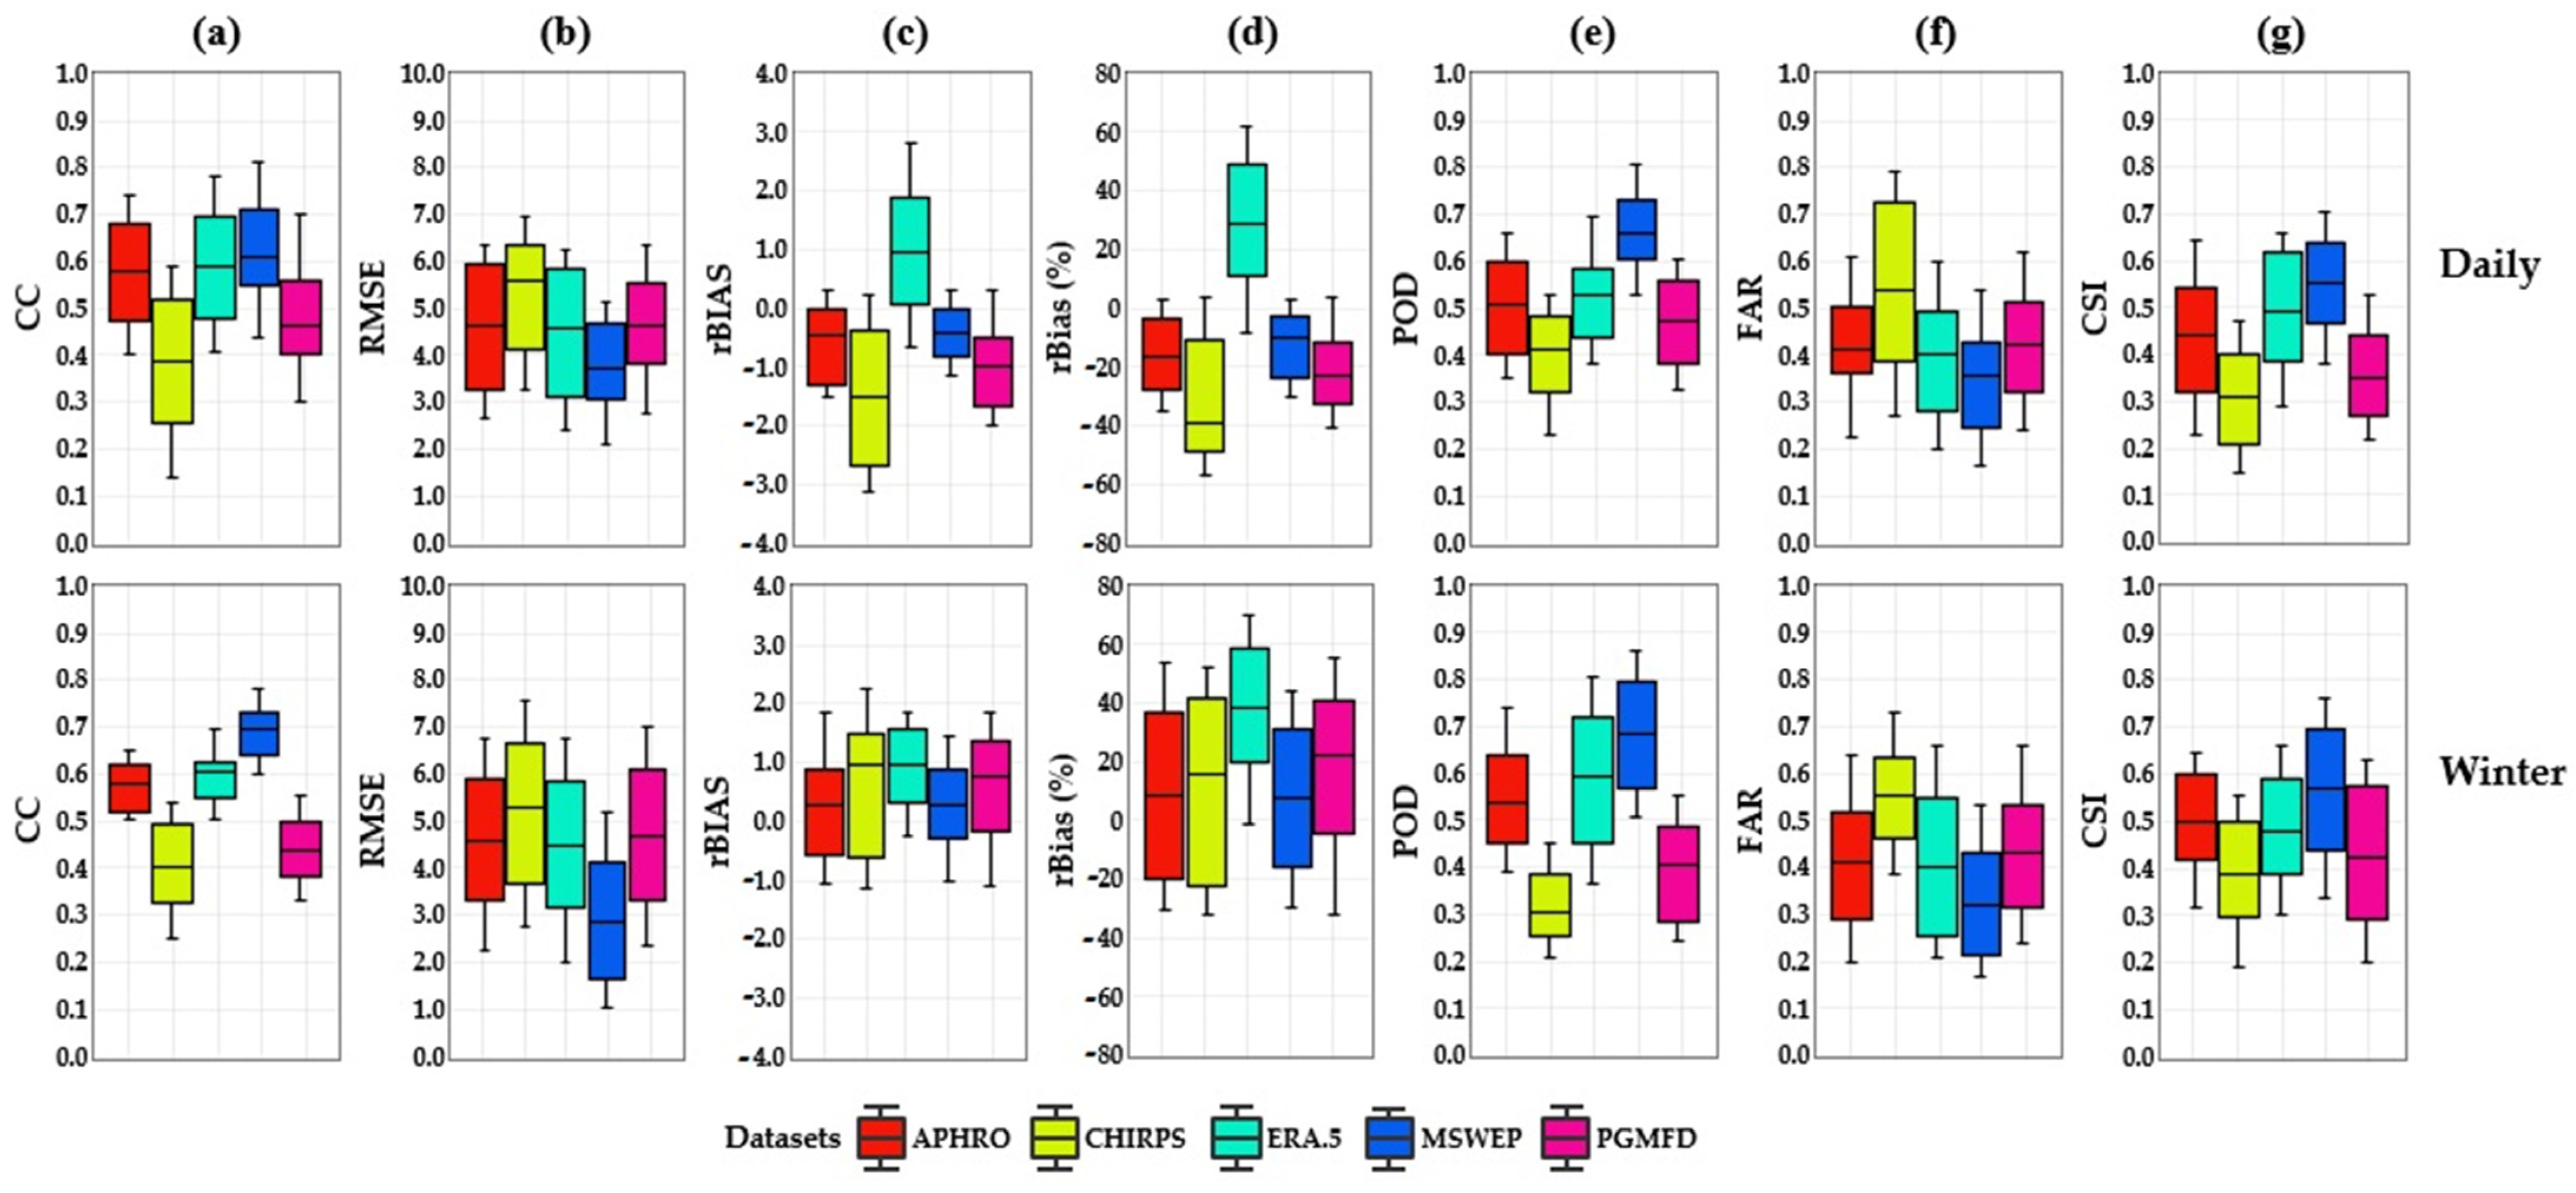
The spatial variability of five GPPs with reference data was also assessed and compared at Sub-Basins (SBs) scales. Based on the topologic relationship between the mainstream and tributaries, the five SBs were delineated (Figure 1c), where the SBs I and II to upper reach are high elevated zones, III and IV SBs are situated at a mid-elevation region associated with middle reach and SB V is located at low to mid-elevation zone related to lower reach Table 1. For the performance evaluation of five GPPs, the box diagrams were plotted to emphasize the distribution of 22 stations. Tables were created to show the attributes of seven statistical indices together with different seasons and in different SBs. Based on the daily assessment, the average CC value of MSWEP (0.61) is higher than ERA-5 (0.59), APHRO (0.58), and PGMFD (0.46); however, the highest and lowest agreement with reference data was observed in SBs V and I (at minimum and maximum elevations) respectively. Furthermore, during the winter, MSWEP, ERA-5, and APHRO underscored better correlation than daily scales, whereas PGMFD was inadequate, thus highlighting a smaller mean CC value Figure 5. It is worth mentioning that the CHIRPS continuously showed poor performance at mid to high elevation zones, particularly in SBs III, II, and I, with CC values of 0.38, 0.37, and 0.14, respectively, while it had the highest CC values of 0.45 and 0.59 in SBs IV and V (at lower elevation) respectively (Table S2). All GPPs (excluding ERA-5) underestimated precipitation with average BIAS values varying from −10.33% to −38.97%, in particular, SBs I, II, IV, and V at a daily scale, and in SBs I and II during the winter season, while overestimated with BIAS value stretching from 2.65% to 61.64% in SB III at daily scale and in SBs III, IV and V (43.97–69.95%, 8.34–37.23% and 17.76–55.81% respectively) in winter.
Among all GPPs, the CHIRPS product mostly underestimated the rainfall (with slight overestimation), with average BIAS from −38.97% to 15.63%. ERA-5 was the most overestimated precipitation, with mean BIAS 30.98% to 49.39% in all seasons, with the highest (69.95%) and lowest (37.23%) in SBs III, IV, and V during the winter season. Although, it also showed underestimations with BIAS values ranging from −7.96% to −1.35% in SB II at both (Daily and winter) scales. The number of sites overestimated by ERA-5 (BIAS > 0) is higher than the rest of the GPPs on the SBs level and are entirely basin. It can be observed from the average values of RMSE that MSWEP has low errors (ranging from 2.88 mm to 4.01 mm) in contrast to other products in all SBs and seasons. Generally, the mean POD values of GPPs show the occurrence of precipitation events were correctly captured during monsoon than in other seasons, particularly at low elevated SBs like IV and V. Similarly, incorrectly estimated the occurrence of precipitation event (FAR values) by GPPs were larger (as elevation increases) in SBs III, II and I concerning V and IV (as elevation decreases). Conversely, the average detection capability of all products (CSI) is higher in V and IV than in III, II, and I in the monsoon season. As aforementioned in Section 2.1, this region is mostly influenced by monsoon precipitation during the summer season. However, detecting and measuring precipitation occurrences in various weather conditions at high altitudes is a challenge for satellites as reflectivity from snow and ice reduces the effectiveness of passive sensing in mountainous regions [22]. Therefore, all GPPs outperformed, particularly in SBs IV and V, whereas their low performance was observed at high elevated SBs, for example, III, II, and I, due to orographical effects (Figure 6, Table S3). However, during winter, the precipitation was lowest at a high elevation, such as SBs I and III. In contrast, higher precipitation amounts are recorded from mid to low elevation in SBs II, IV, and V. In addition, during the pre-monsoon season, all GPPs revealed higher average values of RMSE, BIAS, FAR, and lower CC, POD, and CSI compared with the monsoon, because these high elevated SBs are covered by ice and snow during the winter and partially in the pre-monsoon season. Consequently, the reflectivity of snow and ice influences the accuracy of GPPs in high-elevated regions. So, their performance was low in that season. Nevertheless, all GPPs tended to overestimate the light (1 mm/day) precipitation intensities, except ERA-5, which tended to underestimate the light but overestimated moderate (1–20 mm/day) and heavy precipitation (>20 mm/day) events. Among all GPPs, the MSWEP revealed an intimate relationship with gauge data in capturing the light, medium, and high precipitation intensities, suggesting it has the superior capability to detect precipitation events (0–50 mm/day) more precisely in all seasons.

3.4. Detection Abilities of Diverse Precipitation Intensities

Figure 7 depicts the Probability density function estimated from the GPPs and gauges throughout the entire period in different seasons over JRB for seven classes of daily precipitation frequency distribution as described in Section 2.4. All GPPs and gauges exhibited a higher percentage of low-intensity precipitation events between 0 and 1 precipitation classes. In contrast, the high intensity was recorded in the class where precipitation was greater than 50 mm/day in this region. Overall, the ratio of lowest precipitation occurrence (<1 mm/day) is greater than heavy precipitation events (>20 mm/day). ERA-5 showed underestimation of light (≤1 mm/day) and overestimation of moderate (1–20 mm/day) and heavy (>20 mm/day) precipitation events for the entire period as well as in the winter and pre-monsoon seasons (Figure 7a–c). However, it was much closer to reference data with slightly overestimating moderate precipitation events in the winter (Figure 7d). Furthermore, PGMFD behaved differently as it overestimated the light but underestimated the moderate precipitation events and overestimated the heavy precipitation events (Figure 7a–c). Notably, MSWEP and APHRO have a higher degree of similarity with the reference data during the entire winter season and pre-monsoon. Still, APHRO, in comparison with MSWEP, was less accurate in showing such resemblance with the reference data for moderate and heavy precipitation intensities in the monsoon season. The CHIRPS product had feebleness in detecting precipitation events. It could not capture the moderate and heavy precipitation intensities, particularly during the monsoon season (Figure 7d); that’s why it has higher FAR values than other GPPs (Table 4). All other GPPs performed well in capturing the precipitation classes from 1 to 50 mm/day.

4. Discussion

According to the evaluation findings of Section 3, the vertical performance of GPPs revealed that these products were less accurate at capturing large variations in precipitation at higher altitudes than horizontal and showed both spatial (basin to basin) and temporal (season to annual) biases (Section 3.3), which might be caused by coarser resolution and noticeable orographical influences in the highlands of JRB. Nevertheless, the inter-comparison of the five GPPs revealed that the newly launched precipitation dataset (MSWEP) performance is better (with slight underestimates) than all other products. These findings are consistent with the available performance evaluation studies [2,11,26,66,69,72]. The CHIRPS displayed more considerable BIAS during all time scales, signifying that it could not accurately capture rainfall in the complex topographical region and exhibited a weaker correlation at daily and seasonal scales with CC values (<0.6) over the entire basin (Table 2). The results are consistent with Dembélé and Zwart [73], who found a poor (CC = 0.47 nearest to 0.42) correlation in Eastern Nile Basin Burkina Faso (West Africa). However, it intimates that possibly merging those in MSWEP offers maximal improvements.
The substantial bias in the estimations of precipitation amounts from ERA-5, APHRO, CHIRPS, and PGMFD are also pointed out by many researchers in different regions such as the UIB [2,26], Adige Basin (Italy) [19], Mainland of China [74], Iran [65], and the eastern periphery of the Tibetan plateau [66]. The superior performance of MSWEP to the rest of the products could be owing to the latest development in (1) addition of the cumulative distribution function (CDF) and precipitation frequency correction for the spurious light rain, temporal discontinuities, and high peaks. (2) increment in spatial resolution to enhance the local suitability of precipitation estimations, which is significant for the high water yielding mountainous areas, and (3) implementation of precipitation estimations derived by Gridded Satellite (GridSat) thermal infrared (IR) imagery. On the other hand, the CHIRPS product doesn’t merge passive microwave-based precipitation retrievals. It is available at daily temporal (5-daily timescales) resolution that hampers its use in particular highly dynamic precipitation environments [35]. The better performance in the Adige Basin (Italy) and Qinghai-Tibet Plateau might be owing to a dense network of rain gauges applied during its development.
The overestimation by ERA-5 is due to the parameterization deficiencies in the controlling procedure of precipitation generation [35], indicating the importance of precipitation frequency corrections supplemented in MSWEP. Generally, JRB receives light precipitation, so retrieving precipitation occurrence at a finer scale is indispensable in capturing light precipitation events. Besides, it is worth noting that because coarser spatial resolution (0.25°) with considerable model’s erroneous characteristic of ERA-5 tends to smoothen precipitation, it underscores considerable overestimation in this region. The findings align with the results of Nogueira [75], who found that ERA-5 had an overestimation with RMSE values ranging from 0 to 4.5 mm/day across China. The underestimation of the low precipitation intensities and overestimation of higher precipitation intensities indicate that more attention is required when reanalyzing precipitation products in particular complex terrain (Figure 7a–d). These results have also been reported by Jiang et al. [74] on the Chinese Mainland. Nonetheless, MSWEP has high spatial (0.1°) temporal (3 hourly) resolutions, making it more apt to detect even precipitation events at the smaller spatial extent, which are common in this region. Approximately 66% of total precipitation events occur as low-intensity events (<1 mm/day) in this region [25]. The high-frequency sensor-based satellite products can observe low-intensity precipitation events [35,76]. The MSWEP is integrated the gauge, satellite, and reanalysis along with precipitation estimations contingent on IR data from the GridSat B1 archive to improve precipitation estimations, particularly in the convection-influenced areas, by employing a parsimonious CDF-matching method. Such a product can estimate the light precipitation more precisely than other GPPs because of the increased sensitivity of the cloud-top IR from the GridSat and high-frequency channels [35].
The existing literature review suggests that the performance evaluation of newly launched products (MSWEP) has been investigated worldwide. Where it exhibited moderate agreement with reference (ground-based) data in Qinghai-Tibet Plateau [69]; however, a better correlation was observed in the highlands of JRB (in this study), Australia, and Africa [11], and southeastern south America [72]. This is due to the fact that MSWEP is a global precipitation dataset intended primarily for hydrological modeling [35]. The data is designed to optimally combine the best quality rainfall data sources. In the first step, the long-term mean of MSWEP is derived from the Climate Hazards Group Precipitation Climatology (CHPclim) dataset, which was just recently released. CHPclim is a worldwide precipitation product using gauge observations and satellite data with a resolution of 0.05°. In the second step, orographic impacts are removed using data from various sources, such as the 13,762 catchment stations located worldwide. Seven datasets determine the temporal variation of MSWEP: two gauge-based observations (CPC Unified and GPCC), three satellite-based products (CMORPH, GSMaP-MVK, and TMPA 3B42RT), and two atmospheric model reanalyzes (ECMWF Interim Reanalysis and the Japanese 55-year Reanalysis).
Up to the present, estimated precipitation estimates from MSWEP exhibited a good correlation with reference (ground-based) data in our study area. Conversely, the APHRO underestimated precipitation magnitudes because it uses the non-representative low-altitude conventional observatories with lower (0.25°) resolution to reproduce the spatial distribution of high-altitude precipitation [26]; another possible reason might be wind-induced precipitation under-catch that have not been adjusted in APHRO product. Similar results are presented by Dahri et al. [26] over UIB suggested that precipitation estimated from APHRO shows substantial underestimations and is not suitable to use directly in hydro-meteorological studies without correction, despite the fact that their study area is larger than the current study and this area was excluded. However, this product is derived from reference gauges; thus, it underscores a higher correlation. The MSWEP displayed better agreement with daily gauge precipitation data in the JRB, which might be owing to the integration of four categories of product and high spatial and temporal (3 hourly) resolutions. Another possible reason for ERA-5 overestimation in this region might be the somewhat contribution of wind-imputed errors and increasing concentration of aerial aerosols [25,77]. The aerosol concentration in the environment has been increasing in Asia, which can interrupt the precipitation and thus can decrease its magnitude [78,79].
Previous studies also pointed out that high aerosol concentration can influence the cloud drop size, which is ultimately a cause of overestimation by satellite sensors [25,80]. To improve the precipitation retrieval algorithm of the ERA-5 product, the algorithm developers should also consider the influence of aerial aerosols. Based on our results, the bias correction of GPPs’ daily precipitation estimates with referenced data is recommended before it can be enforced in direct applications, particularly in the glaciated region.

Uncertainty and Limitations

Despite that, the newly launched MSWEP revealed a better performance in estimating the spatial precipitation distribution and erroneousness than all other products. However, it still has some uncertainty in estimating the accurate magnitude of daily precipitation over highly mountainous areas. Thus, users of MSWEP must be circumspect about overestimating light precipitation occurrence, particularly in this type of study area. The finer spatial (0.1°) resolution and long-term data availability with considerable bias correction will favor the MSWEP product in hydro-climatic applications. However, bias correction is recommended for all GPPs before they can be used in any kind of meteorological investigation over the JRB and a similar topographic characteristic catchment. Lately, due to the inaccessibility of recently observed data, this study was only limited from (1981–2009). For that, the continuous monitoring of precipitation variation within the study scope using recently observed data is open for future research.

5. Conclusions

The current study conducted a baseline and timely assessment of the recently launched precipitation product MSWEP (V2.2) in the highland transboundary region of Indo-Pak (JRB) at the common period from 01-January 1981 to 31-December 2009 by comparing with referenced (in-situ gauges) data at spatial (entire basin and SBs) and temporal (annual, monthly, daily, and seasonal) scales. For its systemic performance comparison, four other products, APHRO, ERA-5, CHIRPS, and PGMFD, were also evaluated parallel to MSWEP. The continuous statistical metrics (CC, RMSE, BIAS, and BIAS (%)) and categorical indices (POD, FAR, and CSI) were applied to examine their accuracy and contingency. The key findings of this study are:
1. All GPPs exhibited spatial variability of entire annual precipitation during the whole period, with high and low amounts of precipitation in northwestern and northeastern parts of JRB, respectively. Similarly, monthly precipitation estimates with temporal variability trend well performed by GPPs, with slight overestimation during winter (specifically in December) and underestimation in the next two seasons. However, ERA-5 displayed a significant overestimation amount of precipitation at all scales.
2. The correlation of all GPPs is better with in situ gauges at daily and seasonal spans, but the CHIRPS showed a smaller (<0.6) correlation, indicating its feebleness. Therefore, more efforts must be employed for its improvement in respective periods. Comparing the current findings with existing findings on different regions of the world, we realized that the performance of GPPs is highly dependent on topographical and atmospheric settings. Since the latest MSWEP product integrates the rain gauge, reanalysis, and satellite dataset to make it most advanced by minimizing these disadvantages thus, its performance was better in all seasons (with slight overestimation in winter).
3. Overall, the GPPs performed well in the monsoon season compared to the winter and pre-monsoon seasons. Better performance on a daily scale is observed in SBs V, IV, the upper part of SB I, and some western portion of SB III, whereas poor performance can be found in the middle and southeast portion of SB III and the lower portion of SB II.
4. The MSWEP exhibited better skills in terms of precipitation detection capability, followed by ERA-5, APHRO, and PGMFD, with approximately 51–72% of success ratio in sensing realistic and unrealistic precipitation events. Conversely, the CHIRPS had a larger FAR than other GPPs. The precipitation detecting ability was best in the monsoon season compared to the next two seasons.
5. All selected GPPs showed a tendency to overestimate light precipitation (0–1 mm/day) and underestimate moderate to heavy precipitation, whereas the ERA-5 tends to underestimate the light but overestimate moderate (1–20 mm/day) and heavy precipitation (>20 mm/day) events. The CHIRPS showed less accuracy in detecting mainly precipitation events, significantly overestimating unrealistic precipitation (0–1 mm/day) events and underestimating moderate to heavy precipitation events. On the other hand, the MSWEP had a better ability to capture light, medium, and high precipitation intensities than all other GPPs. These results suggest that MSWEP has superior overall performance products. Conversely, the CHIRPS divulges poorer performance; thus, it needs more improvement efforts to enhance its ability to detect light precipitation more accurately.
Based on the aforementioned results, we found that the performance of the newly launched precipitation dataset (MSWEP) was better than all other products. The results of this study provide a better understanding of the performance of global GPPs at a local scale that can assist hydro-meteorological applications in such glaciated types of regions. The differences and errors in measuring precipitation amounts at multi-temporal scales demonstrate the importance of performance evaluations and allow other investigators to select an appropriate product/s according to their specific requirements.

Supplementary Materials

The following supporting information can be downloaded at: https://www.mdpi.com/article/10.3390/rs14194773/s1, Figure S1: Annual average precipitation in JRB measured from five GPPs with reference gauges; Figure S2: (a) Temporal precipitation distribution estimates derived from five GPPs and reference gauges at monthly scale. (b) Seasonal precipitation distribution derived from five GPPs and reference gauges in JRB during the entire study period; Table S1: Geographical information of in-situ gauging stations used in the current study; Table S2: The statistical metrics for performance evaluation of GPPs in contrast to in-situ gauges data during the entire study period 1981–2009 in five SBs at daily and winter (season) scales; Table S3: The statistical metrics for performance evaluation of GPPs in contrast to in-situ gauges data during the entire study period 1981–2009 in five SBs together with pre-monsoon and monsoon seasons.

Author Contributions

Conceptualization, S.A. and Y.C.; Methodology and data curation, S.A., P.M.K. and A.G.; Software and Visualization, S.A., P.M.K. and J.Q.; Formal Analysis and writing of the original draft preparation, S.A.; Reviewed and editing previous draft, M.A., R.M., Z.A. and A.T.; Supervision and Funding acquisition, Y.C. All authors have read and agreed to the published version of the manuscript.

Funding

This study is supported by the National Natural Science Foundation of China (Grant No. 52161145102).

Data Availability Statement

The data used and analyzed in this study is included in this article. All relevant processed data are accessible from authors upon request.

Acknowledgments

Authors would like to thank the Water and Power Development Authority (WAPDA) and Pakistan Meteorological Department (PMD) for providing in-situ gauges data of Jhelum River Basin.

Conflicts of Interest

The authors declare no conflict of interest.

Abbreviations

GPPs Gridded Precipitation Products
APHRODITE Asian Precipitation-high Resolved Observational Data Integration Towards Evaluation of Water Resources
CHIRPS The Climate Hazards Center Infrared Precipitation with Station
ERA-5 European Atmospheric Reanalysis, the 5th generation
PGMFDPrinceton Global Meteorological Forcing Dataset
MSWEP Multi-Source Weighted-Ensemble Precipitation
Indo-Pak India and Pakistan
HKH Hindukush Karakorum and Himalayas
JRB Jhelum River Basin
SBssub-basins
MW megawatt
A.S.L. above sea level
WAPDA Water and Power Development Authority
PMD Pakistan Meteorological Department
NOAA National Climatic Data Center
WMO World Meteorological Organization
GPCC Global Precipitation Climatology Centre
GSOD Global Summary of the Day
GHCN-D Global Historical Climatology Network-Daily
ECMWF European Centre for Medium-Range Weather Forecasts

References

  1. Duan, Z.; Bastiaanssen, W. First results from Version 7 TRMM 3B43 precipitation product in combination with a new downscaling–calibration procedure. Remote Sens. Environ. 2013, 131, 1–13. [Google Scholar] [CrossRef]
  2. Shafeeque, M.; Luo, Y.; Wang, X.; Sun, L. Revealing Vertical Distribution of Precipitation in the Glacierized Upper Indus Basin Based on Multiple Datasets. J. Hydrometeorol. 2019, 20, 2291–2314. [Google Scholar] [CrossRef]
  3. Fang, J.; Du, J.; Xu, W.; Shi, P.; Li, M.; Ming, X. Spatial downscaling of TRMM precipitation data based on the orographical effect and meteorological conditions in a mountainous area. Adv. Water Resour. 2013, 61, 42–50. [Google Scholar] [CrossRef]
  4. Wang, Z.; Zhong, R.; Lai, C.; Chen, J. Evaluation of the GPM IMERG satellite-based precipitation products and the hydrological utility. Atmos. Res. 2017, 196, 151–163. [Google Scholar] [CrossRef]
  5. Henn, B.; Newman, A.J.; Livneh, B.; Daly, C.; Lundquist, J.D. An assessment of differences in gridded precipitation datasets in complex terrain. J. Hydrol. 2018, 556, 1205–1219. [Google Scholar] [CrossRef]
  6. Javanmard, S.; Yatagai, A.; Nodzu, M.; BodaghJamali, J.; Kawamoto, H. Comparing high-resolution gridded precipitation data with satellite rainfall estimates of TRMM_3B42 over Iran. Adv. Geosci. 2010, 25, 119–125. [Google Scholar] [CrossRef]
  7. Gebremichael, M.; Anagnostou, E.N.; Bitew, M.M. Critical steps for continuing advancement of satellite rainfall applications for surface hydrology in the Nile River basin 1. J. Am. Water Resour. Assoc. 2010, 46, 361–366. [Google Scholar] [CrossRef]
  8. Satgé, F.; Xavier, A.; Pillco Zolá, R.; Hussain, Y.; Timouk, F.; Garnier, J.; Bonnet, M.-P. Comparative assessments of the latest GPM mission’s spatially enhanced satellite rainfall products over the main Bolivian watersheds. Remote Sens. 2017, 9, 369. [Google Scholar] [CrossRef]
  9. Xie, P.; Xiong, A.Y. A conceptual model for constructing high-resolution gauge-satellite merged precipitation analyses. J. Geophys. Res. Atmos. 2011, 116, D21106. [Google Scholar] [CrossRef]
  10. Valjarević, A.; Milanović, M.; Gultepe, I.; Filipović, D.; Lukić, T. Updated Trewartha climate classification with four climate change scenarios. Geogr. J. 2022. [Google Scholar] [CrossRef]
  11. Awange, J.; Hu, K.; Khaki, M. The newly merged satellite remotely sensed, gauge and reanalysis-based Multi-Source Weighted-Ensemble Precipitation: Evaluation over Australia and Africa (1981–2016). Sci. Total Environ. 2019, 670, 448–465. [Google Scholar] [CrossRef]
  12. Hughes, D.A. Comparison of satellite rainfall data with observations from gauging station networks. J. Hydrol. 2006, 327, 399–410. [Google Scholar] [CrossRef]
  13. Chen, S.; Hu, J.; Zhang, Z.; Behrangi, A.; Hong, Y.; Gebregiorgis, A.S.; Cao, J.; Hu, B.; Xue, X.; Zhang, X. Hydrologic evaluation of the TRMM multisatellite precipitation analysis over Ganjiang Basin in humid southeastern China. IEEE J. Sel. Top. Appl. Earth Obs. Remote Sens. 2015, 8, 4568–4580. [Google Scholar] [CrossRef]
  14. Sun, Q.; Miao, C.; Duan, Q.; Ashouri, H.; Sorooshian, S.; Hsu, K.L. A review of global precipitation data sets: Data sources, estimation, and intercomparisons. Rev. Geophys. 2018, 56, 79–107. [Google Scholar] [CrossRef]
  15. Tan, M.L.; Gassman, P.W.; Cracknell, A.P. Assessment of three long-term gridded climate products for hydro-climatic simulations in tropical river basins. Water 2017, 9, 229. [Google Scholar] [CrossRef]
  16. Zhu, Q.; Xuan, W.; Liu, L.; Xu, Y.P. Evaluation and hydrological application of precipitation estimates derived from PERSIANN-CDR, TRMM 3B42V7, and NCEP-CFSR over humid regions in China. Hydrol. Process. 2016, 30, 3061–3083. [Google Scholar] [CrossRef]
  17. Tan, M.L.; Tan, K.C.; Chua, V.P.; Chan, N.W. Evaluation of TRMM product for monitoring drought in the Kelantan River Basin, Malaysia. Water 2017, 9, 57. [Google Scholar] [CrossRef]
  18. Ramarohetra, J.; Sultan, B.; Baron, C.; Gaiser, T.; Gosset, M. How satellite rainfall estimate errors may impact rainfed cereal yield simulation in West Africa. Agric. For. Meteorol. 2013, 180, 118–131. [Google Scholar] [CrossRef]
  19. Duan, Z.; Liu, J.; Tuo, Y.; Chiogna, G.; Disse, M. Evaluation of eight high spatial resolution gridded precipitation products in Adige Basin (Italy) at multiple temporal and spatial scales. Sci. Total Environ. 2016, 573, 1536–1553. [Google Scholar] [CrossRef]
  20. Ma, Z.; Zhou, Y.; Hu, B.; Liang, Z.; Shi, Z. Downscaling annual precipitation with TMPA and land surface characteristics in China. Int. J. Climatol. 2017, 37, 5107–5119. [Google Scholar] [CrossRef]
  21. Tang, G.; Ma, Y.; Long, D.; Zhong, L.; Hong, Y. Evaluation of GPM Day-1 IMERG and TMPA Version-7 legacy products over Mainland China at multiple spatiotemporal scales. J. Hydrol. 2016, 533, 152–167. [Google Scholar] [CrossRef]
  22. Ferraro, R.R.; Smith, E.A.; Berg, W.; Huffman, G. A screening methodology for passive microwave precipitation retrieval algorithms. J. Atmos. Sci. 1998, 55, 1583–1600. [Google Scholar] [CrossRef]
  23. Hussain, S.; Song, X.; Ren, G.; Hussain, I.; Han, D.; Zaman, M. Evaluation of gridded precipitation data in the Hindu Kush–Karakoram–Himalaya mountainous area. Hydrol. Sci. J. 2017, 62, 2393–2405. [Google Scholar] [CrossRef]
  24. Wortmann, M.; Bolch, T.; Menz, C.; Tong, J.; Krysanova, V. Comparison and correction of high-mountain precipitation data based on glacio-hydrological modeling in the Tarim River headwaters (High Asia). J. Hydrometeorol. 2018, 19, 777–801. [Google Scholar] [CrossRef]
  25. Anjum, M.N.; Ding, Y.; Shangguan, D.; Ahmad, I.; Ijaz, M.W.; Farid, H.U.; Yagoub, Y.E.; Zaman, M.; Adnan, M. Performance evaluation of latest integrated multi-satellite retrievals for Global Precipitation Measurement (IMERG) over the northern highlands of Pakistan. Atmos. Res. 2018, 205, 134–146. [Google Scholar] [CrossRef]
  26. Dahri, Z.H.; Ludwig, F.; Moors, E.; Ahmad, B.; Khan, A.; Kabat, P. An appraisal of precipitation distribution in the high-altitude catchments of the Indus basin. Sci. Total Environ. 2016, 548, 289–306. [Google Scholar] [CrossRef]
  27. Lutz, A.; Immerzeel, W.; Shrestha, A.; Bierkens, M. Consistent increase in High Asia’s runoff due to increasing glacier melt and precipitation. Nat. Clim. Chang. 2014, 4, 587–592. [Google Scholar] [CrossRef]
  28. Yao, T.; Bolch, T.; Chen, D.; Gao, J.; Immerzeel, W.; Piao, S.; Su, F.; Thompson, L.; Wada, Y.; Wang, L. The imbalance of the Asian water tower. Nat. Rev. Earth Environ. 2022, 299, 1–15. [Google Scholar] [CrossRef]
  29. Azmat, M.; Qamar, M.U.; Ahmed, S.; Shahid, M.A.; Hussain, E.; Ahmad, S.; Khushnood, R.A. Ensembling downscaling techniques and multiple GCMs to improve climate change predictions in cryosphere scarcely-gauged catchment. Water Resour. Manag. 2018, 32, 3155–3174. [Google Scholar] [CrossRef]
  30. Mahmood, R.; Babel, M.S. Evaluation of SDSM developed by annual and monthly sub-models for downscaling temperature and precipitation in the Jhelum basin, Pakistan and India. Theor. Appl. Climatol. 2013, 113, 27–44. [Google Scholar] [CrossRef]
  31. Azmat, M.; Qamar, M.U.; Huggel, C.; Hussain, E. Future climate and cryosphere impacts on the hydrology of a scarcely gauged catchment on the Jhelum river basin, Northern Pakistan. Sci. Total Environ. 2018, 639, 961–976. [Google Scholar] [CrossRef]
  32. Habib, E.; Henschke, A.; Adler, R.F. Evaluation of TMPA satellite-based research and real-time rainfall estimates during six tropical-related heavy rainfall events over Louisiana, USA. Atmos. Res. 2009, 94, 373–388. [Google Scholar] [CrossRef]
  33. Alexandersson, H. A homogeneity test applied to precipitation data. J. Climatol. 1986, 6, 661–675. [Google Scholar] [CrossRef]
  34. Shen, Y.; Xiong, A. Validation and comparison of a new gauge-based precipitation analysis over mainland China. Int. J. Climatol. 2016, 36, 252–265. [Google Scholar] [CrossRef]
  35. Beck, H.E.; Wood, E.F.; Pan, M.; Fisher, C.K.; Miralles, D.G.; Van Dijk, A.I.; McVicar, T.R.; Adler, R.F. MSWEP V2 global 3-hourly 0.1 precipitation: Methodology and quantitative assessment. Bull. Am. Meteorol. Soc. 2019, 100, 473–500. [Google Scholar] [CrossRef]
  36. Albergel, C.; Dutra, E.; Munier, S.; Calvet, J.-C.; Munoz-Sabater, J.; Rosnay, P.d.; Balsamo, G. ERA-5 and ERA-Interim driven ISBA land surface model simulations: Which one performs better? Hydrol. Earth Syst. Sci. 2018, 22, 3515–3532. [Google Scholar] [CrossRef]
  37. Bell, B.; Hersbach, H.; Berrisford, P.; Dahlgren, P.; Horányi, A.; Muñoz Sabater, J.; Nicolas, J.; Radu, R.; Schepers, D.; Simmons, A. ERA5 Hourly Data on Single Levels from 1950 to 1978 (Preliminary Version). Copernicus Climate Change Service (C3S) Climate Data Store (CDS) (2020). 2020. Available online: https://cds.climate.copernicus.eu/cdsapp#!/search?type=dataset (accessed on 11 August 2022).
  38. Martens, B.; Schumacher, D.L.; Wouters, H.; Muñoz-Sabater, J.; Verhoest, N.E.; Miralles, D.G. Evaluating the surface energy partitioning in ERA5. Geosci. Model Dev. Discuss. 2020, 2020, 4159–4181. [Google Scholar] [CrossRef]
  39. Olauson, J. ERA5: The new champion of wind power modelling? Renew. Energy 2018, 126, 322–331. [Google Scholar] [CrossRef]
  40. Decker, M.; Brunke, M.A.; Wang, Z.; Sakaguchi, K.; Zeng, X.; Bosilovich, M.G. Evaluation of the reanalysis products from GSFC, NCEP, and ECMWF using flux tower observations. J. Clim. 2012, 25, 1916–1944. [Google Scholar] [CrossRef]
  41. Azmat, M.; Liaqat, U.W.; Qamar, M.U.; Awan, U.K. Impacts of changing climate and snow cover on the flow regime of Jhelum River, Western Himalayas. Reg. Environ. Chang. 2017, 17, 813–825. [Google Scholar] [CrossRef]
  42. Tahir, A.A.; Chevallier, P.; Arnaud, Y.; Neppel, L.; Ahmad, B. Modeling snowmelt-runoff under climate scenarios in the Hunza River basin, Karakoram Range, Northern Pakistan. J. Hydrol. 2011, 409, 104–117. [Google Scholar] [CrossRef]
  43. Yatagai, A.; Kamiguchi, K.; Arakawa, O.; Hamada, A.; Yasutomi, N.; Kitoh, A. APHRODITE: Constructing a long-term daily gridded precipitation dataset for Asia based on a dense network of rain gauges. Bull. Am. Meteorol. Soc. 2012, 93, 1401–1415. [Google Scholar] [CrossRef]
  44. Sheffield, J.; Goteti, G.; Wood, E.F. Development of a 50-year high-resolution global dataset of meteorological forcings for land surface modeling. J. Clim. 2006, 19, 3088–3111. [Google Scholar] [CrossRef]
  45. Shafeeque, M.; Yi, L. A tri-approach for diagnosing gridded precipitation datasets for watershed glacio-hydrological simulation in mountain regions. Hydrol. Earth Syst. Sci. Discuss. 2020; 1–49, preprint. [Google Scholar]
  46. Funk, C.; Peterson, P.; Landsfeld, M.; Pedreros, D.; Verdin, J.; Shukla, S.; Husak, G.; Rowland, J.; Harrison, L.; Hoell, A. The climate hazards infrared precipitation with stations—A new environmental record for monitoring extremes. Sci. Data 2015, 2, 150066. [Google Scholar] [CrossRef]
  47. Dinku, T.; Funk, C.; Peterson, P.; Maidment, R.; Tadesse, T.; Gadain, H.; Ceccato, P. Validation of the CHIRPS satellite rainfall estimates over eastern Africa. Q. J. R. Meteorol. Soc. 2018, 144, 292–312. [Google Scholar] [CrossRef]
  48. Mu, X.; Zhang, X.; Gao, P.; Wang, F. Theory of double mass curves and its applications in hydrology and meteorology. J. China Hydrol. 2010, 30, 47–51. [Google Scholar]
  49. Shrestha, N.K.; Du, X.; Wang, J. Assessing climate change impacts on fresh water resources of the Athabasca River Basin, Canada. Sci. Total Environ. 2017, 601, 425–440. [Google Scholar] [CrossRef]
  50. Tan, M.L.; Santo, H. Comparison of GPM IMERG, TMPA 3B42 and PERSIANN-CDR satellite precipitation products over Malaysia. Atmos. Res. 2018, 202, 63–76. [Google Scholar] [CrossRef]
  51. Gampe, D.; Ludwig, R. Evaluation of gridded precipitation data products for hydrological applications in complex topography. Hydrology 2017, 4, 53. [Google Scholar] [CrossRef]
  52. Gao, Y.; Liu, M. Evaluation of high-resolution satellite precipitation products using rain gauge observations over the Tibetan Plateau. Hydrol. Earth Syst. Sci. Discuss. 2012, 17, 837–849. [Google Scholar] [CrossRef]
  53. Blacutt, L.A.; Herdies, D.L.; de Gonçalves, L.G.G.; Vila, D.A.; Andrade, M. Precipitation comparison for the CFSR, MERRA, TRMM3B42 and Combined Scheme datasets in Bolivia. Atmos. Res. 2015, 163, 117–131. [Google Scholar] [CrossRef] [Green Version]
  54. Hu, Z.; Wang, L.; Wang, Z.; Hong, Y.; Zheng, H. Quantitative assessment of climate and human impacts on surface water resources in a typical semi-arid watershed in the middle reaches of the Yellow River from 1985 to 2006. Int. J. Climatol. 2015, 35, 97–113. [Google Scholar] [CrossRef]
  55. Liu, Z. Comparison of versions 6 and 7 3-hourly TRMM multi-satellite precipitation analysis (TMPA) research products. Atmos. Res. 2015, 163, 91–101. [Google Scholar] [CrossRef]
  56. Prein, A.; Gobiet, A.; Truhetz, H.; Keuler, K.; Goergen, K.; Teichmann, C.; Fox Maule, C.; Van Meijgaard, E.; Déqué, M.; Nikulin, G. Precipitation in the EURO-CORDEX 0.118 and 0.448 simulations: High resolution, high benefits? Clim. Dyn. 2016, 46, 383–412. [Google Scholar] [CrossRef]
  57. Li, J.; Heap, A.D. A review of comparative studies of spatial interpolation methods in environmental sciences: Performance and impact factors. Ecol. Inform. 2011, 6, 228–241. [Google Scholar] [CrossRef]
  58. Brown, J.E. An analysis of the performance of hybrid infrared and microwave satellite precipitation algorithms over India and adjacent regions. Remote Sens. Environ. 2006, 101, 63–81. [Google Scholar] [CrossRef]
  59. Condom, T.; Rau, P.; Espinoza, J.C. Correction of TRMM 3B43 monthly precipitation data over the mountainous areas of Peru during the period 1998–2007. Hydrol. Process. 2011, 25, 1924–1933. [Google Scholar] [CrossRef]
  60. Mayor, Y.G.; Tereshchenko, I.; Fonseca-Hernández, M.; Pantoja, D.A.; Montes, J.M. Evaluation of error in IMERG precipitation estimates under different topographic conditions and temporal scales over Mexico. Remote Sens. 2017, 9, 503. [Google Scholar] [CrossRef]
  61. Wilks, D.S. Statistical Methods in the Atmospheric Sciences, 3rd ed.; Academic Press: Amsterdam, The Netherlands, 2011; Volume 100. [Google Scholar]
  62. Xu, R.; Tian, F.; Yang, L.; Hu, H.; Lu, H.; Hou, A. Ground validation of GPM IMERG and TRMM 3B42V7 rainfall products over southern Tibetan Plateau based on a high-density rain gauge network. J. Geophys. Res. Atmos. 2017, 122, 910–924. [Google Scholar] [CrossRef]
  63. Yong, B.; Ren, L.L.; Hong, Y.; Wang, J.H.; Gourley, J.J.; Jiang, S.H.; Chen, X.; Wang, W. Hydrologic evaluation of Multisatellite Precipitation Analysis standard precipitation products in basins beyond its inclined latitude band: A case study in Laohahe basin, China. Water Resour. Res. 2010, 46, W07542. [Google Scholar] [CrossRef]
  64. Hasson, S.; Böhner, J.; Lucarini, V. Prevailing climatic trends and runoff response from Hindukush-Karakoram-Himalaya, upper Indus basin. Earth Syst. Dynam. 2017, 8, 337–355. [Google Scholar] [CrossRef] [Green Version]
  65. Ghozat, A.; Sharafati, A.; Hosseini, S.A. Long-term spatiotemporal evaluation of CHIRPS satellite precipitation product over different climatic regions of Iran. Theor. Appl. Climatol. 2021, 143, 211–225. [Google Scholar] [CrossRef]
  66. Hu, X.; Yuan, W. Evaluation of ERA5 precipitation over the eastern periphery of the Tibetan plateau from the perspective of regional rainfall events. Int. J. Climatol. 2021, 41, 2625–2637. [Google Scholar] [CrossRef]
  67. Taylor, K.E. Summarizing multiple aspects of model performance in a single diagram. J. Geophys. Res. Atmos. 2001, 106, 7183–7192. [Google Scholar] [CrossRef]
  68. Nie, S.; Luo, Y.; Wu, T.; Shi, X.; Wang, Z. A merging scheme for constructing daily precipitation analyses based on objective bias-correction and error estimation techniques. J. Geophys. Res. Atmos. 2015, 120, 8671–8692. [Google Scholar] [CrossRef]
  69. Liu, J.; Shangguan, D.; Liu, S.; Ding, Y.; Wang, S.; Wang, X. Evaluation and comparison of CHIRPS and MSWEP daily-precipitation products in the Qinghai-Tibet Plateau during the period of 1981–2015. Atmos. Res. 2019, 230, 104634. [Google Scholar] [CrossRef]
  70. Andermann, C.; Bonnet, S.; Gloaguen, R. Evaluation of precipitation data sets along the Himalayan front. Geochem. Geophys. Geosyst. 2011, 12, Q07023. [Google Scholar] [CrossRef]
  71. Palazzi, E.; Von Hardenberg, J.; Provenzale, A. Precipitation in the Hindu-Kush Karakoram Himalaya: Observations and future scenarios. J. Geophys. Res. Atmos. 2013, 118, 85–100. [Google Scholar] [CrossRef]
  72. Olmo, M.E.; Bettolli, M.L. Statistical downscaling of daily precipitation over southeastern South America: Assessing the performance in extreme events. Int. J. Climatol. 2022, 42, 1283–1302. [Google Scholar] [CrossRef]
  73. Dembélé, M.; Zwart, S.J. Evaluation and comparison of satellite-based rainfall products in Burkina Faso, West Africa. Int. J. Remote Sens. 2016, 37, 3995–4014. [Google Scholar] [CrossRef]
  74. Jiang, Q.; Li, W.; Fan, Z.; He, X.; Sun, W.; Chen, S.; Wen, J.; Gao, J.; Wang, J. Evaluation of the ERA5 reanalysis precipitation dataset over Chinese Mainland. J. Hydrol. 2021, 595, 125660. [Google Scholar] [CrossRef]
  75. Nogueira, M. Inter-comparison of ERA-5, ERA-interim and GPCP rainfall over the last 40 years: Process-based analysis of systematic and random differences. J. Hydrol. 2020, 583, 124632. [Google Scholar] [CrossRef]
  76. Kim, K.; Park, J.; Baik, J.; Choi, M. Evaluation of topographical and seasonal feature using GPM IMERG and TRMM 3B42 over Far-East Asia. Atmos. Res. 2017, 187, 95–105. [Google Scholar] [CrossRef]
  77. Tahir, A.A.; Adamowski, J.F.; Chevallier, P.; Haq, A.U.; Terzago, S. Comparative assessment of spatiotemporal snow cover changes and hydrological behavior of the Gilgit, Astore and Hunza River basins (Hindukush–Karakoram–Himalaya region, Pakistan). Meteorol. Atmos. Phys. 2016, 128, 793–811. [Google Scholar] [CrossRef]
  78. Bollasina, M.A.; Ming, Y.; Ramaswamy, V. Anthropogenic aerosols and the weakening of the South Asian summer monsoon. Science 2011, 334, 502–505. [Google Scholar] [CrossRef] [PubMed]
  79. Kaufman, Y.J.; Tanré, D.; Boucher, O. A satellite view of aerosols in the climate system. Nature 2002, 419, 215–223. [Google Scholar] [CrossRef] [PubMed]
  80. Dipu, S.; Prabha, T.V.; Pandithurai, G.; Dudhia, J.; Pfister, G.; Rajesh, K.; Goswami, B. Impact of elevated aerosol layer on the cloud macrophysical properties prior to monsoon onset. Atmos. Environ. 2013, 70, 454–467. [Google Scholar] [CrossRef]
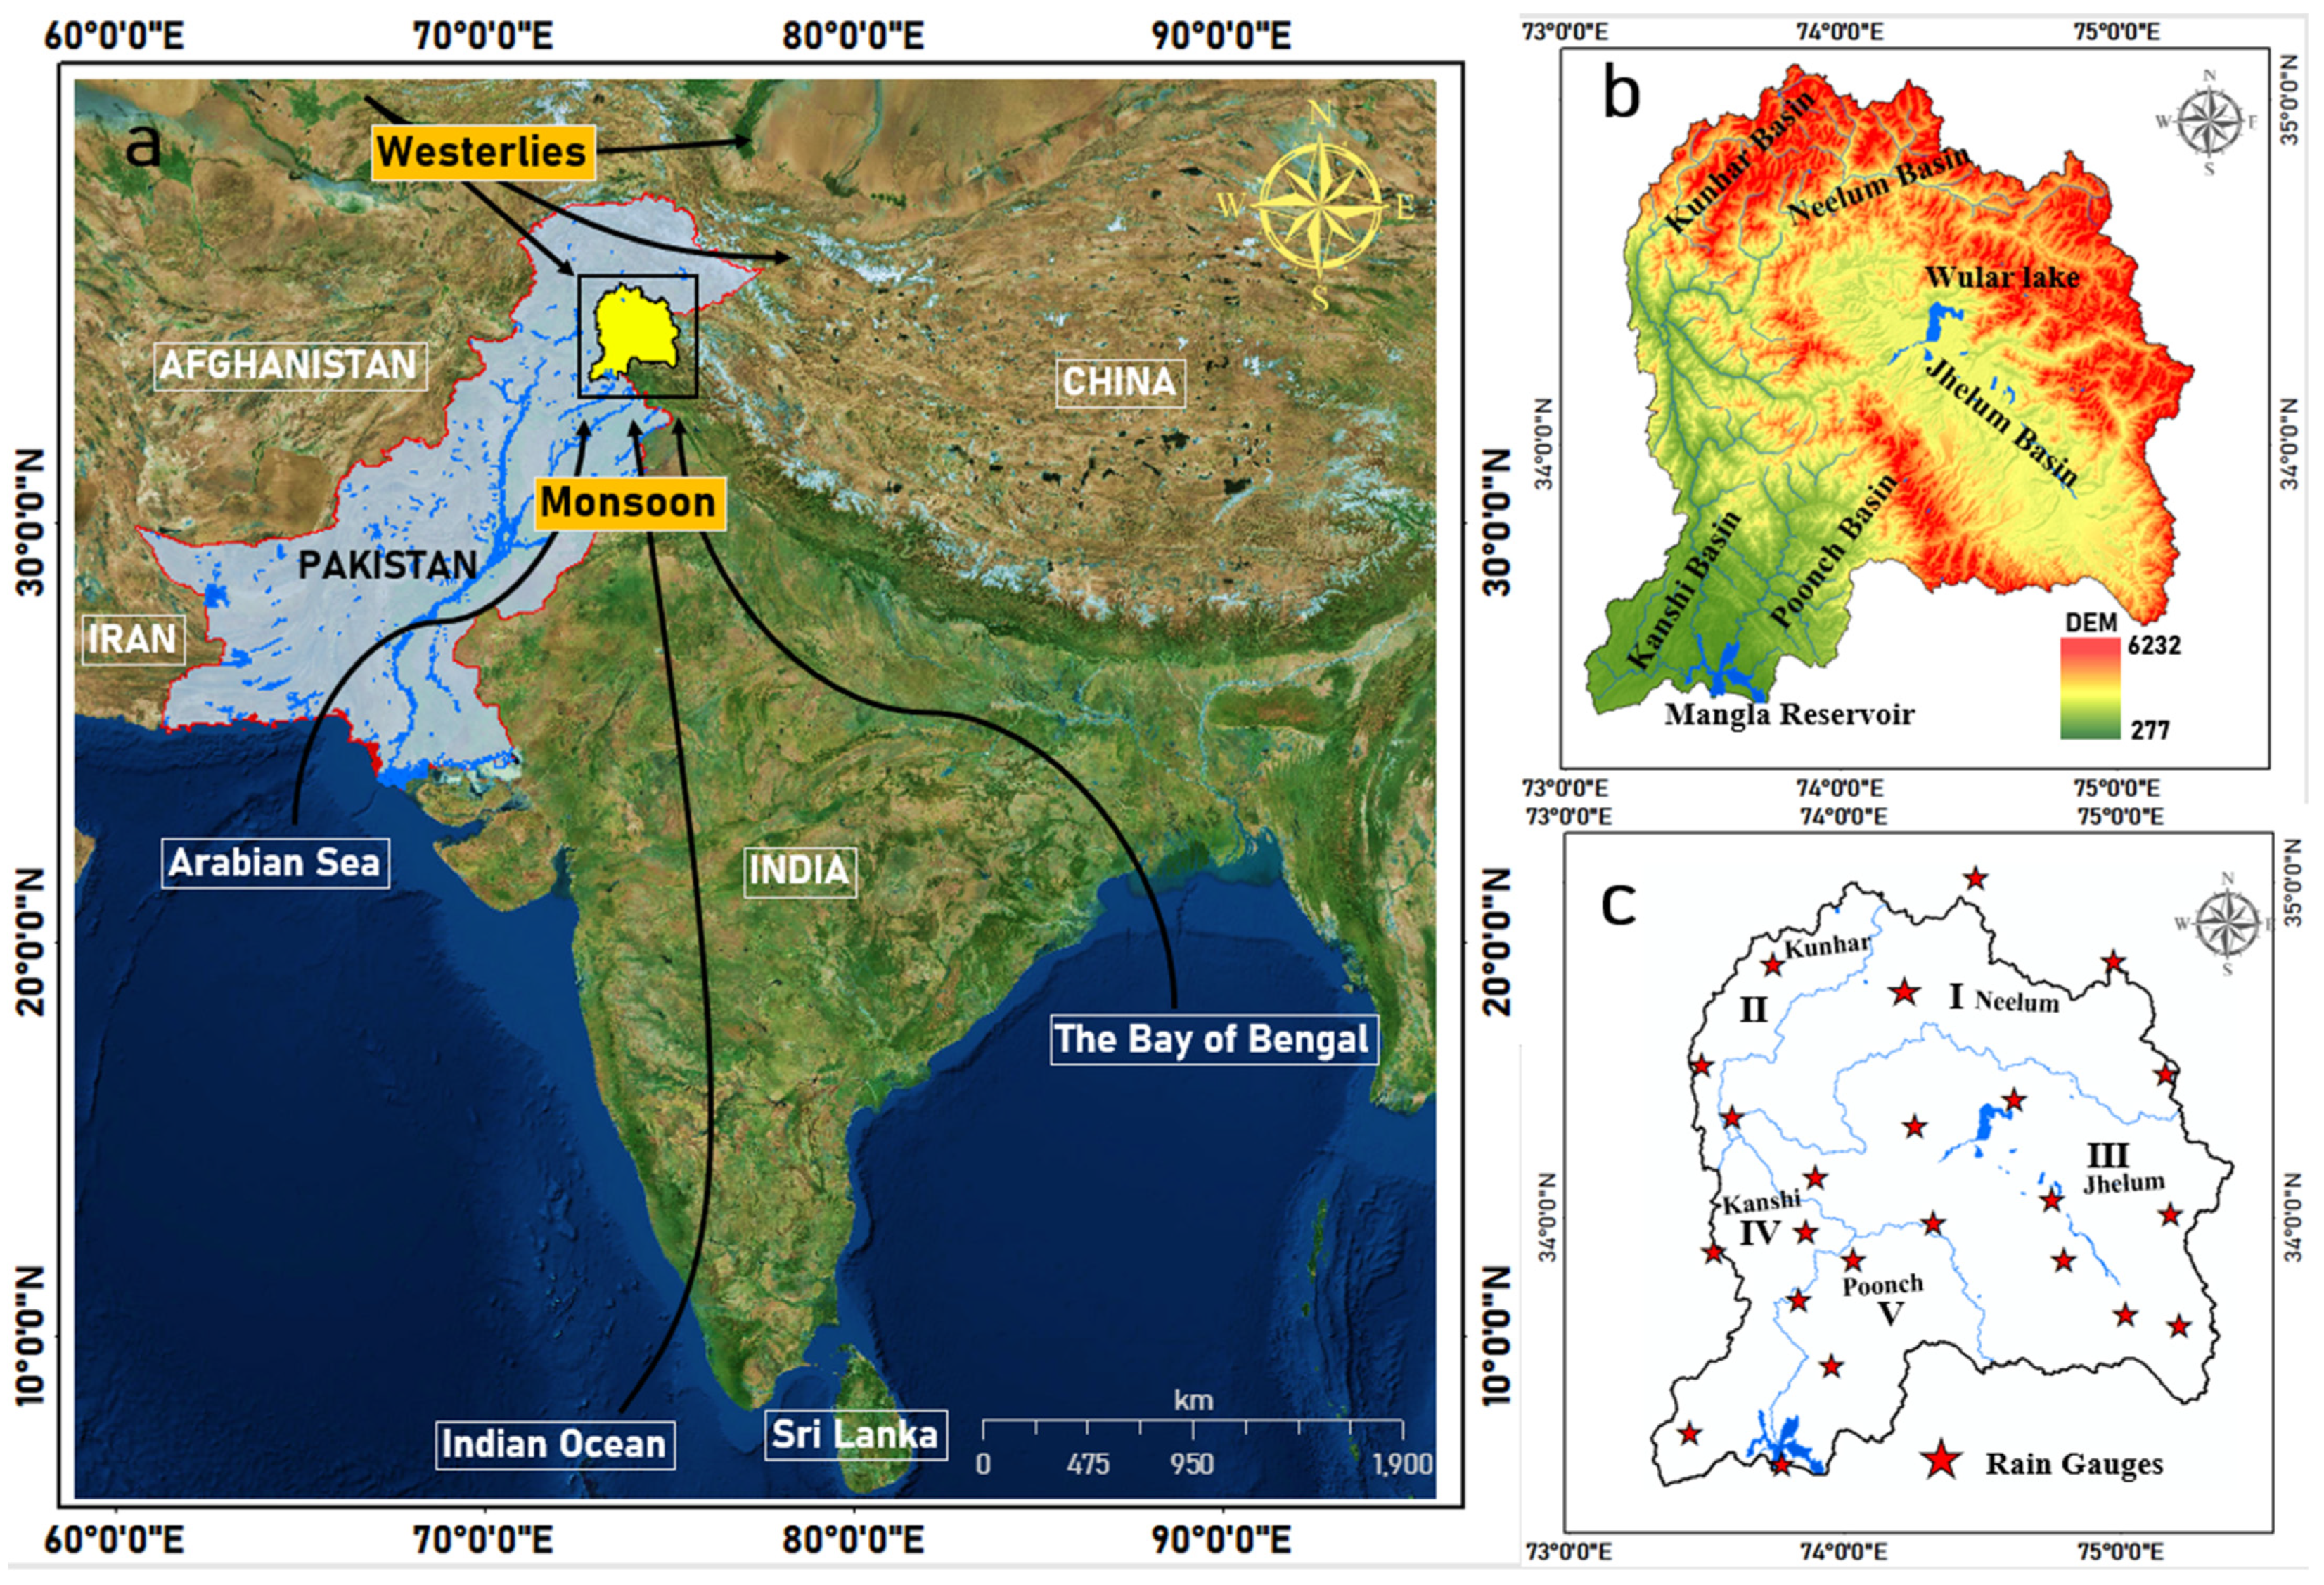
Figure 1. The geographical location of the study area. (a) seasonal influences of precipitation sources (b) Elevation (c) distribution of rain gauges in SBs. Whereas I, II, III, IV and V represent Neelum, Kunhar, Jhelum, Kanshi and Poonch sub-basins, respectively.
Remotesensing 14 04773 g001
Figure 2. Spatial variability of average annual precipitation over JRB during the entire study period 1981–2009 from (a) in-situ gauges, (b) MSWEP, (c) ERA-5, (d) APHRO, (e) PGMFD, and (f) CHIRPS. Whereas I, II, III, IV and V represent Neelum, Kunhar, Jhelum, Kanshi and Poonch sub-basins, respectively.
Remotesensing 14 04773 g002
Figure 3. Taylor diagrams showing the statistical comparisons between GPPs and in-situ gauges data.
Remotesensing 14 04773 g003
Figure 4. Spatial distribution of (a) CC, (b) Bias, and (c) RMSE from GPPs in contrast to in-situ gauge data during the entire study period.
Remotesensing 14 04773 g004
Figure 5. The performance of GPPs in SBs daily and during monsoon season. The lines of each box from bottom to top represent the minimum, first quartile, median, third quartile, and maximum values, respectively. (a) Correlation coefficient, (b) Root Mean Square Error, (c) relative Bias, (d) Relative Bias in percentage, (e) Probability of Detection, (f) False Alarm Ratio, (g) Critical Success Index.
Remotesensing 14 04773 g005
Figure 6. The performance of GPPs at SBs during pre-monsoon and monsoon seasons. The lines of each box from bottom to top represent the minimum, first quartile, median, third quartile, and maximum values, respectively. (a) Correlation coefficient, (b) Root Mean Square Error, (c) relative Bias, (d) Relative Bias in percentage, (e) Probability of Detection, (f) False Alarm Ratio, (g) Critical Success Index.
Remotesensing 14 04773 g006
Figure 7. The probability density function (PDF) of GPPs with diverse intensities during (a) entire study period, (b) winter, (c) pre-monsoon, and (d) monsoon.
Remotesensing 14 04773 g007
Table 1. Topological information of five sub-basins of JRB.
S.NoName of Sub-BasinsMean Elevation (m)Area (km²)Weather Stations
INeelum35477420.984
IIKunhar28052660.352
IIIJhelum301914,396.709
IVKanshi21684191.013
VPoonch20954799.694
Table 2. General information of five GPPs assessed in this study.
ProductTime PeriodSpatial ResolutionHighest Temporal ResolutionCategoryCategory
APHRO1951-present0.25° × 0.25°DailyGaugeRIHN and JMA/MRI (Japan)
CHIRPS1981–present0.05° × 0.05°DailySatellite-gaugeUniversity of California
ERA-51979–present0.25° × 0.25°Hourly/DailyReanalysisEuropean Centre for Medium-Range Weather Forecasts (ECMWF)
MSWEP1979-to ~3 h from real-time0.1° × 0.1°3-hourlyMulti-Source WeightedGloH2O, Almere, the Netherlands
PGMFD1948–20100.25° × 0.25°DailyReanalysis, gaugePrinceton University
Table 3. The statistical metrics for monthly performance evaluation of GPPs in contrast to in-situ gauges data during the entire study period 1981–2009.
IndicesAPHROCHIRPSERA-5MSWEPPGMFD
CC0.900.740.910.920.78
RMSE (mm/day)28.2535.0925.4823.2632.81
BIAS (mm/day)−0.52−1.100.84−0.30−0.77
rBIAS (%)−18.57−27.5028.06−10.48−20.74
Table 4. The statistical metrics for daily performance evaluation of GPPs in contrast to in-situ gauges data during the entire study period 1981–2009 with different seasons.
Entire Period
ProductCCRMSE (mm/day)BIAS (mm/day)rBIAS (%)PODFARCSI
APHRO0.763.42−0.51−11.250.610.170.69
CHIRPS 0.573.99−1.36−25.760.520.250.43
ERA-50.813.380.8226.430.710.150.70
MSWEP0.862.29−0.30−5.940.750.140.72
PGMFD0.683.85−0.76−15.270.600.190.51
Winter
APHRO0.743.600.174.950.590.110.57
CHIRPS 0.583.880.558.270.490.290.47
ERA-50.813.320.8932.720.640.100.60
MSWEP0.901.800.103.030.860.060.83
PGMFD0.693.630.456.760.550.180.50
Pre-Monsoon
APHRO0.773.64−1.15−13.040.740.130.70
CHIRPS 0.515.25−2.37−24.670.550.150.53
ERA-50.793.550.9728.360.750.110.70
MSWEP0.882.09−1.02−10.180.750.100.73
PGMFD0.673.76−1.44−14.730.650.140.64
Monsoon
APHRO0.783.35−0.33−10.960.770.100.76
CHIRPS 0.593.86−1.30−23.710.580.130.57
ERA-50.853.240.5824.180.810.090.78
MSWEP0.863.11−0.14−2.860.830.080.80
PGMFD0.713.61−0.74−14.390.660.110.66
Publisher’s Note: MDPI stays neutral with regard to jurisdictional claims in published maps and institutional affiliations.