
Characterization of an Active Fault through a Multiparametric Investigation: The Trecastagni Fault and Its Relationship with the Dynamics of Mt. Etna Volcano (Sicily, Italy)

 , ,
, ,  , ,
, , 
Abstract
1. Introduction
2. Materials and Method
2.1. Seismic Network
2.2. Extensometers
2.3. Levelling
2.4. DInSAR Analysis
2.5. Seismic Surveys
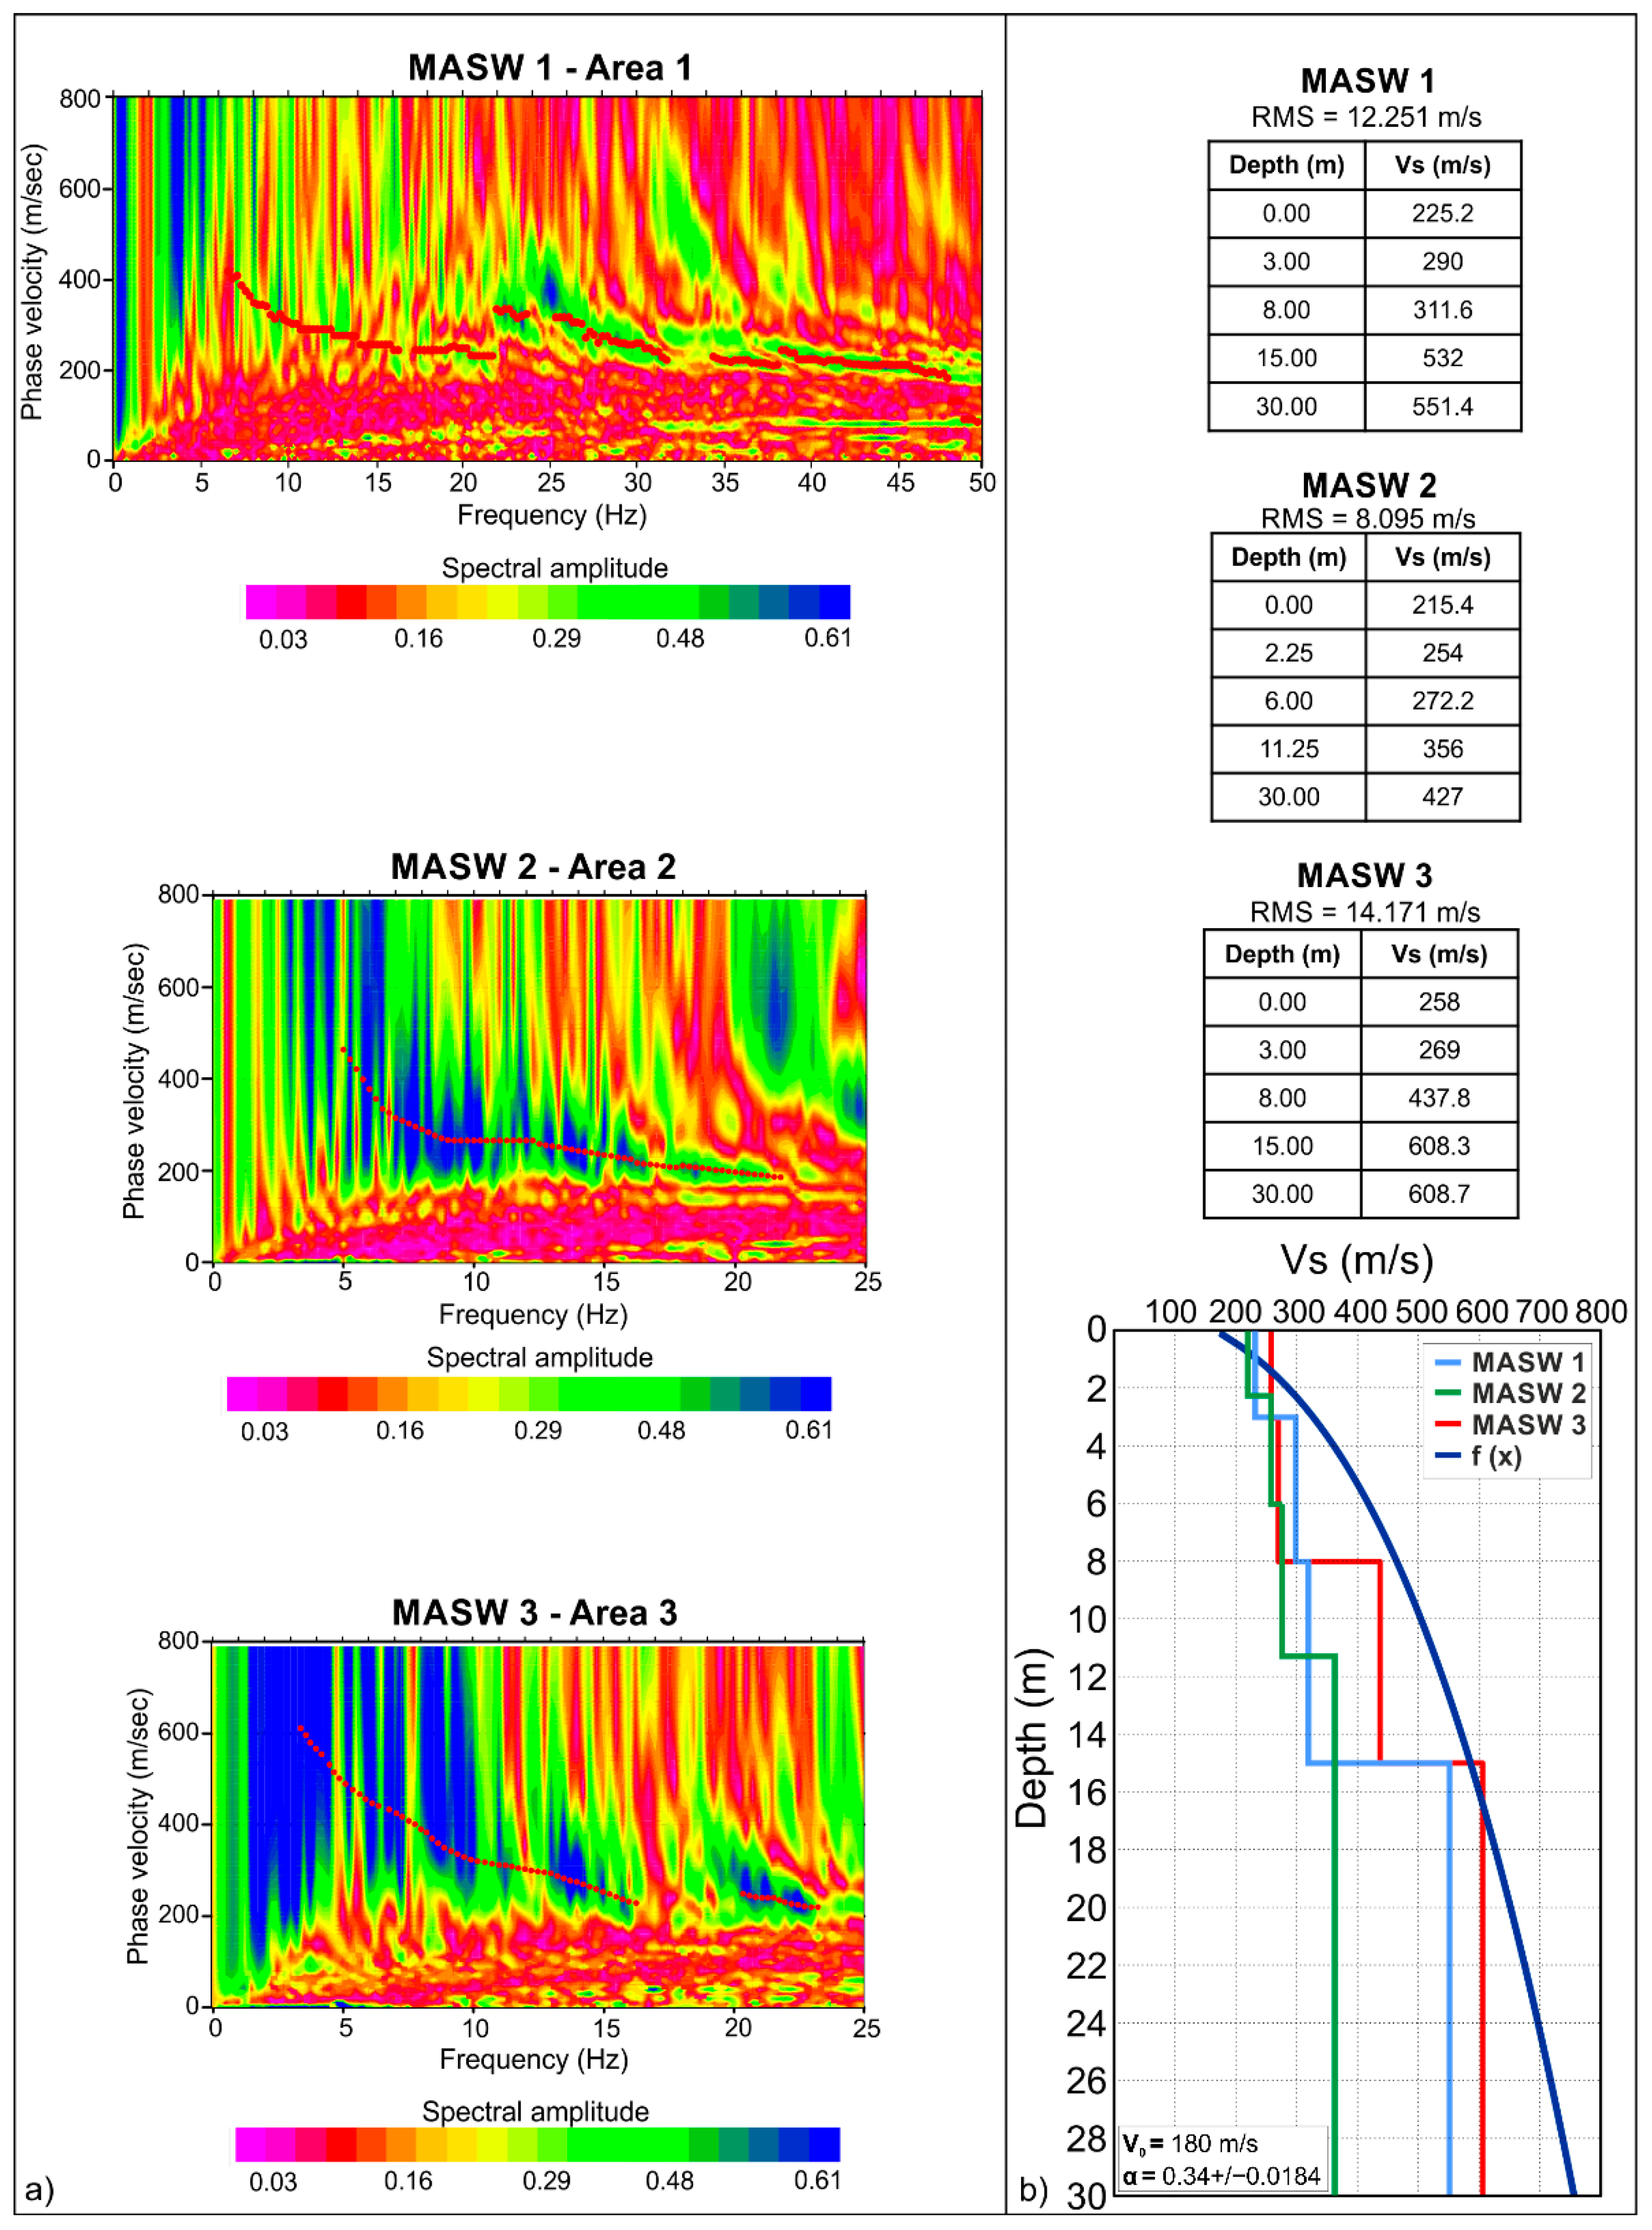
2.5.1. MASW Surveys
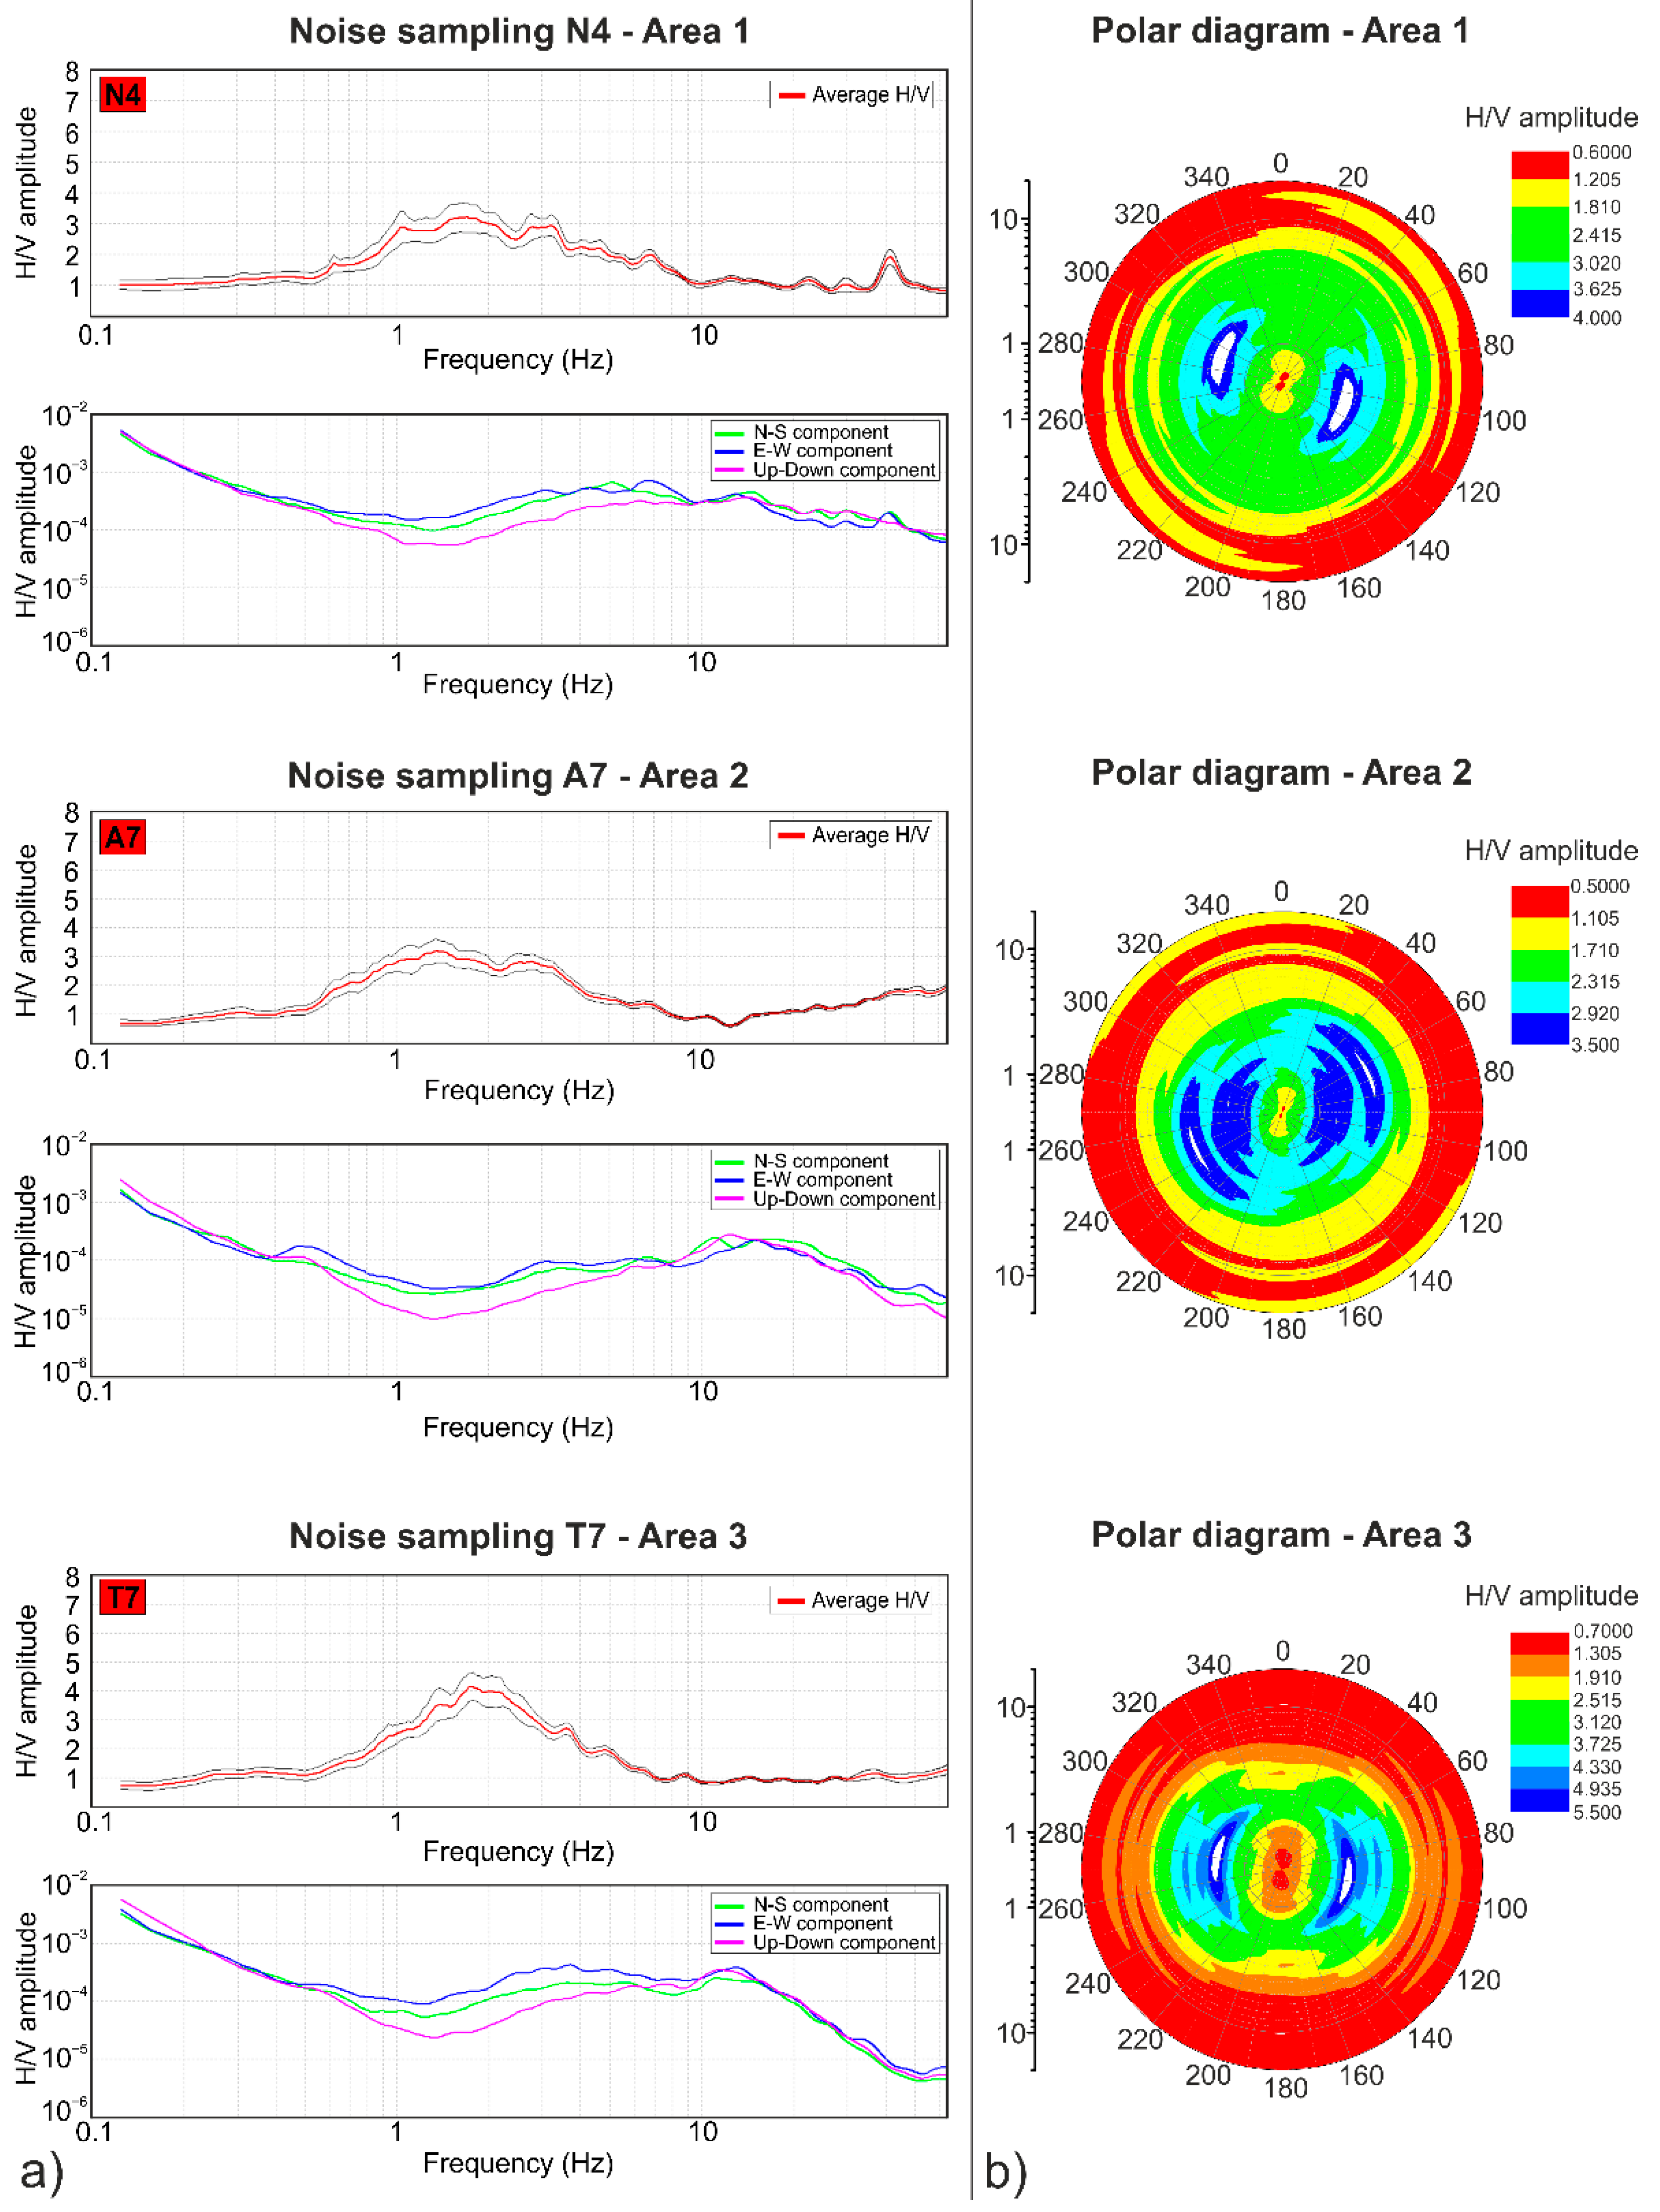
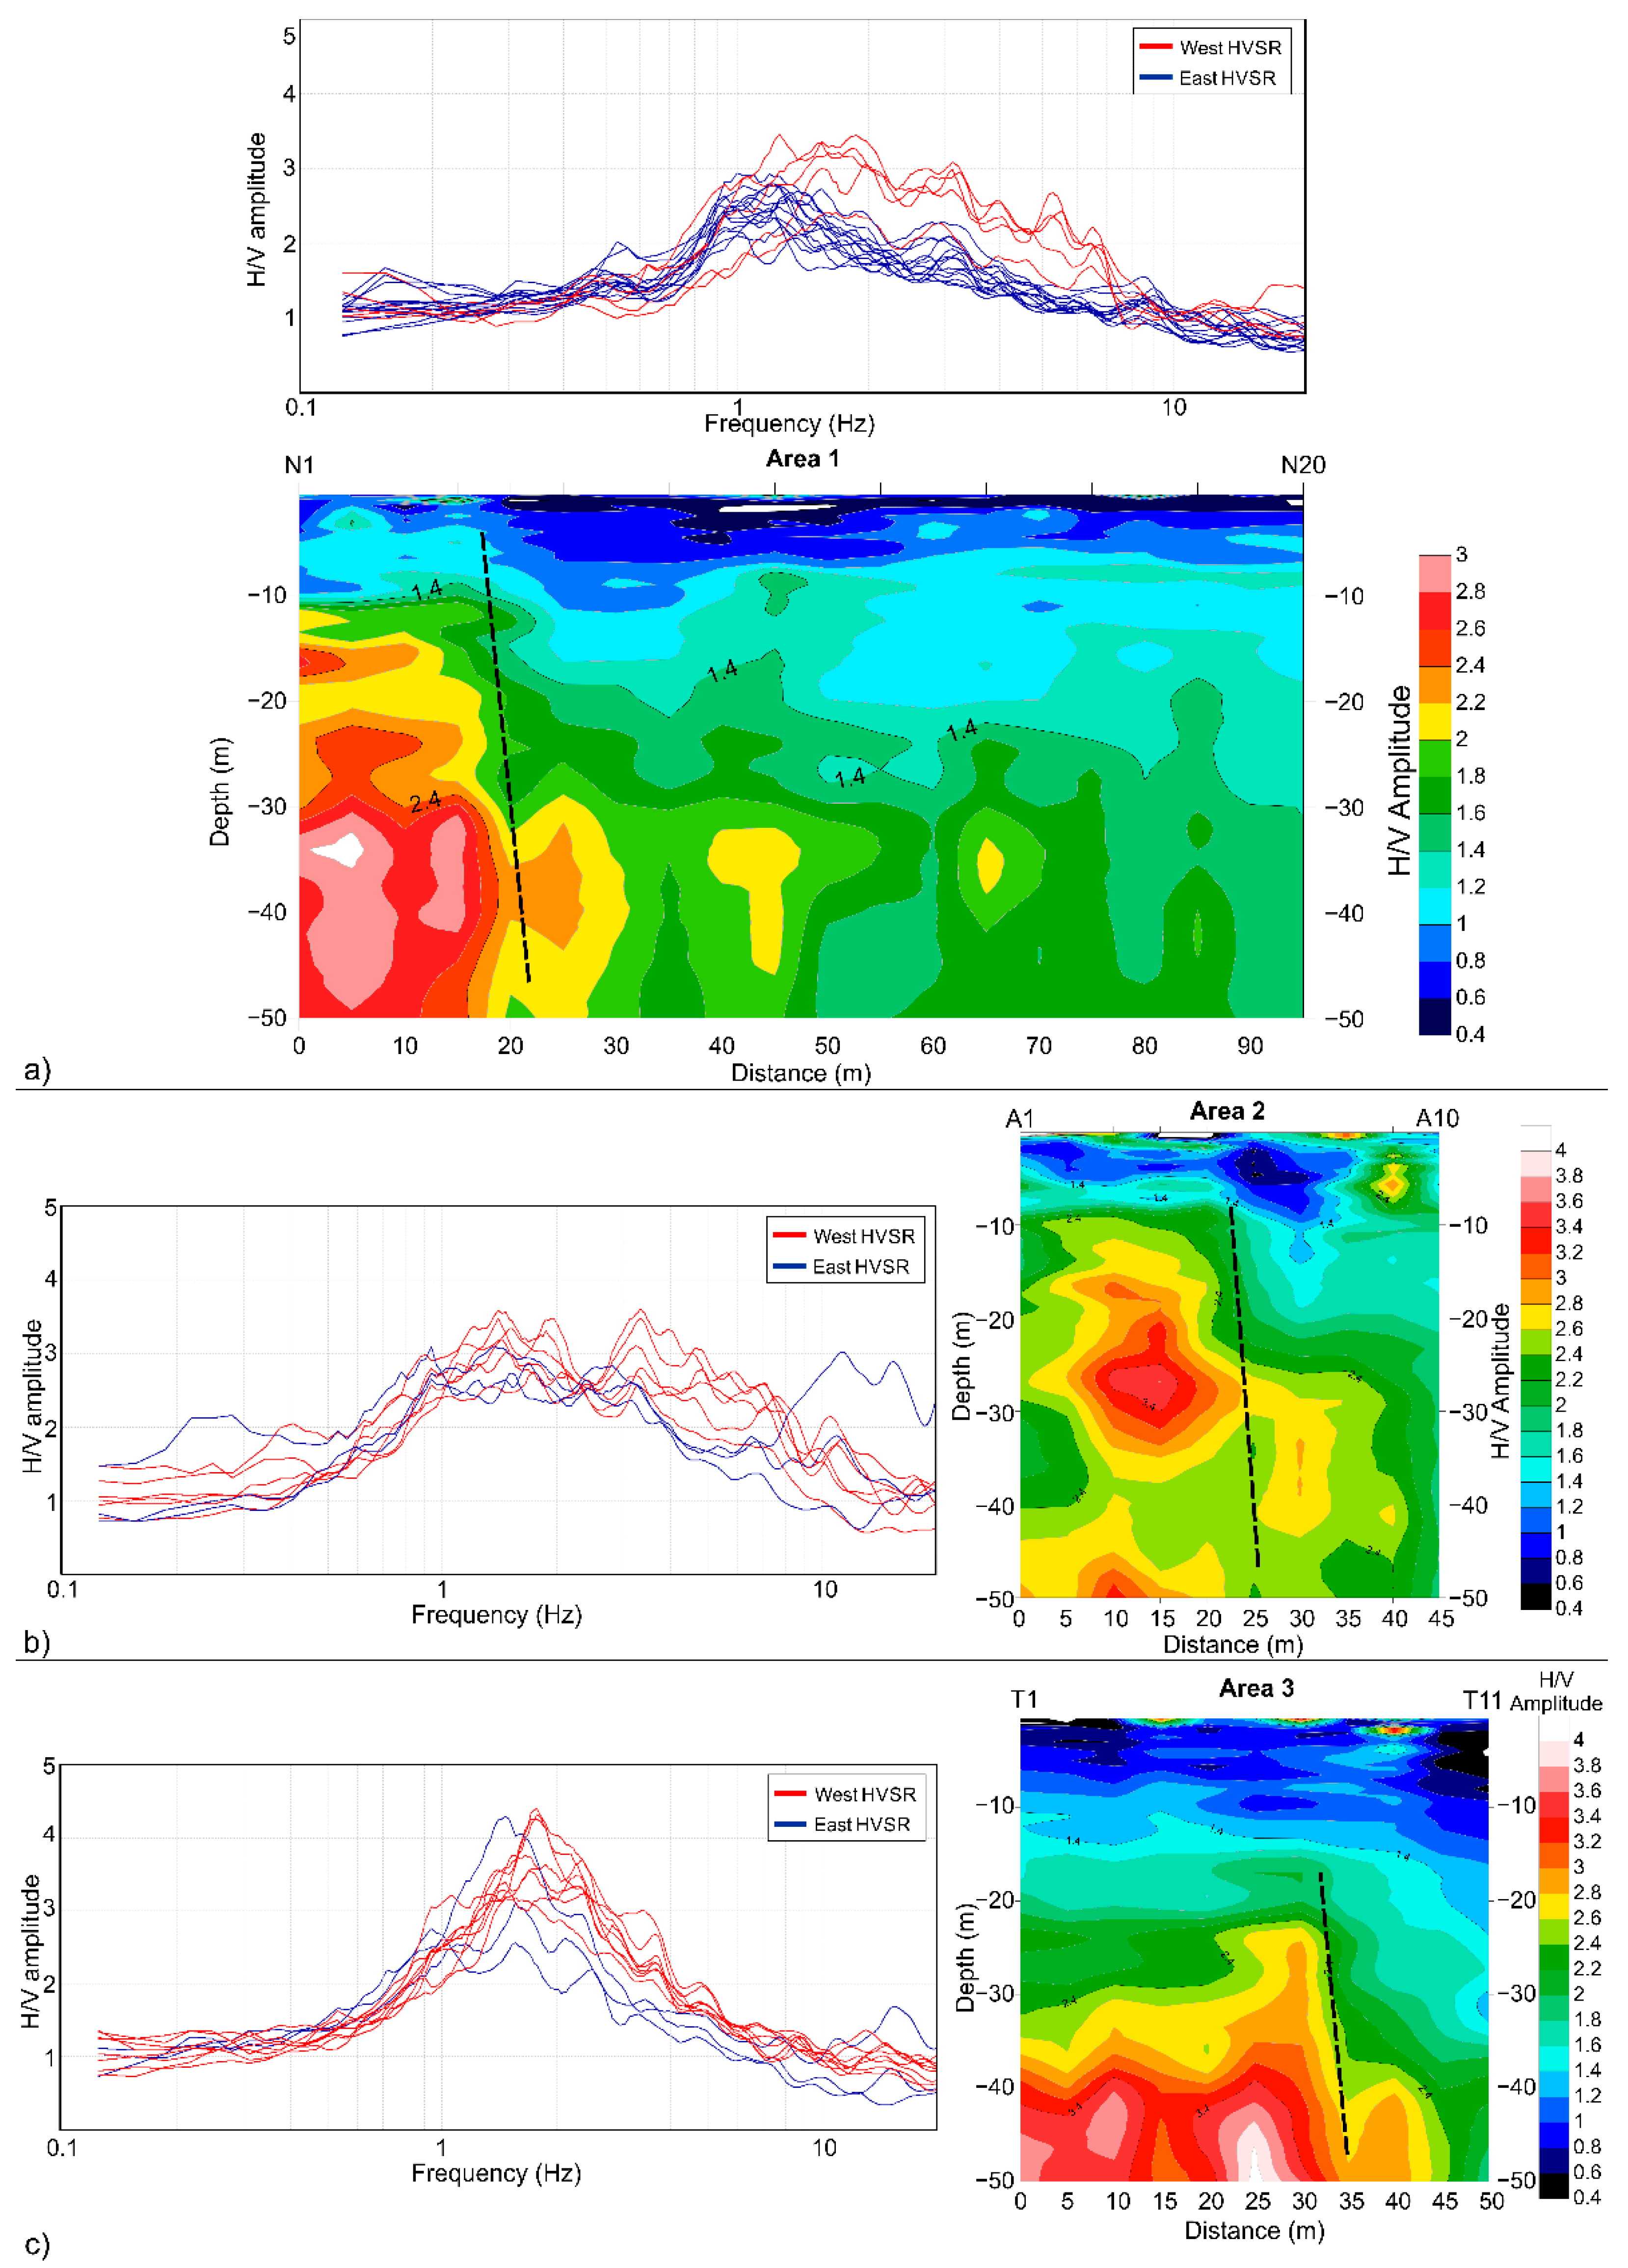
2.5.2. HVSR Surveys
3. Results
3.1. Seismic Survey Data
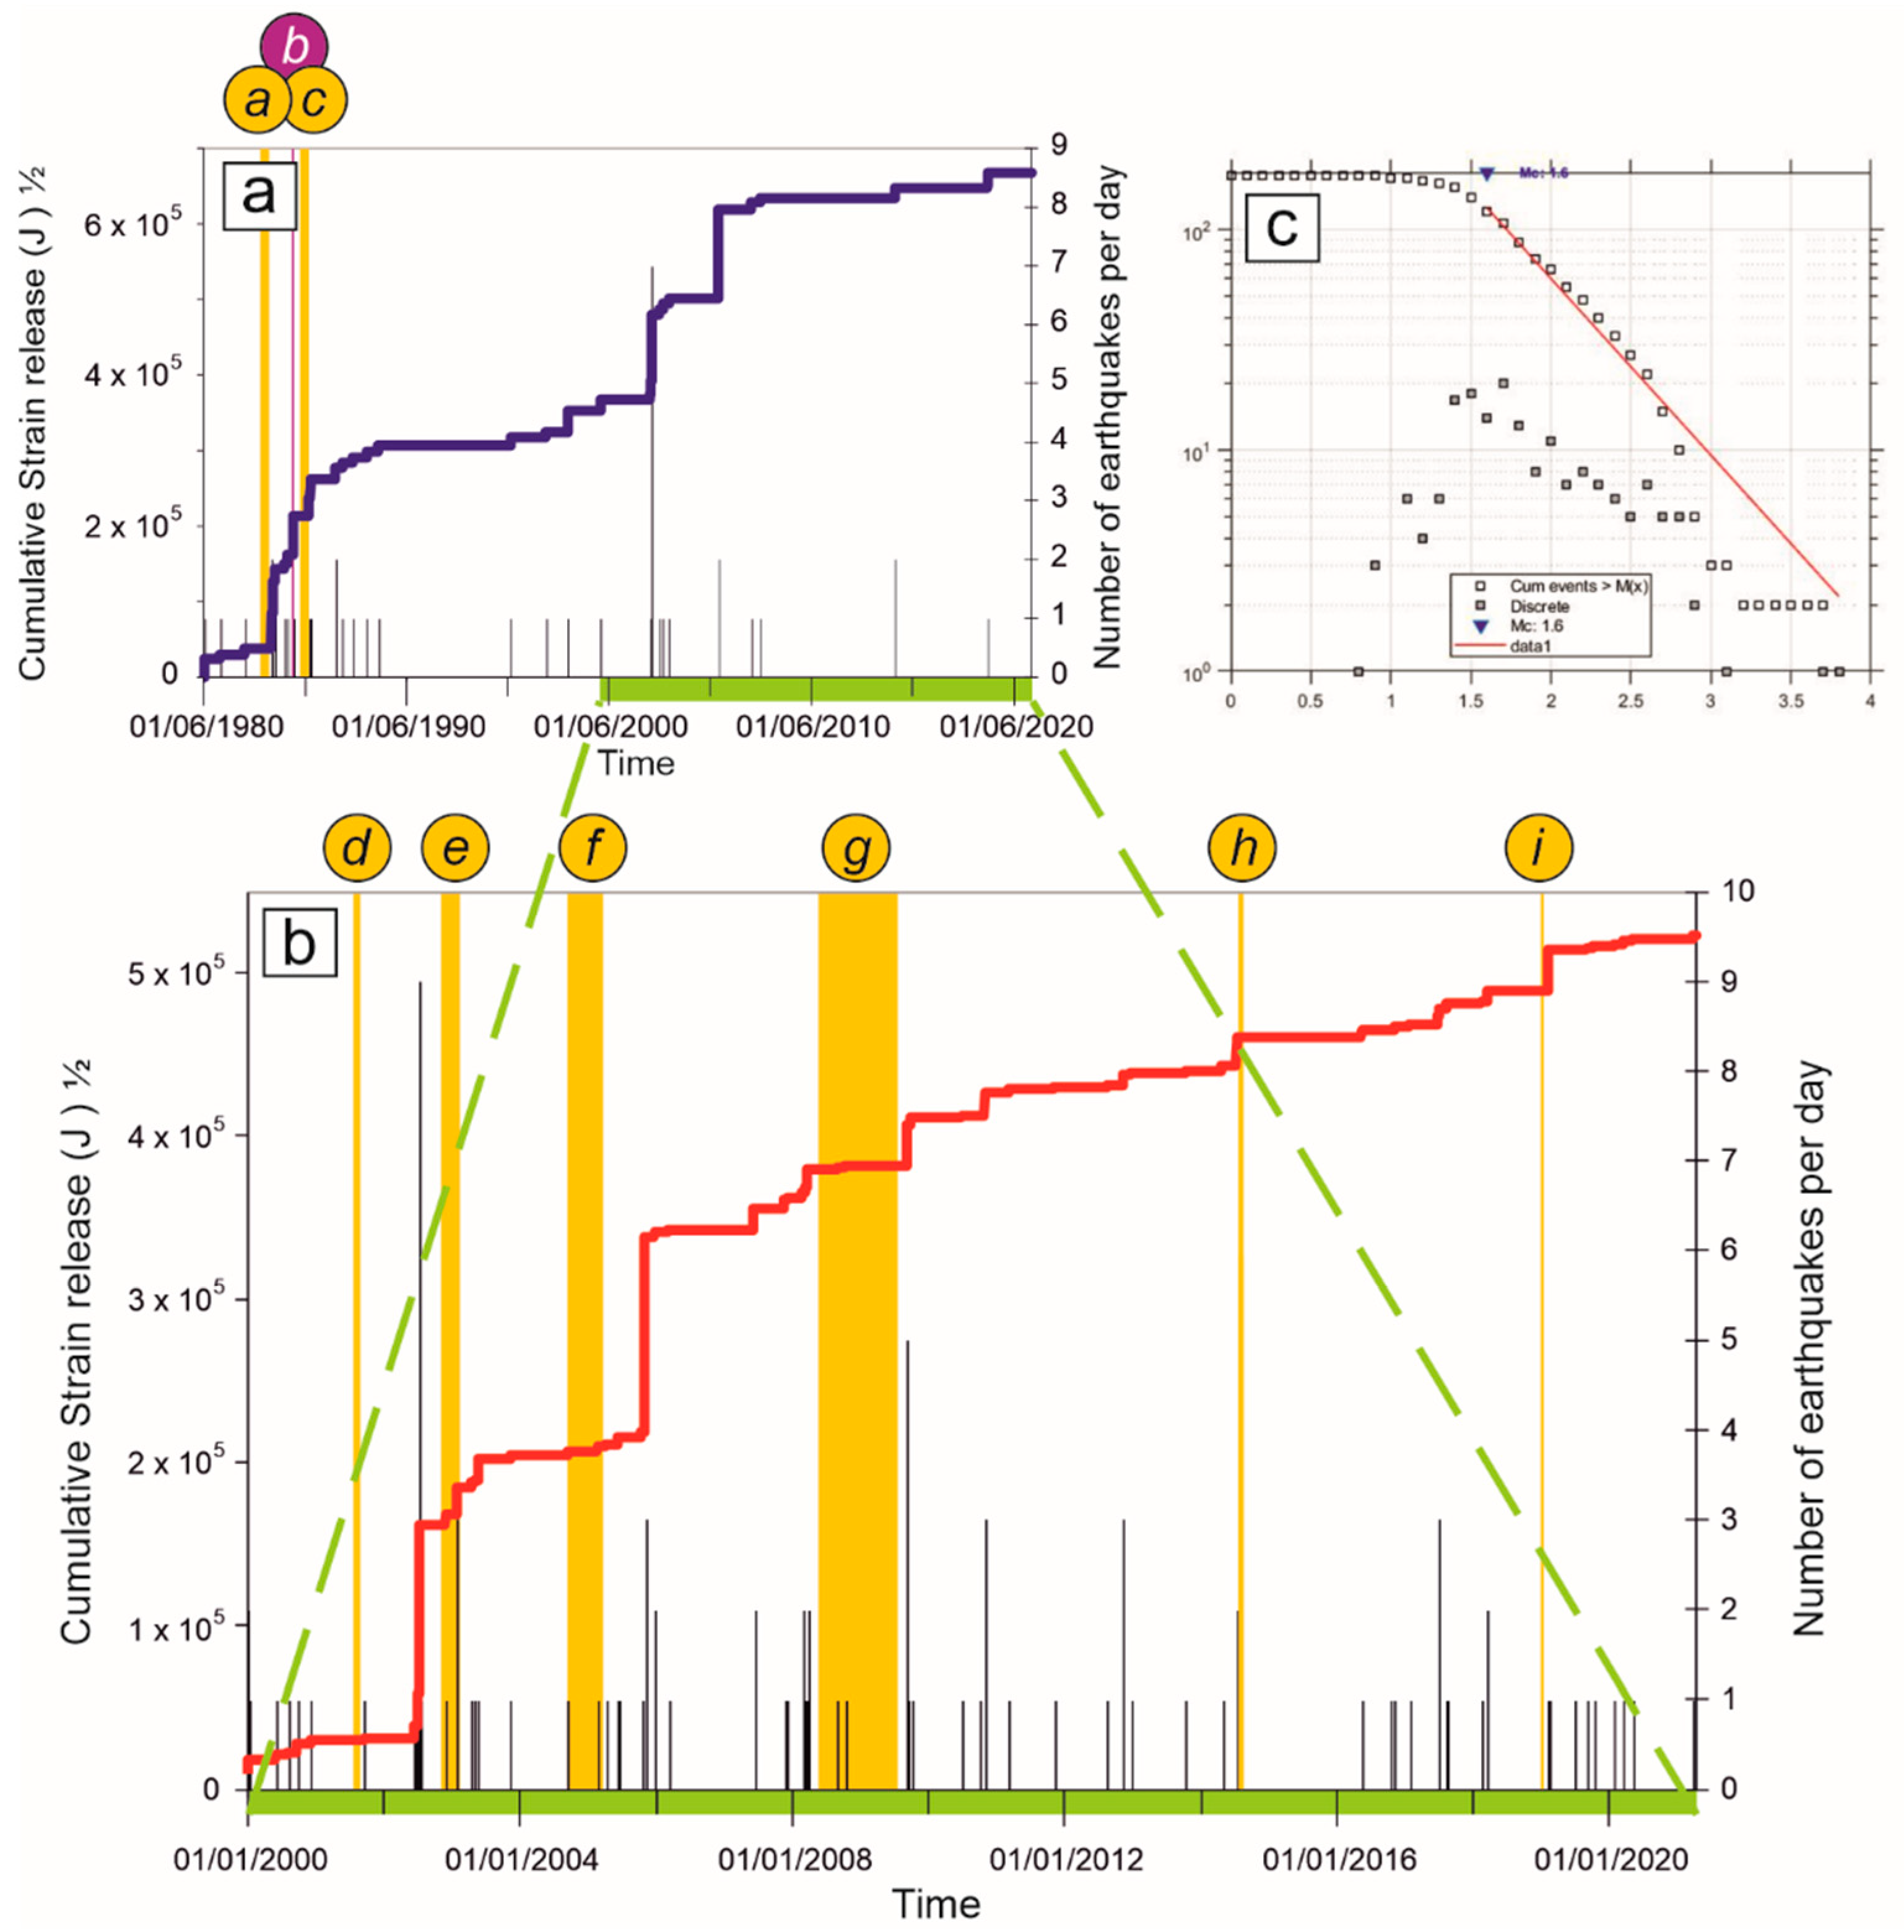
3.2. Seismological Framework
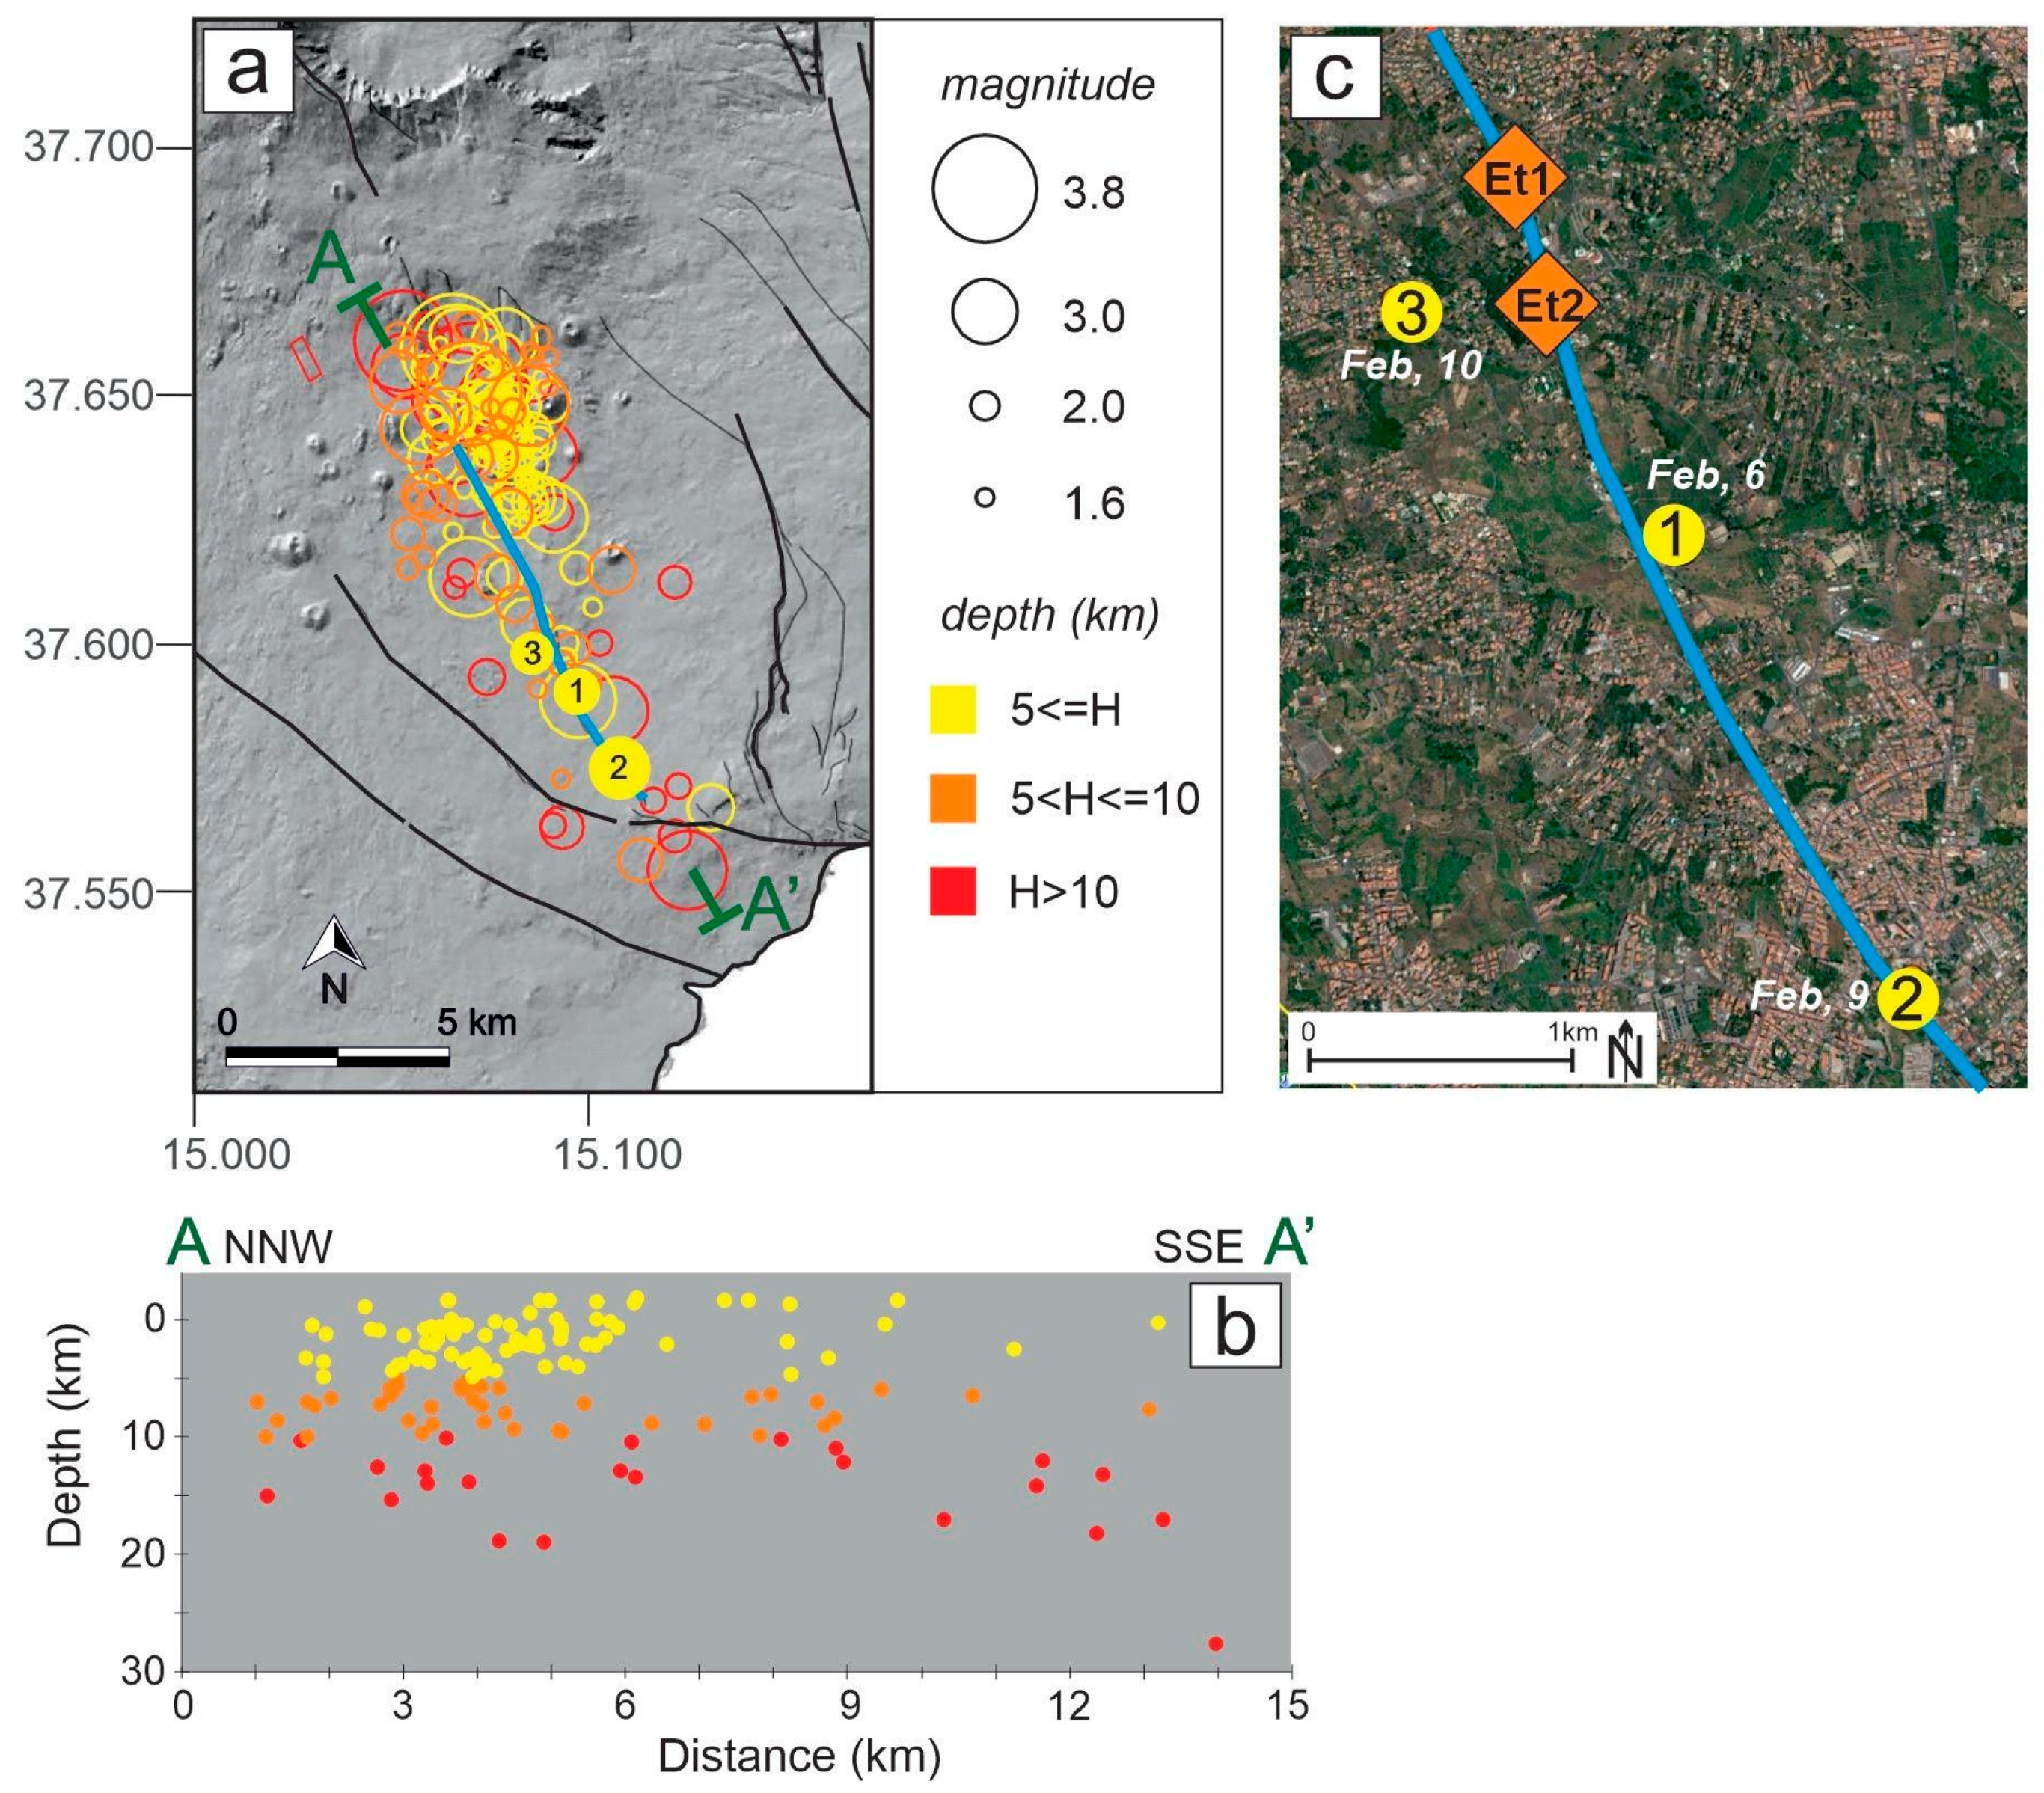
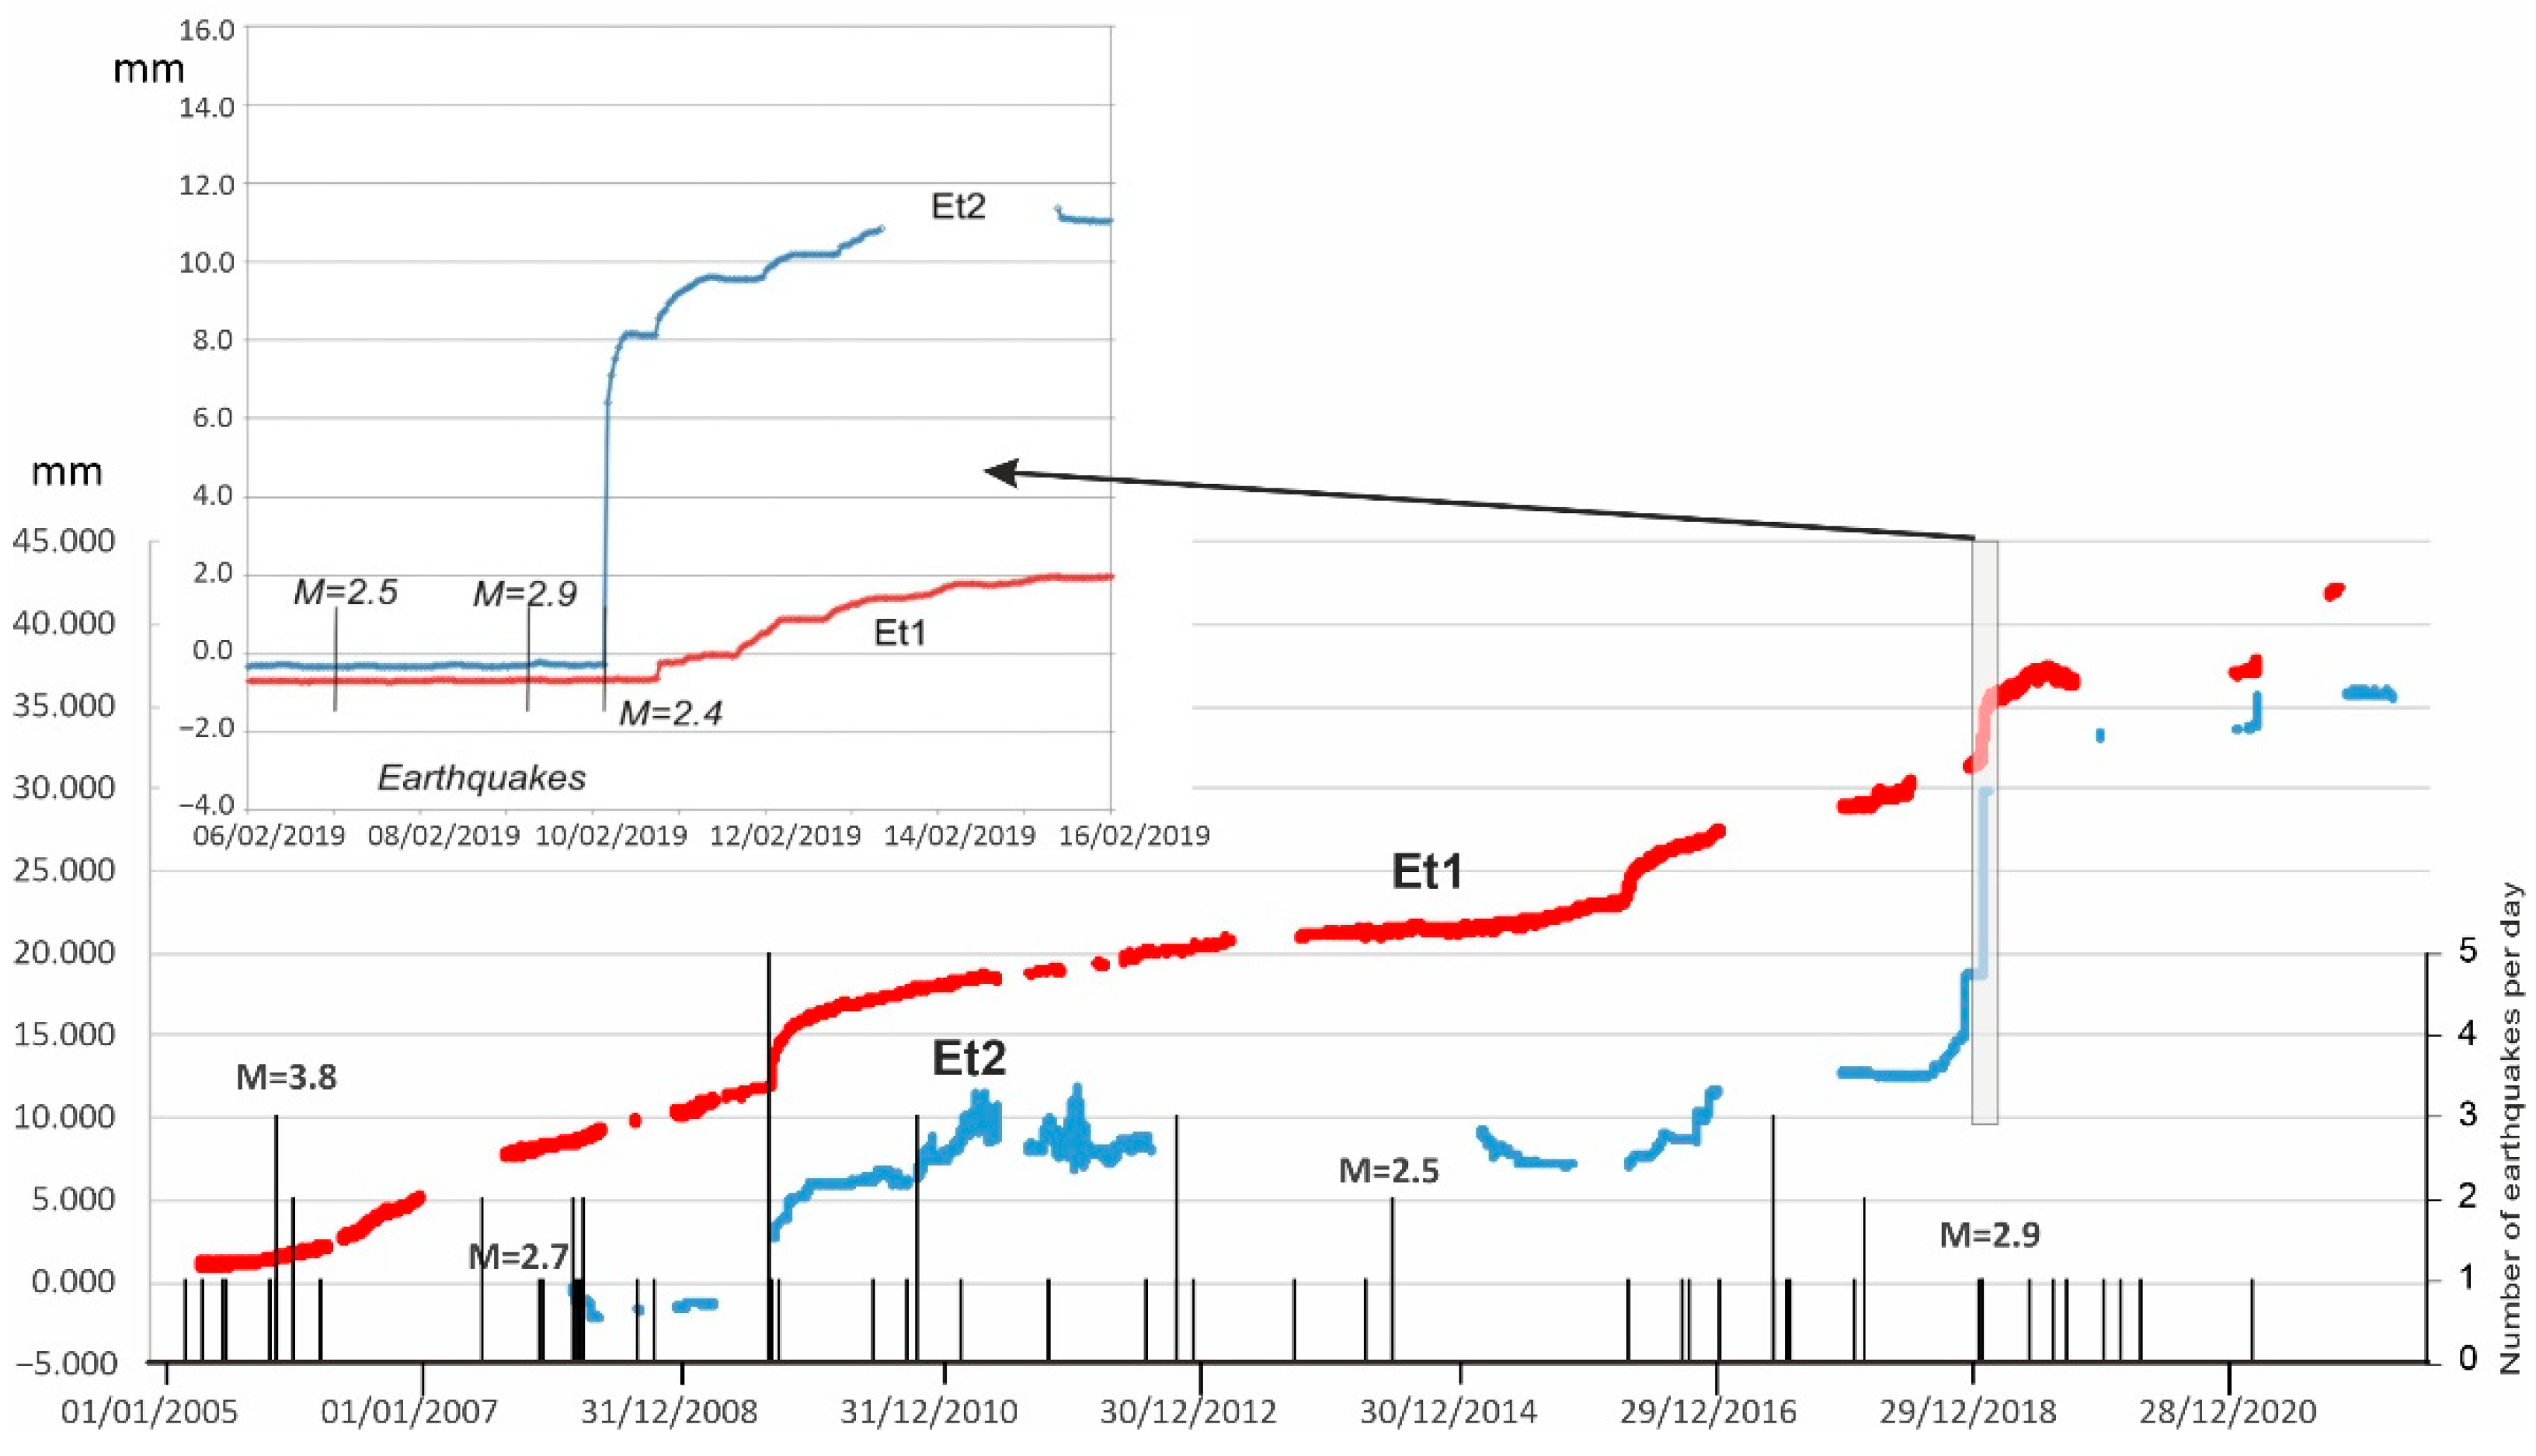
Seismic Data Integration: The February 2019 Seismicity
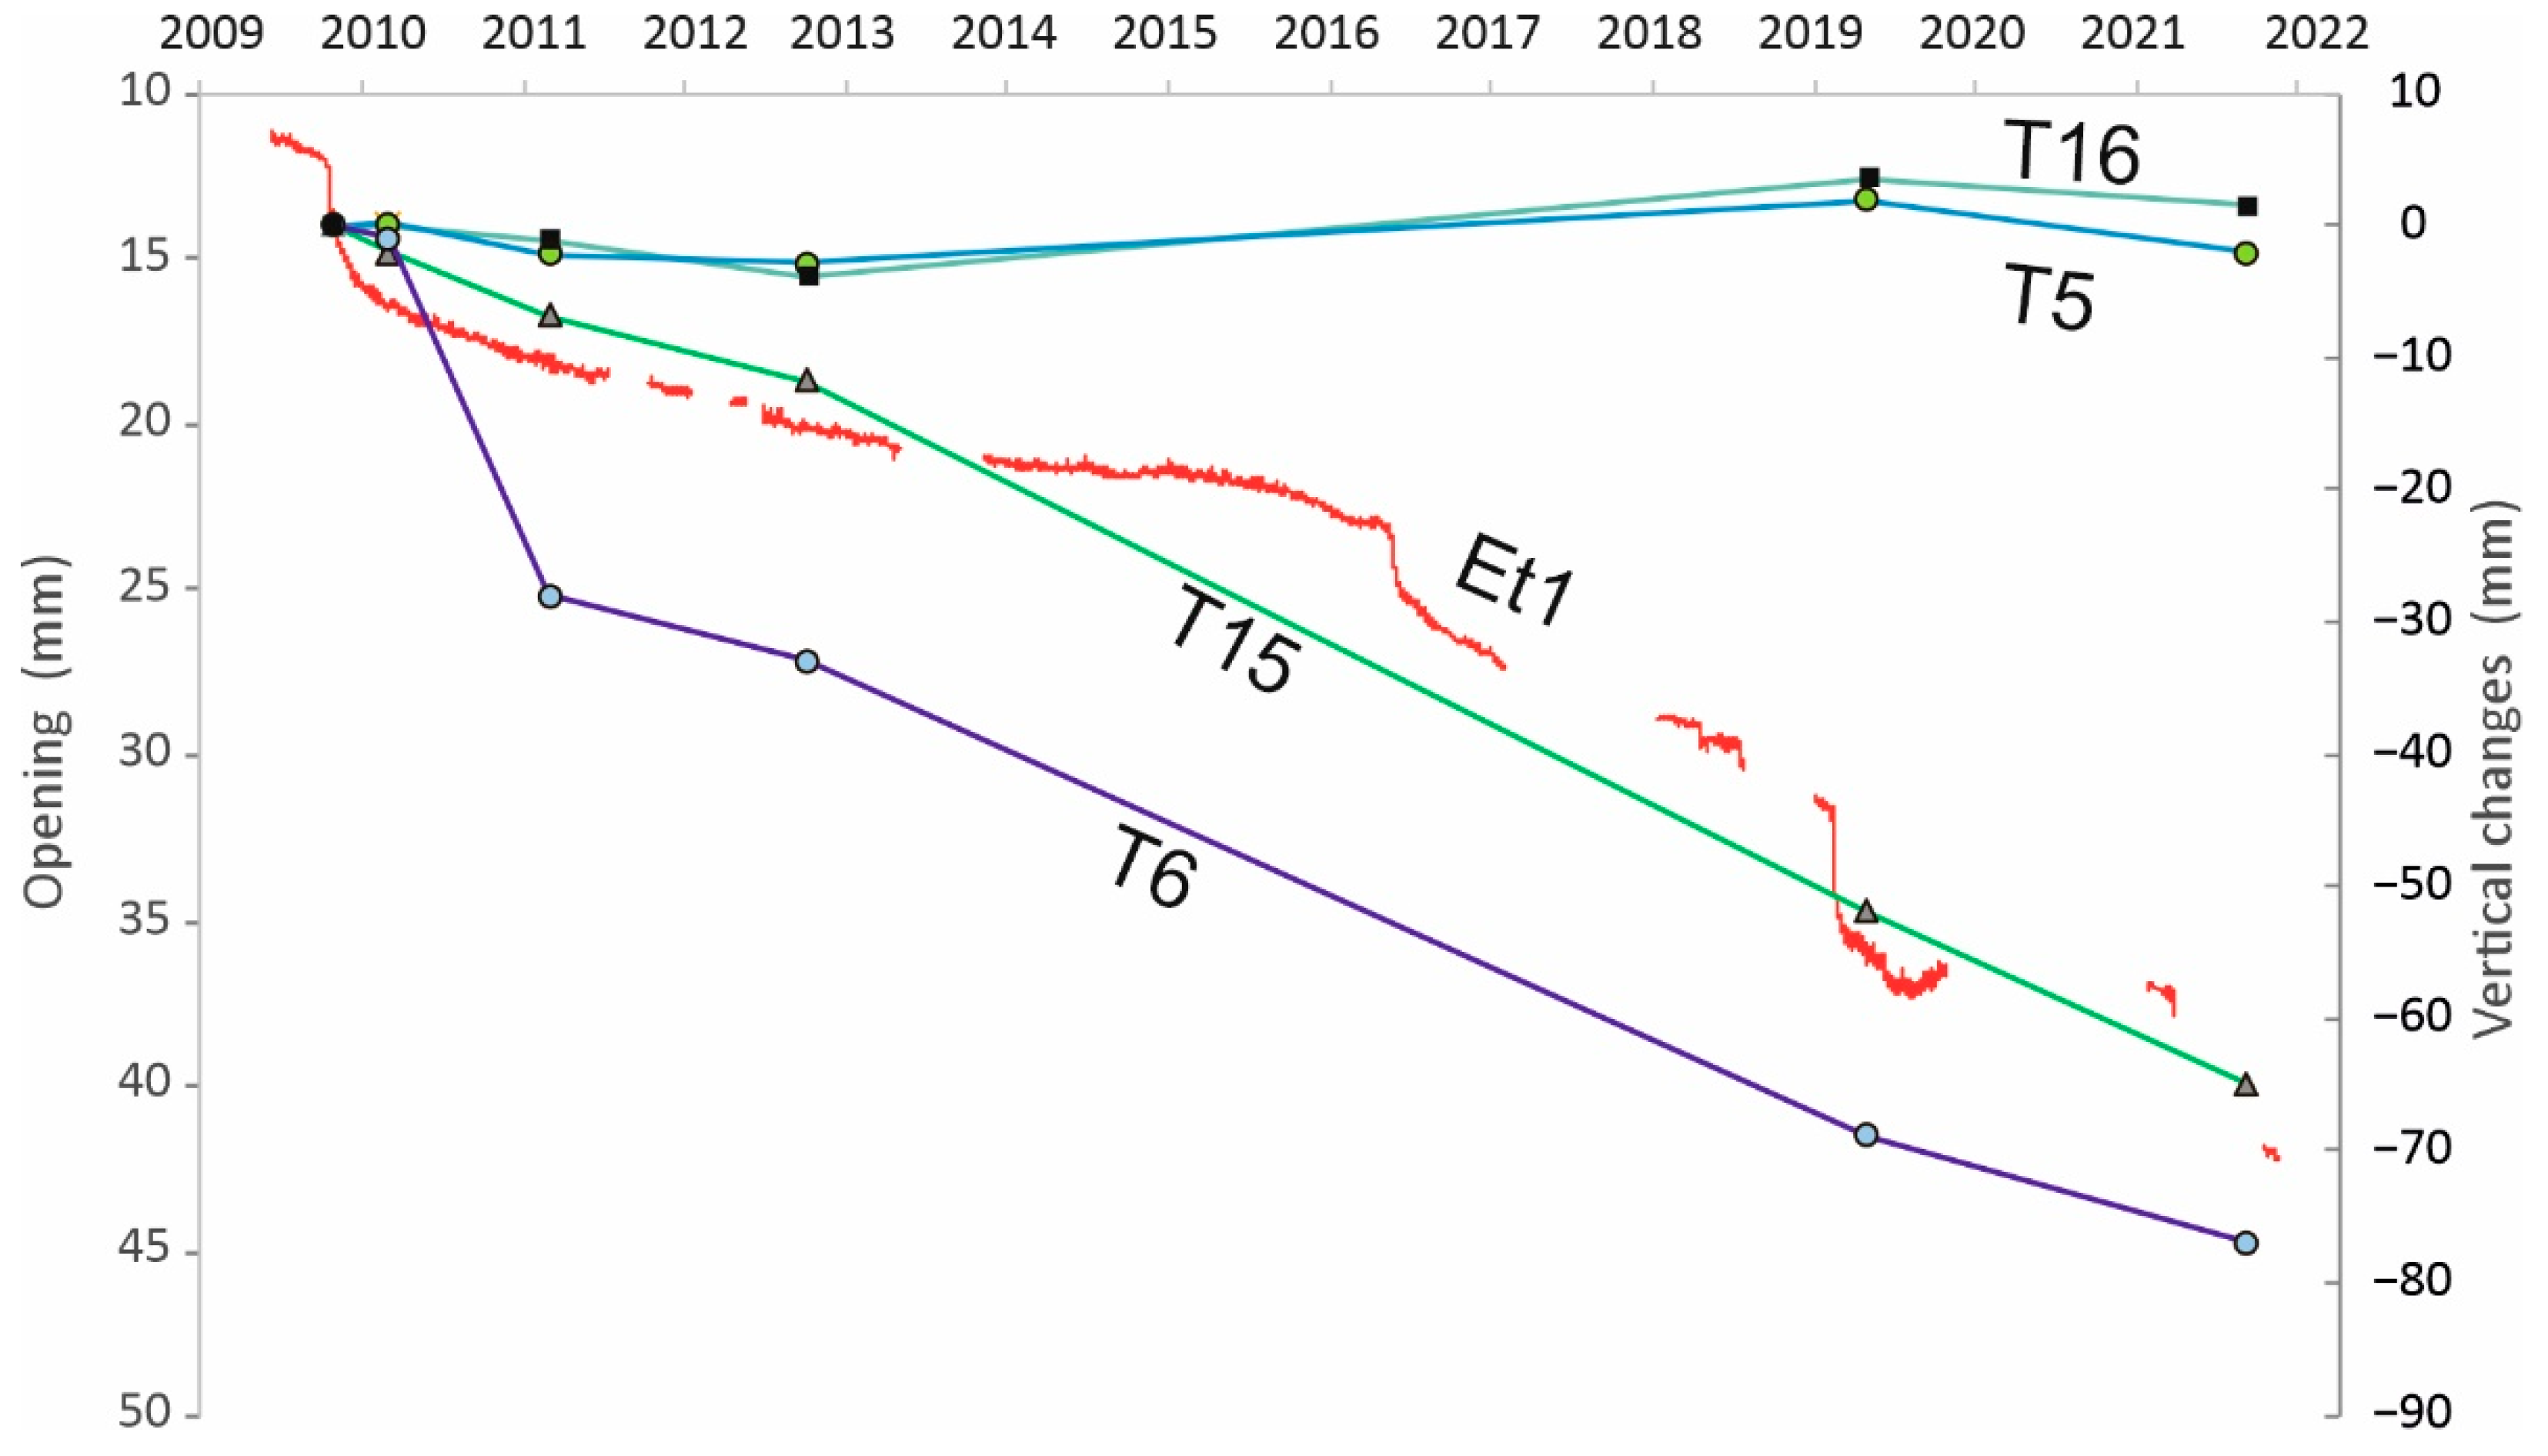
3.3. Extensometer Data
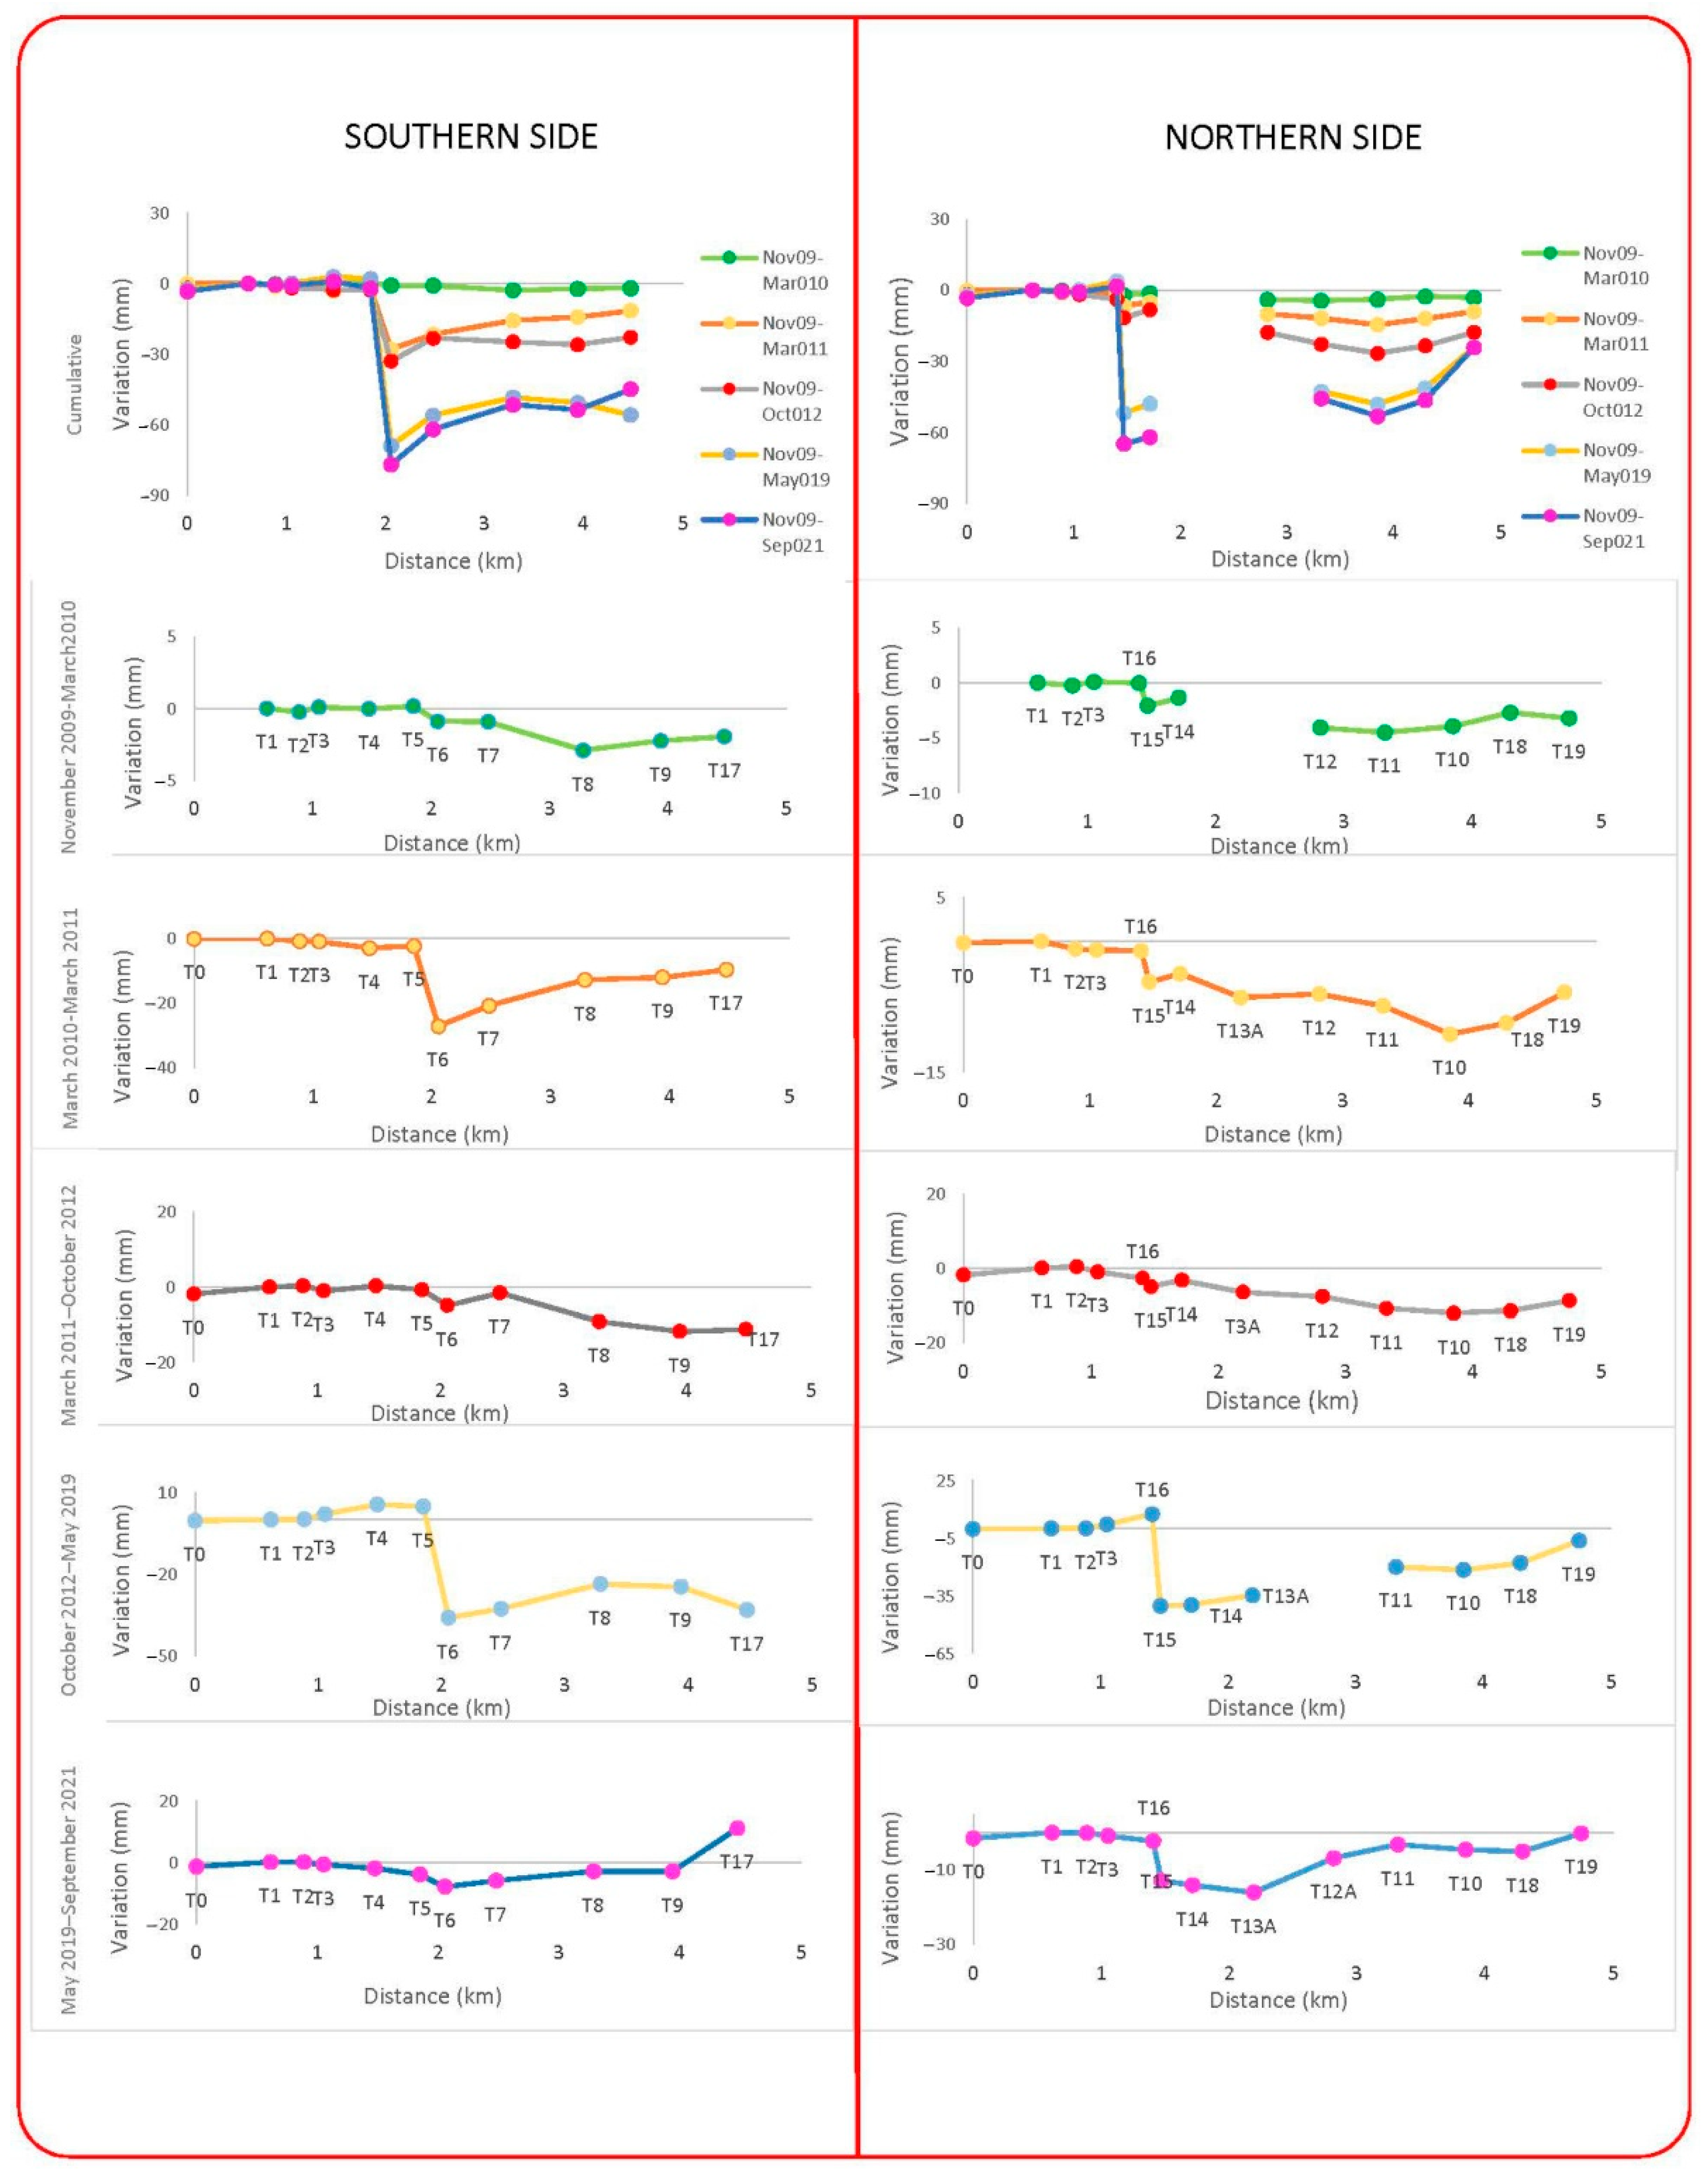
3.4. Levelling
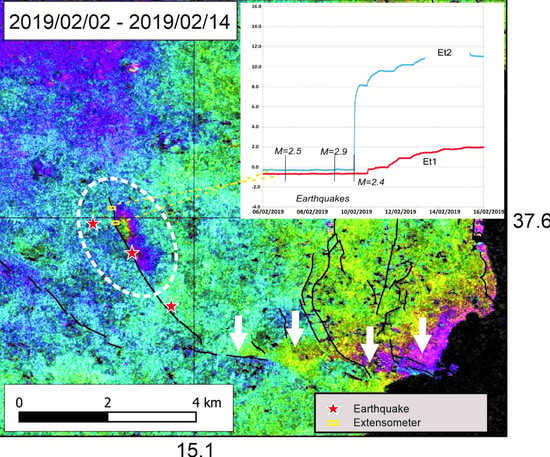
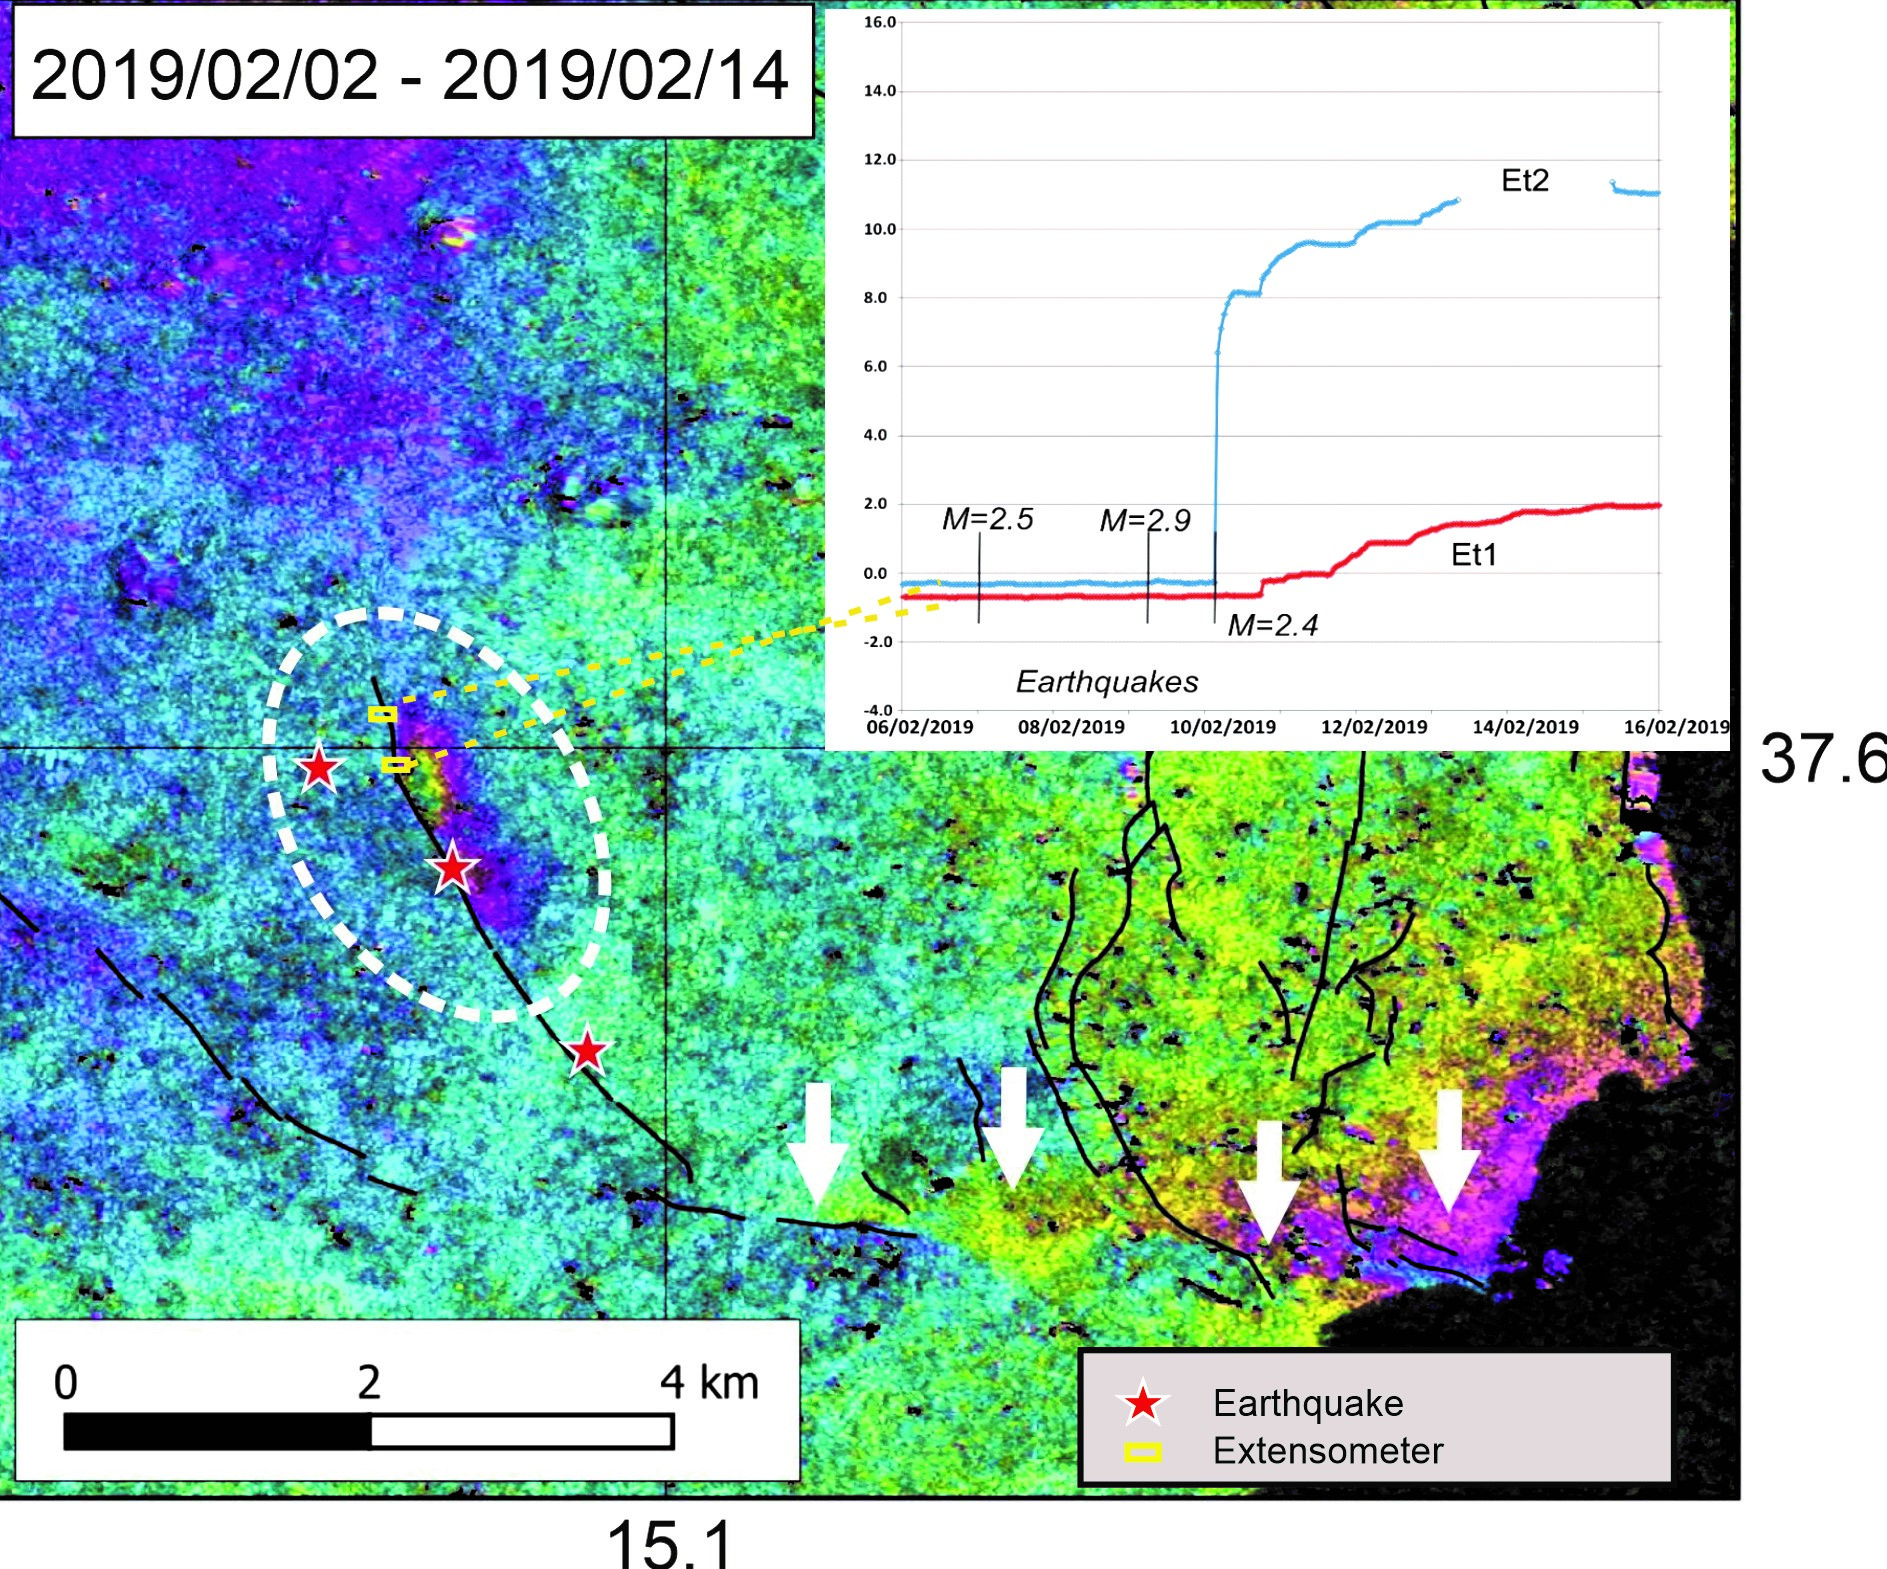
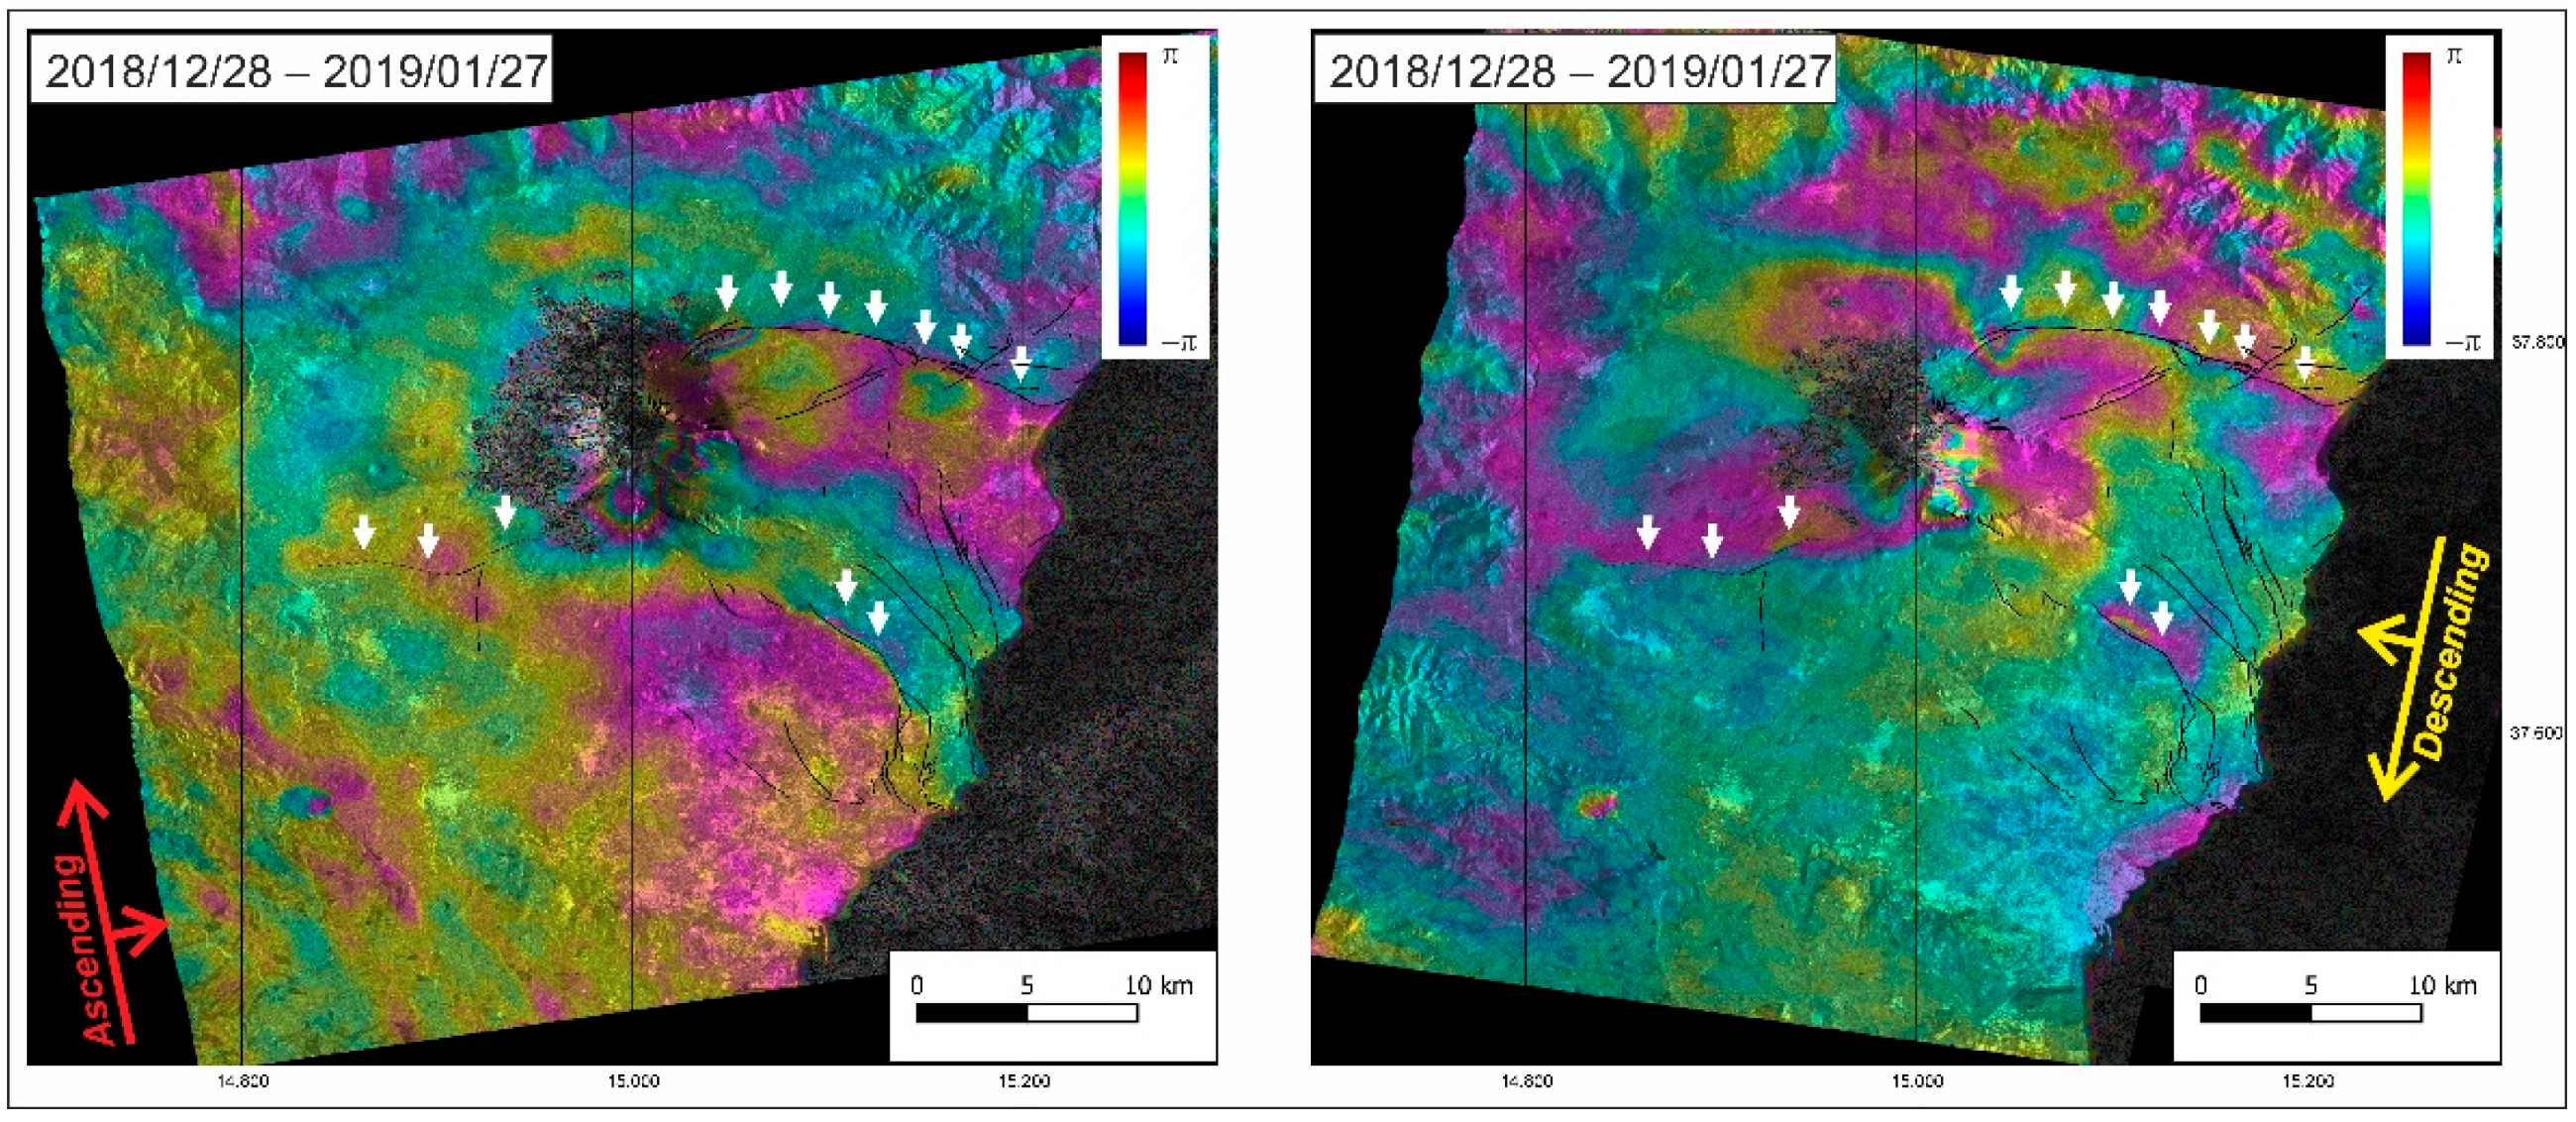
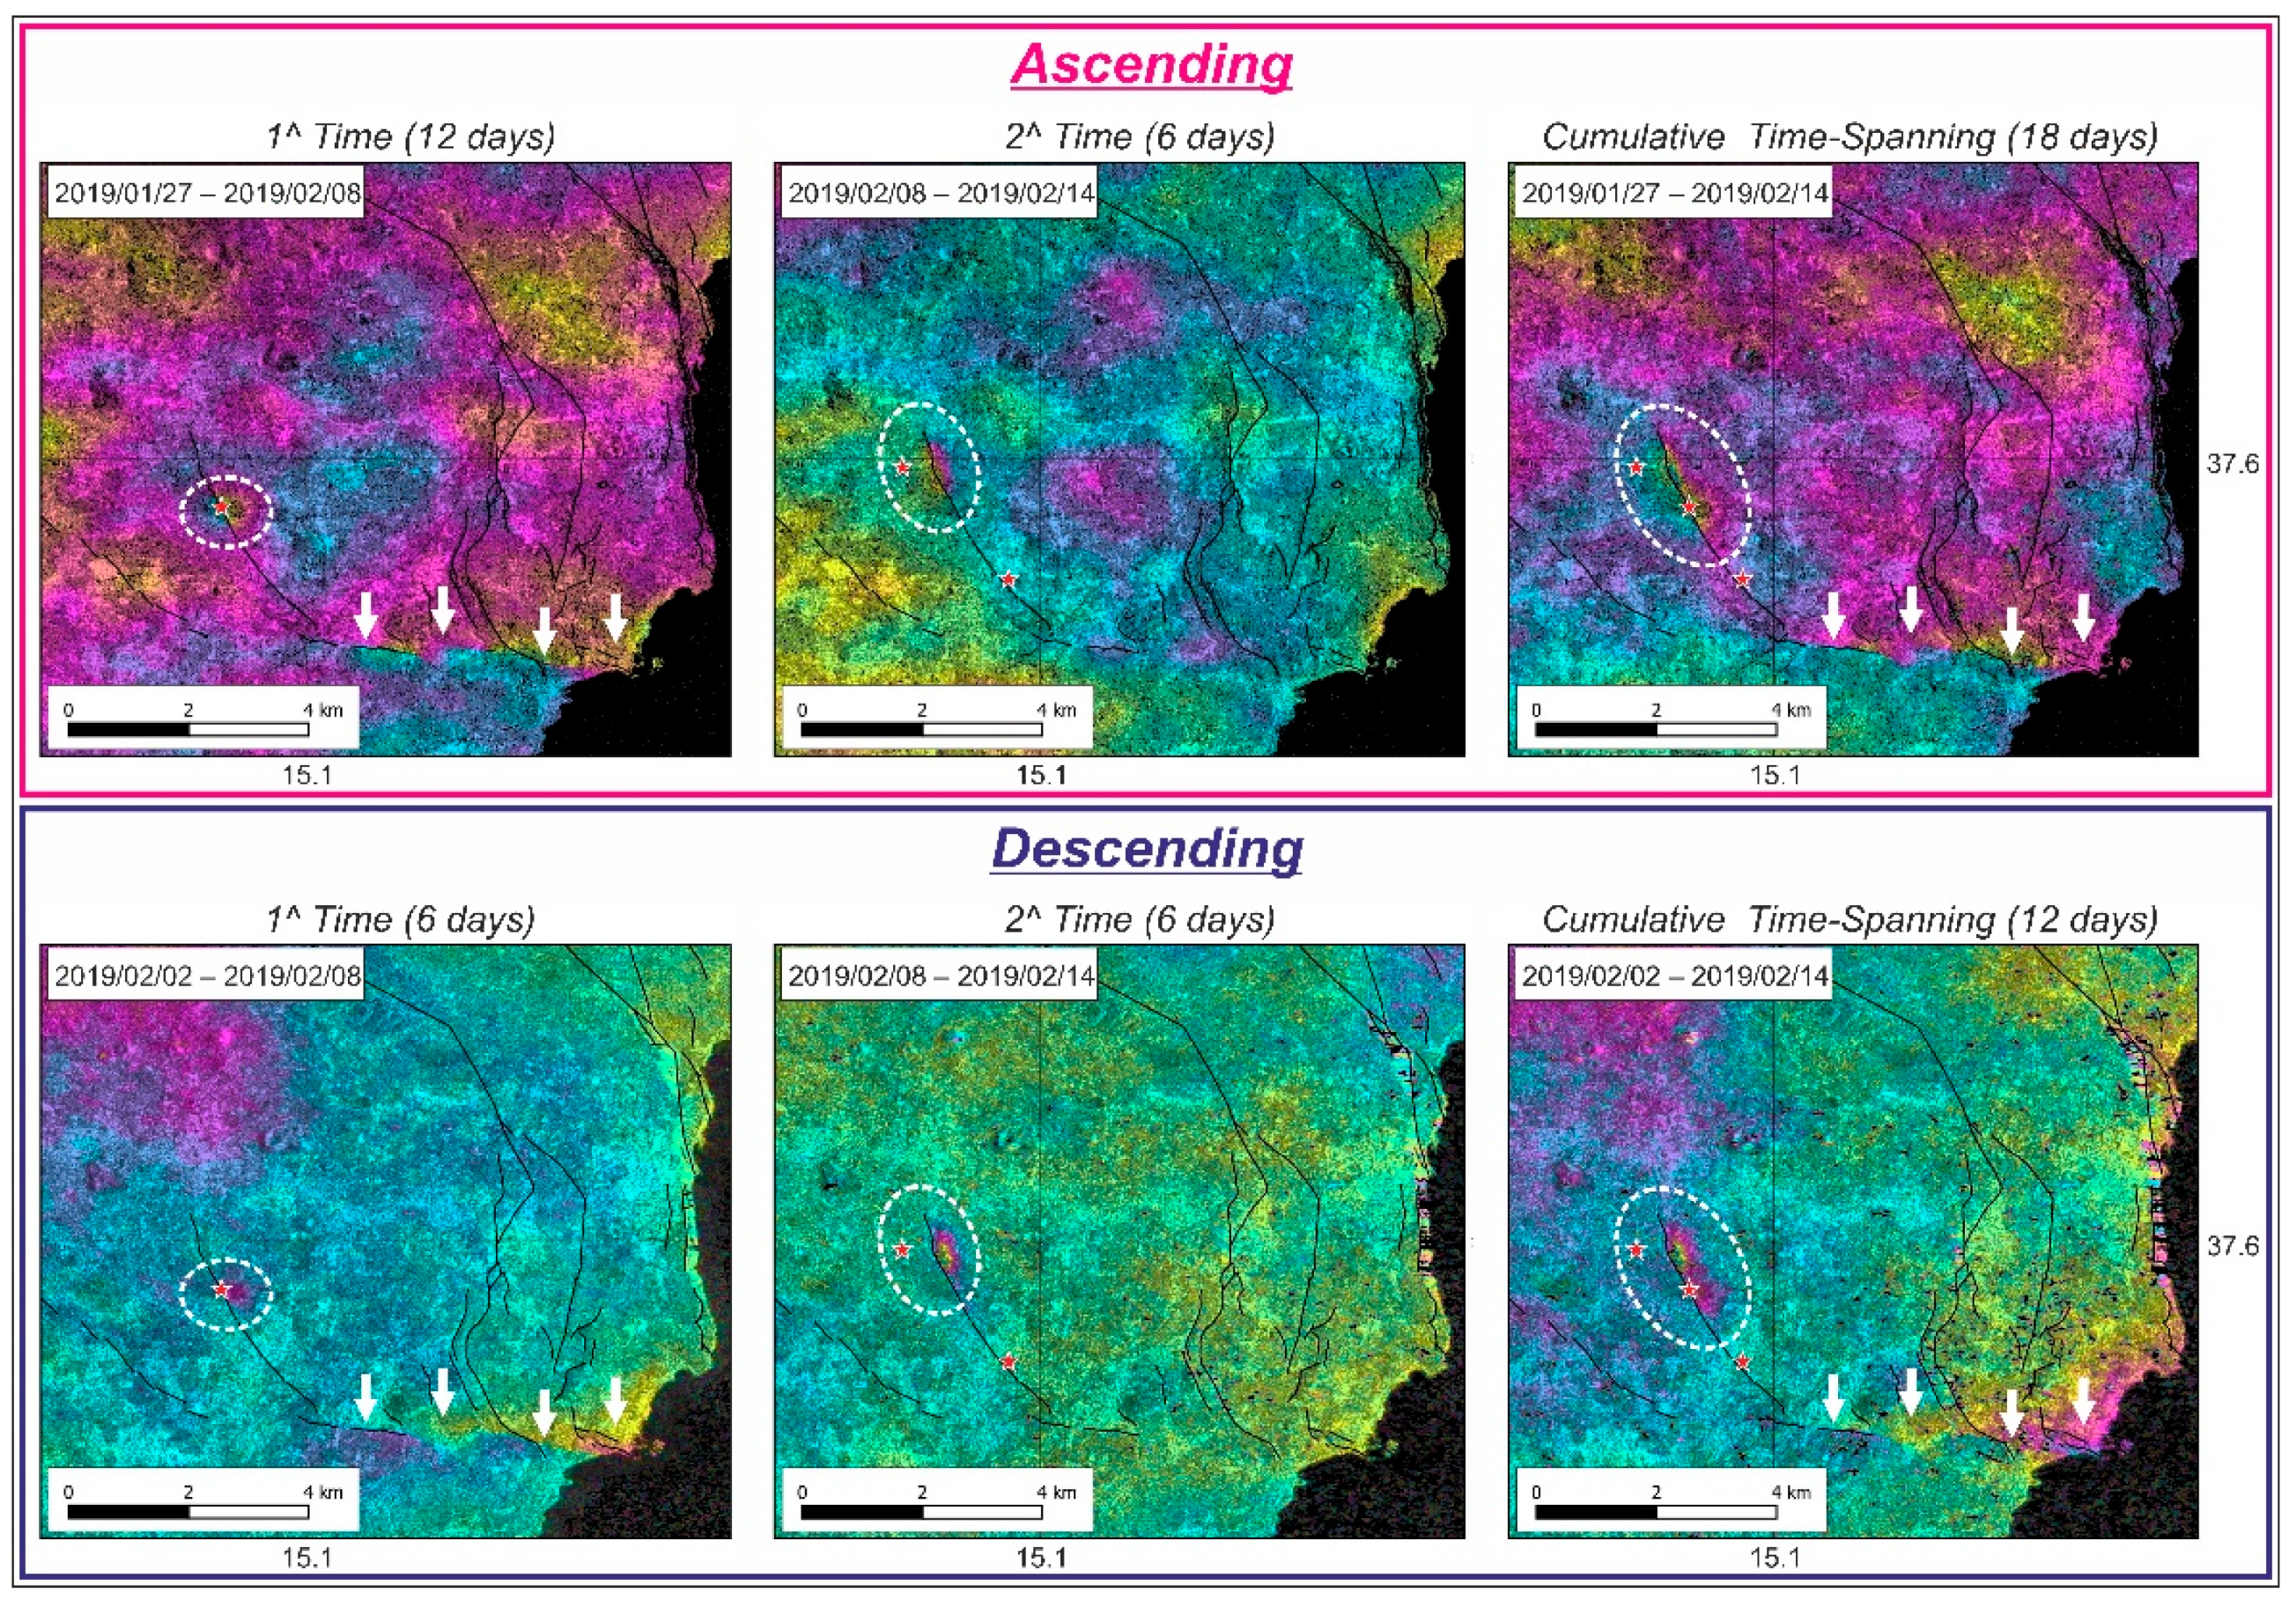
3.5. Most Recent Deformation Transient Detected by 2019 DInSAR Data
4. Discussion
5. Conclusions
Author Contributions
Funding
Institutional Review Board Statement
Informed Consent Statement
Data Availability Statement
Acknowledgments
Conflicts of Interest
References
- Bonaccorso, A.; Ferrucci, F.; Patanè, D.; Villari, L. Fast deformation processes and eruptive activity at Mount Etna (Italy). J. Geophys. Res. 1996, 101, 17467–17480. [Google Scholar] [CrossRef]
- Gresta, S.; Peruzza, L.; Slejko, D.; Distefano, G. Inferences on the main volcanotectonic structures at Mt Etna (Sicily) from a probabilistic seismological approach. J. Seismol. 1998, 2, 105–116. [Google Scholar] [CrossRef]
- De Guidi, G.; Barberi, G.; Barreca, G.; Bruno, V.; Cultrera, F.; Grassi, S.; Imposa, S.; Mattia, M.; Monaco, C.; Scarfì, L.; et al. Geological, seismological and geodetic evidence of active thrusting and folding south of Mt. Etna (eastern Sicily): Revaluation of “seismic efficiency” of the Sicilian Basal Thrust. J. Geodyn. 2015, 90, 32–41. [Google Scholar] [CrossRef]
- De Guidi, G.; Imposa, S.; Scudero, S.; Palano, M. New evidence for Late Quaternary deformation of the substratum of Mt. Etna volcano (Sicily, Italy): Clues indicate active crustal doming. Bull. Volcanol. 2014, 76, 1–13. [Google Scholar] [CrossRef]
- De Gori, P.; Giampiccolo, E.; Cocina, O.; Branca, S.; Doglioni, C.; Chiarabba, C. Re-pressurized magma at Mt. Etna, Italy, may feed eruptions for years. Commun. Earth Environ. 2021, 2, 1–9. [Google Scholar] [CrossRef]
- Patanè, D.; Di Grazia, G.; Cannata, A.; Montalto, P.; Boschi, E. Shallow magma pathway geometry at Mt. Etna volcano. Geochem. Geophys. 2008, 9, 2131. [Google Scholar] [CrossRef]
- Alparone, S.; Barberi, G.; Bonforte, A.; Maiolino, V.; Ursino, A. Evidence of multiple strain fields beneath the eastern flank of Mt. Etna volcano (Sicily, Italy) deduced from seismic and geodetic data during 2003–2004. Bull. Volc. 2011, 73, 869–885. [Google Scholar] [CrossRef]
- Bonforte, A.; Carnazzo, A.; Gambino, S.; Guglielmino, F.; Obrizzo, F.; Puglisi, G. A multidisciplinary study of an active fault crossing urban areas: The Trecastagni Fault at Mt. Etna (Italy). J. Volcanol. Geotherm. Res. 2013, 251, 41–49. [Google Scholar] [CrossRef]
- Poland, M.; Peltier, A.; Bonforte, A.; Puglisi, G. The spectrum of persistent volcanic flank instability; A review and proposed framework based on Kilauea, Piton de la Fournaise and Etna. J. Volcanol. Geotherm. Res. 2017, 339, 63–80. [Google Scholar] [CrossRef]
- Borgia, A.; Ferrari, L.; Pasquarè, G. Importance of gravitational spreading in the tectonic evolution of Mount Etna. Nature 1992, 357, 231–235. [Google Scholar] [CrossRef]
- Lo Giudice, E.; Rasà, R. Very shallow earthquakes and brittle deformation in active volcanic areas: The Etnean region as example. Tectonophysics 1992, 202, 257–268. [Google Scholar] [CrossRef]
- Monaco, C.; Tapponnier, P.; Tortorici, L.; Gillot, P.Y. Late Quaternary slip rates on the Acireale–Piedimonte normal faults and tectonic origin of Mt Etna (Sicily). Earth Planet. Sci. Lett. 1997, 147, 125–139. [Google Scholar] [CrossRef]
- Borgia, A.; Lanari, R.; Sansosti, E.; Tesauro, M.; Berardino, P.; Fornaro, G.; Neri, M.; Murray, J.B. Actively growing anticlines beneath Catania from the distal motion of Mount Etna’s decollement measured by SAR interferometry and GPS. Geophys. Res. Lett. 2000, 27, 3409–3412. [Google Scholar] [CrossRef]
- Neri, M.; Acocella, V.; Behncke, B. The role of the Pernicana Fault System in the spreading of Mount Etna (Italy) during the 2002–2003 eruption. Bull. Volcanol. 2004, 66, 417–430. [Google Scholar] [CrossRef]
- Walter, T.R.; Acocella, V.; Neri, M.; Amelung, F. Feedback processes between magmatic events and flank movement at Mount Etna (Italy) during the 2002–2003 eruption. J. Geophys. Res. 2005, 110, B10. [Google Scholar] [CrossRef]
- Rust, D.; Neri, M. The boundaries of large-scale collapse on the flanks of Mount Etna, Sicily. In Volcano Instability on the Earth and Other Planets (eds McGuire, W.J., Jones, A.P. & Neuberg, J.). J. Geol. Soc. 1996, 110, 193–208. [Google Scholar]
- Scudero, S.; De Guidi, G.; Imposa, S.; Currenti, G. Modelling the long-term deformation of the sedimentary substrate of Mt. Etna volcano (Italy). Terra Nova 2015, 27, 338–345. [Google Scholar] [CrossRef]
- Allard, P.; Behncke, B.; D’Amico, S.; Neri, M.; Gambino, S. Mount Etna 1993–2005: Anatomy of an evolving eruptive cycle. Earth Sci. Rev. 2006, 78, 85–114. [Google Scholar] [CrossRef]
- Bonforte, A.; Bonaccorso, A.; Guglielmino, F.; Palano, M.; Puglisi, G. Feeding system and magma storage beneath Mt. Etna as revealed by recent inflation/deflation cycles. J. Geophys. Res. 2008, 113, 5334. [Google Scholar] [CrossRef]
- Bonforte, A.; Gambino, S.; Guglielmino, F.; Obrizzo, F.; Palano, M.; Puglisi, G. Ground deformation modelling of flank dynamics prior to the 2002 eruption of Mt. Etna. Bull. Volcanol. 2007, 69, 757–768. [Google Scholar] [CrossRef]
- Rasà, R.; Romano, R.; Lo Giudice, E. Morphotectonic map of Mt. Etna. Carta scala 1:100.000. Mem. Soc. Geol. It. 1982, 23, 8288. [Google Scholar]
- Azzaro, R.; Lo Giudice, E.; Rasà, R. Il terremoto di Piano Pernicana (Etna Nord) del 28-10-1988. Campo macrosismico e quadro deformativo fragile associato all’evento. Boll. GNV 1988, 5, 22–24. [Google Scholar]
- Acocella, V.; Neri, M. Structural features of an active strike–slip fault on the sliding flank of Mt. Etna (Italy). J. Struct. Geol. 2005, 27, 343–355. [Google Scholar] [CrossRef]
- Alparone, S.; Cocina, O.; Ferrari, F.; Gambino, S.; Mostaccio, A.; Spampinato, S.; Tuvè, T.; Ursino, A. Seismological features of the Pernicana—Provenzana Fault System (Mt. Etna, Italy) and implications for the dynamics of the northeastern flank of the volcano. J. Volcanol. Geotherm. Res. 2013, 251, 16–26. [Google Scholar] [CrossRef]
- Cannata, A.; Iozzia, A.; Alparone, S.; Bonforte, A.; Cannavò, F.; Cesca, S.; Gresta, S.; Rivalta, E.; Ursino, A. Repeating earthquakes and ground deformation reveal the structure and triggering mechanisms of the Pernicana fault, Mt. Etna. Commun. Earth. Environ. 2021, 2, 116. [Google Scholar] [CrossRef]
- Neri, M.; Guglielmino, F.; Rust, D. Flank instability on Mount Etna: Radon, radar interferometry, and geodetic data from the southwestern boundary of the unstable sector. J. Geophys. Res. 2007, 112, 4756. [Google Scholar] [CrossRef]
- Froger, J.L.; Merle, O.; Briole, P. Active spreading and regional extension at Mount Etna imaged by SAR interferometry. Earth Planet Sci. Lett. 2001, 187, 245–258. [Google Scholar] [CrossRef]
- Bonforte, A.; Guglielmino, F.; Coltelli, M.; Ferretti, A.; Puglisi, G. Structural assessment of Mt. Etna volcano from Permanent Scatterers analysis. Geochem. Geophys. Geosystems 2011, 12, 3213. [Google Scholar] [CrossRef]
- Neri, M.; Casu, F.; Acocella, V.; Solaro, G.; Pepe, S.; Berardino, P.; Sansosti, E.; Caltabiano, T.; Lundgren, P.; Lanari, R. Deformation and eruptions at Mt. Etna (Italy): A lesson from 15 years of observations. Geophys. Res. Lett. 2009, 36, 151. [Google Scholar] [CrossRef]
- Solaro, G.; Acocella, V.; Pepe, S.; Ruch, J.; Neri, M.; Sansosti, E. Anatomy of an unstable volcano from InSAR: Multiple processes affecting flank instability at Mt. Etna, 1994–2008. J. Geophys. Res. 2010, 115, B10405. [Google Scholar] [CrossRef]
- Gambino, S.; Bonforte, A.; Carnazzo, A.; Falzone, G.; Ferrari, F.; Ferro, A.; Guglielmino, F.; Laudani, G.; Maiolino, V.; Puglisi, G. Displacement across the Trecastagni Fault (Mt. Etna) and induced seismicity: The October 2009–January 2010 episode. Ann. Geophys. 2011, 54, 414–423. [Google Scholar]
- Urlaub, M.; Geersen, J.; Petersen, F.; Gross, F.; Bonforte, A.; Krastel, S.; Kopp, H. The Submarine Boundaries of Mount Etna’s Unstable Southeastern Flank. Front. Earth Sci. 2022, 10, 810790. [Google Scholar] [CrossRef]
- Urlaub, M.; Petersen, F.; Gross, F.; Bonforte, A.; Puglisi, G.; Guglielmino, F.; Krastel, S.; Lange, D.; Kopp, H. Gravitational collapse of Mount Etna’s southeastern flank. Sci. Adv. 2018, 4, eaat9700. [Google Scholar] [CrossRef]
- Barreca, G.; Bonforte, A.; Neri, M. A pilot GIS database of active faults of Mt. Etna (Sicily): A tool for integrated hazard evaluation. J. Volcanol. Geotherm. Res. 2013, 251, 170–186. [Google Scholar] [CrossRef]
- Azzaro, R.; Bonforte, A.; D’Amico, S.; Guglielmino, F.; Scarfì, L. Stick-slip vs. stable sliding fault behaviour: A case-study using a multidisciplinary approach in the volcanic region of Mt. Etna (Italy). Tectonophysics 2020, 790, 228554. [Google Scholar] [CrossRef]
- Alparone, S.; Barberi, G.; Giampiccolo, E.; Maiolino, V.; Mostaccio, A.; Musumeci, C.; Scaltrito, A.; Scarfì, L.; Tuvè, T.; Ursino, A. Seismological constraints on the 2018 Mt. Etna (Italy) flank eruption and implications for the flank dynamics of the volcano. Terra Nova 2020, 32, 334–344. [Google Scholar] [CrossRef]
- Cosentino, M.; Lombardo, G.; Patane, G.; Schick, G.; Sharp, A.L. Seismological researches on Mount Etna: State of art and recent trends. Mem. Soc. Geol. It. 1982, 23, 159–202. [Google Scholar]
- Gresta, S.; Patanè, G. Review of seismological studies at Mount Etna. Pure Appl. Geophys. 1987, 125, 951–970. [Google Scholar] [CrossRef]
- Patanè, D.; Cocina, O.; Falsaperla, S.; Privitera, E.; Spampinato, S. Mt Etna Volcano: A Seismological Framework. In Etna Volcano Laboratory; Bonaccorso, A., Calvari, S., Coltelli, M., Del Negro, C., Falsaperla, S., Eds.; AGU BOOK (Geophysical Monograph Series); Wiley: Washington, DC, USA, 2004; Volume 4, pp. 147–165. [Google Scholar] [CrossRef]
- Carnazzo, A.; Ferro, A.; Falzone, G.; Gambino, S.; Laudani, G. La Rete Estensimetrica della Faglia di Trecastagni; INGV Rapporto Tecnico no. 56; INGV Publication: Rome, Italy, 2006. [Google Scholar]
- Aiesi, G.; Bonforte, A.; Brandi, G.; Calvagna, F.; Consoli, S.; Distefano, G.; Falzone, G.; Ferro, A.; Gambino, S.; Guglielmino, F.; et al. Dynamics of the Boundaries of the Mt. Etna Sliding Flanks: The Multidisciplinary Study of the Pernicana and Trecastagni Faults. Abstract Conferenza, A. Rittmann. 2020. Available online: https://www.conferenzarittmann.it/images/2020/Miscellanea_52.pdf (accessed on 20 July 2022).
- Obrizzo, F.; Pingue, F.; Troise, C.; De Natale, G. Bayesian inversion of 1994–1998 vertical displacements at Mt Etna: Evidence for magma intrusion. Geophys. J. Int. 2004, 157, 935–946. [Google Scholar] [CrossRef]
- Obrizzo, F.; Pingue, F.; Troise, C.; De Natale, G. Coseismic displacements and creeping along the Pernicana fault (Etna, Italy) in the last 17 years: A detailed study of a tectonic structure on a volcano. J. Volcanol. Geotherm. Res. 2001, 109, 109–131. [Google Scholar] [CrossRef]
- Italiana Commissione Geodetica. Guida alla progettazione e all’esecuzione delle livellazioni geometriche. Boll. Geod. Sci. Aff. 1975, 34, 1. [Google Scholar]
- Bomford, G. Geodesy; Oxford University Press: New York, NY, USA, 1971. [Google Scholar]
- Wegmüller, U.; Werner, C.; Strozzi, T.; Wiesmann, A.; Frey, O.; Santoro, M. Sentinel-1 IWS mode support in the GAMMA software. In Proceedings of the 2015 IEEE 5th Asia-Pacific Conference on Synthetic Aperture Radar (APSAR), Singapore, 1–4 September 2015; Volume 4, pp. 431–436. [Google Scholar] [CrossRef]
- Jarvis, A.; Reuter, H.I.; Nelson, A.; Guevara, E. Hole-filled SRTM for the globe Version 4, available from the CGIAR-CSI SRTM 90m Database. 2008. Available online: https://srtm.csi.cgiar.org/ (accessed on 20 July 2022).
- Park, C.B.; Miller, R.D.; Xia, J. Multichannel analysis of surface waves. Geophysics 1999, 64, 800–808. [Google Scholar] [CrossRef]
- Nogoshi, M.; Igarashi, T. On the propagation characteristics estimations of subsurface using microtremors on the ground suface. J. Seismol. Soc. Jpn. 1970, 23, 264–280. [Google Scholar]
- Nakamura, Y. A method for dynamic characteristics estimation of subsurface using microtremor on the ground surface. QR Railway Tech. Res. Inst. 1989, 30, 25–33. [Google Scholar]
- Okada, H.; Suto, K. The Microtremor Survey Method; Society of Exploration Geophysicists: Houston, TX, USA, 2003. [Google Scholar]
- Yamanaka, H.; Takemura, M.; Ishida, H.; Niwa, M. Characteristics of long-period microtremors and their applicability in exploration of deep sedimentary layers. Bull. Seismol. Soc. Am. 1994, 84, 1831–1841. [Google Scholar] [CrossRef]
- Parolai, S.; Bormann, P.; Milkereit, C. New relationships between Vs, thickness of sediments and resonance frequency calculated from H/V ratio of seismic noise for the Cologne area. Bull. Seismol. Soc. Am. 2002, 92, 2521–2527. [Google Scholar] [CrossRef]
- Imposa, S.; Coco, G.; Corrao, M. Site effects close to structural lineaments in eastern Sicily (Italy). Eng. Geol. 2004, 72, 331–341. [Google Scholar] [CrossRef]
- Castellaro, S.; Mulargia, F.; Bianconi, L. Passive Seismic Stratigraphy: A new efficient, fast and economic technique. J. Geotech. Environ. Geol. 2005, 3, 51–77. [Google Scholar]
- Martorana, R.; Agate, M.; Capizzi, P.; Cavera, F.; D’Alessandro, A. Seismostratigraphic model of “La Bandita”area in the Palermo Plain (Sicily, Italy) through HVSR inversion constrained by stratigraphic data. Ital. J. Geosci. 2018, 137, 73–86. [Google Scholar] [CrossRef]
- Imposa, S.; Grassi, S.; Fazio, F.; Rannisi, G.; Cino, P. Geophysical surveys to study a landslide body (North-Eastern Sicily). Nat. Hazards 2017, 86, 327–343. [Google Scholar] [CrossRef]
- Imposa, S.; Panzera, F.; Grassi, S.; Lombardo, G.; Catalano, S.; Romagnoli, G.; Tortorici, G. Geophysical and geologic surveys of the areas struck by the August 26th 2016 Central Italy earthquake: The study case of Pretare and Piedilama. J. Appl. Geophys. 2017, 145, 17–27. [Google Scholar] [CrossRef]
- Imposa, S.; Grassi, S.; De Guidi, G.; Battaglia, F.; Lanaia, G.; Scudero, S. 3D subsoil model of the San Biagio ‘Salinelle’ mud volcanoes (Belpasso, SICILY) derived from geophysical surveys. Surv. Geophys. 2016, 37, 1117–1138. [Google Scholar] [CrossRef]
- Imposa, S.; Motta, E.; Capilleri, P.; Imposa, G. HVSR and MASW seismic survey for characterizing the local seismic response: A case study in Catania area (Italy). In Proceedings of the 1st IMEKO TC-4 International Workshop on Metrology for Geotechnics, Benevento, Italy, 17–18 March 2016. [Google Scholar]
- Pappalardo, G.; Mineo, S.; Imposa, S.; Grassi, S.; Leotta, A.; La Rosa, F.; Salerno, D. A quick combined approach for the characterization of a cliff during a post-rockfall emergency. Landslides 2020, 17, 1063–1081. [Google Scholar] [CrossRef]
- Pappalardo, G.; Imposa, S.; Barbano, M.S.; Grassi, S.; Mineo, S. Study of landslides at the archaeological site of Abakainon necropolis (NE Sicily) by geomorphological and geophysical investigations. Landslides 2018, 15, 1279–1297. [Google Scholar] [CrossRef]
- Grassi, S.; De Guidi, G.; Patti, G.; Brighenti, F.; Carnemolla, F.; Imposa, S. 3D subsoil reconstruction of a mud volcano in central Sicily by means of geophysical surveys. Acta Geophys. 2022, 2, 00774. [Google Scholar] [CrossRef]
- Grassi, S.; Patti, G.; Tiralongo, P.; Imposa, S.; Aprile, D. Applied geophysics to support the cultural heritage safeguard: A quick and non-invasive method to evaluate the dynamic response of a great historical interest building. J. Appl. Geophys. 2021, 189, 104321. [Google Scholar] [CrossRef]
- Grassi, S.; Imposa, S.; Patti, G.; Boso, D.; Lombardo, G.; Panzera, F. Geophysical surveys for the dynamic characterization of a cultural heritage building and its subsoil: The S. Michele Arcangelo Church (Acireale, eastern Sicily). J. Cult. Herit. 2019, 36, 72–84. [Google Scholar] [CrossRef]
- Ibs-von Seht, M.; Wohlenberg, J. Microtremor measurements used to map thickness of soft sediments. Bull. Seismol. Soc. Am. 1999, 89, 250–259. [Google Scholar] [CrossRef]
- Branca, S.; Coltelli, M.; Groppelli, G.; Lentini, F. Geological map of Etna volcano, 1:50,000 scale. Ital. J. Geosci. 2011, 130, 265–291. [Google Scholar] [CrossRef]
- Azzaro, R. Earthquake Surface Faulting at Mount Etna Volcano (Sicily) And Implications for Active Tectonics. J. Geodyn. 1999, 28, 193–213. [Google Scholar] [CrossRef]
- Azzaro, R.; D’Amico, S. Catalogo Macrosismico dei Terremoti Etnei dal 1832 al 2005; INGV-CT; INGV Publication: Rome, Italy, 2008. [Google Scholar]
- Distefano, G.; Di Grazia, G. Database Localizzazioni Ipocentrali Terremoti Etna dal 1977 al 2001; Progetto DPC-INGV; INGV Publication: Rome, Italy, 2005; Volume 3, pp. 2004–2006. [Google Scholar]
- Alparone, S.; Maiolino, V.; Mostaccio, A.; Scaltrito, A.; Ursino, A.; Barberi, G.; D’Amico, S.; Di Grazia, G.; Giampiccolo, E.; Musumeci, C.; et al. Instrumental seismic catalogue of Mt. Etna earthquakes (Sicily, Italy): Ten years (2000–2010) of instrumental recordings. Ann. Geophys. 2015, 58, 6591. [Google Scholar] [CrossRef]
- Alparone, S.C.; Barberi, G.; Di Grazia, G.; Giampiccolo, E.; Maiolino, V.; Mostaccio, A.; Musumeci, C.; Scaltrito, A.; Ursino, A. Mt. Etna Seismic Catalog 2011–2013 (Version 1) [Data Set]; INGV Publication: Rome, Italy, 2020. [Google Scholar] [CrossRef]
- Alparone, S.C.; Barberi, G.; Di Grazia, G.; Giampiccolo, E.; Maiolino, V.; Mostaccio, A.; Musumeci, C.; Scaltrito, A.; Tuvè, T.; Ursino, A. Mt. Etna Seismic Catalog 2014–2016 (Version 1) [Data Set]; INGV Publication: Rome, Italy, 2020. [Google Scholar] [CrossRef]
- Alparone, S.C.; Barberi, G.; Di Grazia, G.; Ferrari, F.; Giampiccolo, E.; Maiolino, V.; Mostaccio, A.; Musumeci, C.; Scaltrito, A.; Tuvè, T.; et al. Mt. Etna Revised and Concise Seismic Catalog from 1999 (EtnaRCSC) [Data Set]; INGV Publication: Rome, Italy, 2020. [Google Scholar] [CrossRef]
- Alparone, S.; Barberi, G.; Di Grazia, G.; Giampiccolo, E.; Maiolino, V.; Mostaccio, A.; Musumeci, C.; Scaltrito, A.; Tuvè, T.; Ursino, A. Mt. Etna Seismic Catalog 2017–2019 (EtnaSC_2017_2019) (Version 1) [Data Set]; INGV Publication: Rome, Italy, 2022. [Google Scholar] [CrossRef]
- Barberi, G.; Di Grazia, G.; Ferrari, F.; Giampiccolo, E.; Maiolino, V.; Mostaccio, A.; Musumeci, C.; Scaltrito, A.; Sciotto, M.; Tusa, G.; et al. Mt. Etna Revised Seismic Catalog from 2020 (EtnaRSC2020) (Version 1) [Data Set]; INGV Publication: Rome, Italy, 2020. [Google Scholar] [CrossRef]
- Rydelek, P.A.; Sacks, I.S. Testing the completeness of earthquake catalogues and the hypothesis of self-similarity. Nature 1989, 337, 251–253. [Google Scholar] [CrossRef]
- Wiemer, S.; Wyss, M. Minimum magnitude of completeness in earthquake catalogues: Examples from Alaska, the Western United States, and Japan. Bull. Seismol. Soc. Am. 2000, 90, 859–869. [Google Scholar] [CrossRef]
- Wiemer, S.A. Software package to analyze seismicity: ZMAP. Seismol. Res. Lett. 2001, 72, 373–382. [Google Scholar] [CrossRef]
- Richter, C.F. Elementary Seismology; W. H. Freeman and Co.: San Francisco, CA, USA, 1958. [Google Scholar]
- Lahr, J.C. Hypoellipse/Version 2.0*: A Computer Program for Determining Local Earthquake Hypocentral Parameters, Magnitude, and First Motion Pattern; U.S. Geological Survey: Reston, VA, USA, 1989; pp. 89–116. [Google Scholar] [CrossRef]
- Lee, W.H.K.; Lahr, J.C. HYPO71: A Computer Program for Determining Hypocenter, Magnitude, and First Motion Pattern of Local Earthquakes; OFR; U.S. Geological Survey: Reston, VA, USA, 1975. [Google Scholar]
- Hirn, A.; Nercessian, A.; Sapin, M.; Ferrucci, F.; Wittlinger, G. Seismic heterogeneity of Mt Etna: Structure and activity. Geophys. J. Int. 1991, 105, 139–153. [Google Scholar] [CrossRef]
- Patanè, D.; Ferrucci, F.; Gresta, S. Spectral features of microearthquakes in volcanic areas: Attenuation in the crust and amplitude response of the site at Mt. Etna, Italy. Bull. Seismol. Soc. Am. 1994, 84, 1842–1860. [Google Scholar] [CrossRef]
- Bonforte, A.; Fanizza, G.; Greco, F.; Matera, A.; Sulpizio, R. Long-term dynamics across a volcanic rift: 21 years of microgravity and GPS observations on the southern flank of Mt. Etna volcano. J. Volcanol. Geotherm. Res. 2017, 344, 174–184. [Google Scholar] [CrossRef]
- Bonforte, A.; Gambino, S.; Neri, M. Intrusion of eccentric dikes: The case of the 2001 eruption and its role in the dynamics of Mt. Etna volcano. Tectonophysics 2009, 471, 78–86. [Google Scholar] [CrossRef]
- Gudmundsson, A. Effects of Young’s modulus on fault displacement. Cr. Geosci. 2004, 336, 85–92. [Google Scholar] [CrossRef]
- Rigano, R.; Cara, F.; Lombardo, G.; Rovelli, A. Evidence for ground motion polarization on fault zones of Mount Etna volcano. J. Geophys. Res. Solid Earth 2008, 113, 5574. [Google Scholar] [CrossRef]
- Di Giulio, G.; Cara, F.; Rovelli, A.; Lombardo, G.; Rigano, R. Evidences for strong directional resonances in intensely deformed zones of the Pernicana fault, Mount Etna, Italy. J. Geophys. Res. Solid Earth 2009, 114, B10. [Google Scholar] [CrossRef]
- Bonforte, A.; Guglielmino, F.; Puglisi, G. Interaction between magma intrusion and flank dynamics at Mt. Etna in 2008, imaged by integrated dense GPS and DInSAR data. Geochem. Geophys. Geosys. 2013, 14, 2818–2835. [Google Scholar] [CrossRef]
- Bonforte, A.; Guglielmino, F.; Puglisi, G. Large dyke intrusion and small eruption: The December 24, 2018 Mt. Etna eruption imaged by Sentinel-1 data. Terra Nova 2019, 5, 12403. [Google Scholar] [CrossRef]
- Aloisi, M.; Bonaccorso, A.; Cannavò, F.; Currenti, G.; Gambino, S. The 24 December 2018 eruptive intrusion at Etna volcano as revealed by multidisciplinary continuous deformation networks (CGPS, borehole, strainmeters and tiltmeters). J. Geophy. Res. Solid Earth 2020, 125, 9117. [Google Scholar] [CrossRef]
- Gambino, S.; Distefano, G. Intrusive Seismic Swarms as Possible Precursors of Destructive Earthquakes on Mt. Etna’s Eastern Flank. Int. J. Geoph. 2022, 2022, 8565536. [Google Scholar] [CrossRef]


| Number Event | DD/MO/YR | Origin Time | Latitude | Longitude | Depth (km) | Ml | No | GAP (°) | RMS (s) | ERH (km) | ERZ (km) | D (km) |
|---|---|---|---|---|---|---|---|---|---|---|---|---|
| 1 | 06/02/2019 | 23:38:04.91 | 37.591 | 15.085 | 0.49 | 2.5 | 29 | 103 | 0.30 | 0.30 | 0.50 | 3.9 |
| 2 | 09/02/2019 | 06:02:19.05 | 37.576 | 15.094 | 2.63 | 2.9 | 24 | 88 | 0.25 | 0.20 | 0.20 | 2.2 |
| 3 | 10/02/2019 | 04:00:17.00 | 37.599 | 15.073 | 1.28 | 2.4 | 18 | 140 | 0.16 | 0.40 | 0.90 | 5.3 |
Publisher’s Note: MDPI stays neutral with regard to jurisdictional claims in published maps and institutional affiliations. |
© 2022 by the authors. Licensee MDPI, Basel, Switzerland. This article is an open access article distributed under the terms and conditions of the Creative Commons Attribution (CC BY) license (https://creativecommons.org/licenses/by/4.0/).
Share and Cite
Alparone, S.; Bonforte, A.; Gambino, S.; Grassi, S.; Guglielmino, F.; Latino, F.; Morreale, G.; Patti, G.; Privitera, L.; Obrizzo, F.; et al. Characterization of an Active Fault through a Multiparametric Investigation: The Trecastagni Fault and Its Relationship with the Dynamics of Mt. Etna Volcano (Sicily, Italy). Remote Sens. 2022, 14, 4760. https://doi.org/10.3390/rs14194760
Alparone S, Bonforte A, Gambino S, Grassi S, Guglielmino F, Latino F, Morreale G, Patti G, Privitera L, Obrizzo F, et al. Characterization of an Active Fault through a Multiparametric Investigation: The Trecastagni Fault and Its Relationship with the Dynamics of Mt. Etna Volcano (Sicily, Italy). Remote Sensing. 2022; 14(19):4760. https://doi.org/10.3390/rs14194760
Chicago/Turabian StyleAlparone, Salvatore, Alessandro Bonforte, Salvatore Gambino, Sabrina Grassi, Francesco Guglielmino, Federico Latino, Gabriele Morreale, Graziano Patti, Laura Privitera, Francesco Obrizzo, and et al. 2022. "Characterization of an Active Fault through a Multiparametric Investigation: The Trecastagni Fault and Its Relationship with the Dynamics of Mt. Etna Volcano (Sicily, Italy)" Remote Sensing 14, no. 19: 4760. https://doi.org/10.3390/rs14194760
APA StyleAlparone, S., Bonforte, A., Gambino, S., Grassi, S., Guglielmino, F., Latino, F., Morreale, G., Patti, G., Privitera, L., Obrizzo, F., Ursino, A., & Imposa, S. (2022). Characterization of an Active Fault through a Multiparametric Investigation: The Trecastagni Fault and Its Relationship with the Dynamics of Mt. Etna Volcano (Sicily, Italy). Remote Sensing, 14(19), 4760. https://doi.org/10.3390/rs14194760