


Landslide Detection and Mapping Based on SBAS-InSAR and PS-InSAR: A Case Study in Gongjue County, Tibet, China
Abstract
:1. Introduction
2. Study Area and Datasets
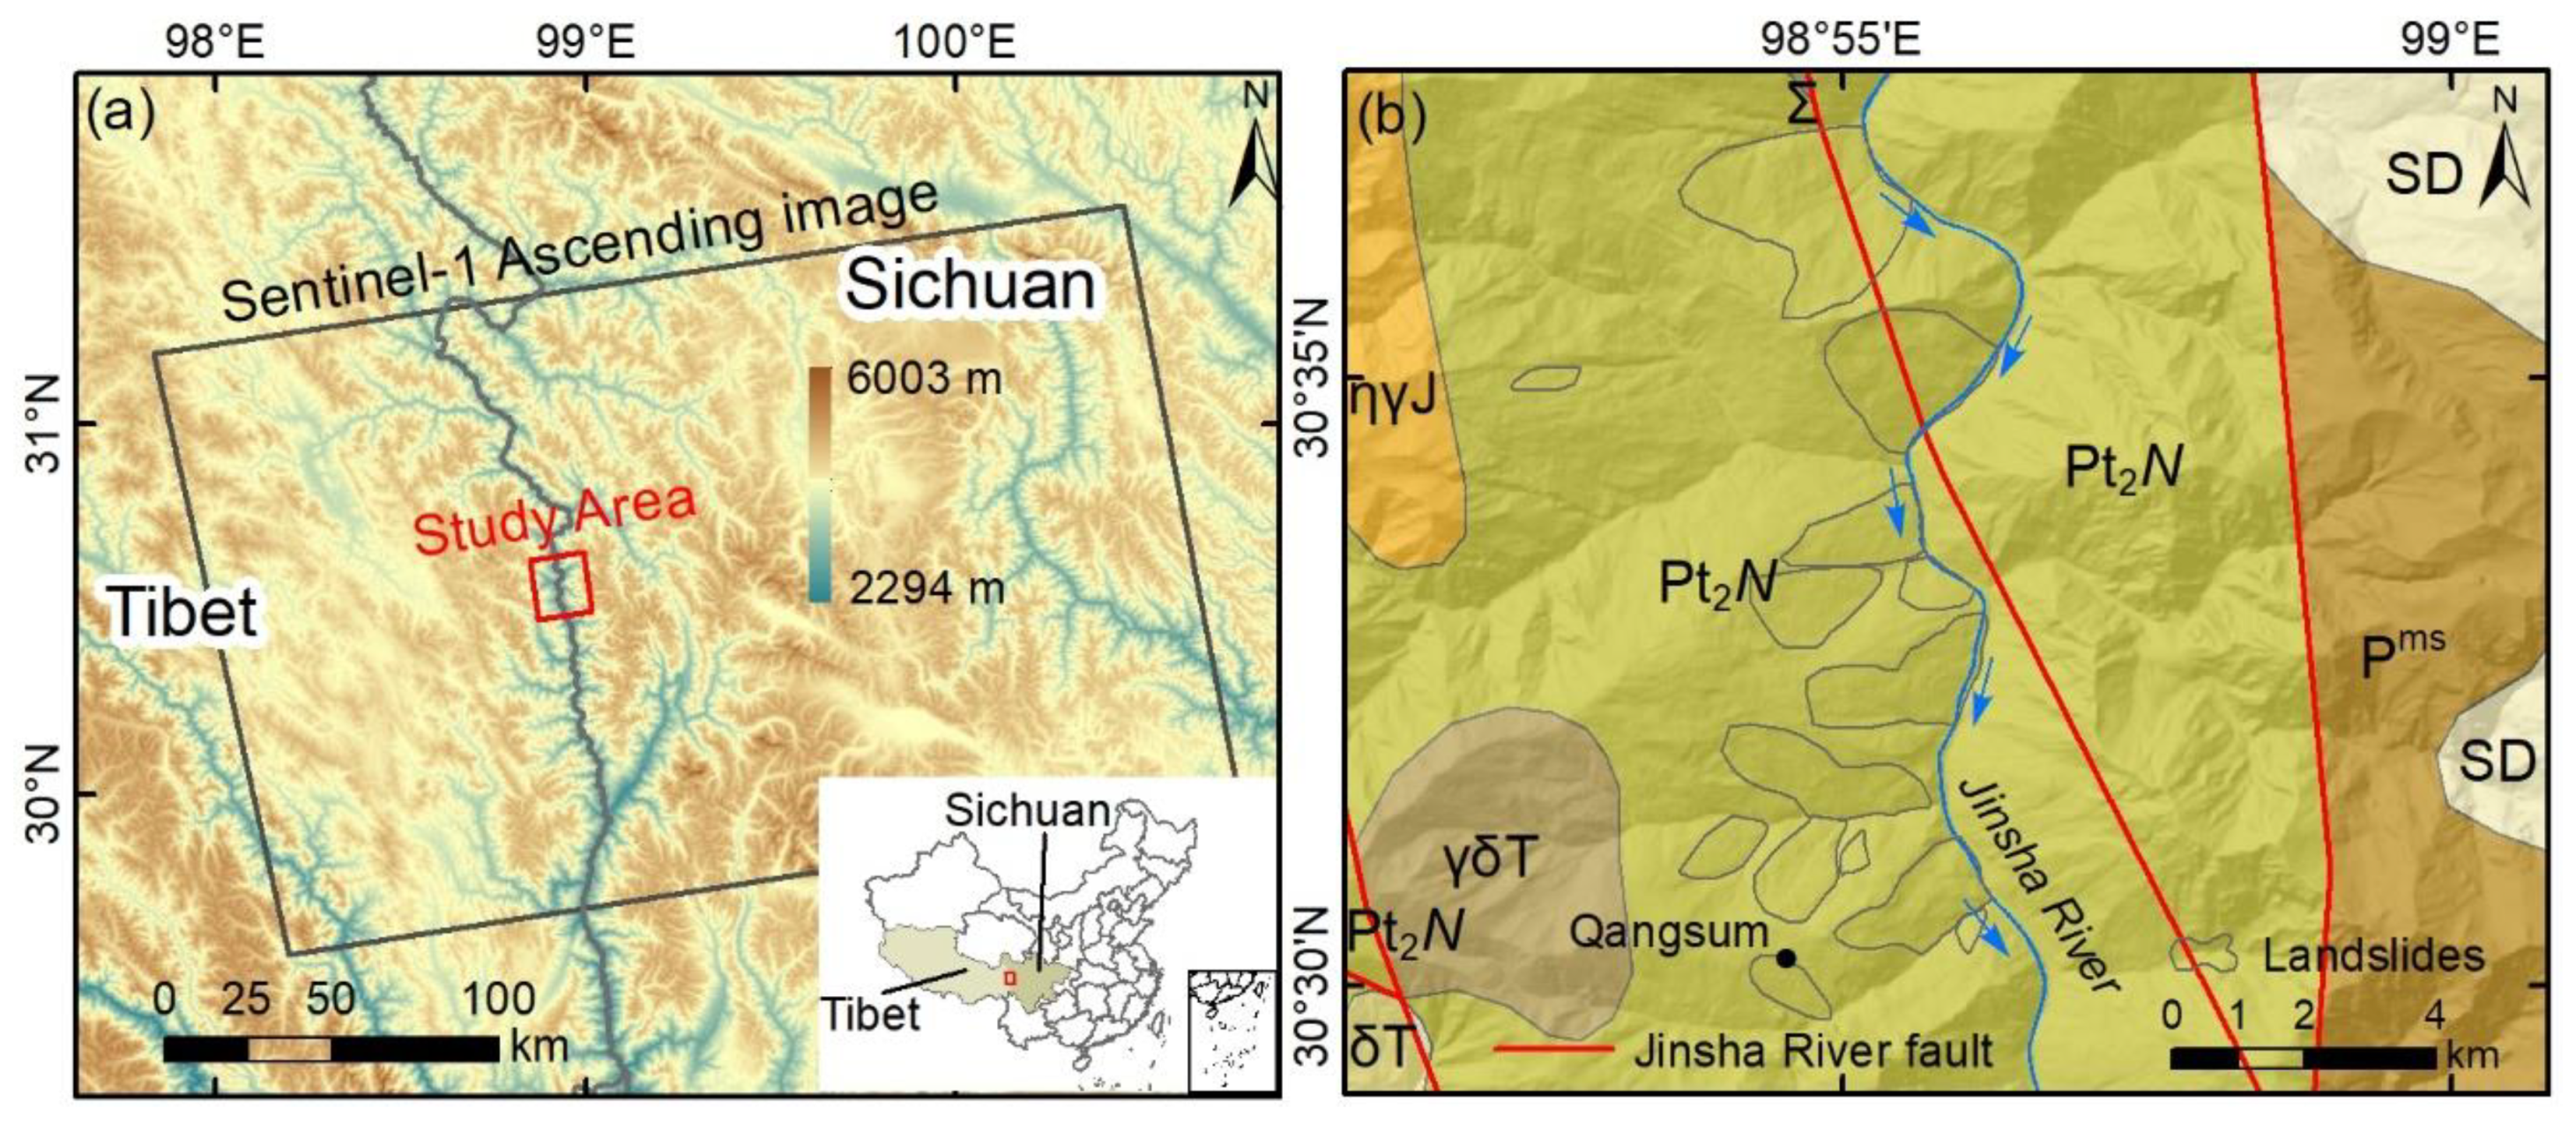
2.1. Study Area
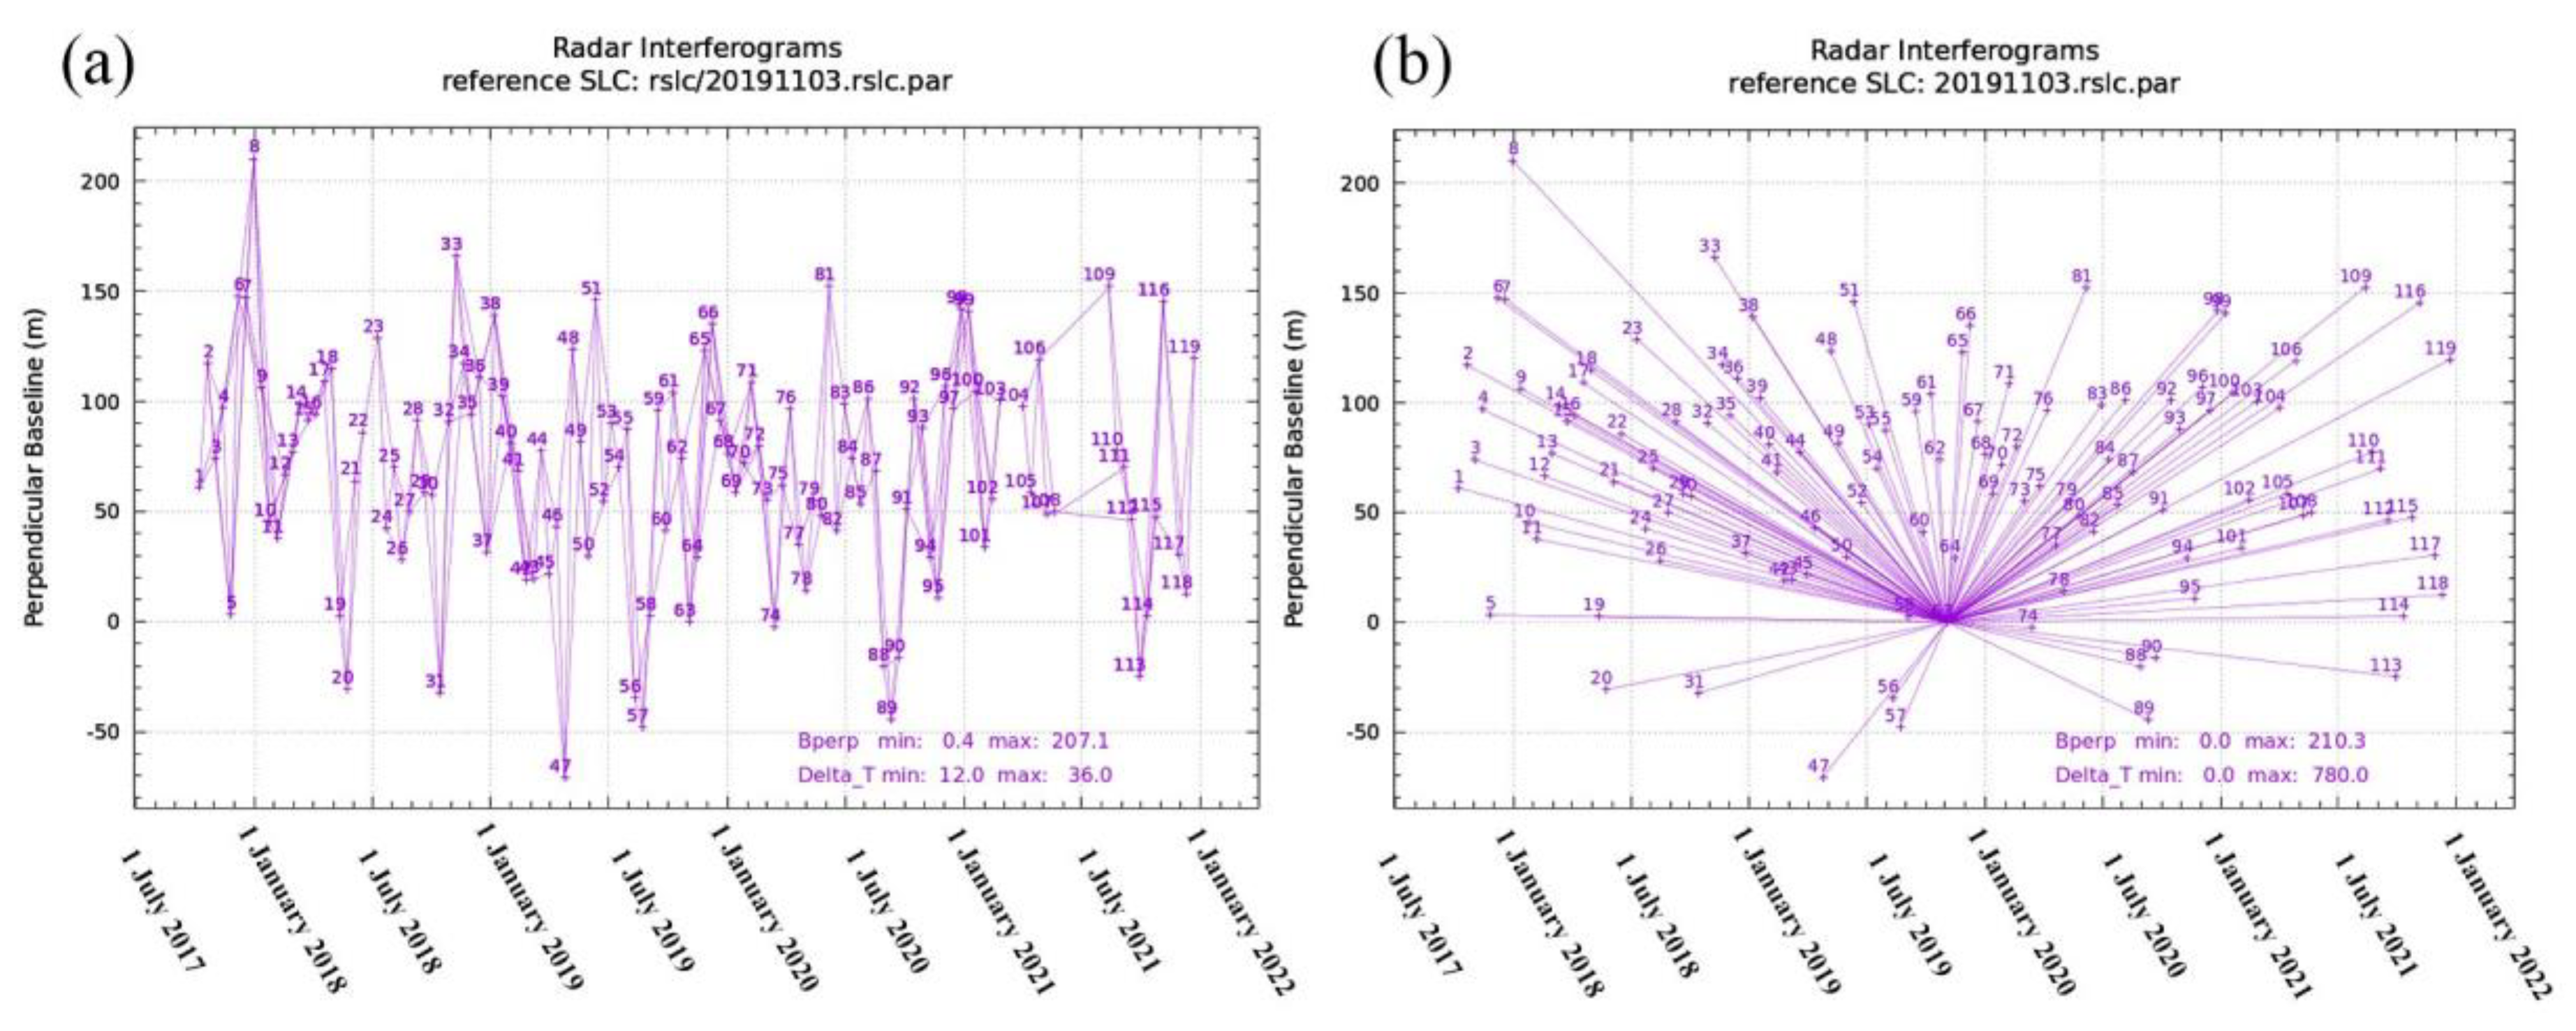
2.2. Datasets
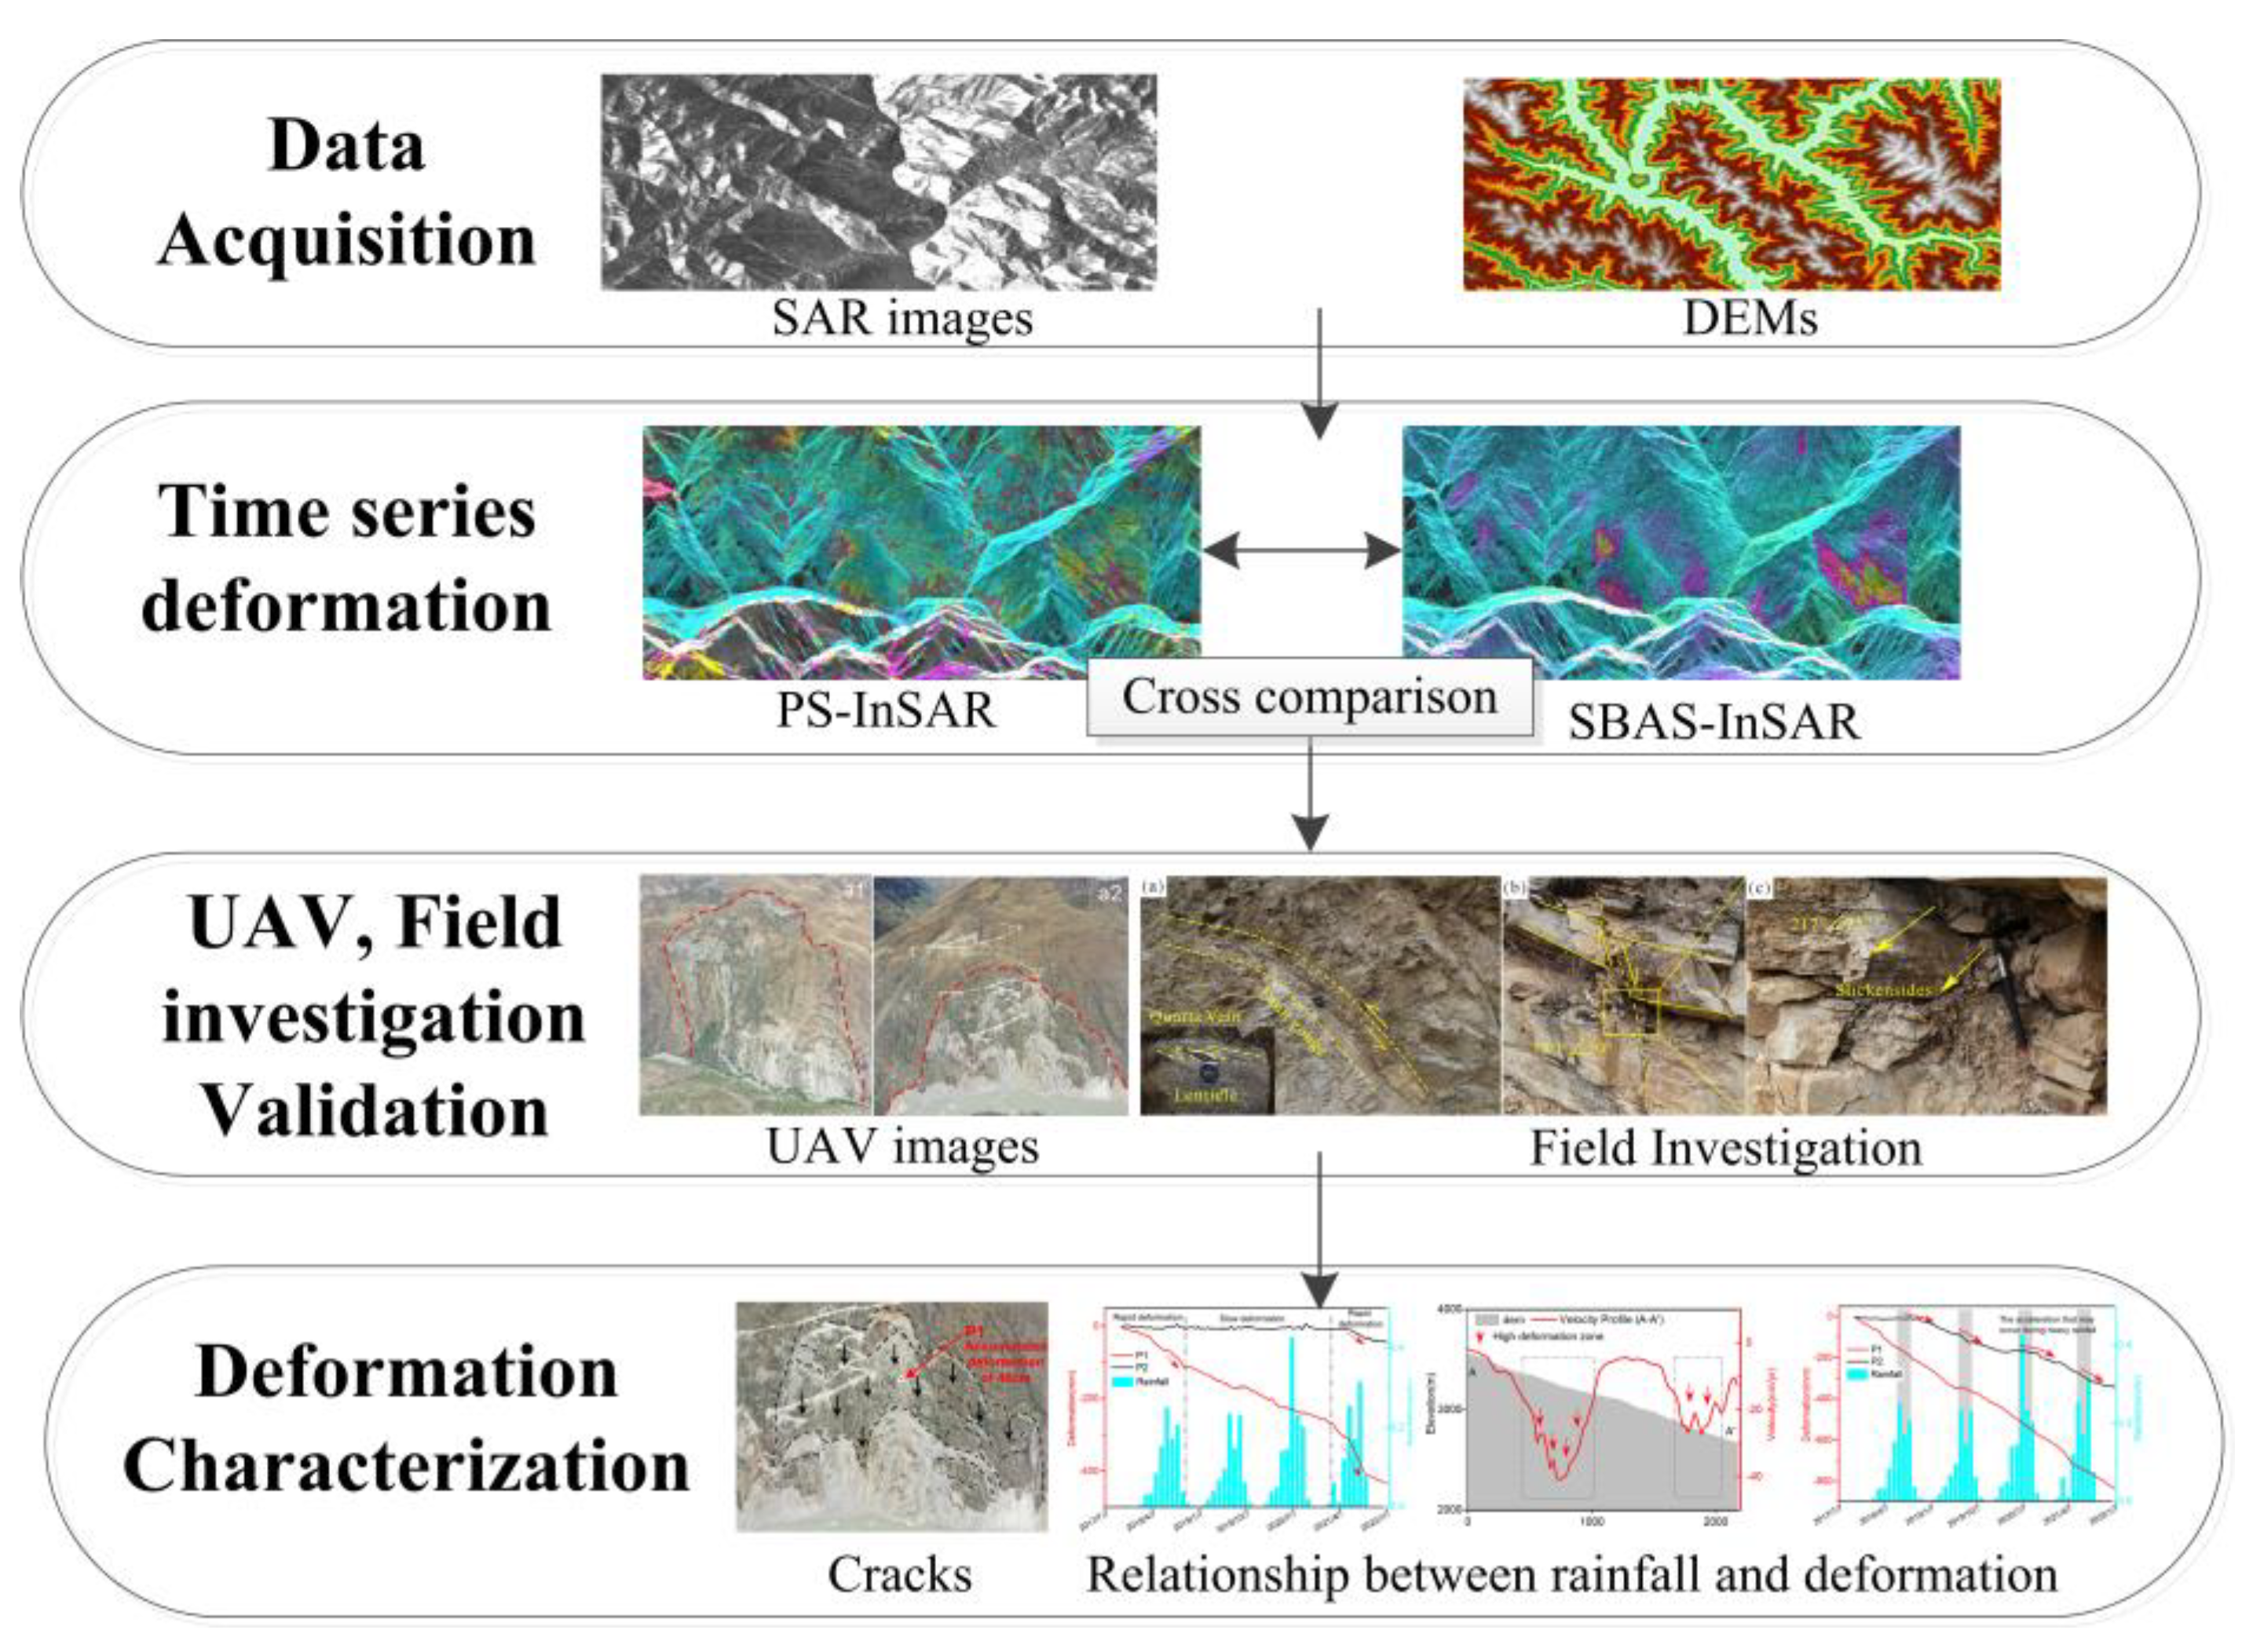
3. Method
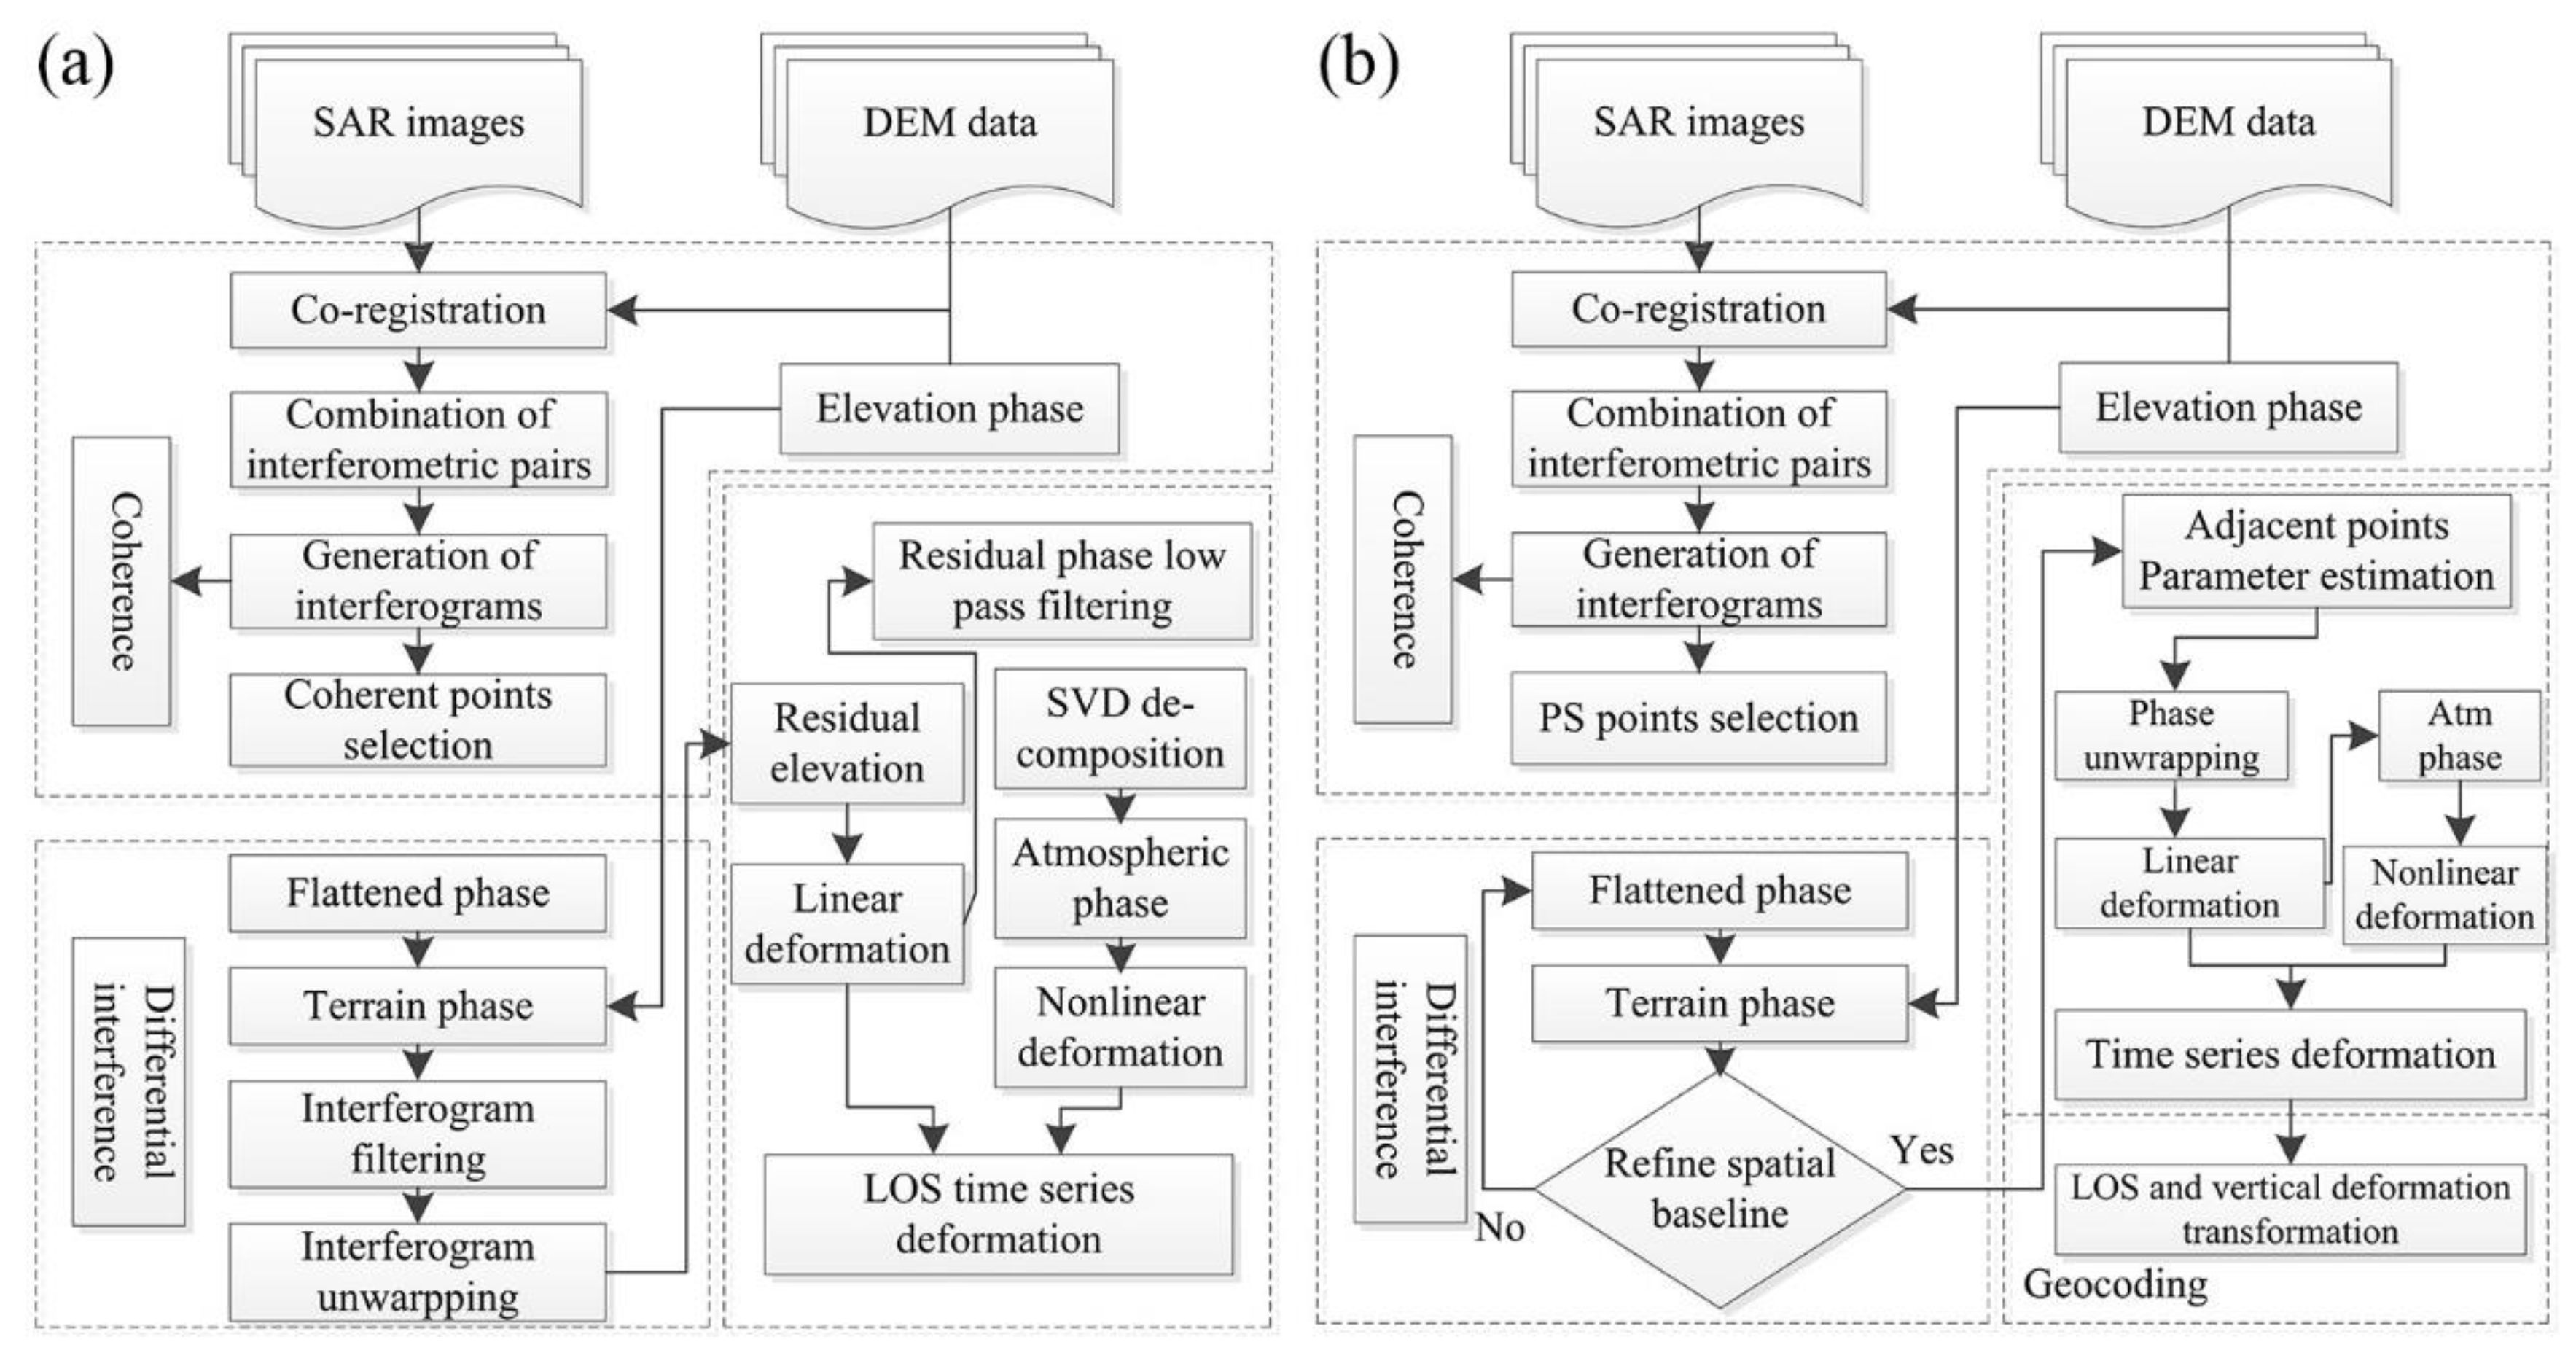
3.1. SBAS-InSAR
3.2. PS-InSAR
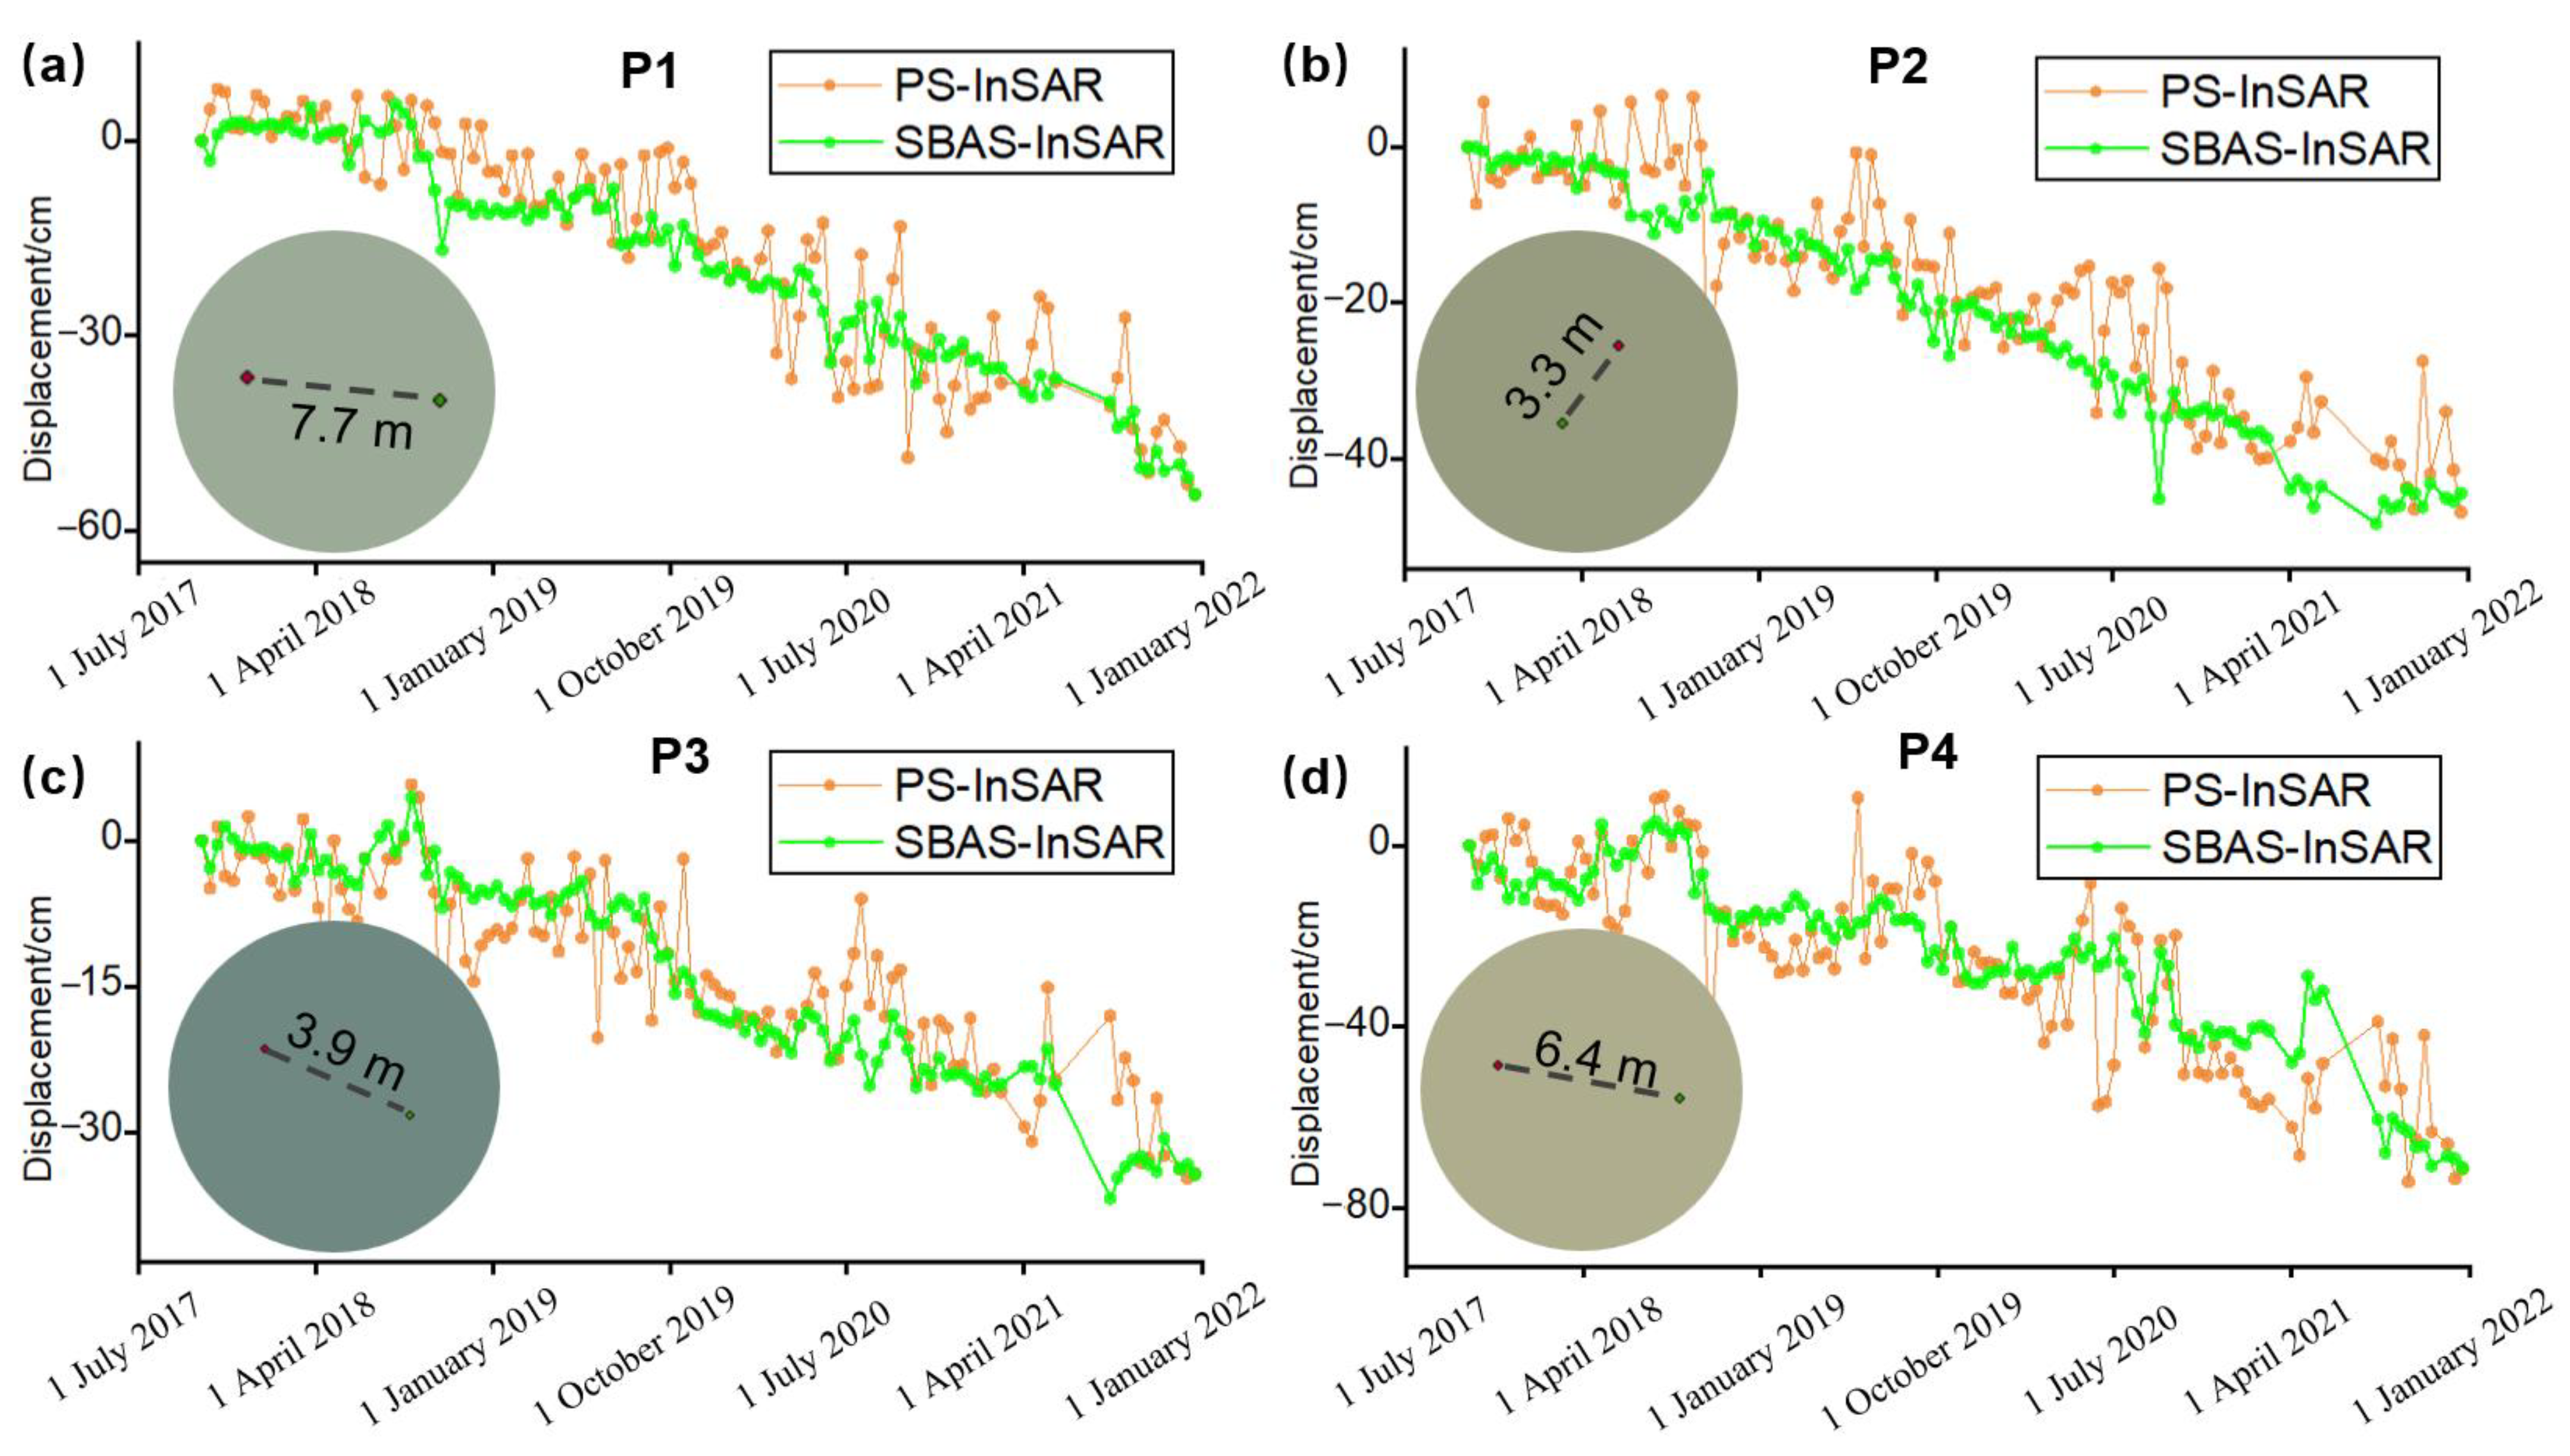
3.3. Validation and Deformation Characteristics Analysis
4. Results
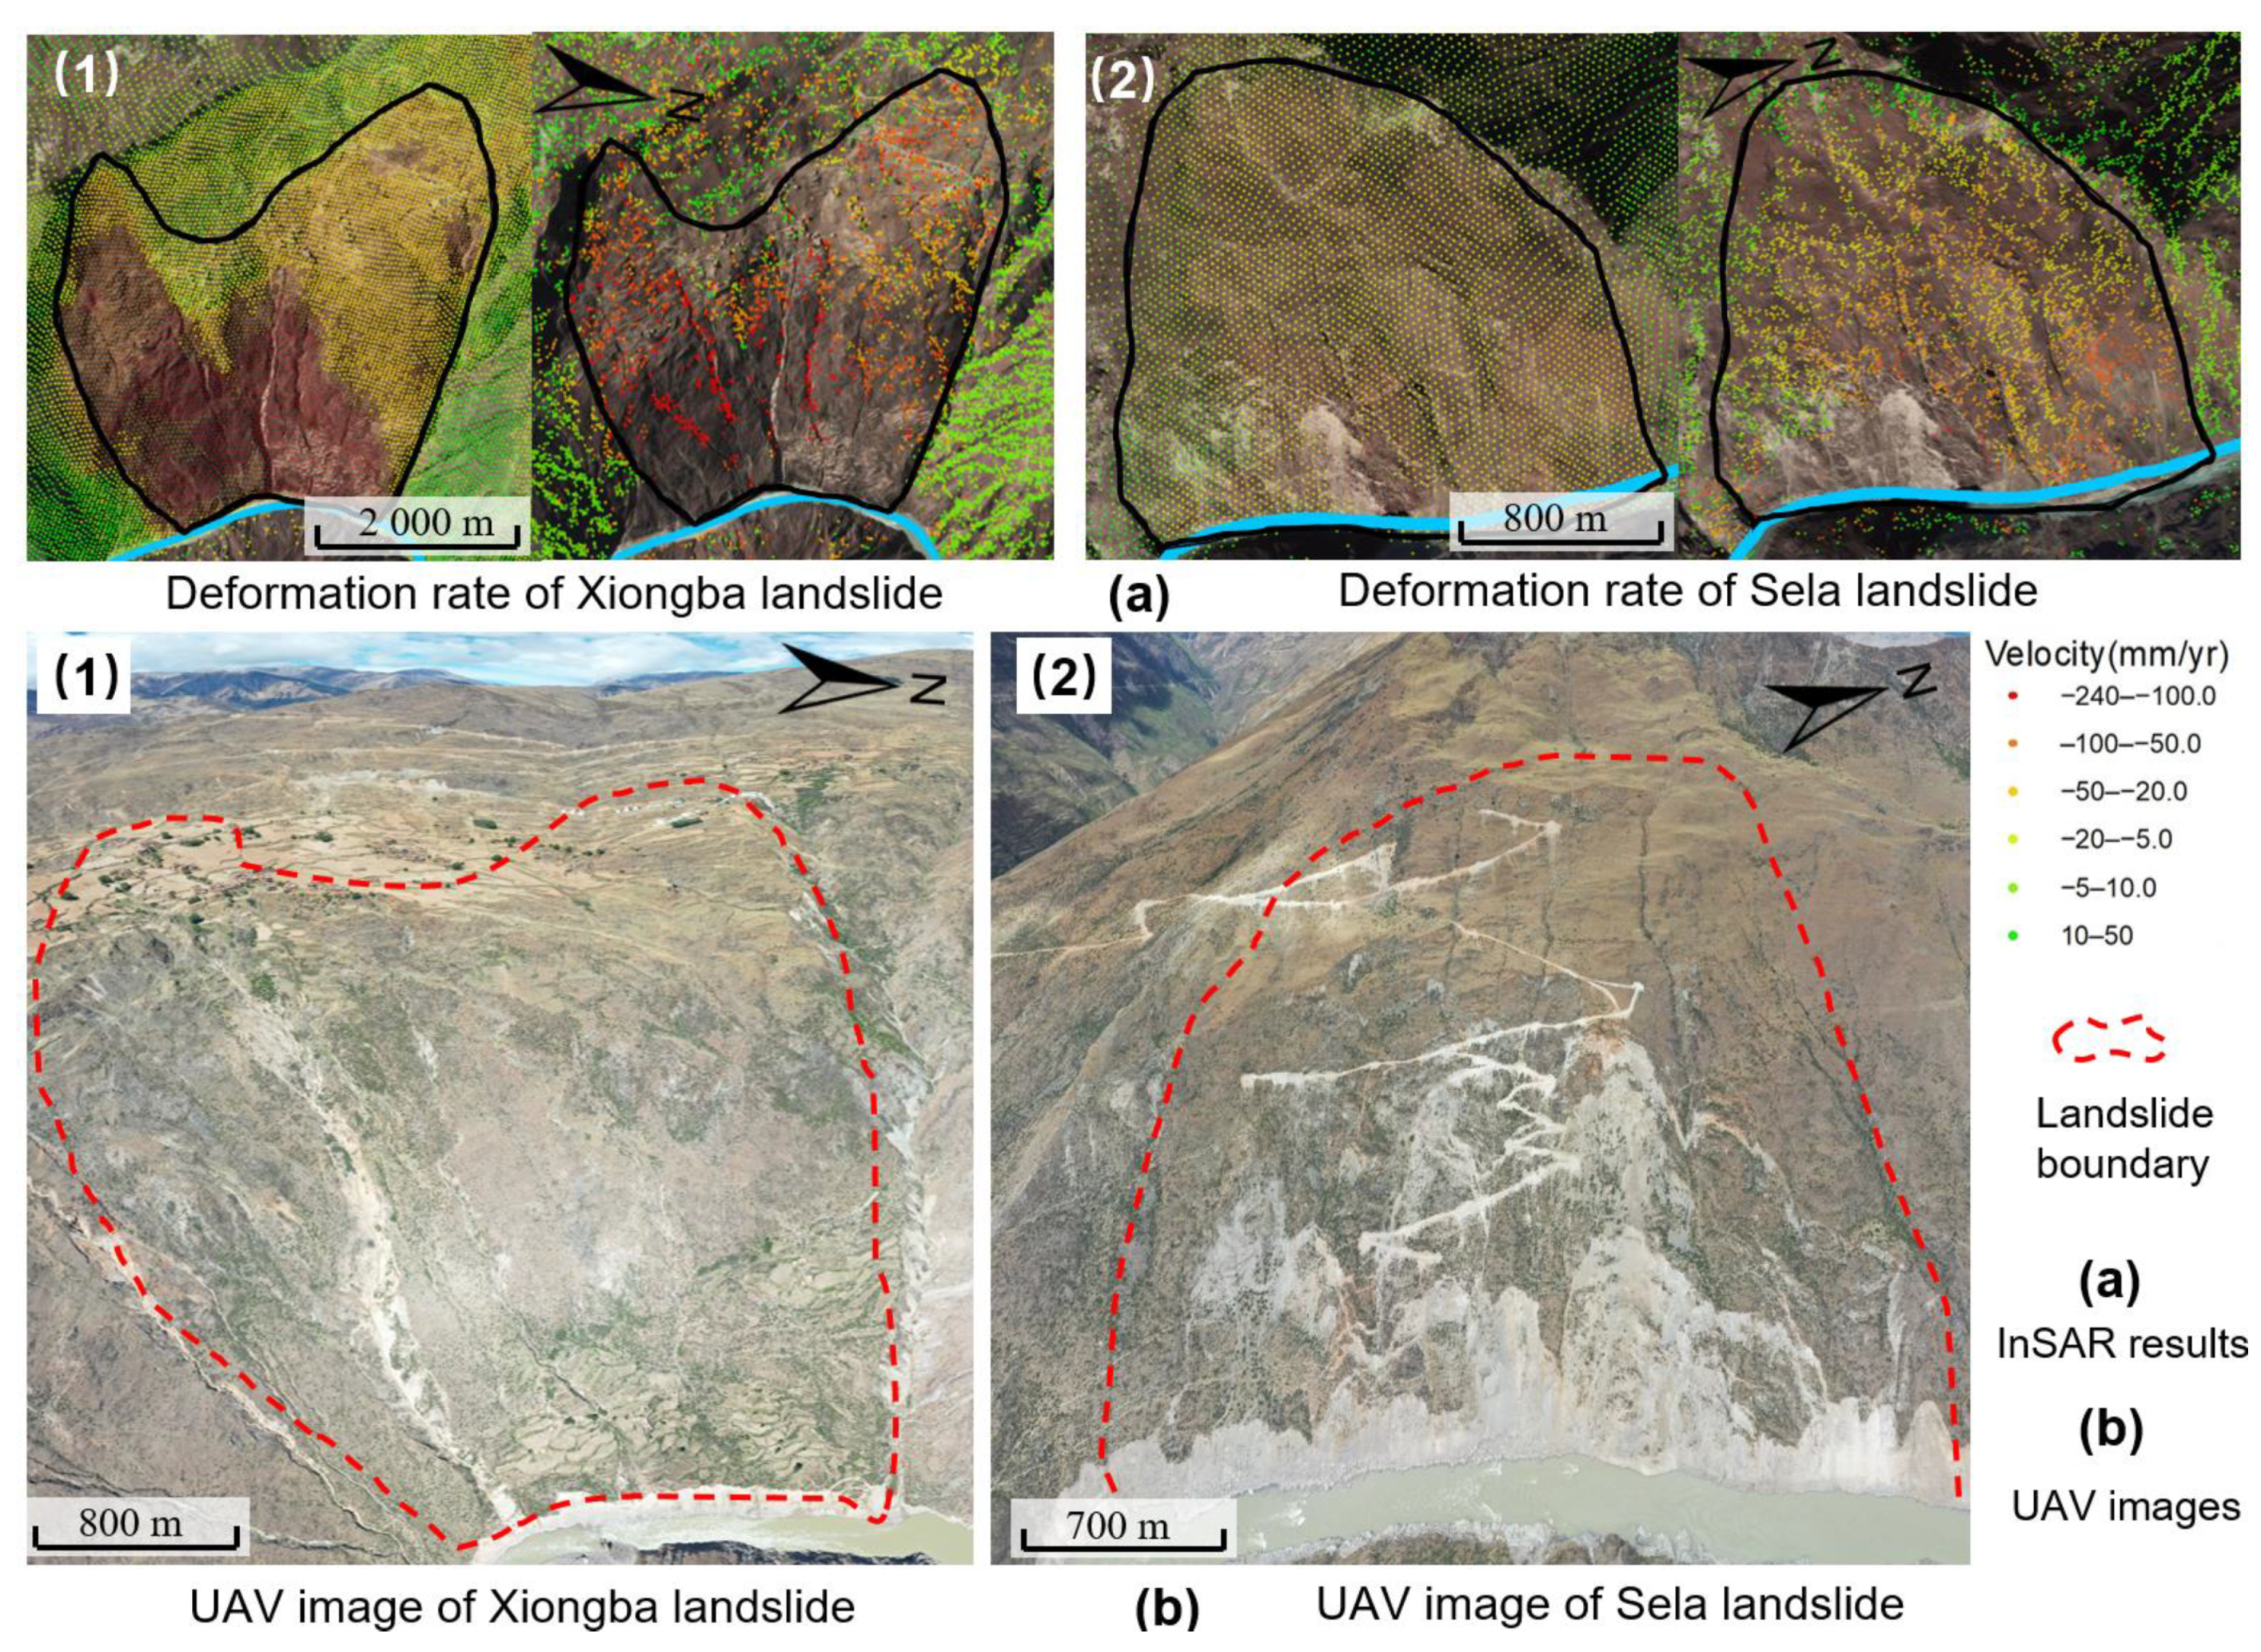
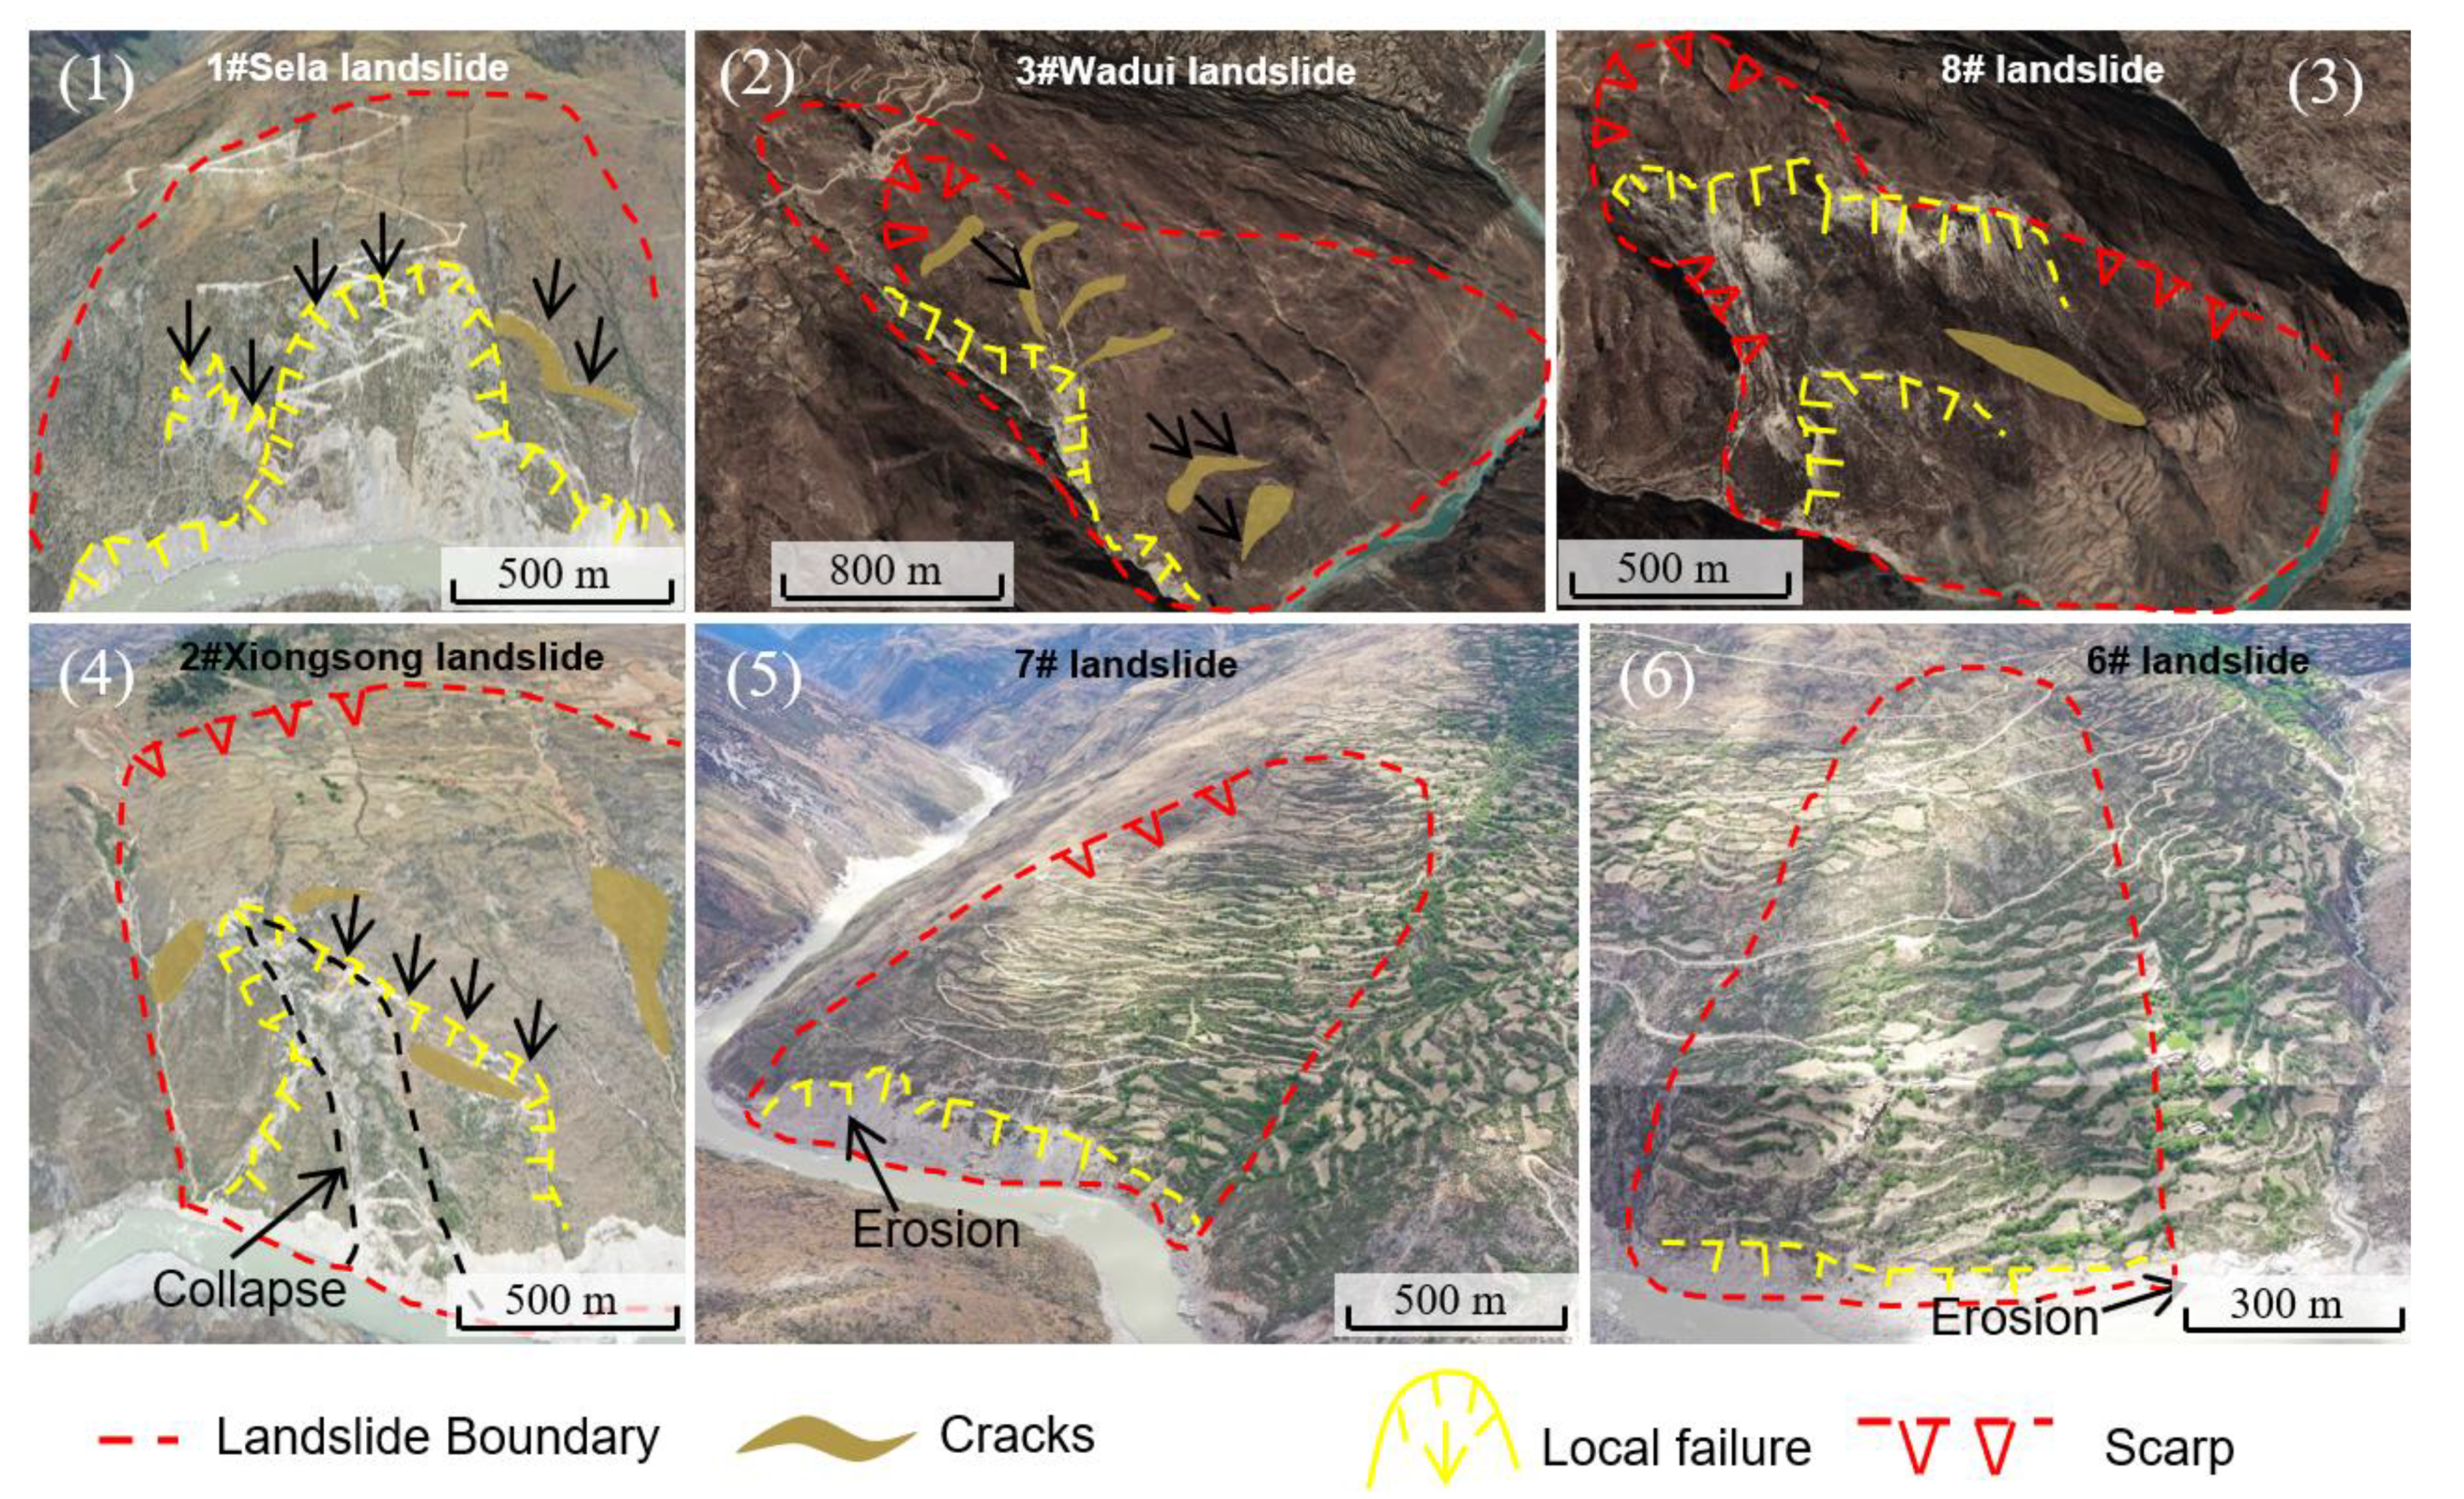
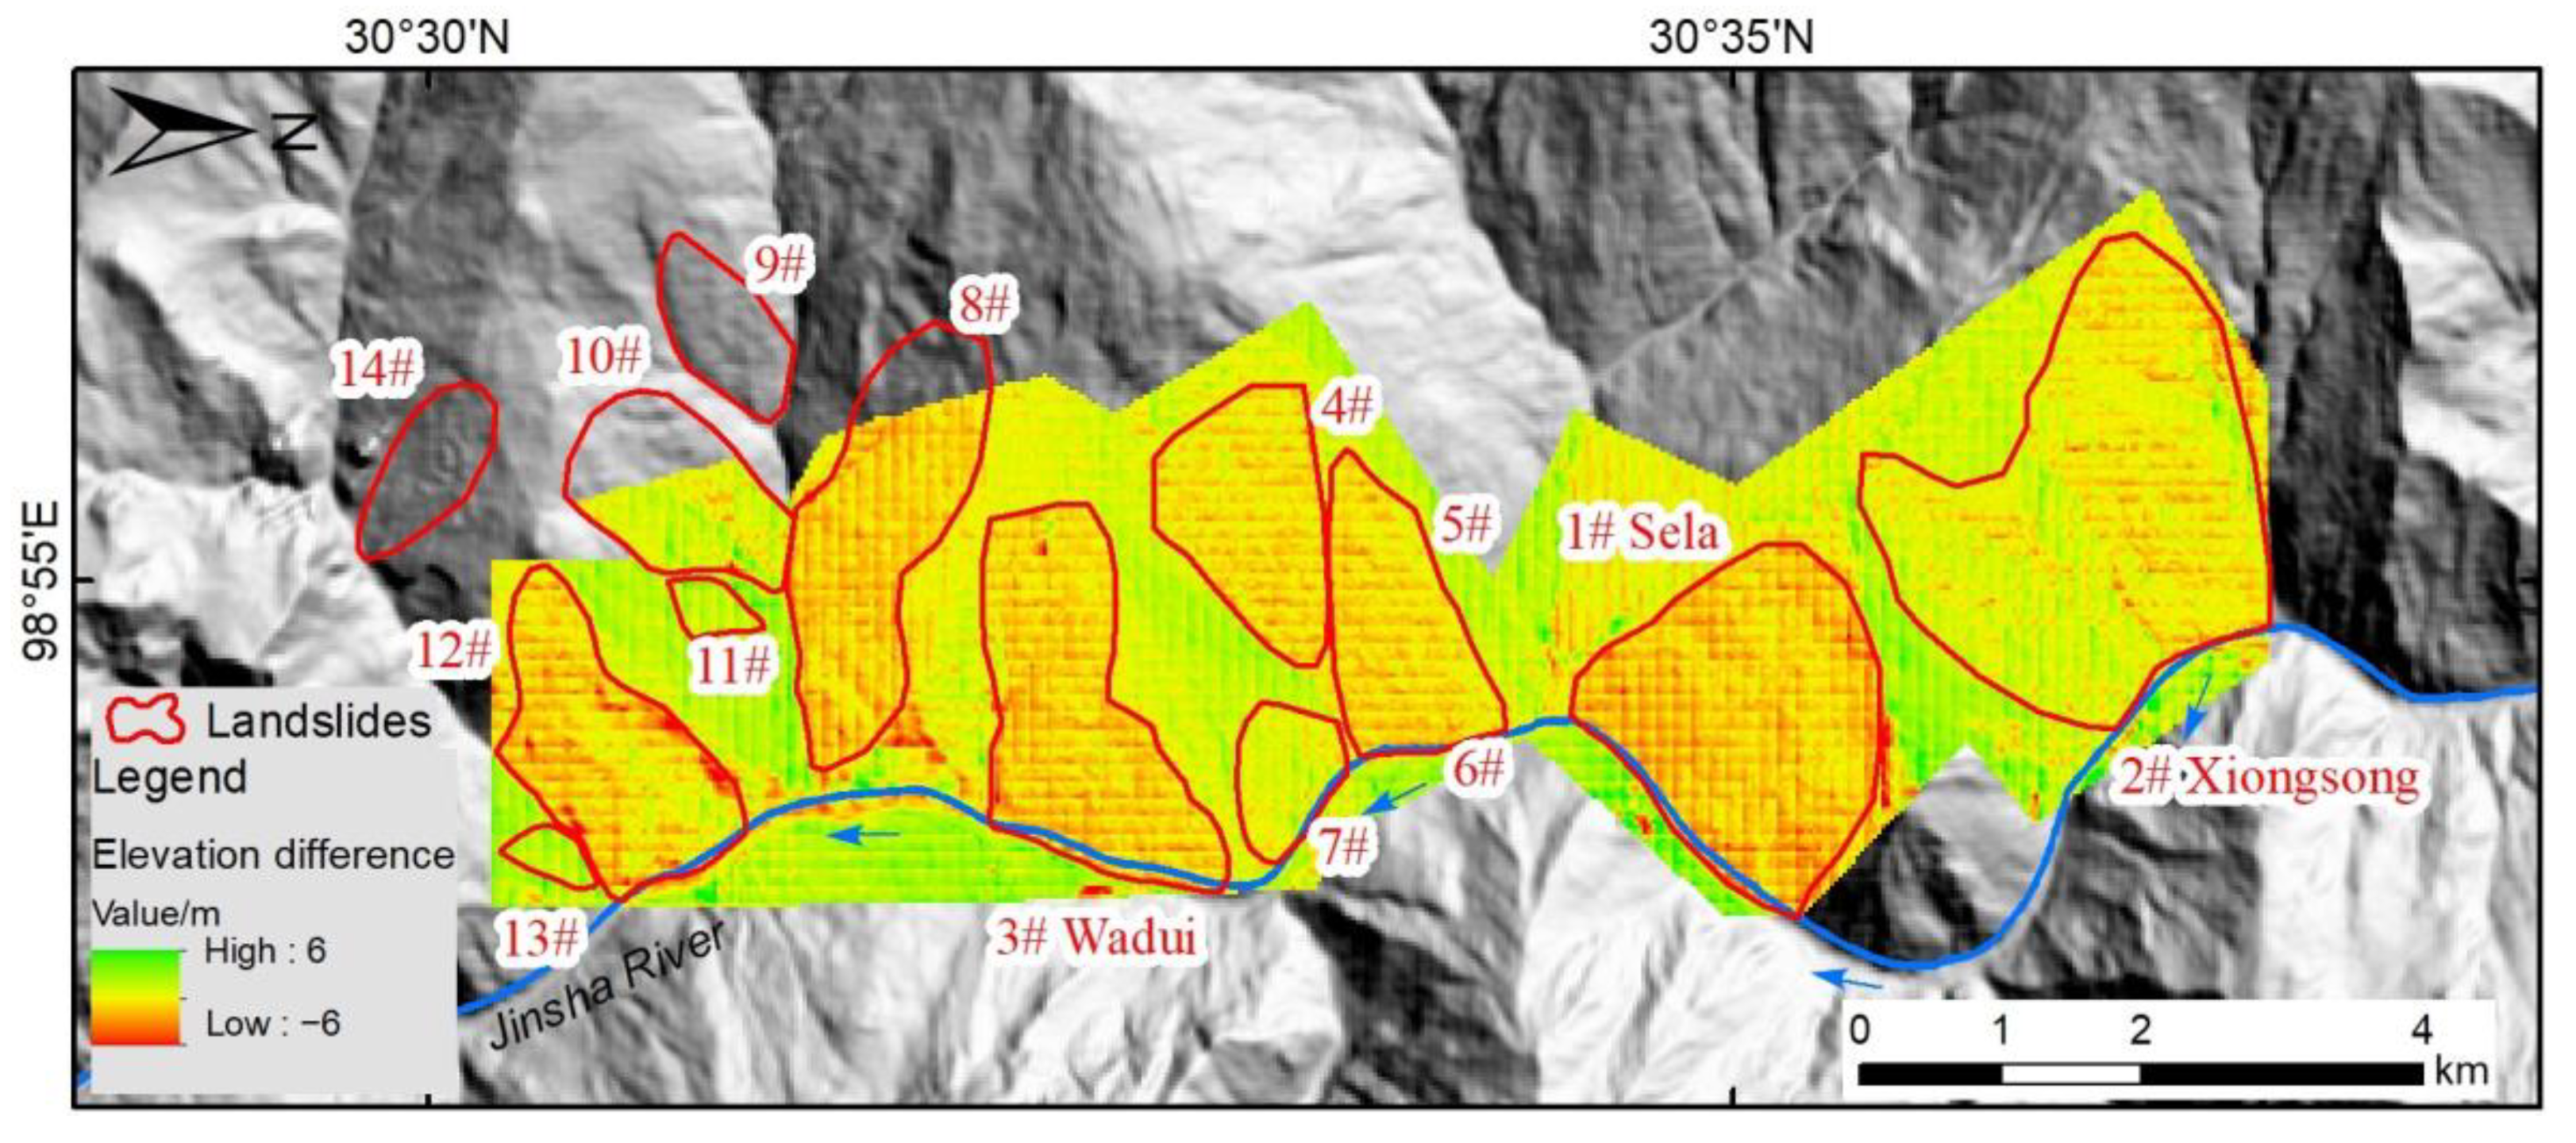
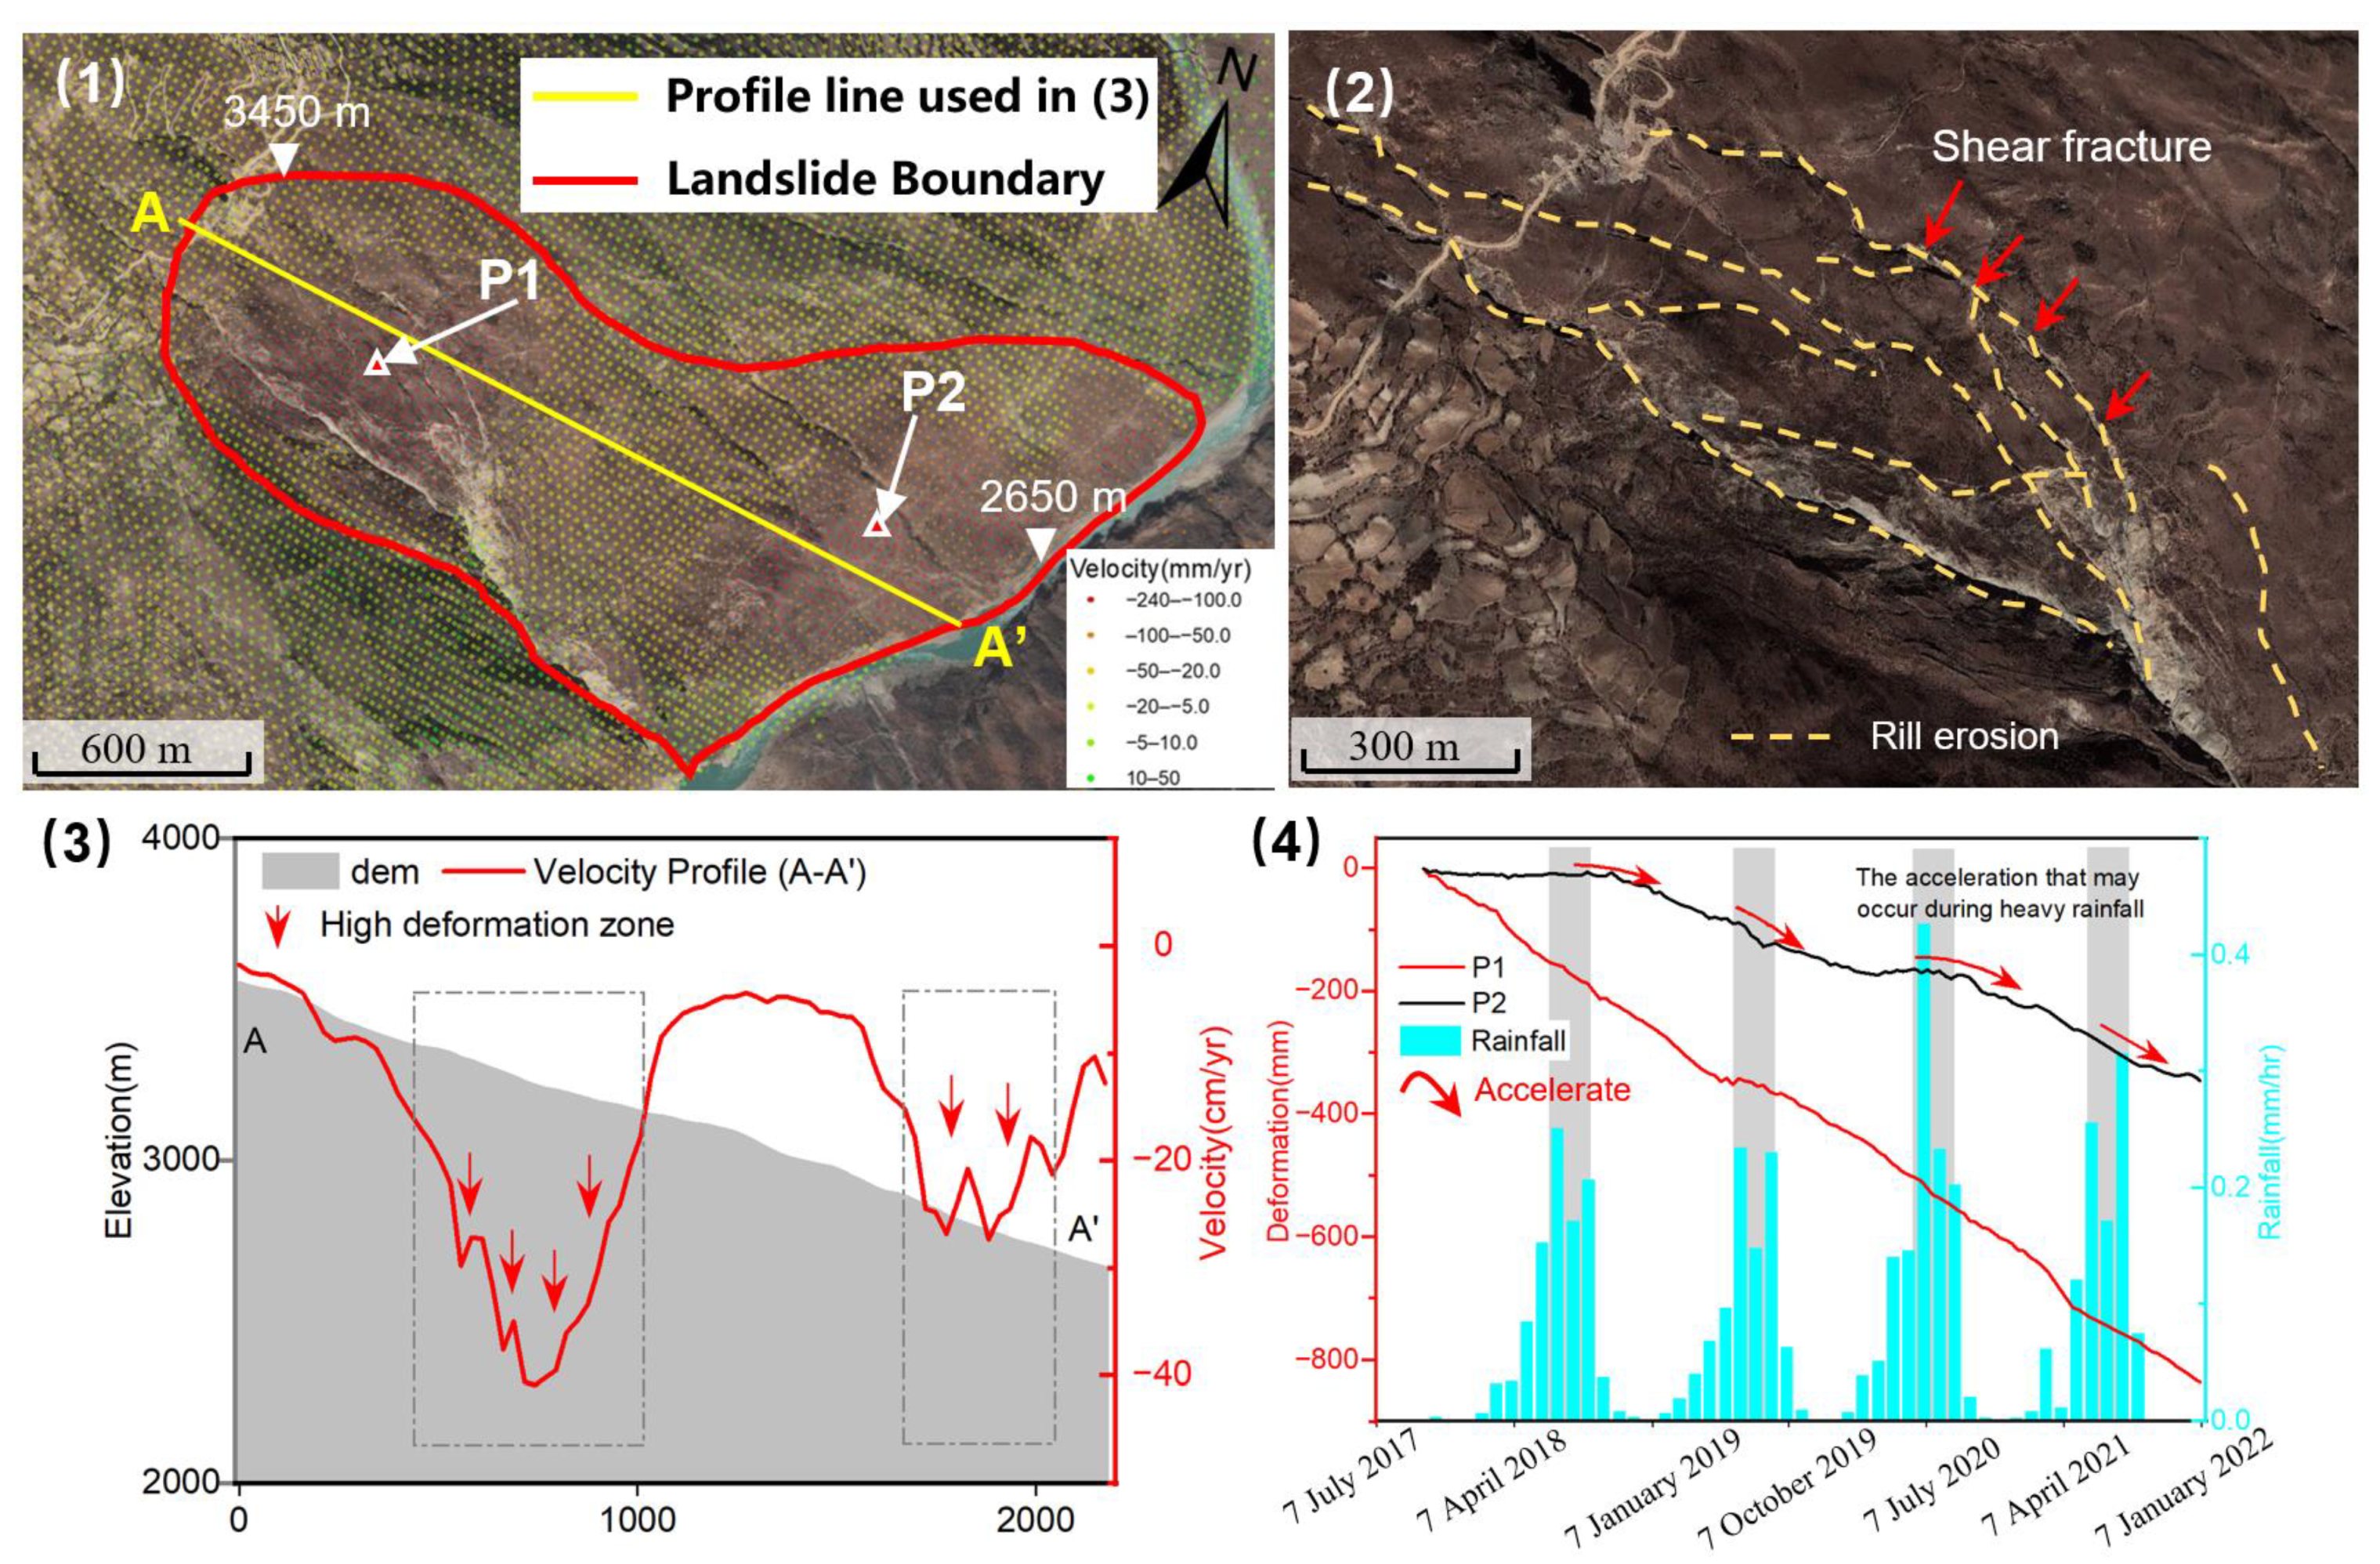
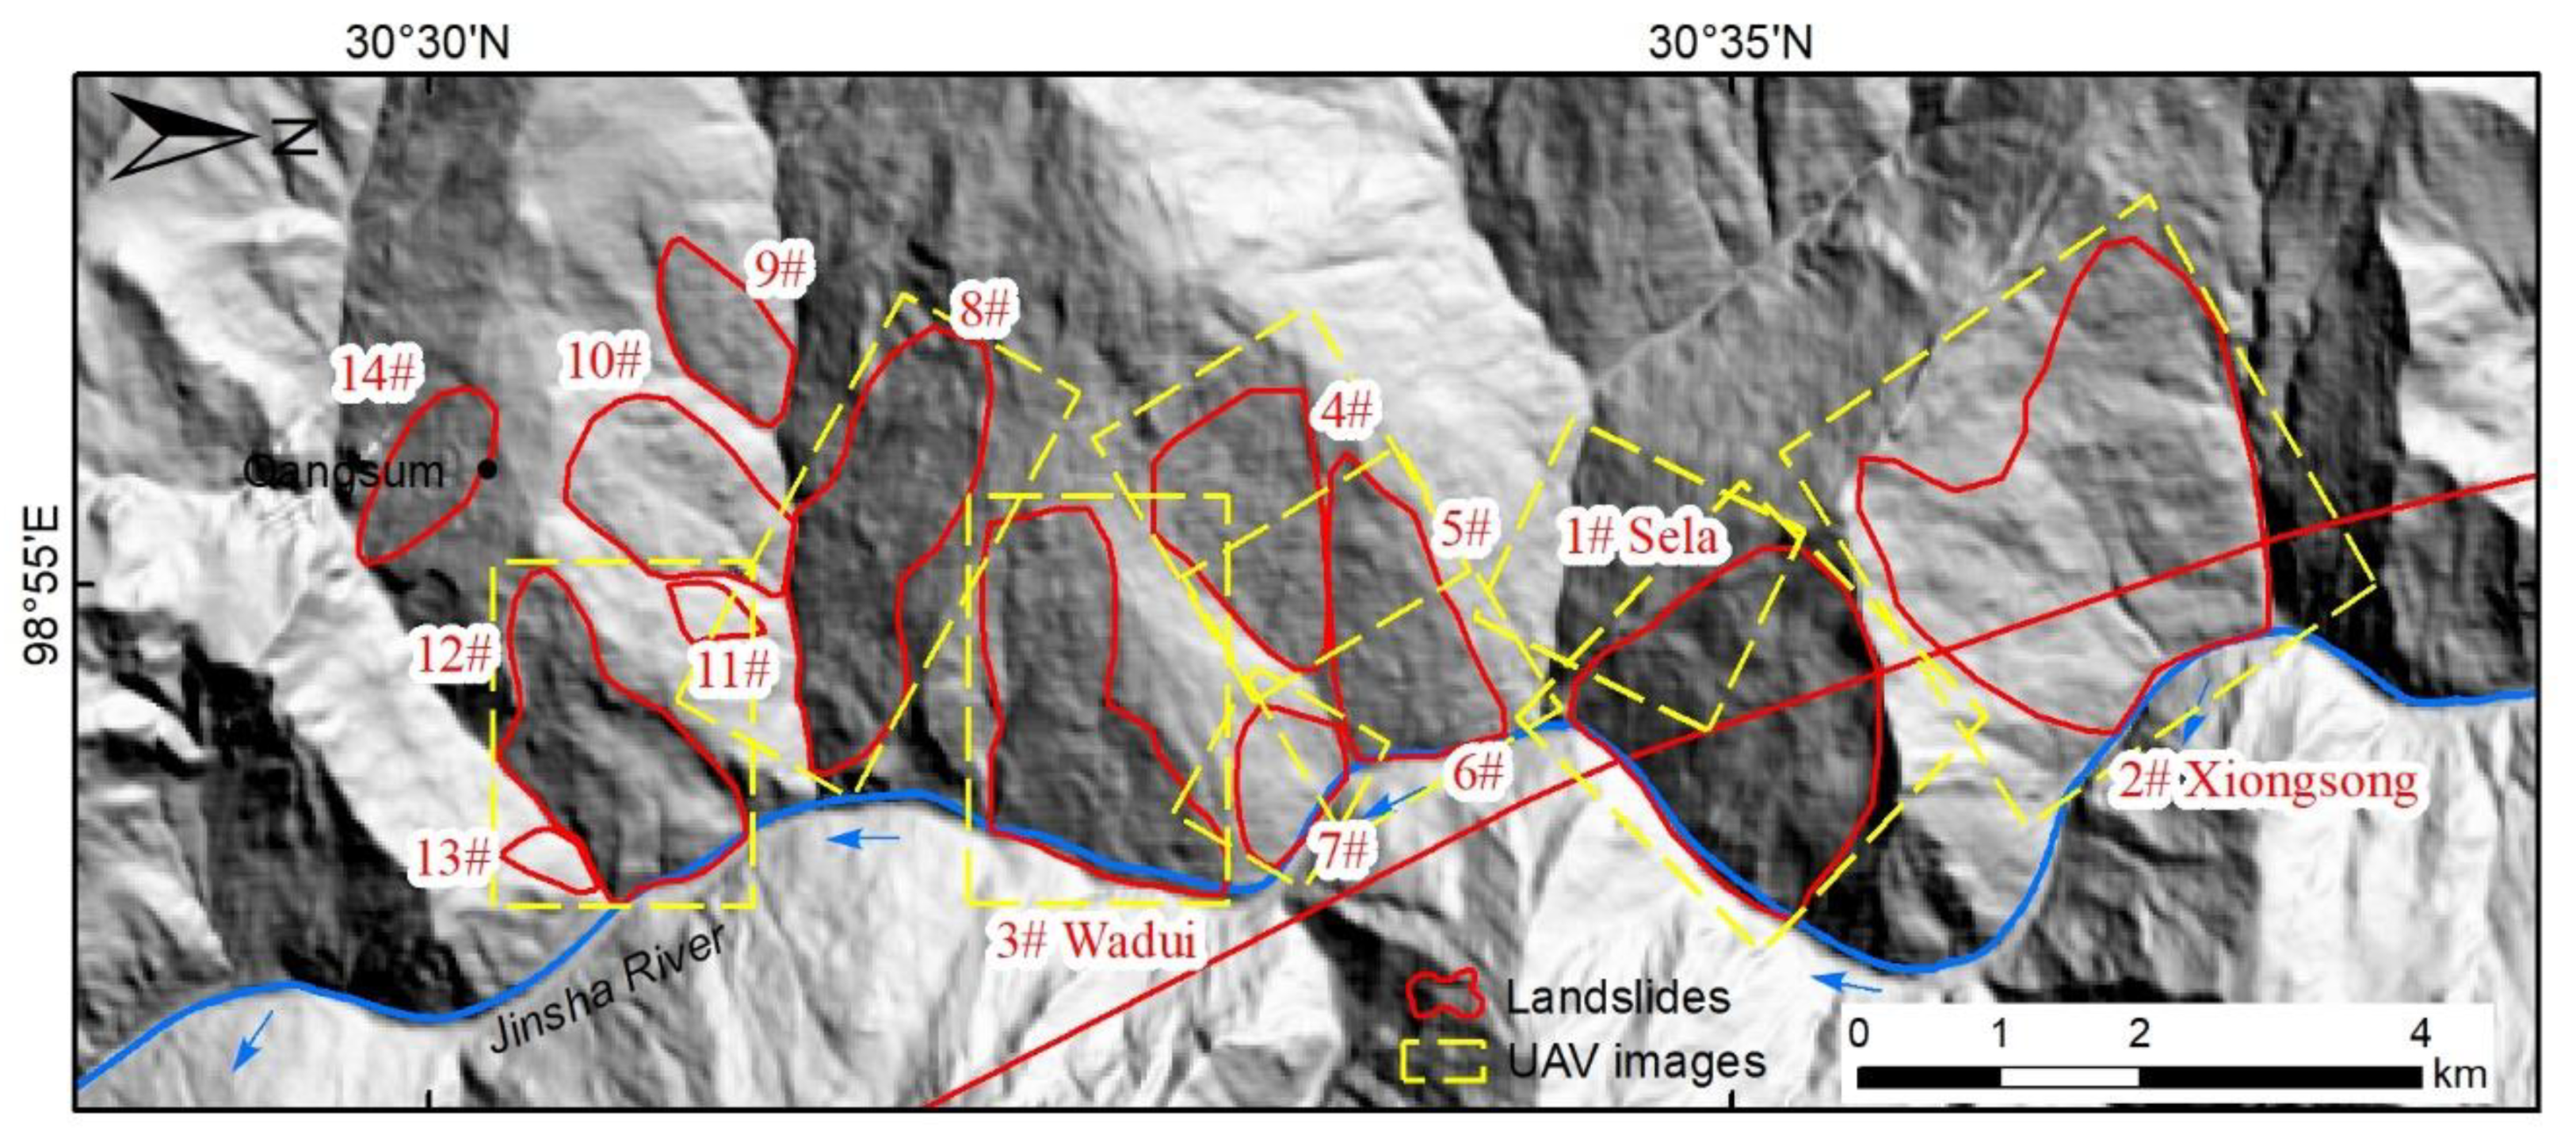
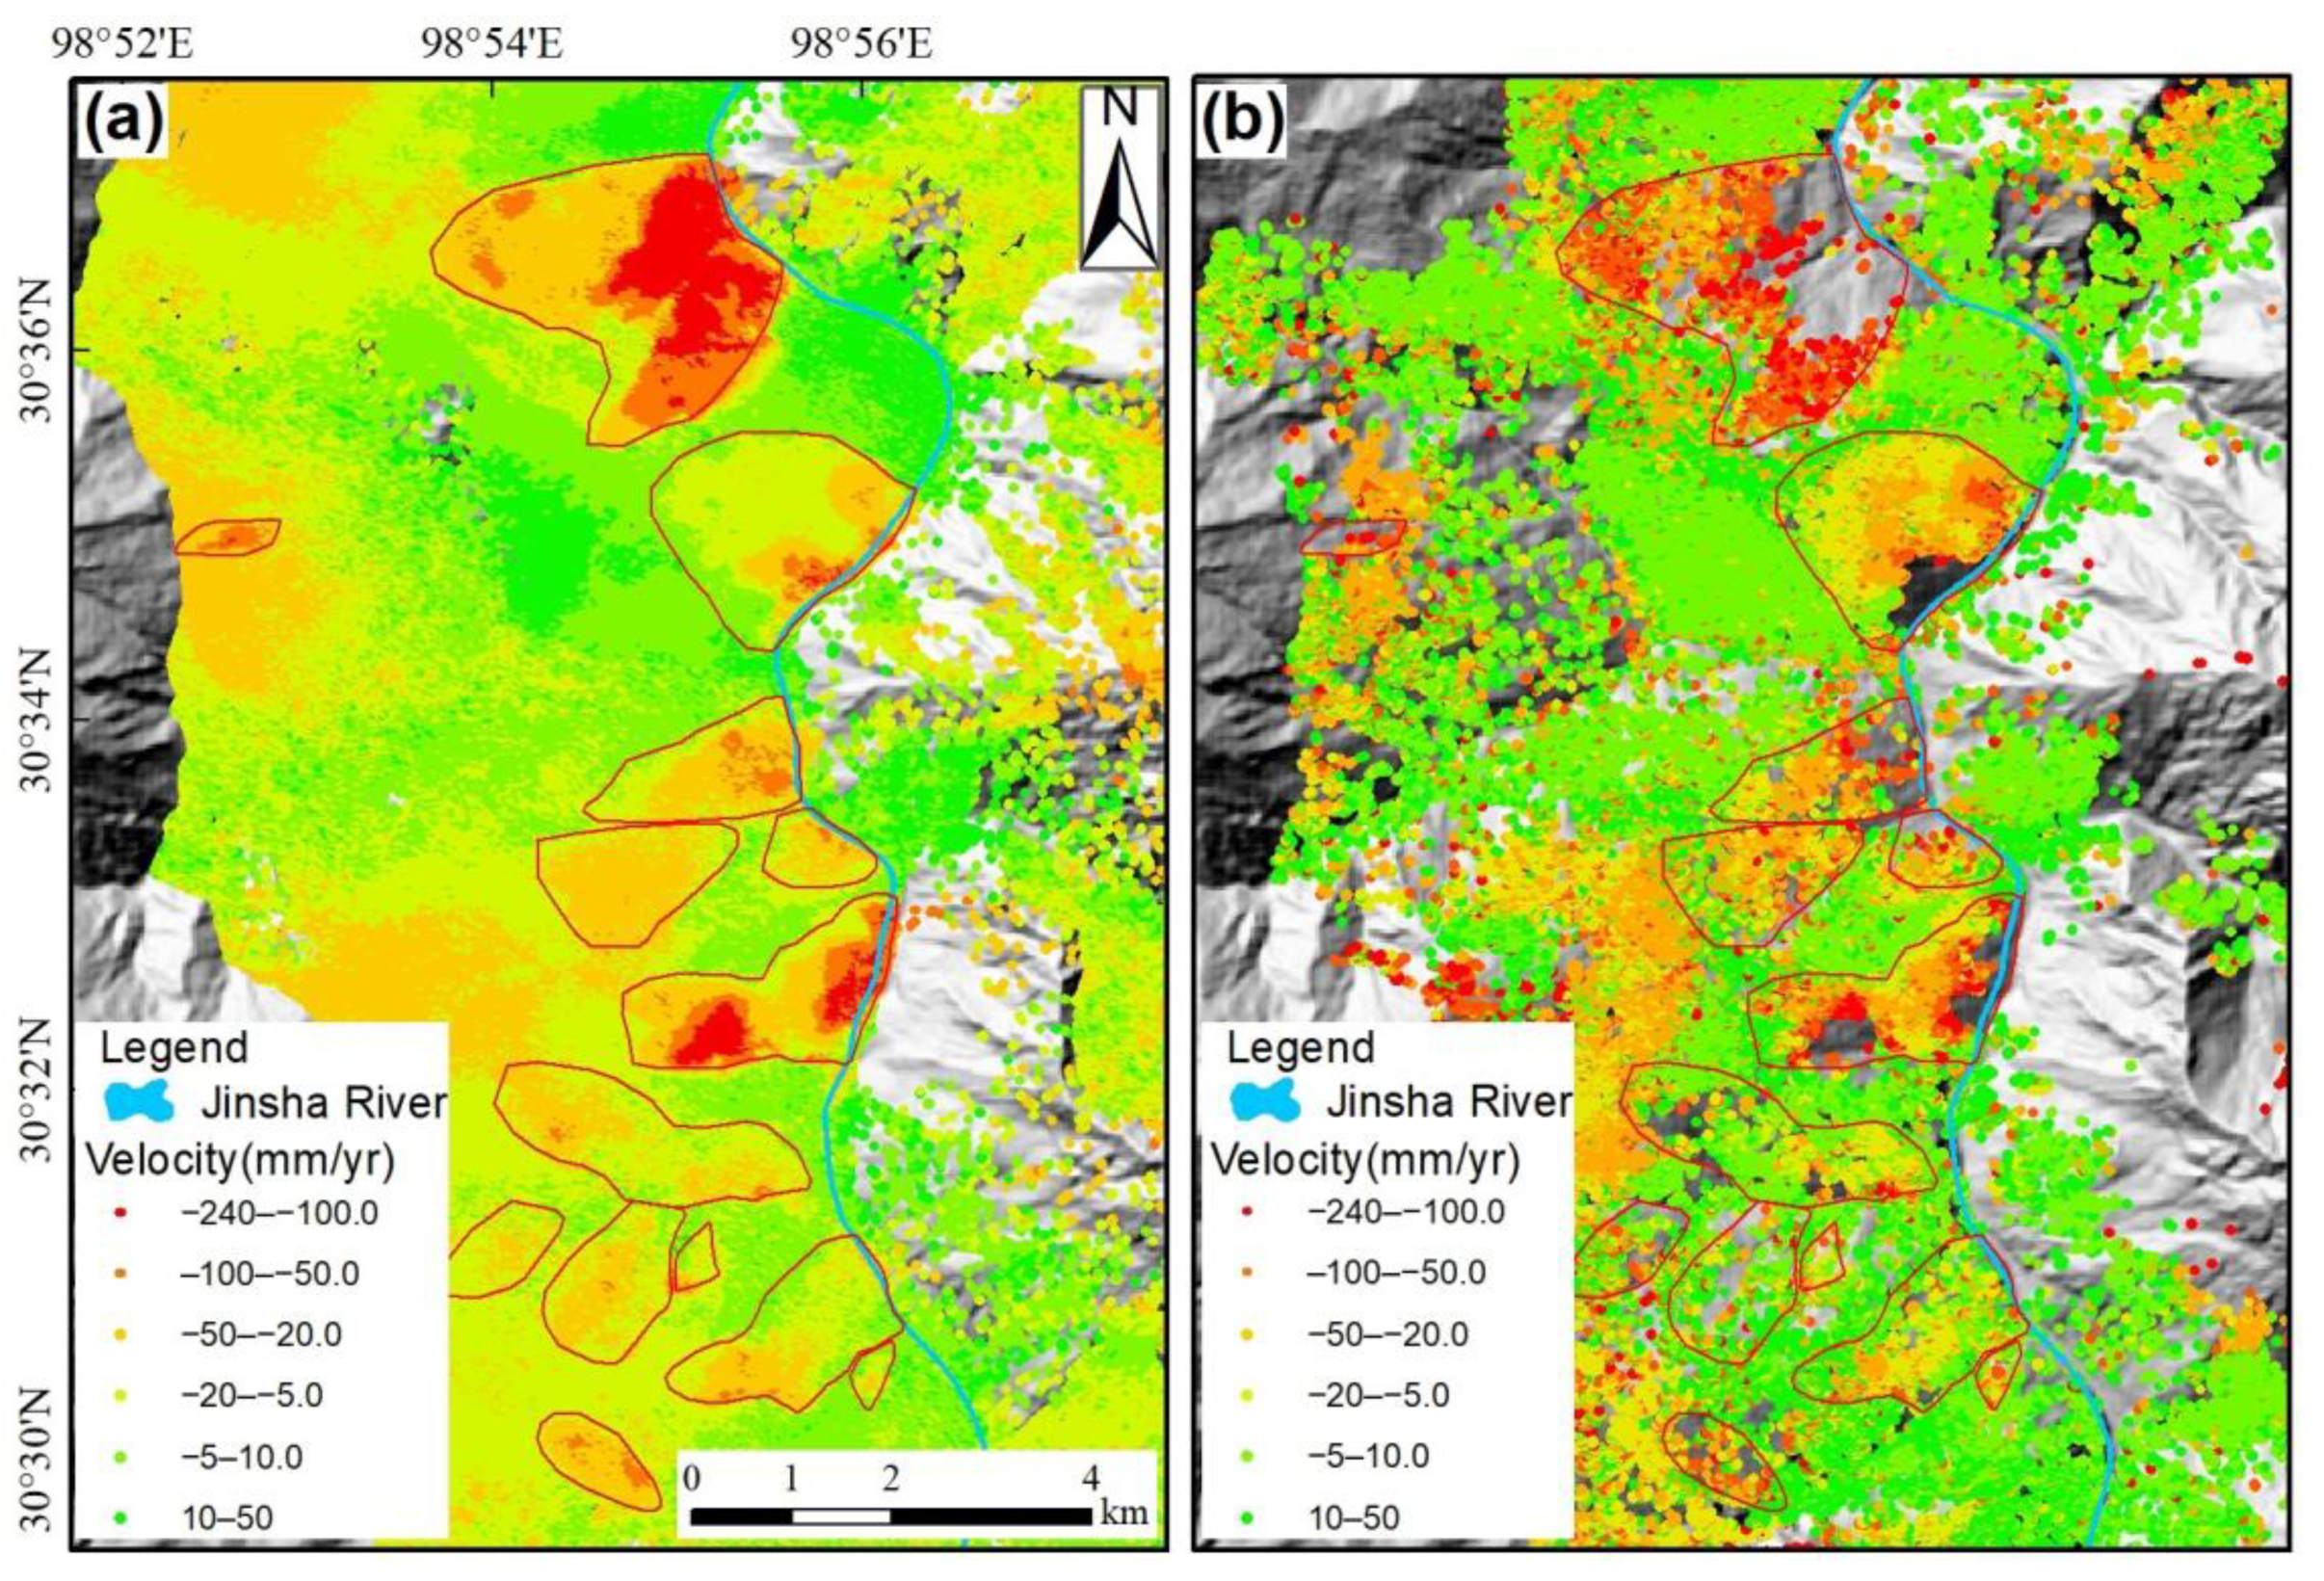
4.1. Detection and Identification of Active Landslides
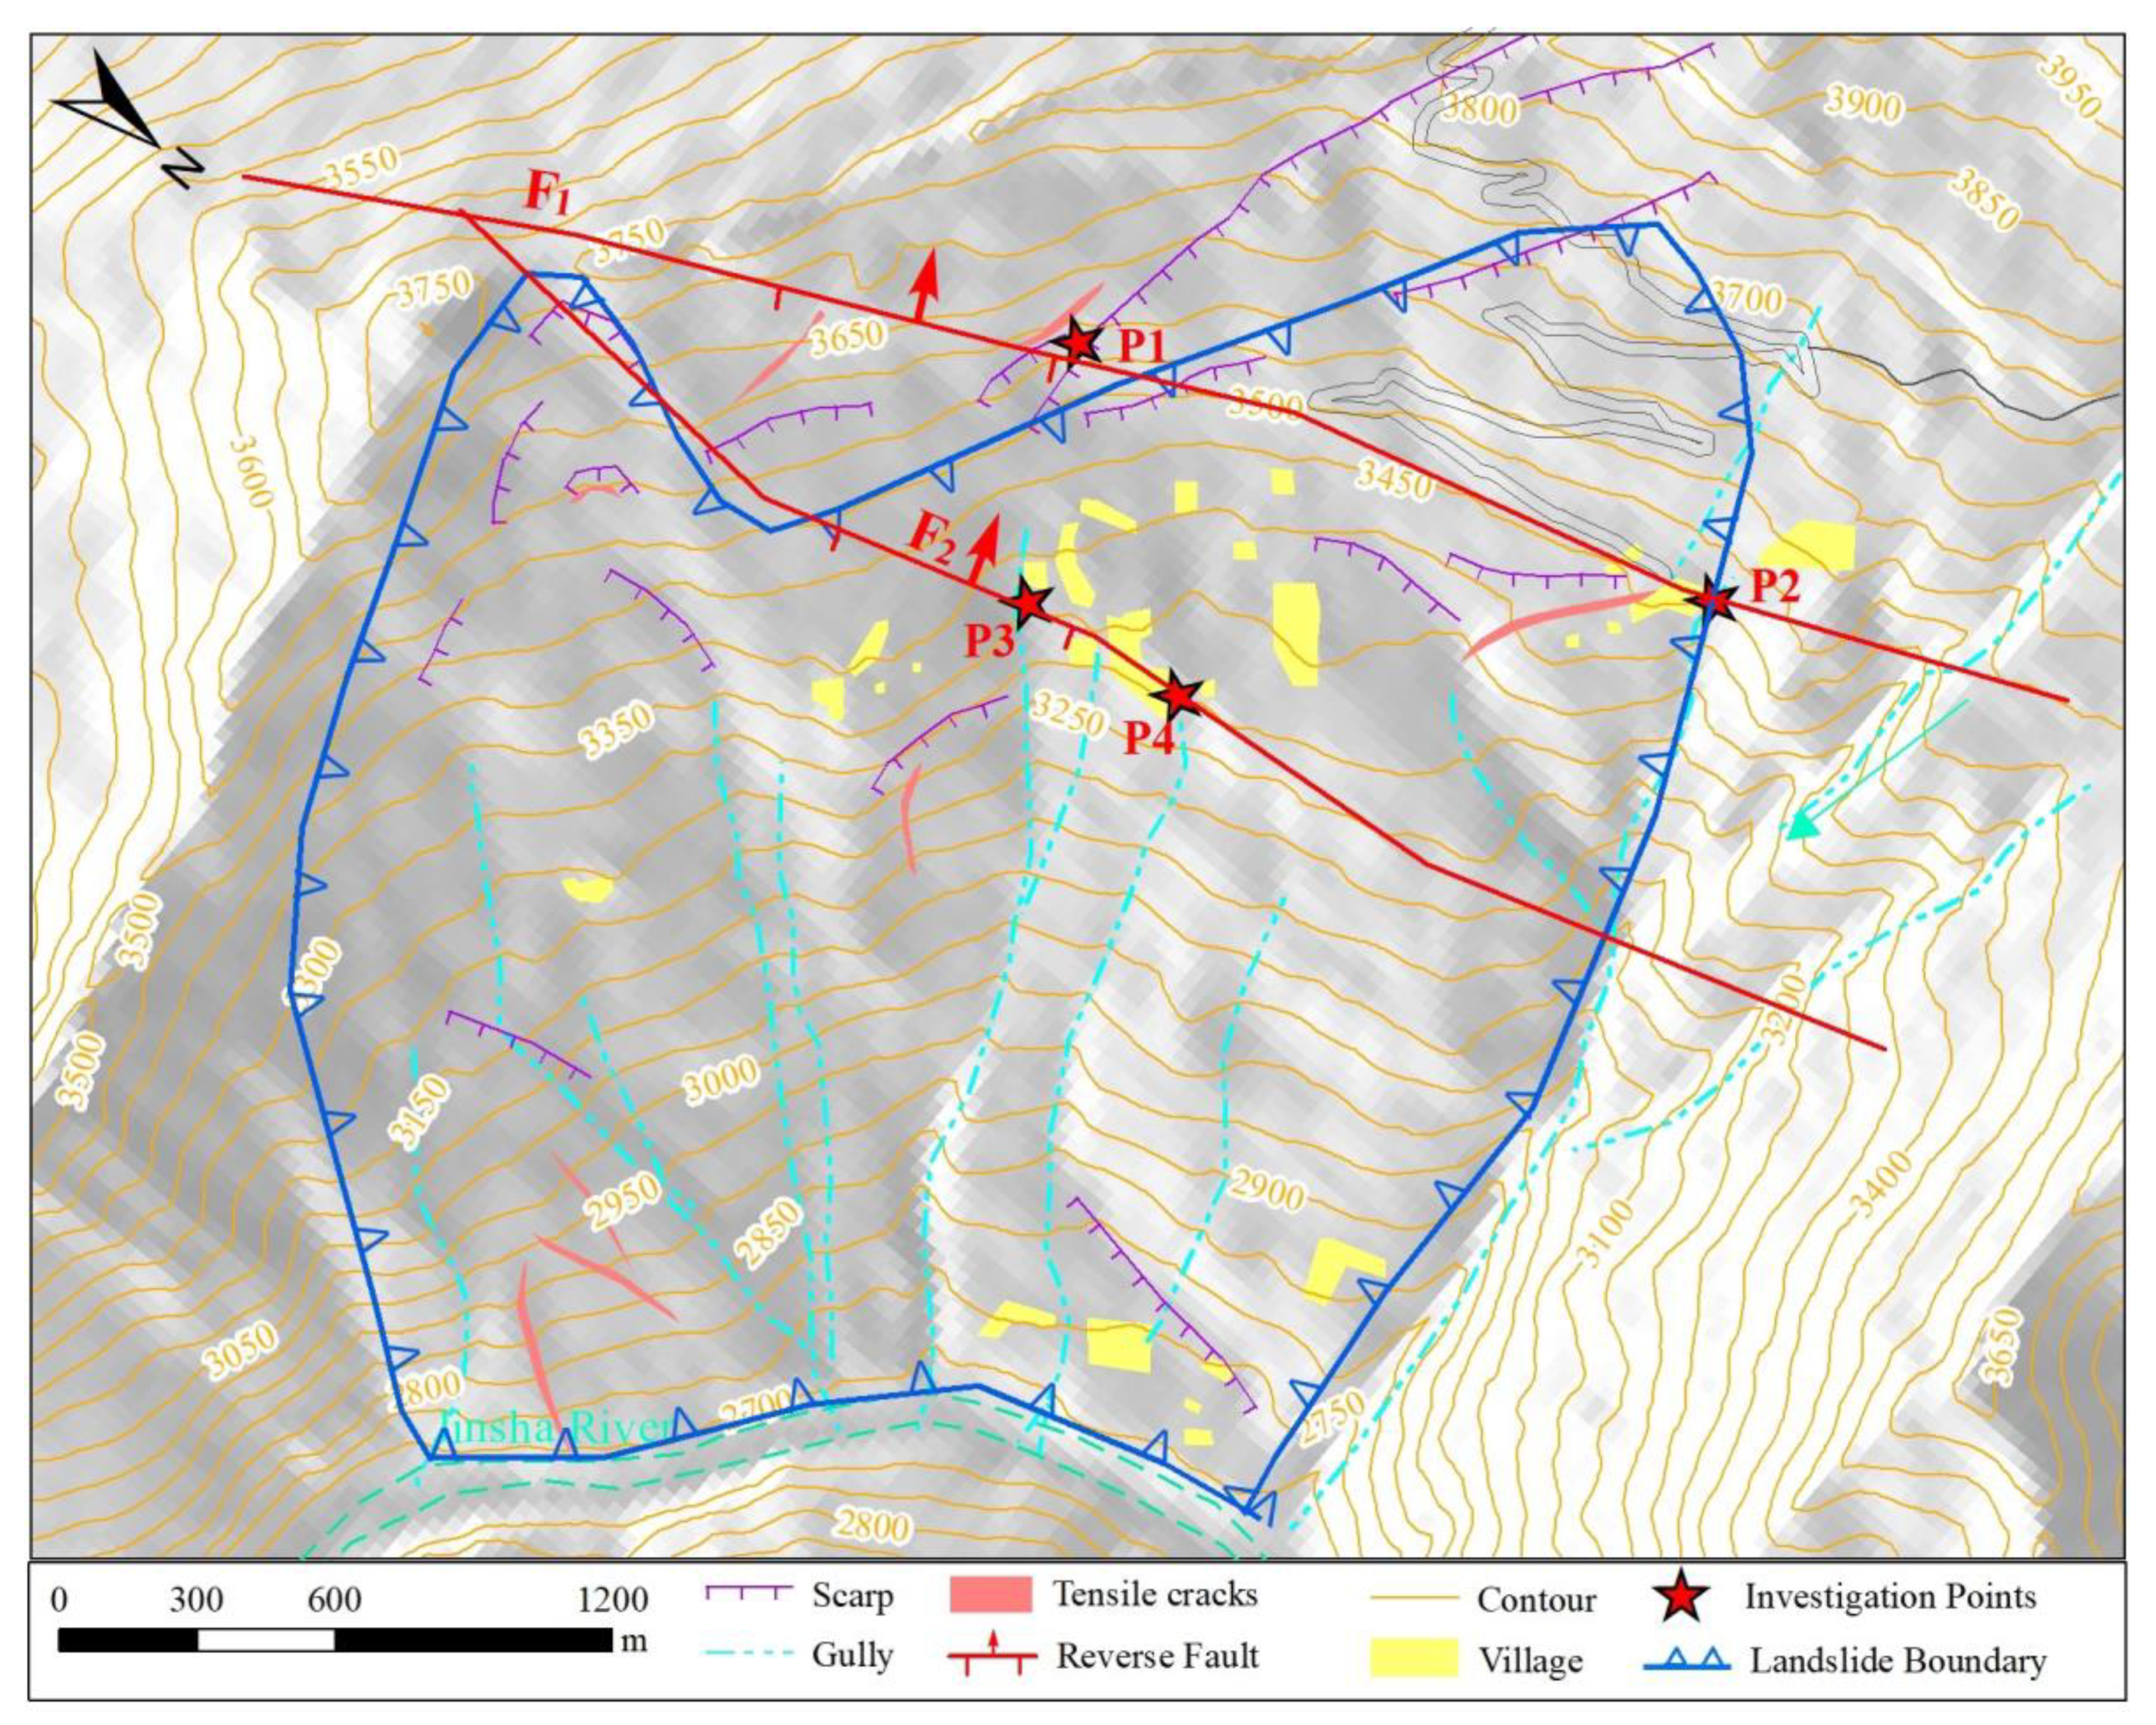
4.2. Validation of UAV Images and Field Investigation
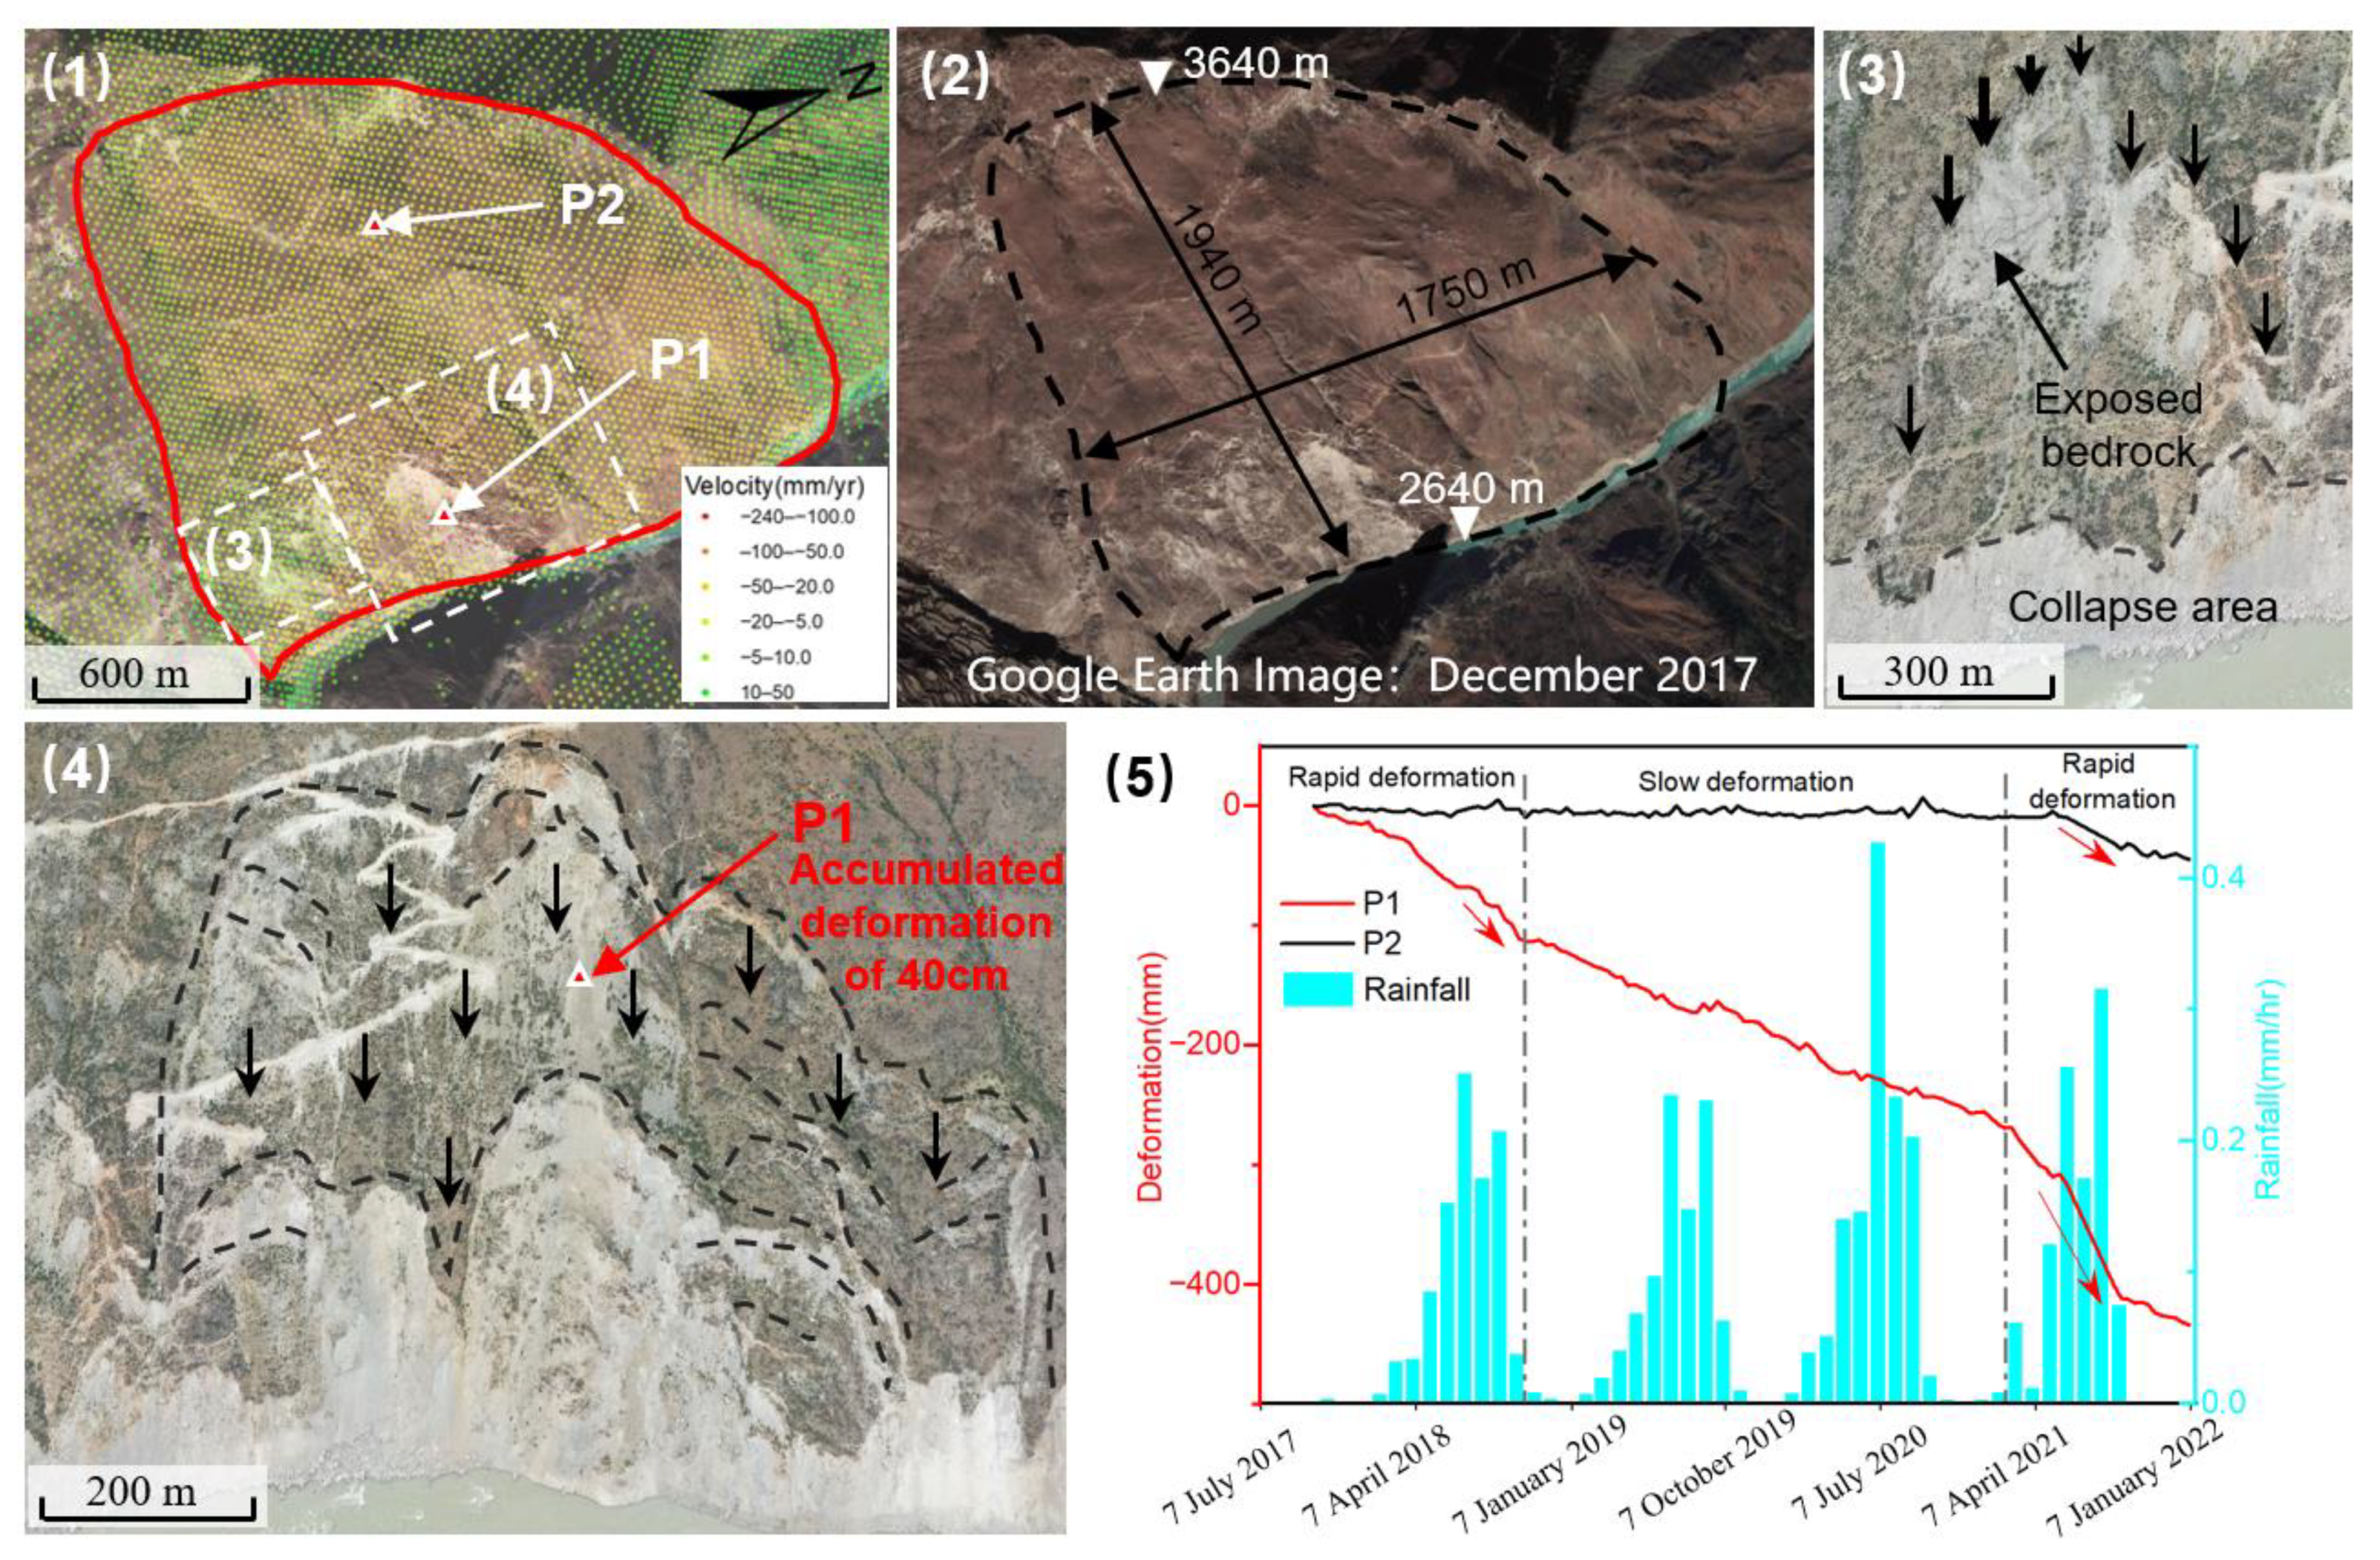
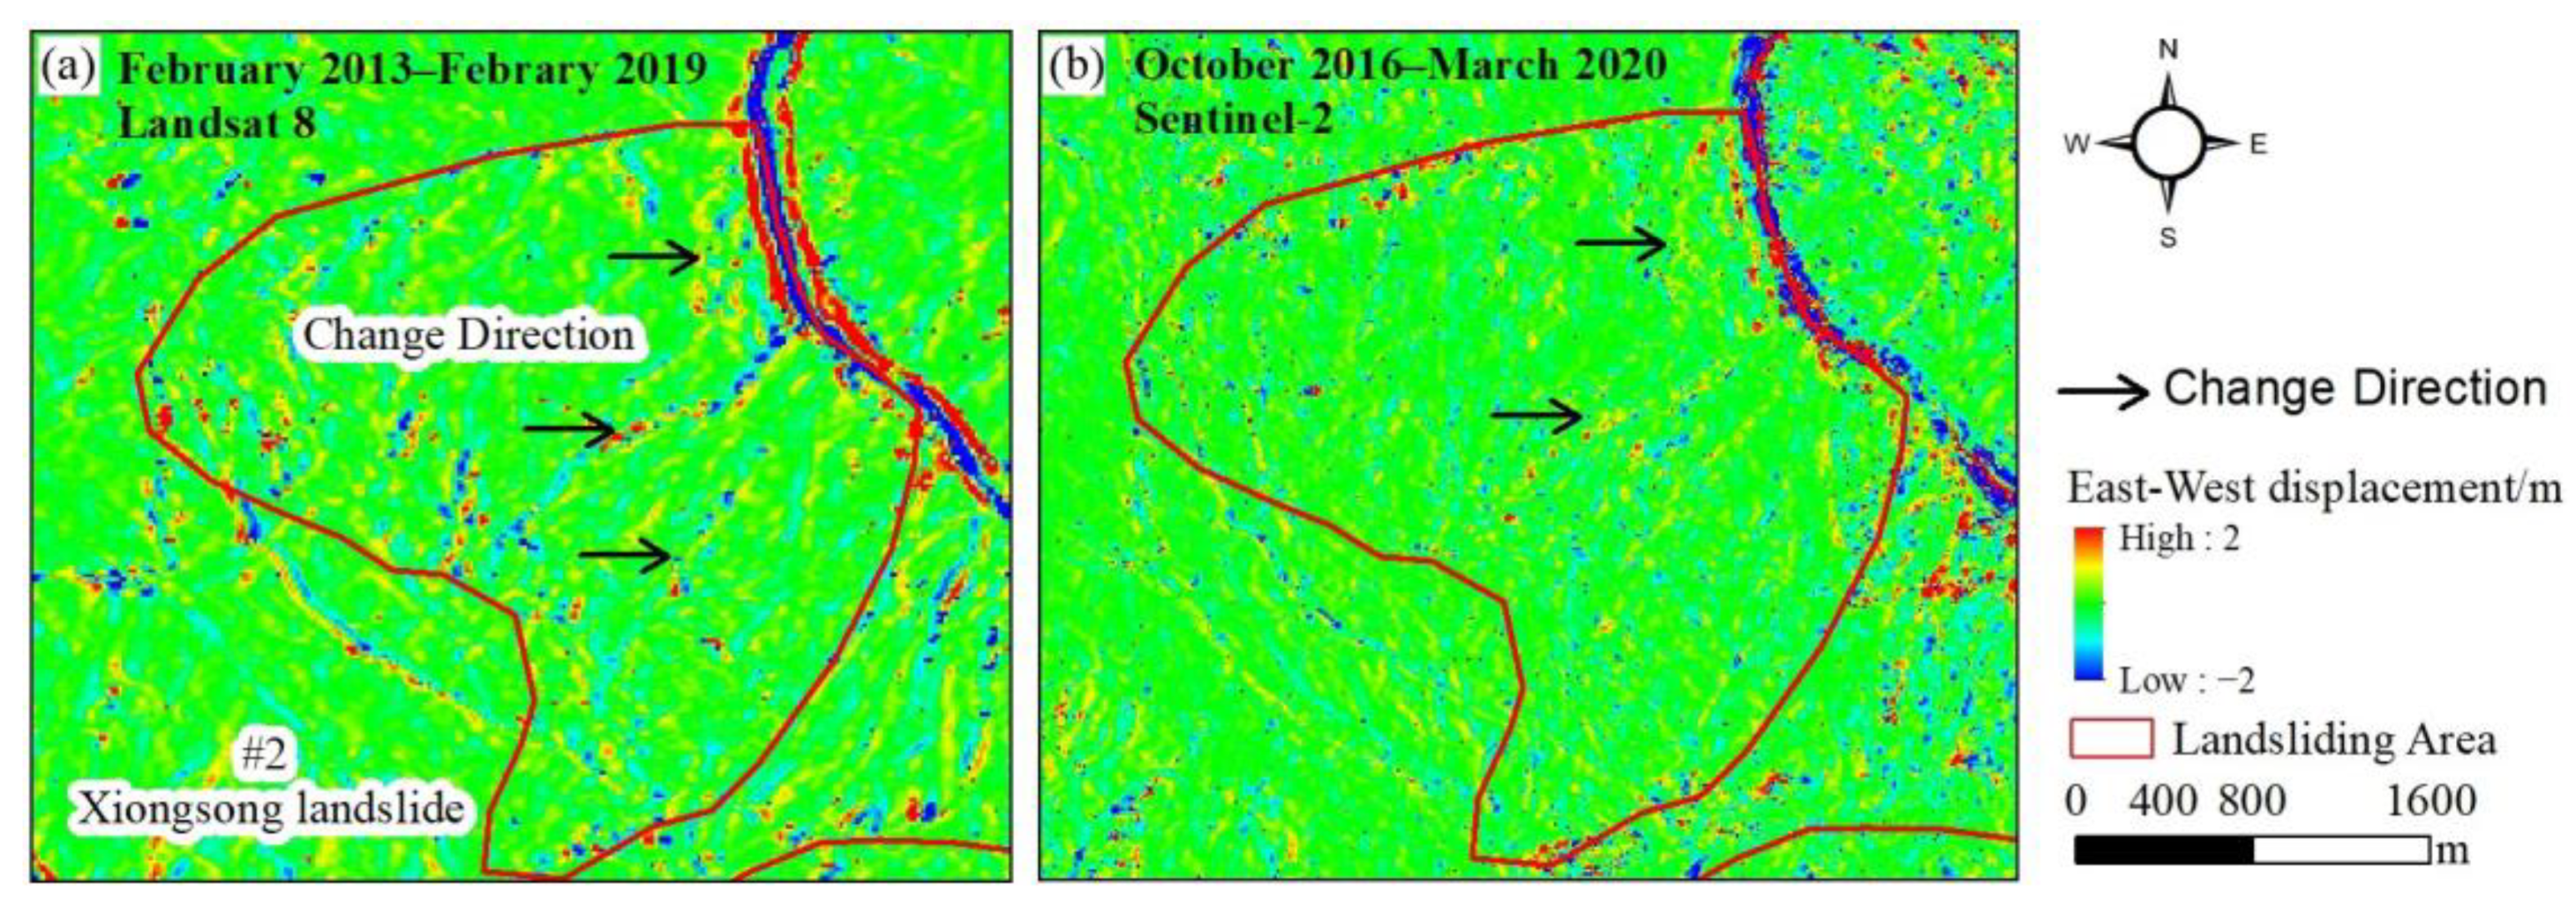
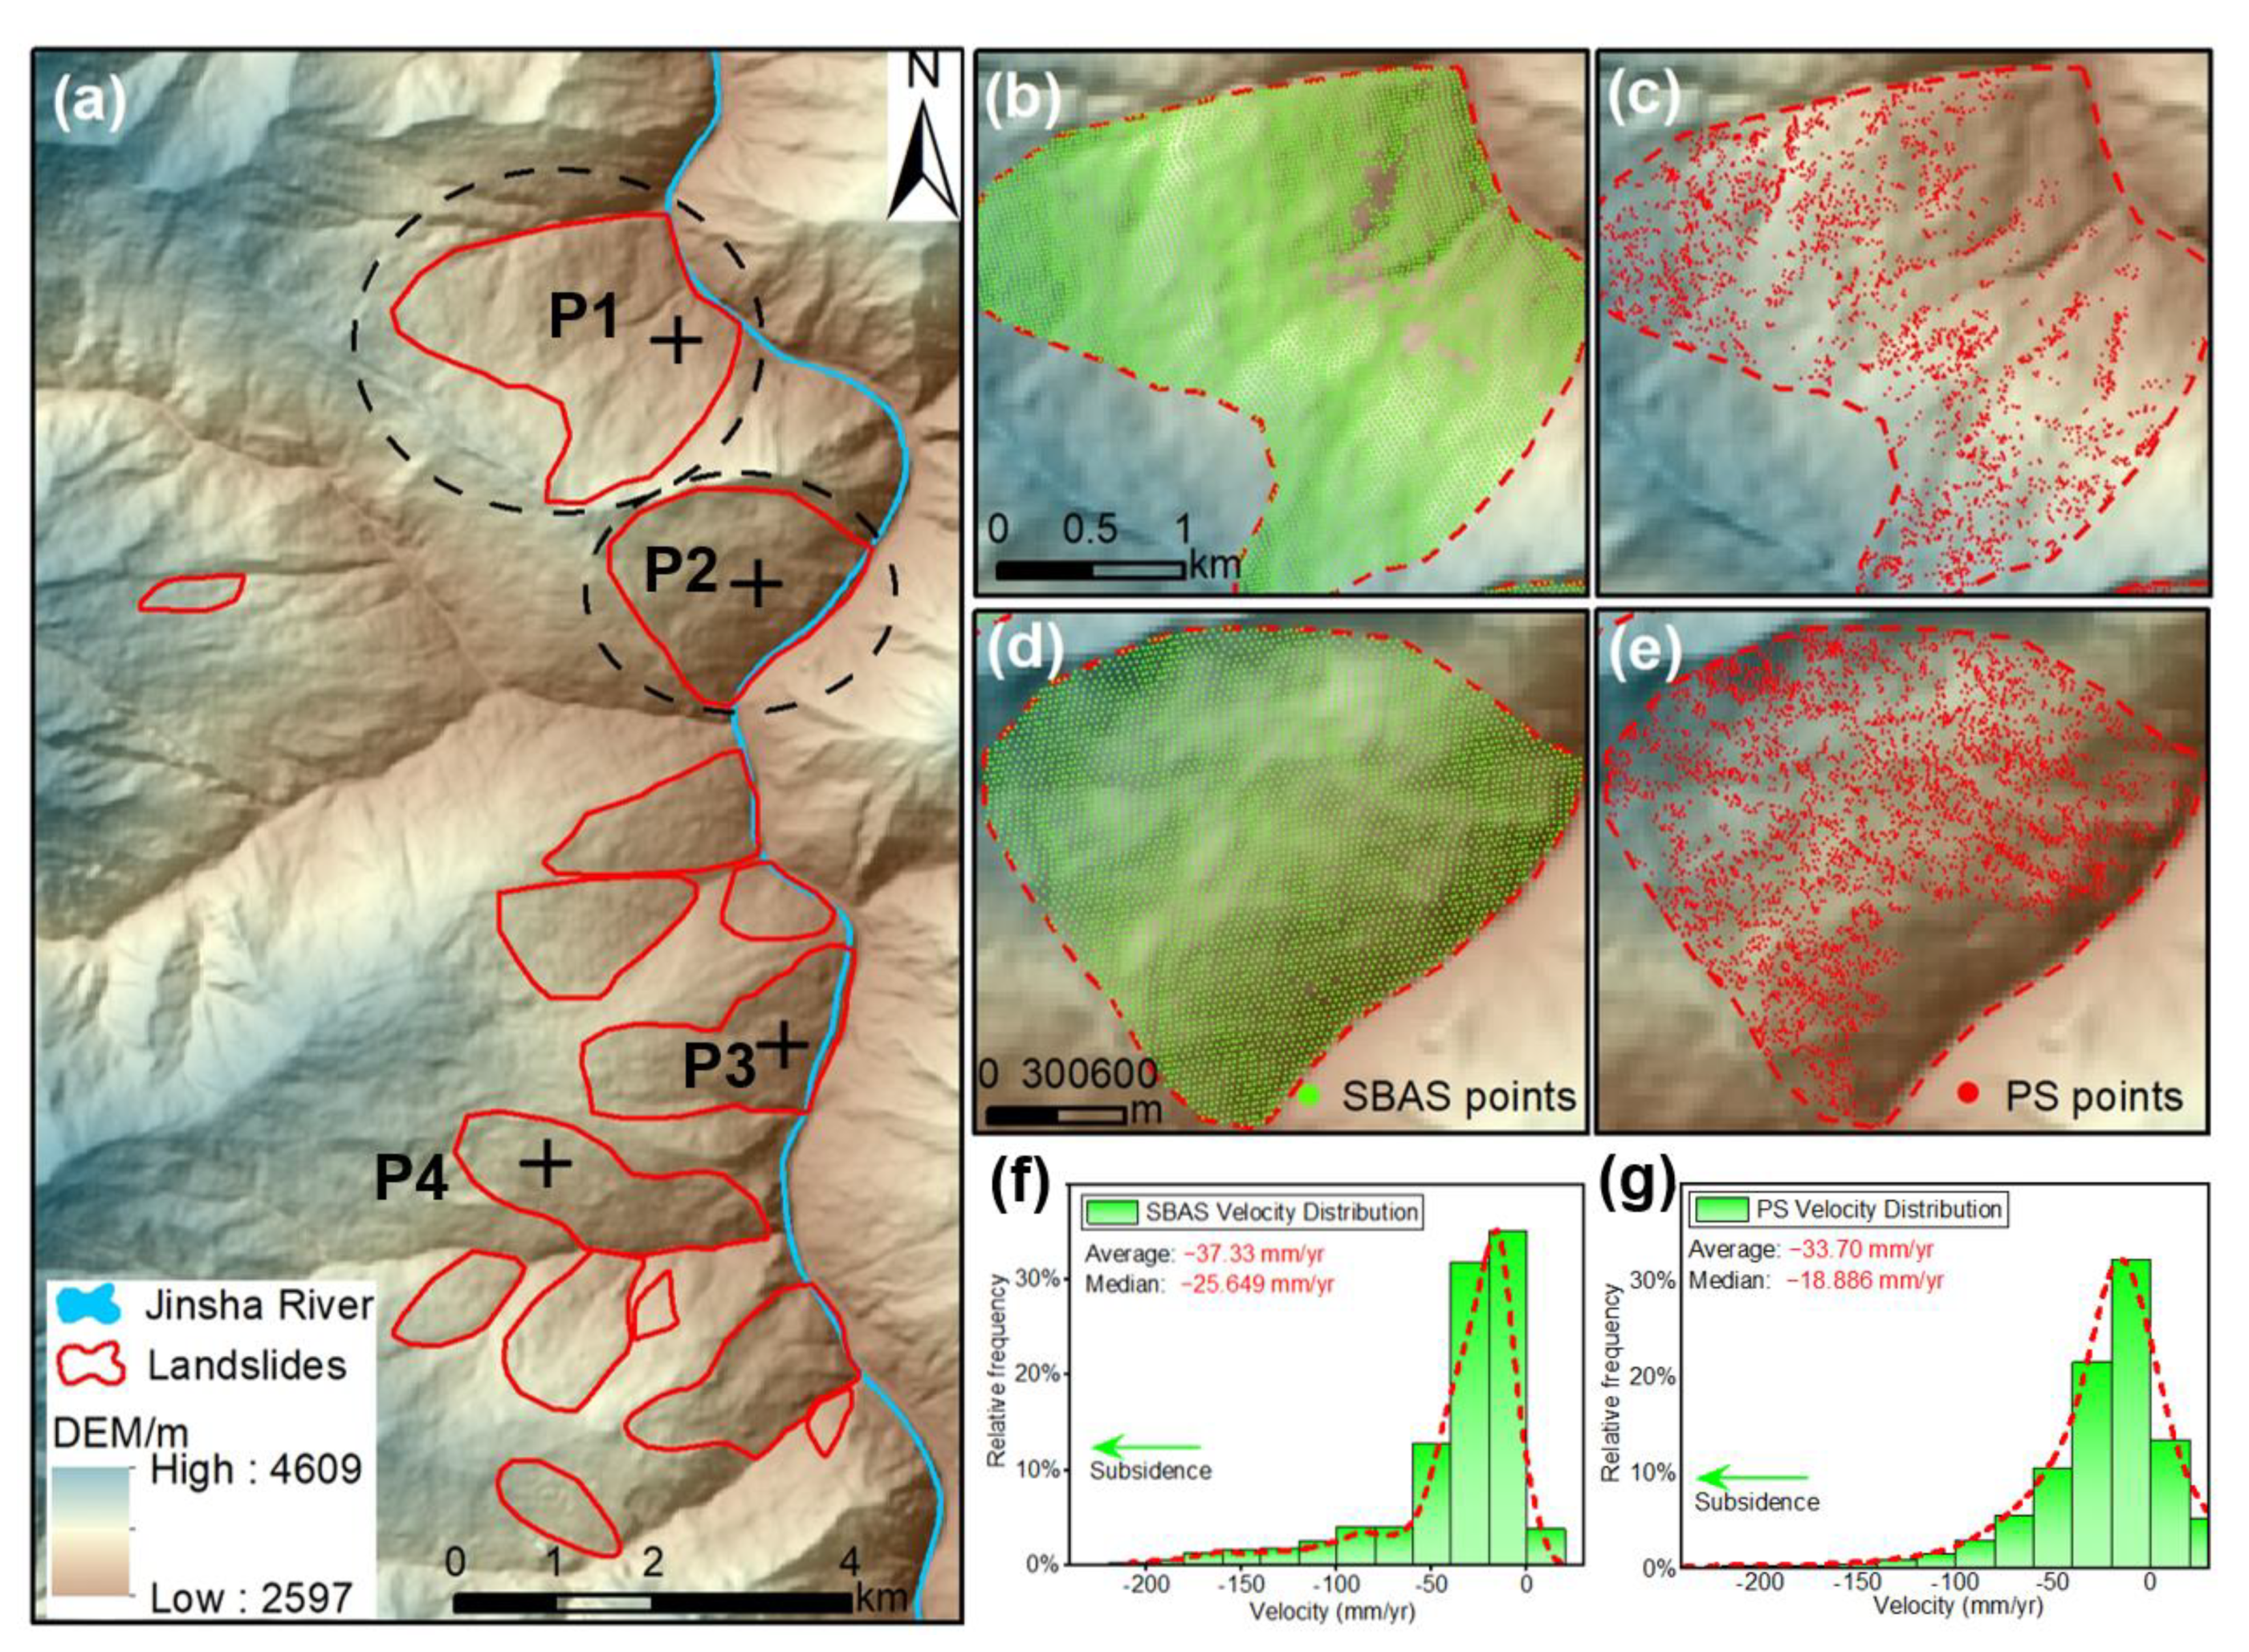
4.3. Deformation Characteristics of Two Giant Landslides
5. Discussion
5.1. Comparison between SBAS and PS-InSAR
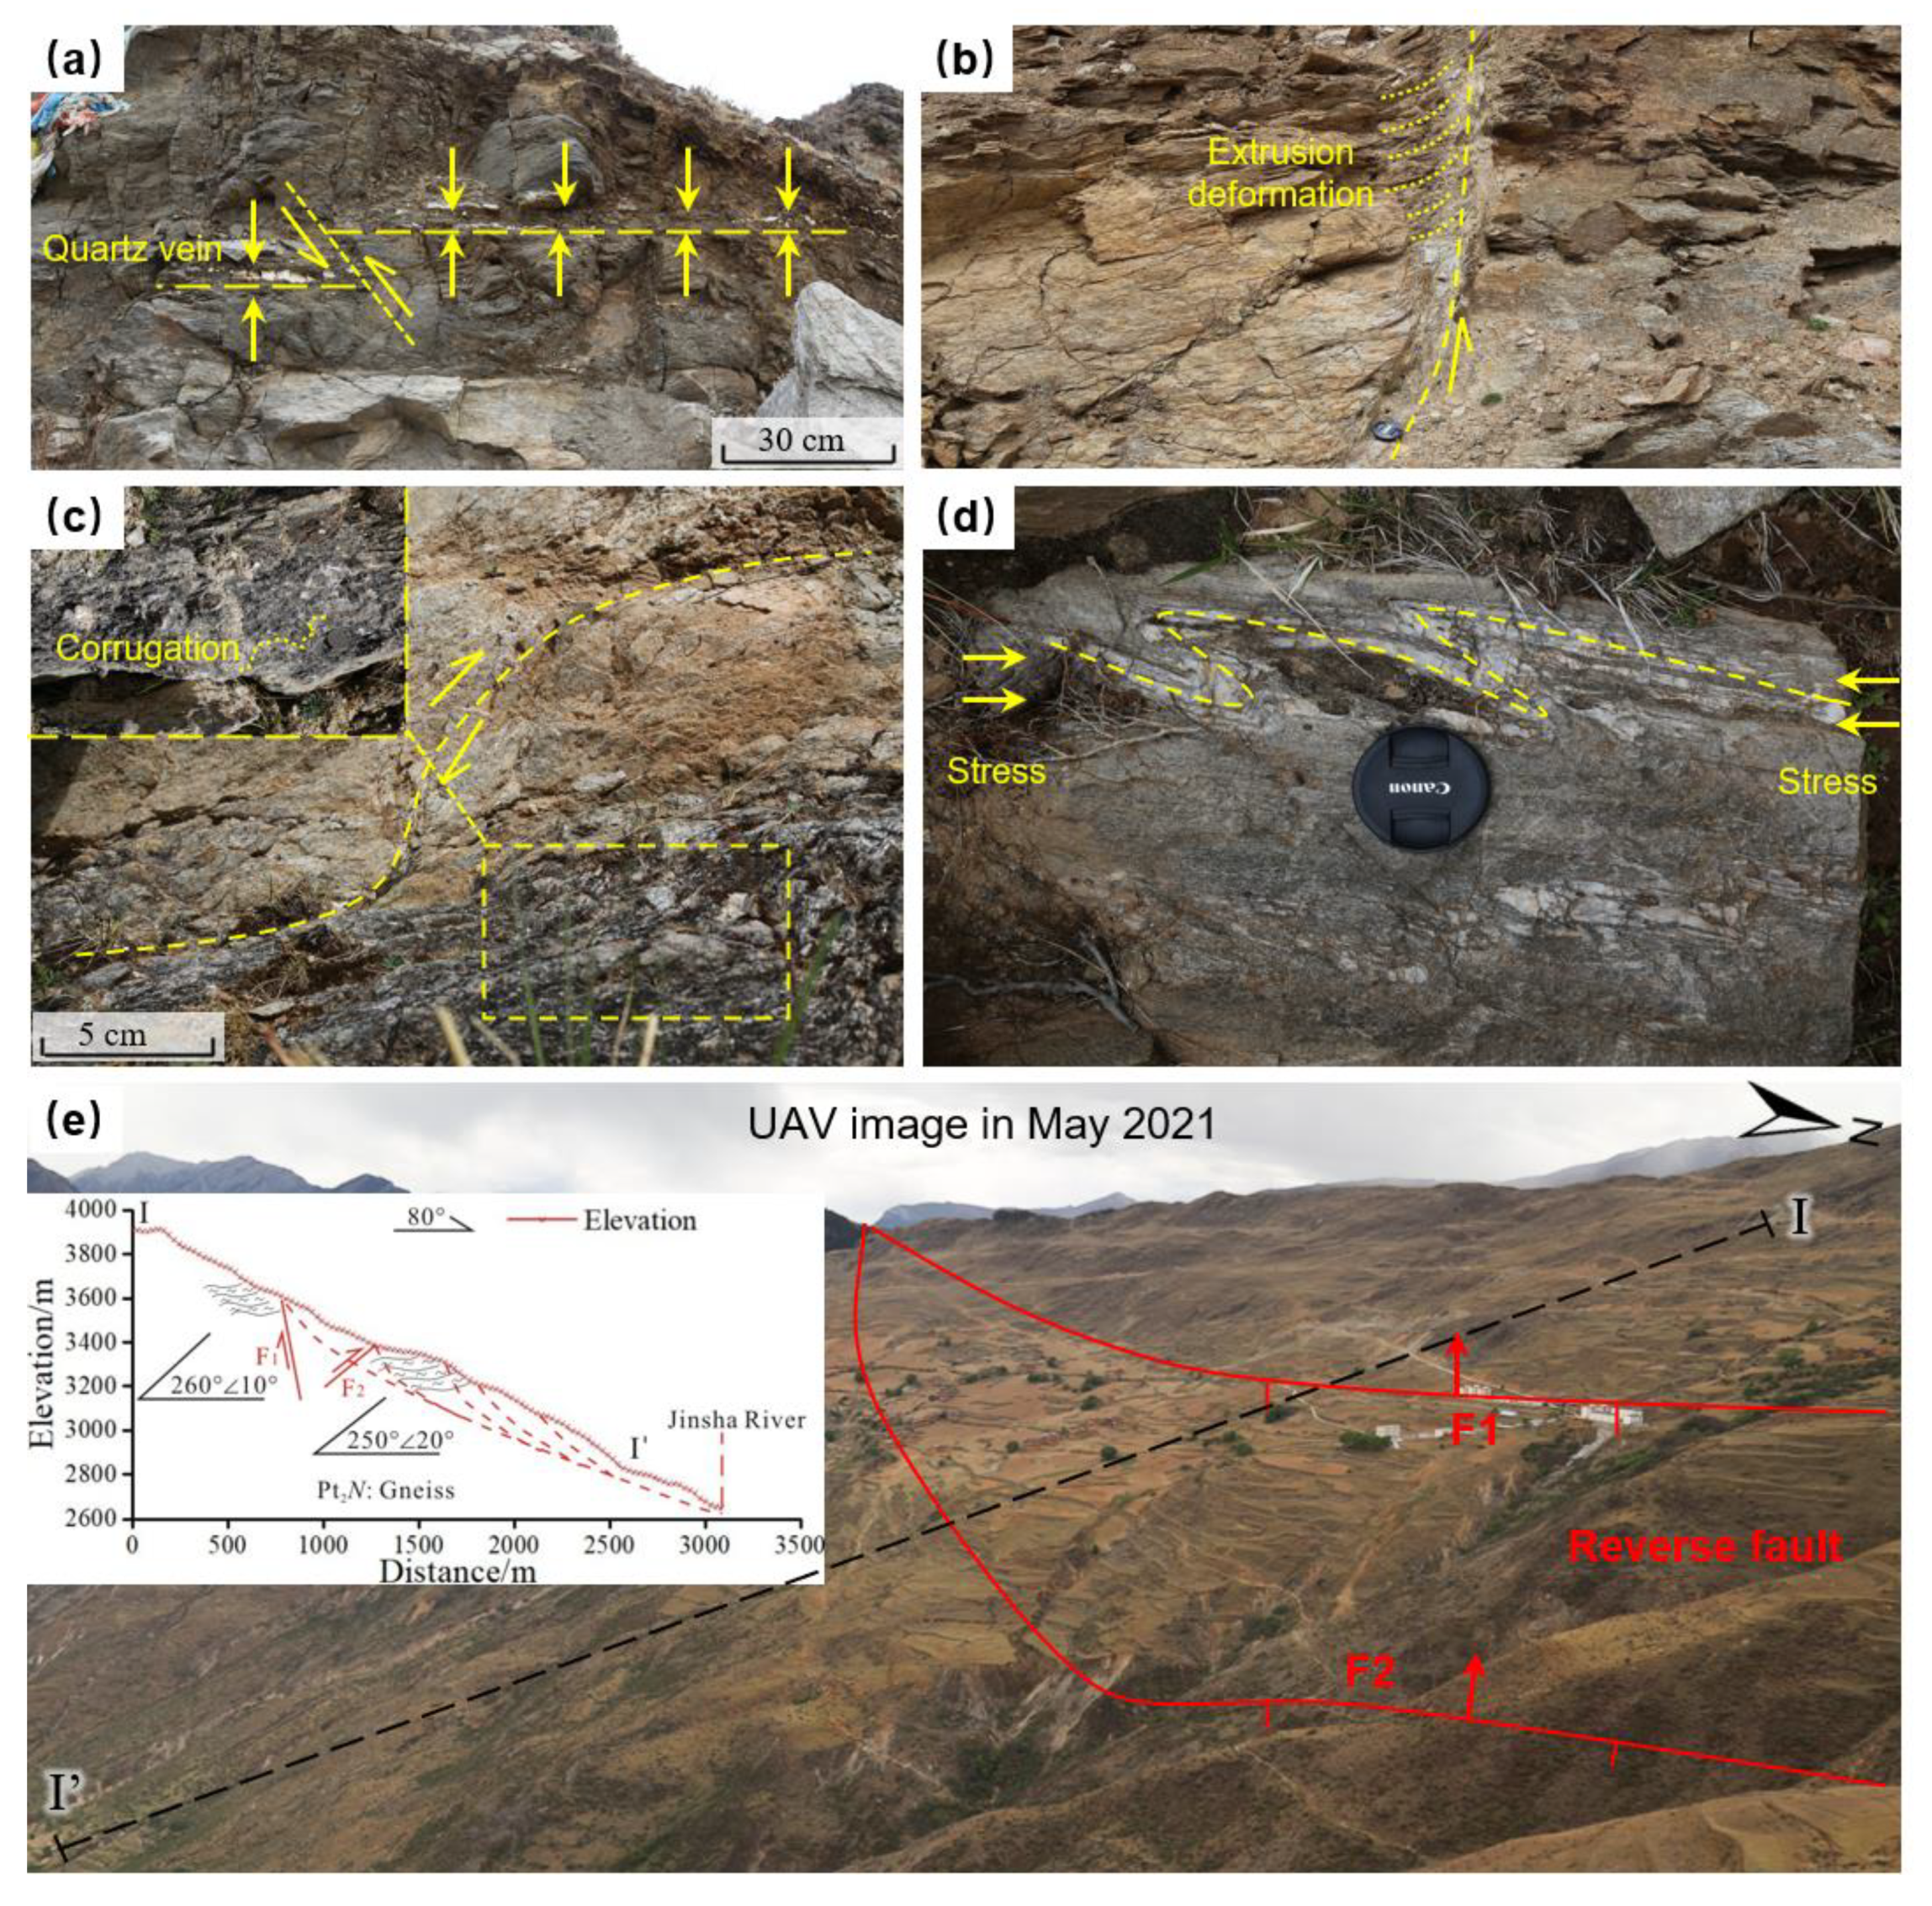
5.2. Influence of Quaternary Tectonic Activity on Landslides
6. Conclusions
Author Contributions
Funding
Data Availability Statement
Acknowledgments
Conflicts of Interest
References
- Chen, J.; Cui, Z.; Chen, R.; Zheng, X. The origin and evolution of the Temi paleolandslide-dammed lake in the upper Jinsha River. Earth Sci. Front. 2021, 28, 85–93. [Google Scholar]
- Xu, Q.; Guo, C.; Dong, X.; Li, W.; Lu, H.; Fu, H.; Liu, X. Mapping and Characterizing Displacements of Landslides with InSAR and Airborne LiDAR Technologies: A Case Study of Danba County, Southwest China. Remote Sens. 2021, 13, 4234. [Google Scholar] [CrossRef]
- Chen, S.; Chen, J.; Qiao, C.; Ma, J.; Liu, C. Application of Graphic and moment methods on the analysis of particle sizes of Dam-break accumulations by Xuelongnang ancient landslide lake in the Upper Jinsha River. Geoscience 2017, 31, 1278–1283. [Google Scholar]
- Dai, K.; Tie, Y.; Xu, Q.; Ma, Y.; Zhuo, G.; Shi, X. Early identification of potential landslide geohazards in al-pine-canyon terrain based on SAR interferometry—a case study of the middle section of yalong river. J. Radars 2020, 9, 554–568. [Google Scholar]
- Yao, X.; Li, L.; Zhang, Y.; Zhou, Z.; Liu, X. Types and characteristics of slow-moving slope geo-hazards recognized by TS-InSAR along Xianshuihe active fault in the eastern Tibet Plateau. Nat. Hazard 2017, 88, 1727–1740. [Google Scholar] [CrossRef]
- Fan, X.; Xu, Q.; Alonso-Rodriguez, A.; Subramanian, S.; Li, W.; Zheng, G.; Dong, X.; Huang, R. Successive landsliding and damming of the Jinsha River in eastern Tibet, China: Prime investigation, early warning, and emergency response. Landslides 2019, 16, 1003–1020. [Google Scholar] [CrossRef]
- Yao, X.; Deng, J.; Liu, X.; Zhou, Z.; Yao, J.; Dai, F.; Ren, K.; Li, L. Primary Recognition of Active Landslides and Development Rule Analysis for Pan Three-river-parallel Territory of Tibet Plateau. Adv. Eng. Sci. 2020, 52, 16–37. [Google Scholar]
- Zhang, Y.; Meng, X.; Dijkstra, T.A.; Jordan, C.J.; Chen, G.; Zeng, R.; Novellino, A. Forecasting the magnitude of potential landslides based on InSAR techniques. Remote Sens. Environ. 2020, 241, 111738. [Google Scholar] [CrossRef]
- Liu, X.; Zhao, C.; Zhang, Q.; Lu, Z.; Li, Z.; Yang, C.; Zhu, W.; Liu-Zeng, J.; Chen, L.; Liu, C. Integration of Sentinel-1 and ALOS/PALSAR-2 SAR datasets for mapping active landslides along the Jinsha River corridor, China. Eng. Geol. 2021, 284, 106033. [Google Scholar] [CrossRef]
- Yao, J.; Lan, H.; Li, L.; Cao, Y.; Wu, Y.; Zhang, Y.; Zhou, C. Characteristics of a rapid landsliding area along Jinsha River revealed by multi-temporal remote sensing and its risks to Sichuan-Tibet railway. Landslides 2022, 19, 703–718. [Google Scholar] [CrossRef]
- Eriksen, H.O.; Lauknes, T.R.; Larsen, Y.; Corner, G.D.; Bergh, S.G.; Dehls, J.; Kierulf, H.P. Visualizing and interpreting surface displacement patterns on unstable slopes using multi-geometry satellite SAR interferometry (2D InSAR). Remote Sens. Environ. 2017, 191, 297–312. [Google Scholar] [CrossRef]
- Intrieri, E.; Carla, T.; Gigli, G. Forecasting the time of failure of landslides at slope-scale: A literature review. Earth-Sci. Rev. 2019, 193, 333–349. [Google Scholar] [CrossRef]
- Intrieri, E.; Frodella, W.; Raspini, F.; Bardi, F.; Tofani, V. Using satellite interferometry to infer landslide sliding surface depth and geometry. Remote Sens. 2020, 12, 1462. [Google Scholar] [CrossRef]
- Zhou, C.; Cao, Y.; Hu, X.; Yin, K.; Wang, Y.; Catani, F. Enhanced dynamic landslide hazard mapping using MT-InSAR method in the Three Gorges Reservoir Area. Landslides 2022, 19, 1585–1597. [Google Scholar]
- Ferretti, A.; Prati, C.; Rocca, F. Permanent scatterers in SAR interferometry. IEEE Transctions Geosci. Remote Sens. 2001, 39, 8–20. [Google Scholar] [CrossRef]
- Ferretti, A.; Fumagalli, A.; Novali, F.; Prati, C.; Rocca, F.; Rucci, A. A New Algorithm for Processing Interferometric Data-Stacks: SqueeSAR. IEEE Transctions Geosci. Remote Sens. 2011, 49, 3460–3470. [Google Scholar]
- Berardino, P.; Fornaro, G.; Lanari, R.; Sansosti, E. A new algorithm for surface deformation monitoring based on small baseline differential SAR interferograms. IEEE Trans. Geosci. Remote Sens. 2002, 40, 2375–2383. [Google Scholar] [CrossRef]
- Zhang, L.; Ding, X.; Lu, Z. Modeling PSInSAR Time Series Without Phase Unwrapping. IEEE Transctions Geosci. Remote Sens. 2011, 49, 547–556. [Google Scholar]
- Hooper, A.; Bekaert, D.; Spaans, K.; Arikan, M. Recent advances in SAR interferometry time series analysis for measuring crustal deformation. Tectonophysics 2012, 514, 1–3. [Google Scholar]
- Dun, J.; Feng, W.; Yi, X.; Zhang, G.; Wu, M. Detection and Mapping of Active landslides before Impoundment in the Baihetan Reservoir Area (China) based on the Time-Series InSAR method. Remote Sens. 2021, 13, 3213. [Google Scholar] [CrossRef]
- Chen, F.; Zhou, W.; Tang, Y.; Li, R.; Lin, H.; Balz, T.; Luo, J.; Shi, P.; Zhu, M.; Fang, C. Remote sensing-based deformation monitoring of pagodas at the Bagan cultural heritage site, Myanmar. Int. J. Digit. Earth 2022, 15, 770–788. [Google Scholar] [CrossRef]
- Biswas, K.; Chakravarty, D.; Mitra, P.; Misra, A. Spatial-Correlation Based Persistent Scatterer Interferometric Study for Ground Deformation. J. Indian Soc. Remote Sens. 2017, 45, 913–926. [Google Scholar] [CrossRef]
- Xu, H.; Chen, F.; Zhou, W. A comparative case study of MTInSAR approaches for deformation monitoring of the cultural landscape of the Shanhaiguan section of the Great Wall. Herit. Sci. 2021, 9, 71. [Google Scholar] [CrossRef]
- Bui, L.K.; Le, P.V.V.; Dao, P.D.; Nguyen, N.Q.; Pham, H.V.; Tran, H.H.; Xie, L. Recent land deformation detected by Sentinel-1A InSAR data (2016-2020) over Hanoi, Vietnam, and the relationship with groundwater level change. GIScience Remote Sens. 2021, 58, 161–179. [Google Scholar] [CrossRef]
- Moghaddam, N.F.; Samsonov, S.V.; Rudiger, C.; Walker, J.P.; Hall, W.D.M. Multi-temporal SAR observations of the Surat Basin in Australia for deformation scenario evaluation associated with man-made interactions. Environ. Earth Sci. 2016, 75, 4. [Google Scholar] [CrossRef]
- Lu, H.; Li, W.; Xu, Q.; Dong, X.; Dai, C.; Wang, D. Detection of Landslides in the Upstream and Downstream Areas of the Baige Landslide, the Jinsha River Based on Optical Remote Sensing and InSAR Technologies. Geomat. Inf. Sci. Wuhan Univ. 2019, 44, 1342–1354. [Google Scholar]
- Cui, Y.; Bao, P.; Xu, C.; Fu, G.; Jiao, Q.; Luo, Y.; Shen, L.; Xu, X.; Liu, F.; Lyu, Y.; et al. A big landslide on the Jinsha River, Tibet, China: Geometric characteristics, causes, and future stability. Nat. Hazards 2020, 104, 2051–2070. [Google Scholar] [CrossRef]
- Yang, W.; Wang, Y.; Wang, Y.; Ma, C.; Ma, Y. Retrospective deformation of the Baige landslide using optical remote sensing images. Landslides 2019, 17, 659–668. [Google Scholar] [CrossRef]
- Li, Y.; Jiao, Q.; Hu, X.; Li, Z.; Li, B.; Zhang, J.; Jiang, W.; Luo, Y.; Li, Q.; Ba, R. Detecting the slope movement after the 2018 Baige Landslides based on ground-based and space-borne radar observations. Int. J. Appl. Earth Obs. Geoinf. 2020, 84, 101949. [Google Scholar] [CrossRef]
- Zhang, X.; Xue, R.; Wang, M.; Yu, Z.; Li, B.; Wang, B. Field investigation and analysis on flood disasters due to Baige Landslide dam break in Jinsha River. Adv. Eng. Sci. 2020, 52, 89–100. [Google Scholar]
- Goldstein, R.M.; Werner, C.L. Radar interferogram filtering for geophysical applications. Geophys. Res. Lett. 1998, 25, 4035–4038. [Google Scholar] [CrossRef]
- Baird, T.; Bristow, C.; Vermeesch, P. Measuring sand dune migration rates with COSI-Corr and Landsat: Opportunities and Challenges. Remote Sens. 2019, 11, 2423. [Google Scholar] [CrossRef]
- Yan, Y.; Guo, C.; Zhang, Y.; Zhang, X.; Zheng, Y.; Li, X.; Yang, Z.; Wu, R. Study of the deformation characteristics of the Xiongba ancient landslide based on SBAS-InSAR method, Tibet, China. Acta Geol. Sin. 2021, 95, 3556–3570. [Google Scholar]
- Li, X.; Guo, C.; Yang, Z.; Liao, W.; Wu, R.; Jin, J.; He, Y. Development characteristics and formation mechanism of the Xiongba giant ancient landslide in the Jinshajiang Tectonic Zone. Geoscience 2021, 35, 47–55. [Google Scholar]
- Li, F.; Liu, G.; Gong, H.; Chen, B.; Zhou, C. Assessing Land Subsidence-Inducing Factors in the Shandong Province, China, by Using PS-InSAR Measurements. Remote Sens. 2022, 14, 2875. [Google Scholar] [CrossRef]
- Dou, J.; Yunus, A.P.; Bui, D.T.; Merghadi, A.; Sahana, M.; Zhu, Z.; Chen, C.W.; Han, Z.; Pham, B.T. Improved landslide assessment using support vector machine with bagging, boosting, and stacking ensemble machine learning framework in a mountainous watershed, Japan. Landslides 2020, 17, 641–658. [Google Scholar] [CrossRef]
- Guzzetti, F.; Reichenbach, P.; Cardinali, M.; Galli, M.; Ardizzone, F. Probabilistic landslide hazard assessment at the basin scale. Geomorphology 2005, 72, 272–299. [Google Scholar] [CrossRef]
- Marjanovic, M.; Kovacevic, M.; Bajat, B.; Vozenilek, V. Landslide susceptibility assessment using SVM machine learning algorithm. Eng. Geol. 2011, 123, 225–234. [Google Scholar]


| Data | Resolution | Date | Number | Source |
|---|---|---|---|---|
| Sentinel-1 | Range 2.3 m, azimuth 14 m | 8 October 2017–22 December 2021 | 119 | https://search.asf.alaska.edu accessed on 1 January 2022 |
| Elevation | 30 m | - | 1 | United States Geological Survey SRTM accessed on 1 January 2022 |
| UAV images | cm | 1 May 2021–1 June 2021 | 10 | - |
| Precipitation | 10 km | 1 October 2017–22 December 2021 | daily | NASA. https://pmm.nasa.gov accessed on 2 January 2022 |
| Sentinel-2 | 10 m | 1 October 2016\1 March 2020 | 2 | https://search.asf.alaska.edu accessed on 2 January 2022 |
| Landsat 8 | 15 m | 1 February 2013/1 February 2019 | 2 | https://earthexplorer.usgs.gov accessed on 3 January 2022 |
Publisher’s Note: MDPI stays neutral with regard to jurisdictional claims in published maps and institutional affiliations. |
© 2022 by the authors. Licensee MDPI, Basel, Switzerland. This article is an open access article distributed under the terms and conditions of the Creative Commons Attribution (CC BY) license (https://creativecommons.org/licenses/by/4.0/).
Share and Cite
Yao, J.; Yao, X.; Liu, X. Landslide Detection and Mapping Based on SBAS-InSAR and PS-InSAR: A Case Study in Gongjue County, Tibet, China. Remote Sens. 2022, 14, 4728. https://doi.org/10.3390/rs14194728
Yao J, Yao X, Liu X. Landslide Detection and Mapping Based on SBAS-InSAR and PS-InSAR: A Case Study in Gongjue County, Tibet, China. Remote Sensing. 2022; 14(19):4728. https://doi.org/10.3390/rs14194728
Chicago/Turabian StyleYao, Jiaming, Xin Yao, and Xinghong Liu. 2022. "Landslide Detection and Mapping Based on SBAS-InSAR and PS-InSAR: A Case Study in Gongjue County, Tibet, China" Remote Sensing 14, no. 19: 4728. https://doi.org/10.3390/rs14194728
APA StyleYao, J., Yao, X., & Liu, X. (2022). Landslide Detection and Mapping Based on SBAS-InSAR and PS-InSAR: A Case Study in Gongjue County, Tibet, China. Remote Sensing, 14(19), 4728. https://doi.org/10.3390/rs14194728