Relationship between Topological Structure and Ecosystem Services of Forest Grass Ecospatial Network in China
Abstract
1. Introduction
2. Materials
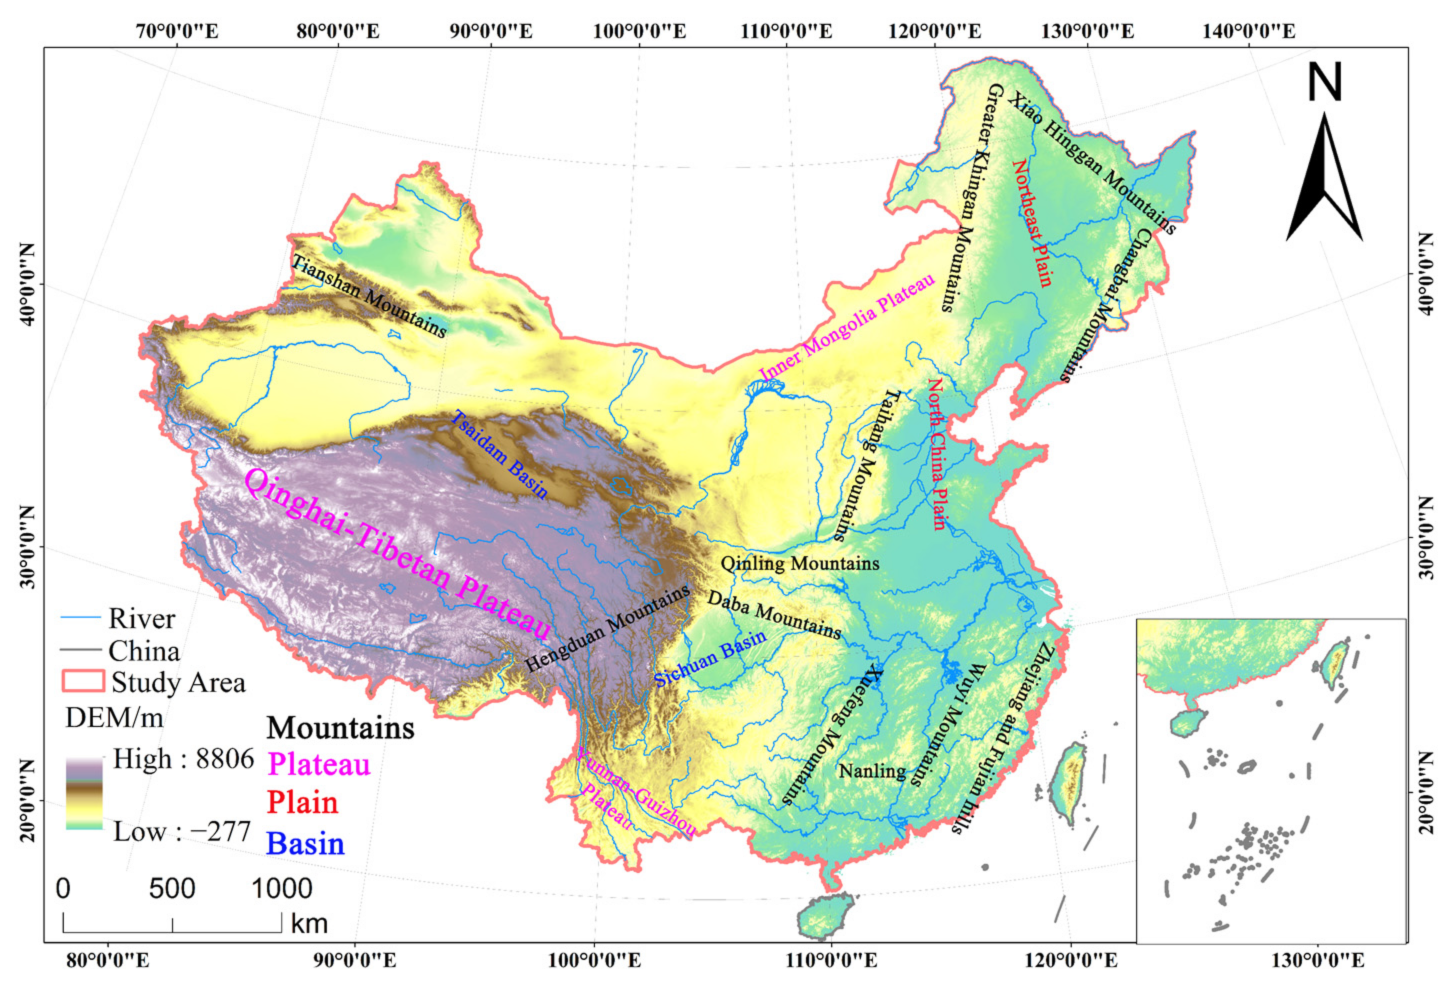
2.1. Study Area
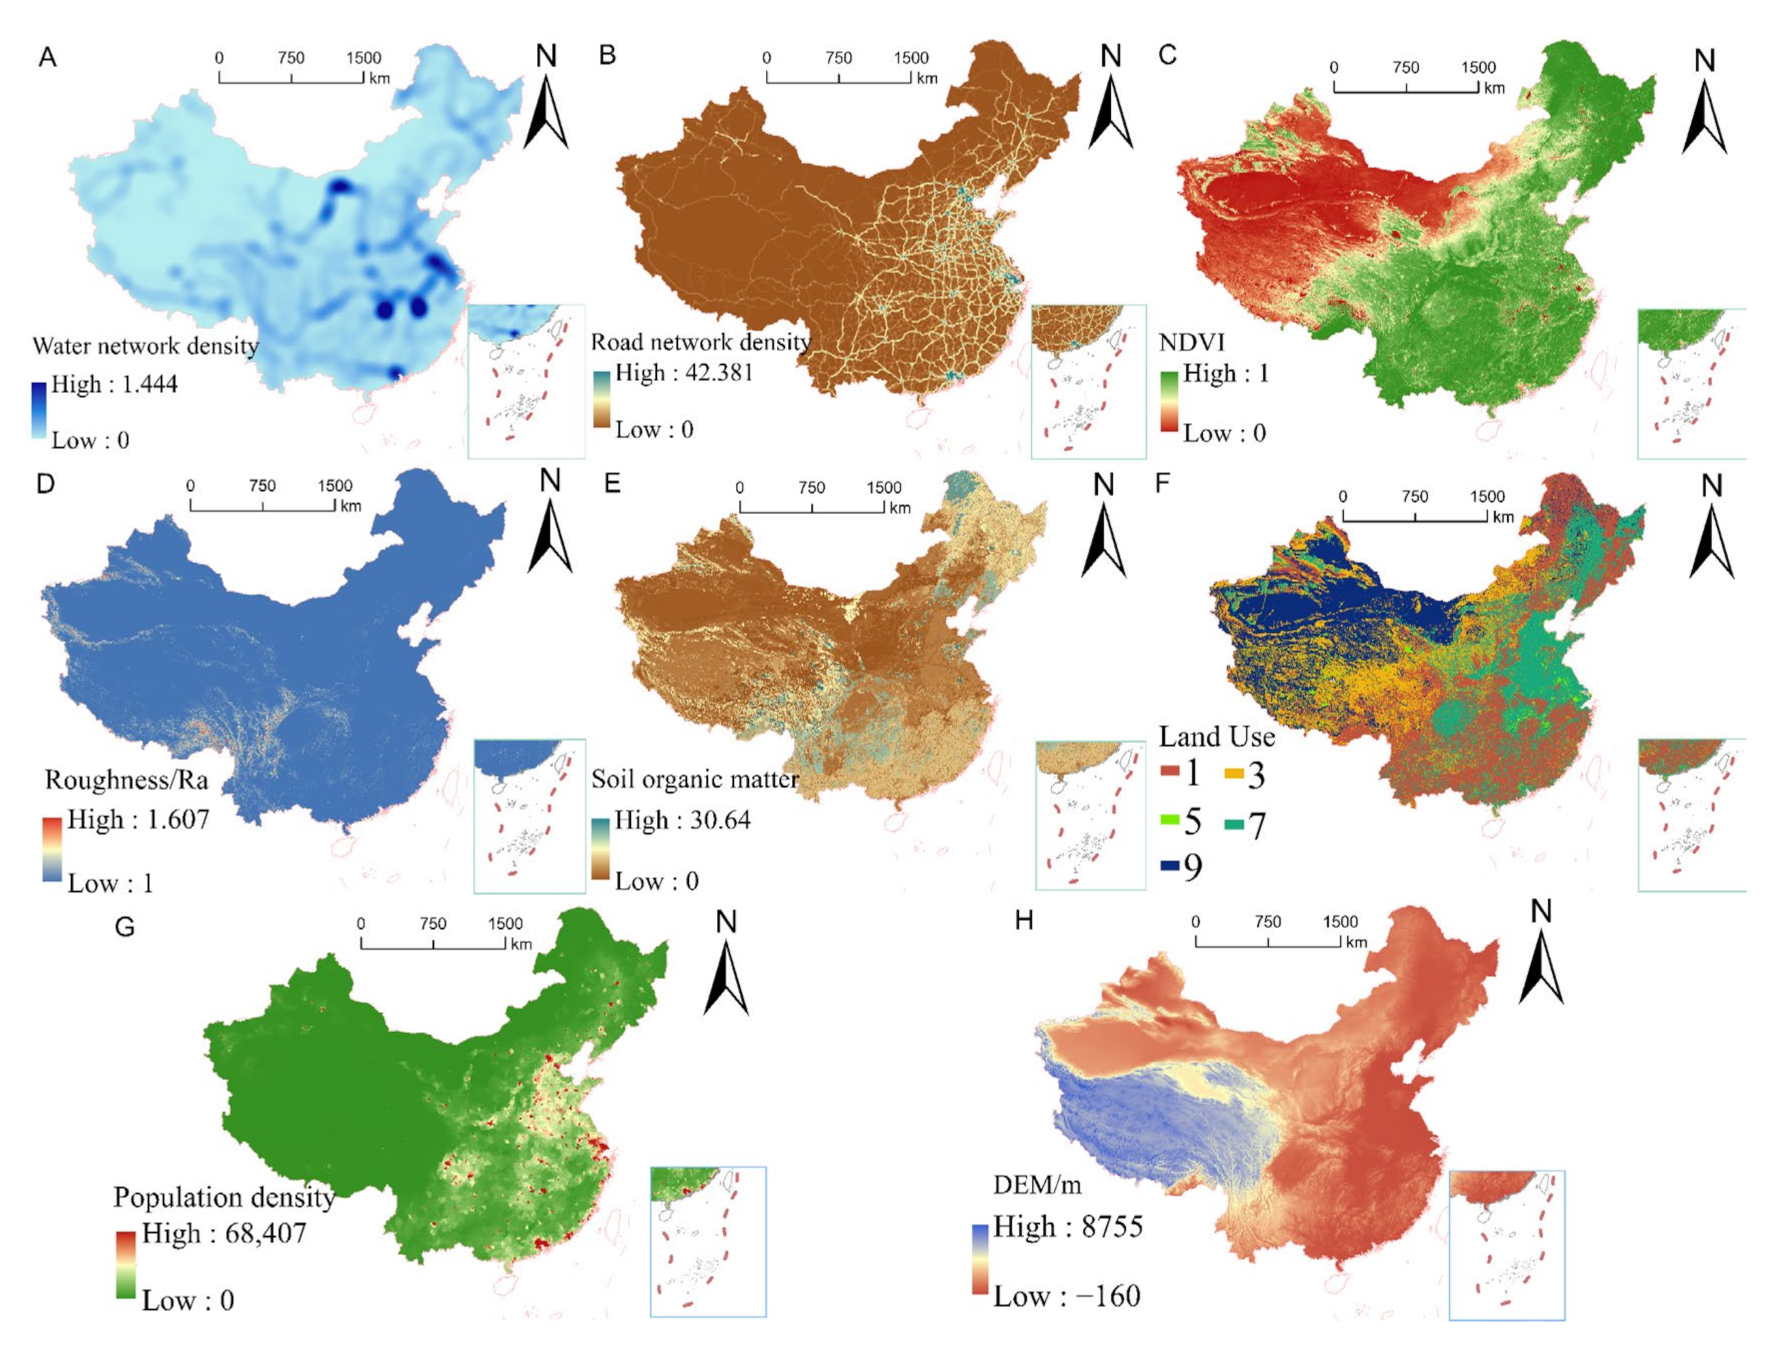
2.2. Data Sources and Descriptions
3. Methods
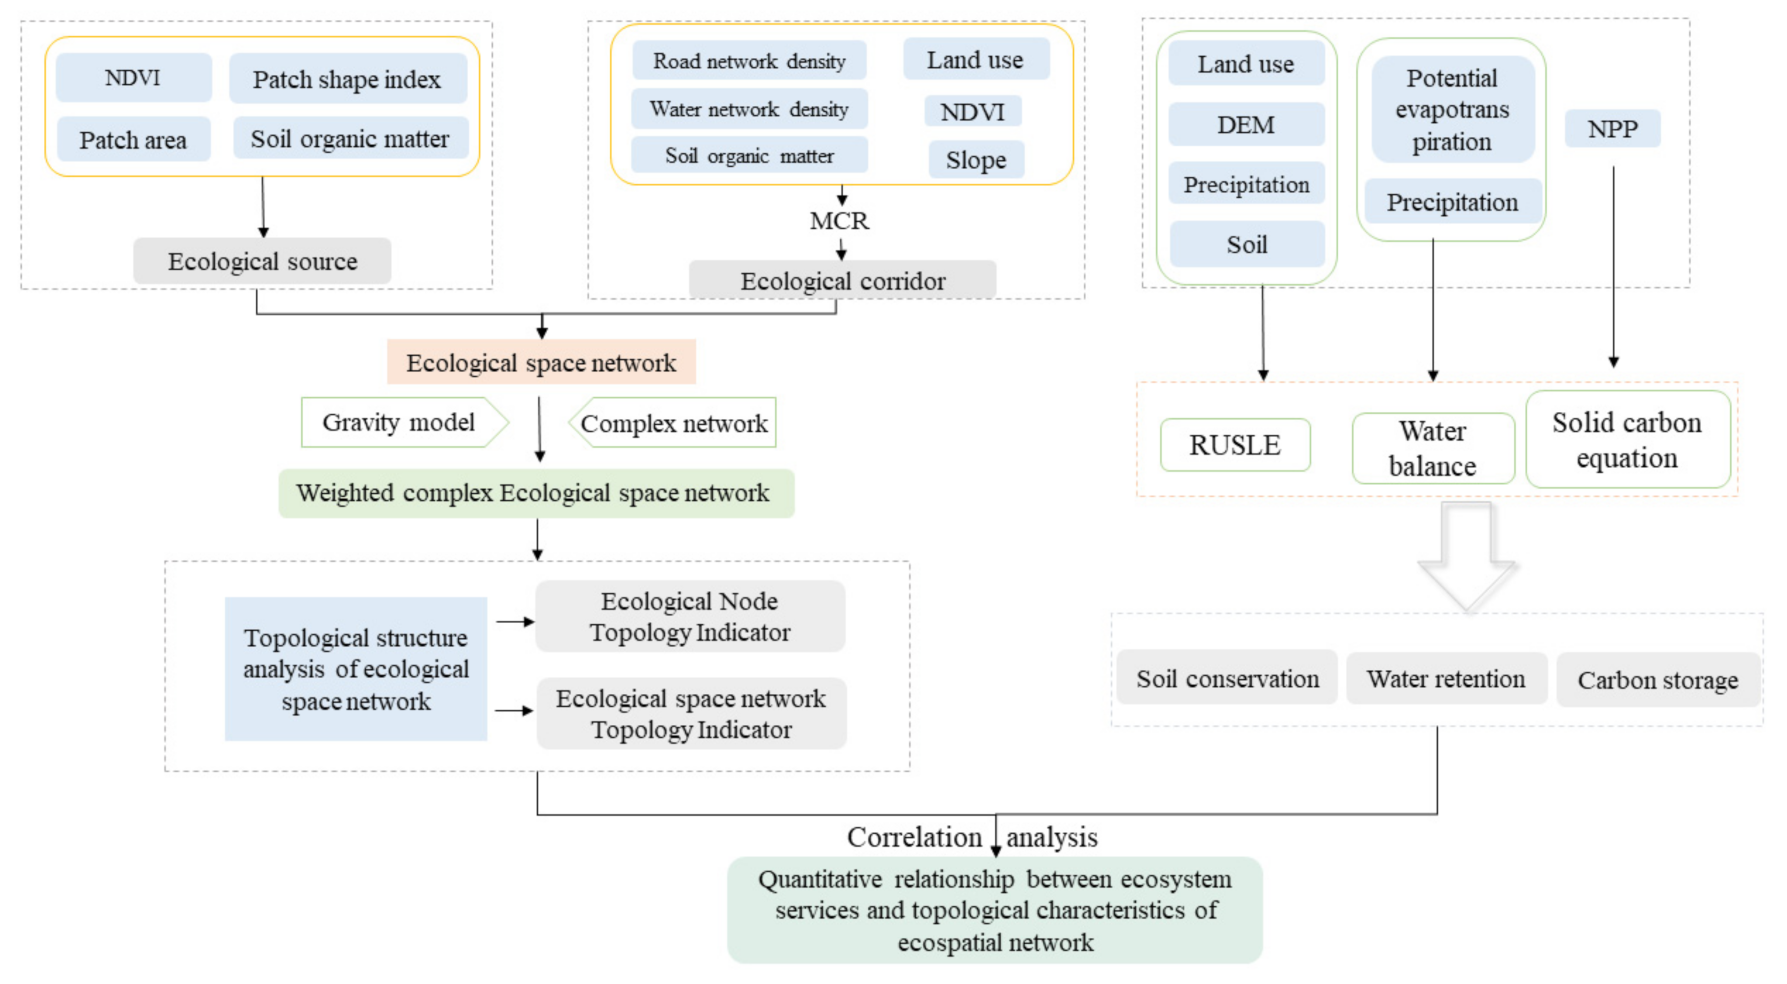
3.1. Empowering Ecospatial Network
3.1.1. Ecological Source
3.1.2. Ecological Resistance Surface Construction
3.1.3. Ecological Corridor
3.1.4. Gravity Model
3.2. Ecosystem Services
3.2.1. Water Retention
3.2.2. Soil Conservation
3.2.3. Aboveground Carbon Storage
3.3. Forest and Grass Ecospatial Network Topology Index
3.4. Correlation Analysis between Topological Indicators of Ecospatial Network and Ecosystem Services
4. Results
4.1. Analysis of China’s Ecospatial Network
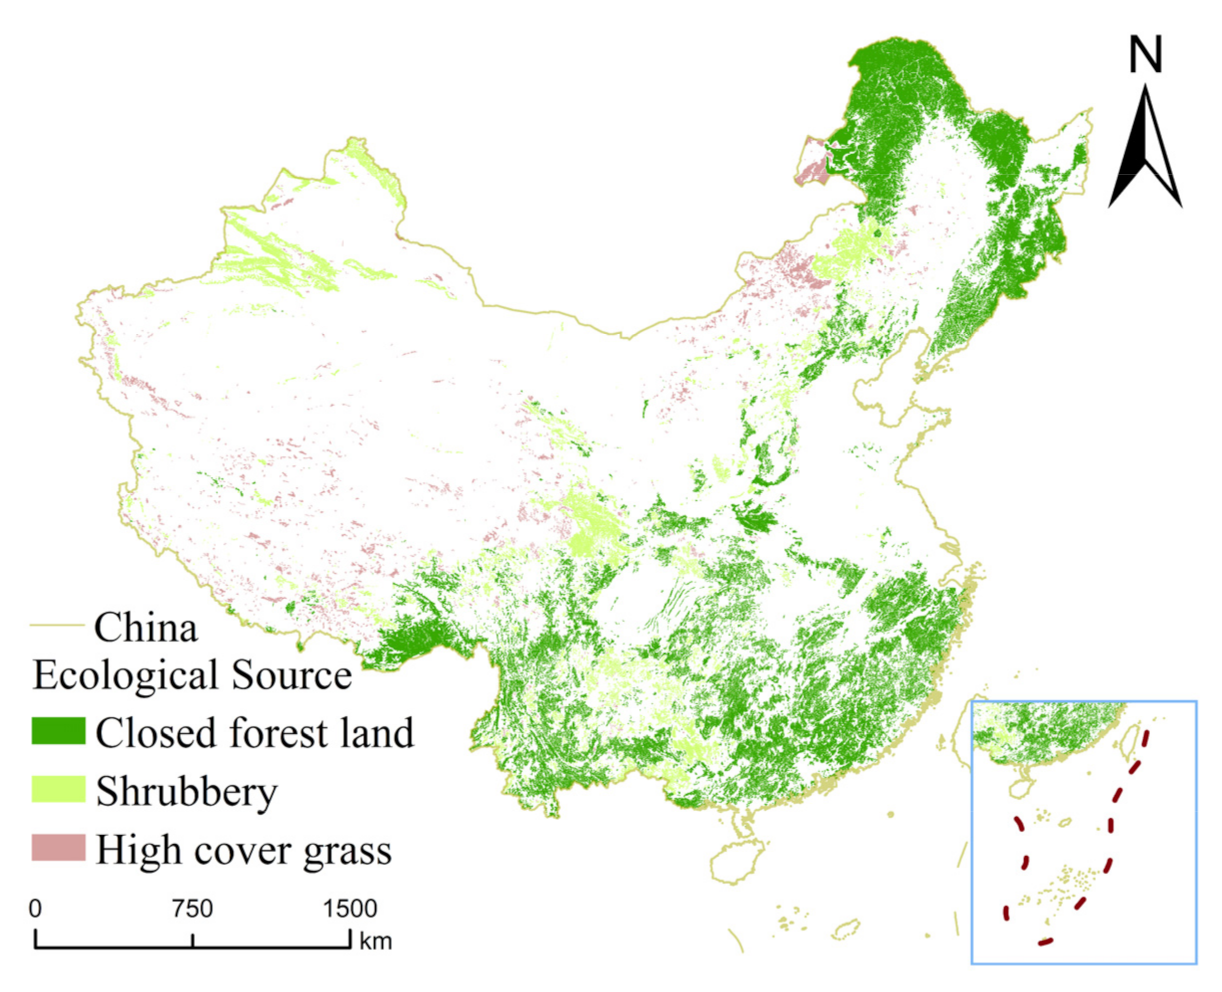
4.1.1. Ecological Sources
4.1.2. Ecological Resistance Surface
4.1.3. The Construction of Landscape Ecospatial Network
4.2. Ecosystem Services
4.2.1. Water Retention
4.2.2. Soil Conservation
4.2.3. Aboveground Carbon Storage
4.3. Analysis of Topological Structure of Ecospatial Network in China
Analysis of Ecological Source Topological Index Results
4.4. Correlation Analysis of Forest–Grass Ecospatial Network
5. Discussion
6. Conclusions
- (1)
- Ecosystem services (water retention, soil conservation, carbon storage) in China have obvious spatial heterogeneity (Figure 8), with ecosystem services being greater in southeast China than in Northwest China, and closed forest land ecosystem services being greater than shrubbery, while shrubbery ecosystem services are greater than those of high cover grass.
- (2)
- The distribution of forest–grass ecological network topology indicators has obvious spatial clustering locally, but the overall forest and grass ecospatial network topology indicators show obvious spatial discrete characteristics.
- (3)
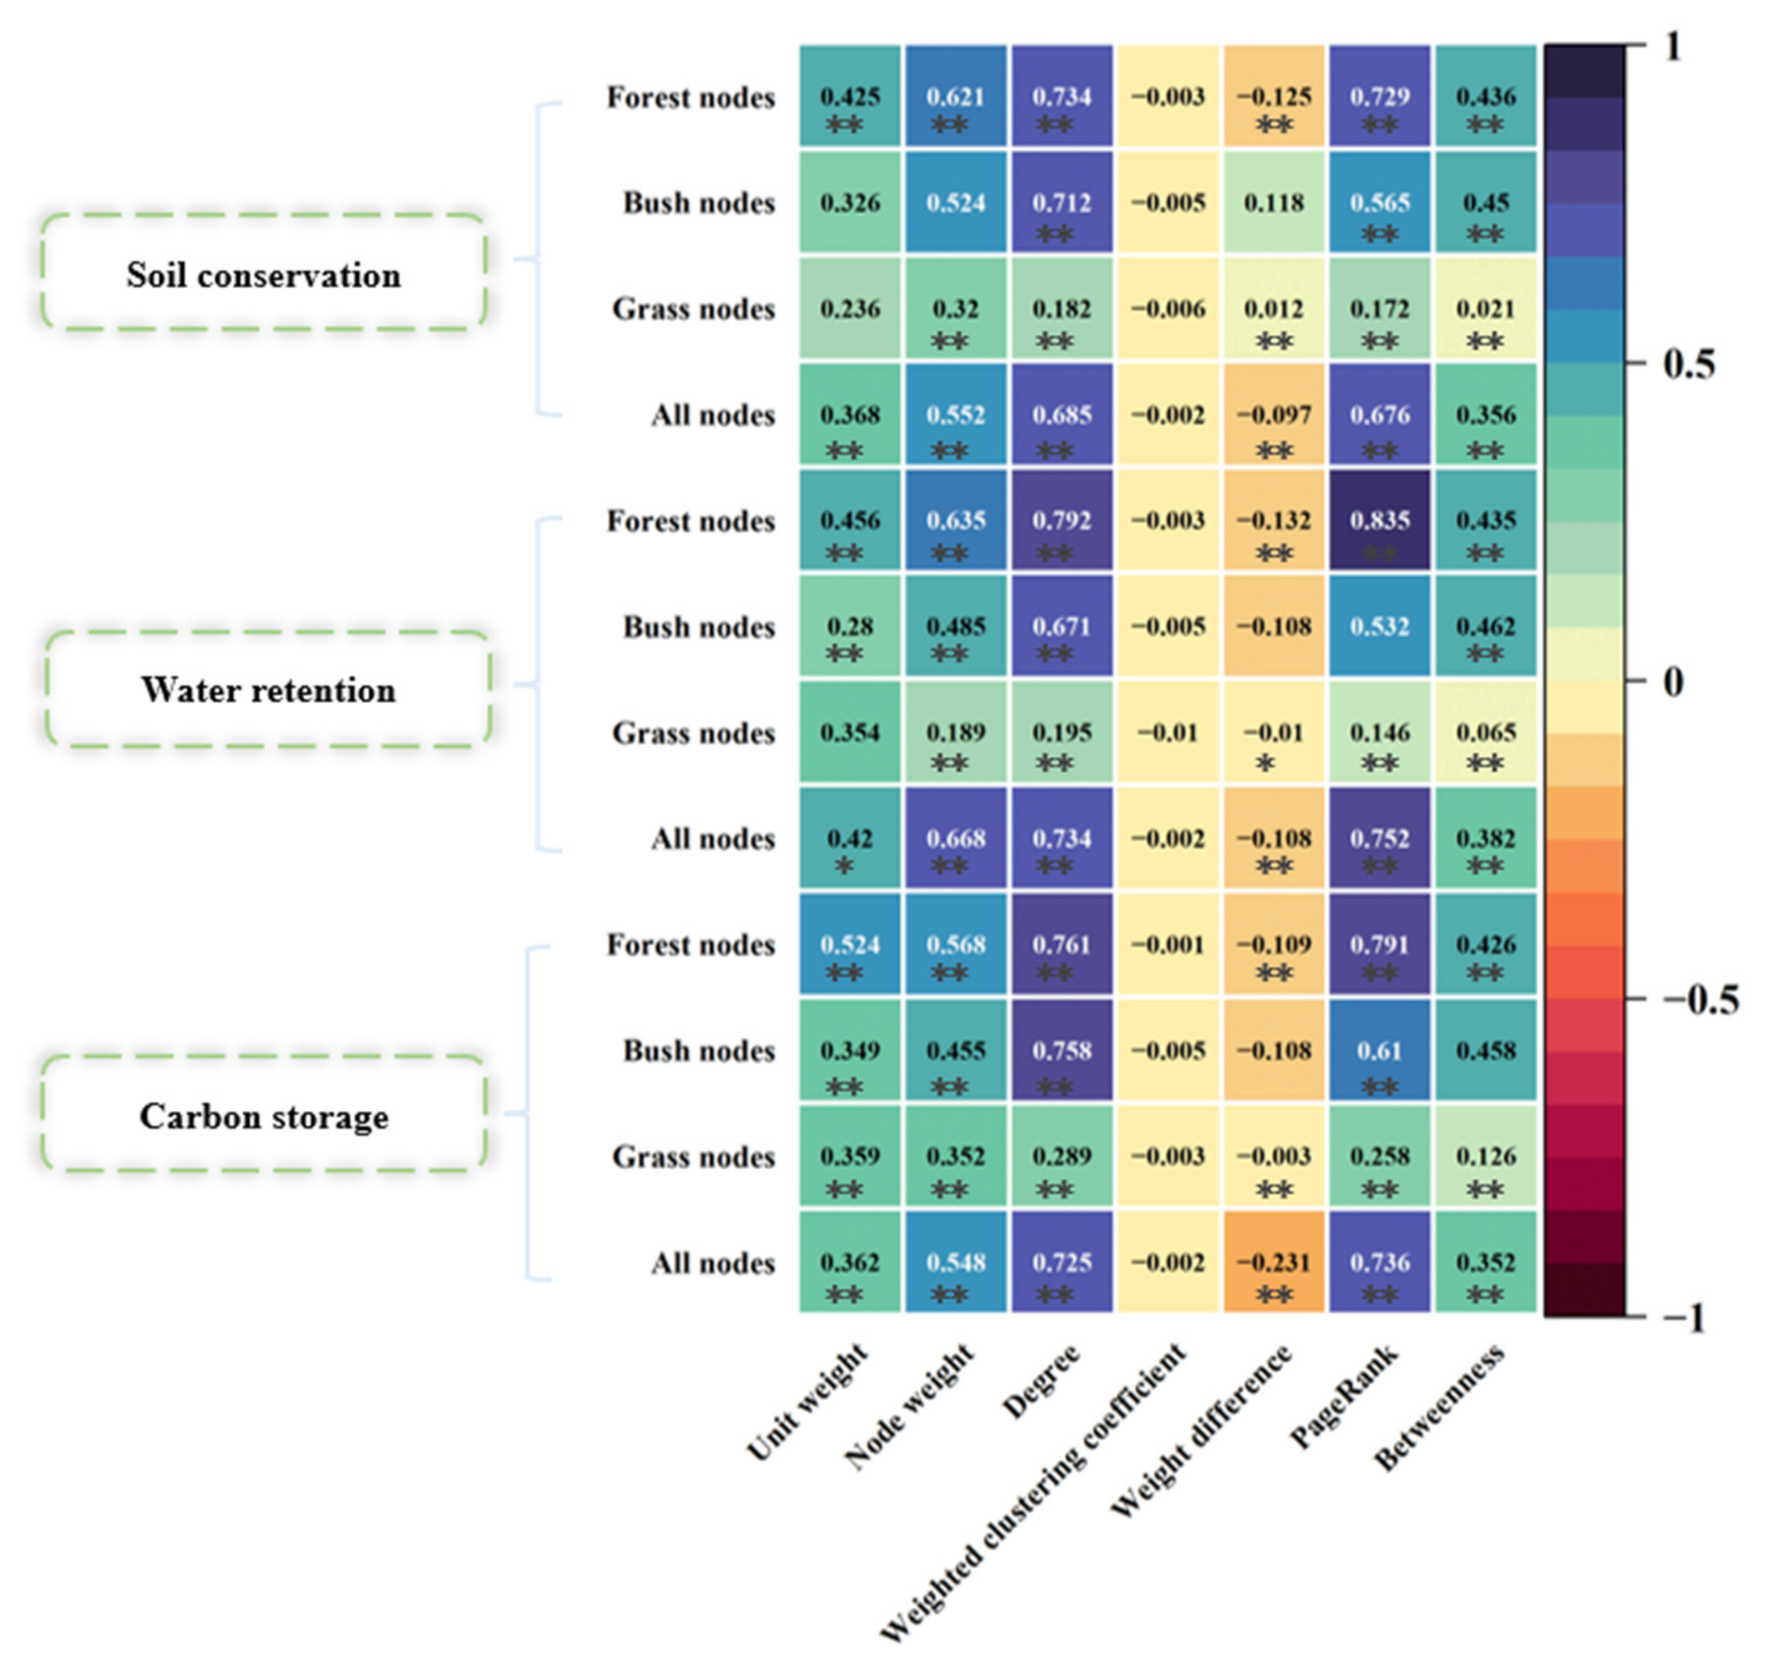
- This paper has certain spatial limitations by using mainland China as the study area. Therefore, it is necessary to consider whether the methodological framework is universal for other regions, such as tropical, northern boreal and southern boreal regions, which is worth further study in the next step. In addition, in the correlation analysis chapter, seven topological indicators were found to have significant correlation only with degree and PageRank, indicating that ecosystem services of forest and grass ecological source sites have strong correlation with certain topologies. However, most of the topological indicators have low or almost zero correlation, which may be due to the large scale of the study area, resulting in low correlation of most topological indicators. Furthermore, most of the topological indicators selected in this paper have low correlation with the three ecosystem services. Therefore, it is necessary to analyze the correlations of different topological indicators with ecosystem services for small-scale ecological restoration areas (desert–oasis areas, typical mining areas, arid zone cities, etc.) to verify whether the strength of correlations is related to scale. In the future, precise protection of vulnerable source sites in the ecological–spatial network can be implemented based on the topology of ecological source sites. This will be the next direction that the authors need to study in depth.
Supplementary Materials
Author Contributions
Funding
Data Availability Statement
Conflicts of Interest
References
- Farber, S.C.; Costanza, R.; Wilson, M.A. Economic and ecological concepts for valuing ecosystem services. Ecol. Econ. 2002, 41, 375–392. [Google Scholar] [CrossRef]
- Gao, M.; Hu, Y.; Bai, Y. Construction of ecological security pattern in national land space from the perspective of the community of life in mountain, water, forest, field, lake and grass: A case study in Guangxi Hechi, China. Ecol. Indic. 2022, 139, 108867. [Google Scholar] [CrossRef]
- Hu, B.; Zhang, Z.; Han, H.; Li, Z.; Cheng, X.; Kang, F.; Wu, H. The Grain for Green Program Intensifies Trade-Offs between Ecosystem Services in Midwestern Shanxi, China. Remote Sens. 2021, 13, 3966. [Google Scholar] [CrossRef]
- Yan, W.; Wang, H.; Jiang, C.; Jin, S.; Ai, J.; Sun, J. Satellite view of vegetation dynamics and drivers over southwestern China. Ecol. Indic. 2021, 130, 108074. [Google Scholar] [CrossRef]
- Guerra, C.A.; Maes, J.; Geijzendorffer, I.; Metzger, M.J. An assessment of soil erosion prevention by vegetation in Mediterranean Europe: Current trends of ecosystem service provision. Ecol. Indic. 2016, 60, 213–222. [Google Scholar] [CrossRef]
- Gao, Y.; Liu, Z.; Li, R.; Shi, A. Long-term impact of China’s returning farmland to forest program on rural economic development. Sustainability 2020, 12, 1492. [Google Scholar] [CrossRef]
- Yu, Q.; Yue, D.; Wang, Y.; Su, K.; Fang, M.; Ma, H.; Zhang, Q.; Huang, Y. Optimization of ecological node layout and stability analysis of ecological network in desert oasis: A typical case study of ecological fragile zone located at Deng Kou County (Inner Mongolia). Ecol. Indic. 2018, 84, 304–318. [Google Scholar] [CrossRef]
- Zhao, S.; Ma, Y.; Wang, J.; You, X. Landscape pattern analysis and ecological network planning of Tianjin City. Urban For. Urban Green. 2019, 46, 126479. [Google Scholar] [CrossRef]
- Wang, B.; Gao, P.; Niu, X.; Sun, J.N. Policy-driven China’s Grain to Green Program: Implications for ecosystem services. Ecosyst. Serv. 2017, 27, 38–47. [Google Scholar] [CrossRef]
- Huang, L.; Zhu, P.; Cao, W. The impacts of the Grain for green project on the trade—Off and synergy relationships among multiple ecosystem services in China. Acta Ecol. Sin. 2021, 41, 1178–1188. [Google Scholar]
- Wang, C.; Zhang, Y.; Wu, X.; Yang, W.; Qiang, H.; Lu, B.; Wang, J. R-IMNet: Spatial-Temporal Evolution Analysis of Resource-Exhausted Urban Land Based on Residual-Intelligent Module Network. Remote Sens. 2022, 14, 2185. [Google Scholar] [CrossRef]
- Xiao, L.; Cui, L.; Jiang, Q.; Wang, M.; Xu, L.; Yan, H. Spatial structure of a potential ecological network in Nanping, China, based on ecosystem service functions. Land 2020, 9, 376. [Google Scholar] [CrossRef]
- Ma, Q.; Li, Y.; Xu, L. Identification of green infrastructure networks based on ecosystem services in a rapidly urbanizing area. J. Clean. Prod. 2021, 300, 126945. [Google Scholar] [CrossRef]
- Li, F.; Liu, X.; Zhang, X.; Zhao, D.; Liu, H.; Zhou, C.; Wang, R. Urban ecological infrastructure: An integrated network for ecosystem services and sustainable urban systems. J. Clean. Prod. 2017, 163, S12–S18. [Google Scholar] [CrossRef]
- Hu, C.; Wang, Z.; Wang, Y.; Sun, D.; Zhang, J. Combining MSPA-MCR Model to Evaluate the Ecological Network in Wuhan, China. Land 2022, 11, 213. [Google Scholar] [CrossRef]
- Sakieh, Y.; Amiri, B.J.; Danekar, A.; Feghhi, J.; Dezhkam, S. Scenario-based evaluation of urban development sustainability: An integrative modeling approach to compromise between urbanization suitability index and landscape pattern. Environ. Dev. Sustain. 2015, 17, 1343–1365. [Google Scholar] [CrossRef]
- Zhang, T.; Yu, W.; Lu, Y.; Chen, L. Identification and Correlation Analysis of Engineering Environmental Risk Factors along the Qinghai–Tibet Engineering Corridor. Remote Sens. 2022, 14, 908. [Google Scholar] [CrossRef]
- Liao, W.; Jiang, W. Evaluation of the spatiotemporal variations in the eco-environmental quality in China based on the remote sensing ecological index. Remote Sens. 2020, 12, 2462. [Google Scholar] [CrossRef]
- Xu, W.; Wang, J.; Zhang, M.; Li, S. Construction of landscape ecological network based on landscape ecological risk assessment in a large-scale opencast coal mine area. J. Clean. Prod. 2021, 286, 125523. [Google Scholar] [CrossRef]
- Zou, Y.; Donner, R.V.; Marwan, N.; Donges, J.F.; Kurths, J. Complex network approaches to nonlinear time series analysis. Phys Rep. 2019, 787, 1–97. [Google Scholar] [CrossRef]
- Barberán, A.; Bates, S.T.; Casamayor, E.O.; Fierer, N. Using network analysis to explore co-occurrence patterns in soil microbial communities. ISME J. 2012, 6, 343–351. [Google Scholar] [CrossRef]
- Xi, X.; Zhou, J.; Gao, X.; Wang, Z.; Si, J. Impact of the global mineral trade structure on national economies based on complex network and panel quantile regression analyses. Resour. Conserv. Recy. 2020, 154, 104637. [Google Scholar] [CrossRef]
- Gautreau, A.; Barrat, A.; Barthélemy, M. Microdynamics in stationary complex networks. Proc. Natl. Acad. Sci. USA 2009, 106, 8847–8852. [Google Scholar] [CrossRef]
- Lau, M.K.; Borrett, S.R.; Baiser, B.; Gotelli, N.J.; Ellison, A. Ecological network metrics: Opportunities for synthesis. Ecosphere 2017, 8, e01900. [Google Scholar] [CrossRef]
- Elliot, T.; Babí Almenar, J.; Niza, S.; Proenca, V.; Rugani, B. Pathways to modelling ecosystem services within an urban metabolism framework. Sustainability 2019, 11, 2766. [Google Scholar] [CrossRef]
- Hu, B.; Kang, F.; Han, H.; Cheng, X.; Li, Z. Exploring drivers of ecosystem services variation from a geospatial perspective: Insights from China’s Shanxi Province. Ecol. Indic. 2021, 131, 108188. [Google Scholar] [CrossRef]
- Yang, J.; Xie, B.; Tao, W.; Zhang, D. Ecosystem Services Assessment, Trade-Off, and Bundles in the Yellow River Basin, China. Diversity 2021, 13, 308. [Google Scholar] [CrossRef]
- Chen, L.; Fu, B.; Zhao, W. Source-sink landscape theory and its ecological significance. Front. Biol. 2008, 3, 131–136. [Google Scholar] [CrossRef]
- Guo, H.; Yu, Q.; Pei, Y.; Wang, G.; Yue, D. Optimization of landscape spatial structure aiming at achieving carbon neutrality in desert and mining areas. J. Clean. Prod. 2021, 322, 129156. [Google Scholar] [CrossRef]
- Su, K.; Yu, Q.; Yue, D.; Zhang, Q.; Yang, L.; Liu, Z.; Niu, T.; Sun, X. Simulation of a forest-grass ecological network in a typical desert oasis based on multiple scenes. Ecol. Model. 2019, 413, 108834. [Google Scholar] [CrossRef]
- Ye, Y.; Su, Y.; Zhang, H.; Liu, K.; Wu, Q. Construction of an ecological resistance surface model and its application in urban expansion simulations. J. Geogr. Sci. 2015, 25, 211–224. [Google Scholar] [CrossRef]
- Bishop-Taylor, R.; Tulbure, G.; Broich, M. Surface water network structure, landscape resistance to movement and flooding vital for maintaining ecological connectivity across Australia’s largest river basin. Landsc. Ecol. 2015, 30, 2045–2065. [Google Scholar] [CrossRef]
- Tang, Y.; Gao, C.; Wu, X. Urban ecological corridor network construction: An integration of the least cost path model and the InVEST model. ISPRS Int. J. Geo-Inf. 2020, 9, 33. [Google Scholar] [CrossRef]
- Miao, Z.; Pan, L.; Wang, Q.; Chen, P.; Yan, C.; Liu, L. Research on Urban Ecological Network Under the Threat of Road Networks—A Case Study of Wuhan. ISPRS Int. J. Geo-Inf. 2019, 8, 342. [Google Scholar] [CrossRef]
- Knaapen, J.; Scheffer, M.; Harms, B. Estimating habitat isolation in landscape planning. Landsc. Urban Plan. 1992, 23, 1–16. [Google Scholar] [CrossRef]
- Nie, W.; Shi, Y.; Siaw, M.; Fan, Y.; Wu, R.; Zheng, X.; Bao, Z. Constructing and optimizing ecological network at county and town Scale: The case of Anji County, China. Ecol. Indic. 2021, 132, 108294. [Google Scholar] [CrossRef]
- Li, Y.; Zhang, Y.; Jiang, Z.; Guo, C.; Zhao, M.; Yang, Z. Integrating morphological spatial pattern analysis and the minimal cumulative resistance model to optimize urban ecological networks: A case study in Shenzhen City, China. Ecol. Process. 2021, 10, 1–15. [Google Scholar] [CrossRef]
- Li, F.; Ye, Y.; Song, B.; Wang, R. Evaluation of urban suitable ecological land based on the minimum cumulative resistance model: A case study from Changzhou, China. Ecol. Model. 2015, 318, 194–203. [Google Scholar] [CrossRef]
- Marrotte, R.R.; Gonzalez, A.; Millien, V. Landscape resistance and habitat combine to provide an optimal model of genetic structure and connectivity at the range margin of a small mammal. Mol. Ecol. 2014, 23, 3983–3998. [Google Scholar] [CrossRef]
- Lee, A.; Chon, J.; Ahn, C. Planning landscape corridors in ecological infrastructure using least-cost path methods based on the value of ecosystem services. Sustainability 2014, 6, 7564–7585. [Google Scholar] [CrossRef]
- Liu, H.; Niu, T.; Yu, Q.; Yang, L.; Ma, J.; Qiu, S.; Wang, R.; Liu, W.; Li, J. Spatial and temporal variations in the relationship between the topological structure of eco-spatial network and biodiversity maintenance function in China. Ecol. Indic. 2022, 139, 108919. [Google Scholar] [CrossRef]
- Niu, L.; Shao, Q.; Ning, J.; Huang, H. Ecological changes and the tradeoff and synergy of ecosystem services in western China. J. Geogr. Sci. 2022, 32, 1059–1075. [Google Scholar] [CrossRef]
- Geng, W.; Li, Y.; Zhang, P.; Yang, D.; Jing, W.; Rong, T. Analyzing spatio-temporal changes and trade-offs/synergies among ecosystem services in the Yellow River Basin, China. Ecol. Indic. 2022, 138, 108825. [Google Scholar] [CrossRef]
- Deng, C.; Liu, J.; Nie, X.; Li, Z.; Liu, Y.; Xiao, H.; Xiao, L. How trade-offs between ecological construction and urbanization expansion affect ecosystem services. Ecol. Indic. 2021, 122, 107253. [Google Scholar] [CrossRef]
- Li, J.; Zhou, K.; Xie, B.; Xiao, J. Impact of landscape pattern change on water-related ecosystem services: Comprehensive analysis based on heterogeneity perspective. Ecol. Indic. 2021, 133, 108372. [Google Scholar] [CrossRef]
- Garrison, R.; Caplan, S.; Douhovnikoff, V.; Mozdzer, T.; Logan, B. Responses of stomatal features and photosynthesis to porewater N enrichment and elevated atmospheric CO2 in Phragmites australis, the common reed. Am. J. Bot. 2021, 108, 718–725. [Google Scholar] [CrossRef]
- Ni, J. Forage yield-based carbon storage in grasslands of China. Clim. Chang. 2004, 67, 237–246. [Google Scholar] [CrossRef]
- Li, T.; Cui, Y.; Liu, A. Spatiotemporal dynamic analysis of forest ecosystem services using “big data”: A case study of Anhui province, central-eastern China. J. Clean. Prod. 2017, 142, 589–599. [Google Scholar] [CrossRef]
- Fang, M.; Si, G.; Yu, Q.; Huang, H.; Huang, H.; Liu, W.; Guo, H. Study on the Relationship between Topological Characteristics of Vegetation Ecospatial Network and Carbon Sequestration Capacity in the Yellow River Basin, China. Remote Sens. 2021, 13, 4926. [Google Scholar] [CrossRef]
- Wang, W.; Ming, T.; Zhang, H.F.; Gao, H.; Younghae, D.; Liu, Z.H. Epidemic spreading on complex networks with general degree and weight distribution. Phys. Rev. E 2014, 90, 042803. [Google Scholar] [CrossRef]
- Mitchell, M.G.; Suarez-Castro, A.F.; Martinez-Harms, M.; Maron, M.; Rhodes, J.R. Reframing landscape fragmentation’s effects on ecosystem services. Trends Ecol. Evol. 2015, 30, 190–198. [Google Scholar] [CrossRef]
- Keyes, A.A.; McLaughlin, J.P.; Barner, A.K.; Dee, L.E. An ecological network approach to predict ecosystem service vulnerability to species losses. Nat. Commun. 2021, 12, 1–11. [Google Scholar] [CrossRef]
- Barot, S.; Yé, L.; Abbadie, L.; Blouin, M.; Frascaria-Lacoste, N. Ecosystem services must tackle anthropized ecosystems and ecological engineering. Ecol. Eng. 2017, 99, 486–495. [Google Scholar] [CrossRef]
- Chen, Z.; Zhang, X. Value of ecosystem services in China. Chin. Sci. Bull. 2000, 45, 870–876. [Google Scholar] [CrossRef]
- Hao, R.; Yu, D.; Liu, Y.; Qiao, J.; Wang, X.; Du, J. Impacts of changes in climate and landscape pattern on ecosystem services. Sci. Total Environ. 2017, 579, 718–728. [Google Scholar] [CrossRef]
- Yi, H.; Tang, Z.; Lv, F. Analysis of Eco-environment Degradation Mechanism in the West of Northeast Plain in China During the Last 100 Years. Res. Soil Water Conserv. 2003, 10, 190–192. [Google Scholar]
- Yan, F.; Zhang, S. Ecosystem service decline in response to wetland loss in the Sanjiang Plain, Northeast China. Ecol. Eng. 2019, 130, 117–121. [Google Scholar] [CrossRef]
- Guo, X.; Chen, R.; Thomas, D. Divergent processes and trends of desertification in Inner Mongolia and Mongolia. Land Degrad. Dev. 2021, 32, 3684–3697. [Google Scholar] [CrossRef]
- Liu, G.; Yang, Z.; Chen, B.; Zhang, L.; Zhang, Y.; Su, M. An ecological network perspective in improving reserve design and connectivity: A case study of Wuyishan nature reserve in China. Ecol. Model. 2015, 306, 185–194. [Google Scholar] [CrossRef]
- Su, Y.; Zhao, W.; Su, P.; Zhang, Z.; Tao, W. Ecological effects of desertification control and desertified land reclamation in an oasis–desert ecotone in an arid region: A case study in Hexi Corridor, northwest China. Ecol. Eng. 2007, 29, 117–124. [Google Scholar] [CrossRef]
- Li, D.; Xu, E.; Zhang, H. Influence of ecological land change on wind erosion prevention service in arid area of northwest China from 1990 to 2015. Ecol. Indic. 2020, 117, 106686. [Google Scholar] [CrossRef]
- Yin, Y.; Han, X.; Wu, S. Spatial and temporal variations in the ecological footprints in Northwest China from 2005 to 2014. Sustainability 2017, 9, 597. [Google Scholar] [CrossRef]
- Sahraoui, Y.; Foltête, J.C.; Clauzel, C. A multi-species approach for assessing the impact of land-cover changes on landscape connectivity. Landsc. Ecol. 2017, 32, 1819–1835. [Google Scholar] [CrossRef]
- Guo, S.; Saito, K.; Yin, W.; Su, C. Landscape connectivity as a tool in green space evaluation and optimization of the haidan district, beijing. Sustainability 2018, 10, 1979. [Google Scholar] [CrossRef]
- Ahmed, K.R.; Akter, S. Analysis of landcover change in southwest Bengal delta due to floods by NDVI, NDWI and K-means cluster with Landsat multi-spectral surface reflectance satellite data. Remote Sens. Appl. 2017, 8, 168–181. [Google Scholar] [CrossRef]
- Wu, J.; Fang, J.; Tian, J. Terrain Representation and Distinguishing Ability of Roughness Algorithms Based on DEM with Different Resolutions. ISPRS Int. J. Geo-Inf. 2019, 8, 180. [Google Scholar] [CrossRef]
- McCool, D.K.; Foster, G.R.; Mutchler, C.K.; Meyer, L.D. Revised slope length factor for the Universal Soil Loss Equation. Trans. ASAE 1989, 32, 1571–1576. [Google Scholar] [CrossRef]
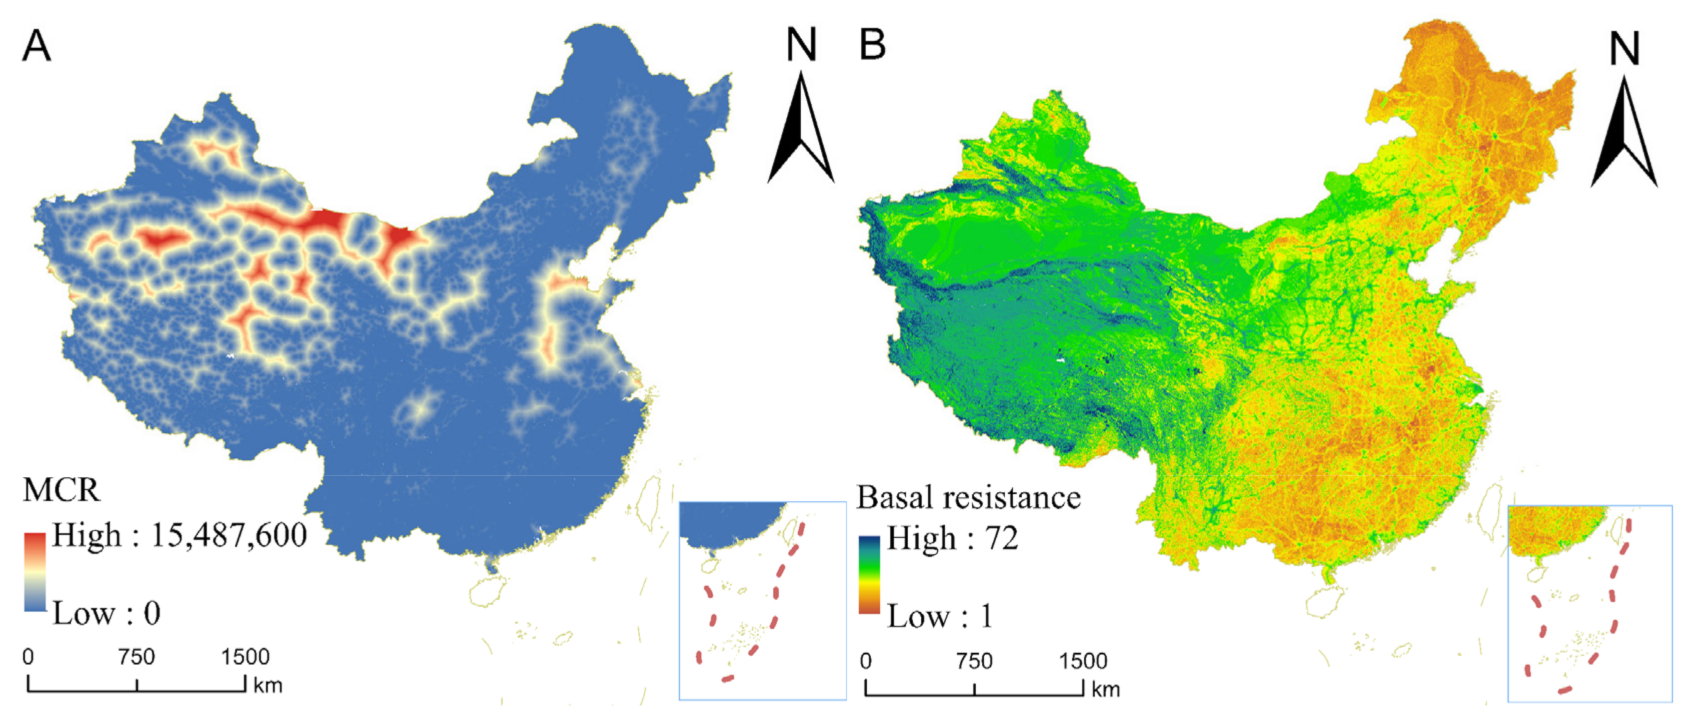
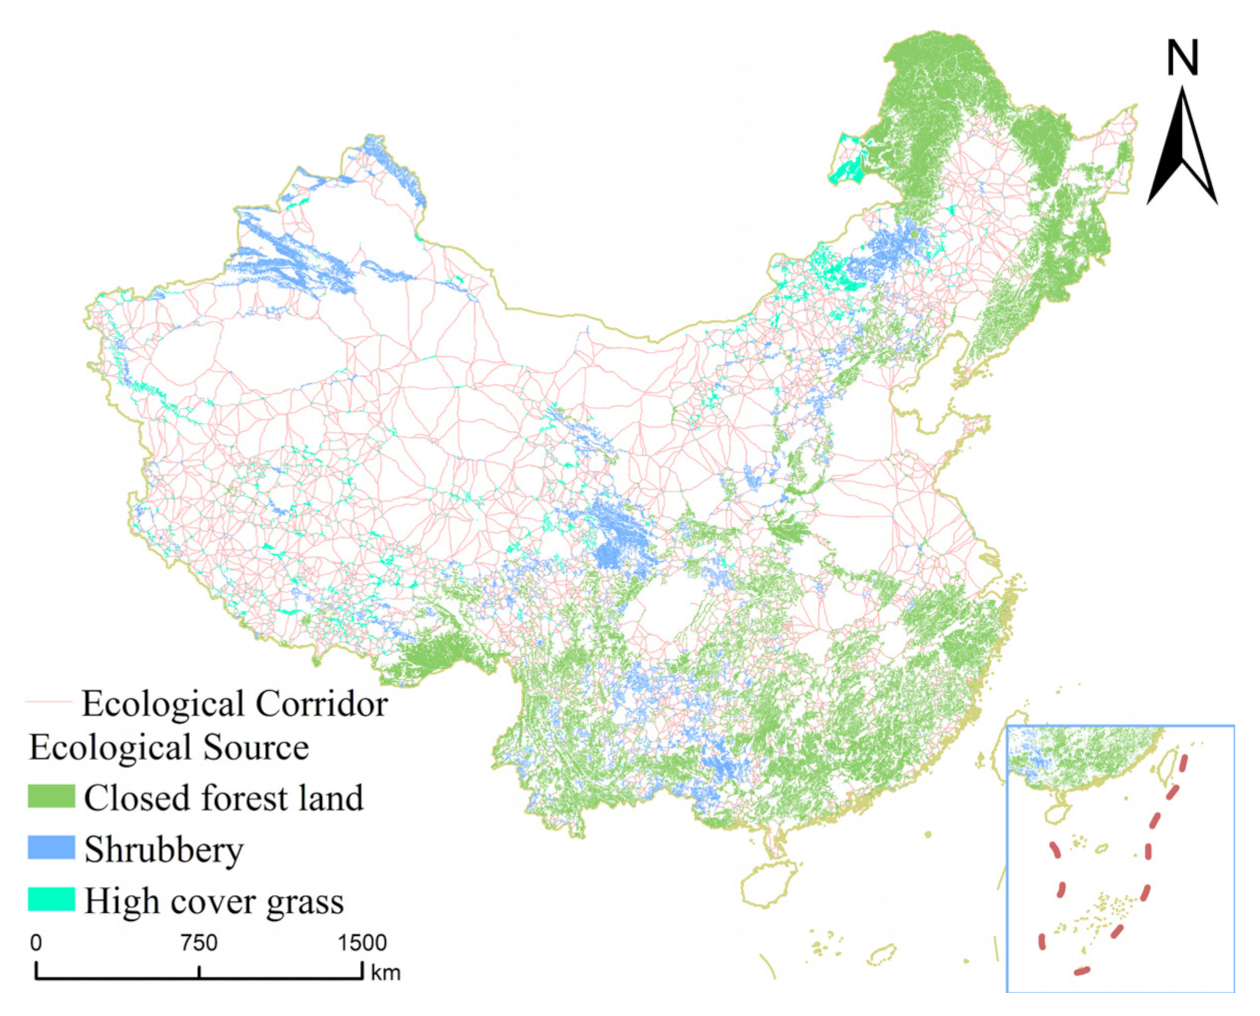


| Data | Data Formats | Data Description | Data Sources | Data Time Resolution and Coverage |
|---|---|---|---|---|
| Study area boundary | Shapefile | China Vector Boundary | Resource and Environmental Science and Data Center of the Chinese Academy of Sciences (http://www.resdc.cn/, accessed on 16 April 2022) | 2020 (China Mainland) |
| Land use | Raster (30 m) | Land use interpreted from Landsat 8 | Resource and Environmental Science and Data Center of the Chinese Academy of Sciences (http://www.resdc.cn/, accessed on 16 April 2022) | 2020 (China Mainland) |
| Normalized Difference Vegetation Index (NDVI)/(Normalized Difference Water Index) NDWI | Raster (30 m) | Landsat 8 and calculations (Including monthly NDVI, NDW and annual NDVI, NDWI) | Google Earth Engine (http://code.earthengine.google.com/, accessed on 16 April 2022) | Monthly average value in 2020 and average maximum value in 2020 (China Mainland) |
| Net Primary Productivity (NPP) | Raster (500 m) | MOD17A3H database | Google Earth Engine (http://code.earthengine.google.com/, accessed on 16 April 2022) | 2020 (China Mainland) |
| Road Network Data/Water Network Data | shapefile | Open Street Map (Road, Water line) | (http://www.openstreetmap.org/, accessed on 16 April 2022) | 2020 (China Mainland) |
| Digital Elevation Model (DEM) | Raster (30 m) | Elevation data | Geospatial Data Cloud (https://www.gscloud.cn, accessed on 16 April 2022) | 2020 (China Mainland) |
| Meteorological data | Raster (1 km) | Including monthly average precipitation and annual precipitation, and potential evapotranspiration | National Earth System Science Data Center (http://www.geodata.cn/, accessed on 16 April 2022) | Monthly average value in 2020 and average value in 2020 (China Mainland) |
| Soil data | Raster (1 km) | Soil type Soil texture (Sand, Silt, Clay) | Resource and Environmental Science and Data Center of the Chinese Academy of Sciences (http://www.resdc.cn/, accessed on 16 April 2022) | 2020 (China Mainland) |
| Population data | Raster (1 km) | Population density | Resource and Environmental Science and Data Center of the Chinese Academy of Sciences (http://www.resdc.cn/, accessed on 16 April 2022) | 2020 (China Mainland) |
| Factor | Value | Grade | Factor | Value | Grade |
|---|---|---|---|---|---|
| DEM/m | −160–718 | 1 | Population density | 0–266 | 1 |
| 718–1717 | 3 | 266–2135 | 3 | ||
| 1717–2999 | 5 | 2135–6941 | 5 | ||
| 2999–4324 | 7 | 6941–18,422 | 7 | ||
| 4324–8755 | 9 | 18,422–68,349 | 9 | ||
| Land use | Closed forest land, Shrubbery, High cover grass | 1 | Road network density | 0–0.82 | 1 |
| Open forest land, Other forest land, Medium cover grass, Low cover grass | 3 | 0.82–2.15 | 3 | ||
| rivers and canals, Lakes, Reservoir ponds, Mudflats, Beach | 5 | 2.15–6.36 | 5 | ||
| Water Field, Dryland, Urban land, Rural settlement, Other construction land | 7 | 6.36–11.87 | 7 | ||
| Sandy, Saline soil, Marshland, Bare land, Bare rock texture | 9 | >11.87 | 9 | ||
| Roughness/Ra | 1–1.007 | 1 | Water network density | 0–0.07 | 1 |
| 1.007–0.024 | 3 | 0.07–0.19 | 3 | ||
| 1.024–1.054 | 5 | 0.19–0.44 | 5 | ||
| 1.054–1.107 | 7 | 0.44–0.84 | 7 | ||
| 1.107–1.607 | 9 | 0.84–1.44 | 9 | ||
| NDVI | 0–0.19 | 1 | Soil organic matter | 0–0.51 | 1 |
| 0.19–0.42 | 3 | 0.51–1.42 | 3 | ||
| 0.42–0.66 | 5 | 1.42–3.1 | 5 | ||
| 0.66–0.85 | 7 | 3.1–6.82 | 7 | ||
| >0.85 | 9 | >6.82 | 9 |
| Name of Indicator | Introduction to the Algorithm | Ecological Significance of the Indicator | Reference |
|---|---|---|---|
| Degree | Number of connected edges of the node in the network | Number of ecological corridors connected to ecological source | [39] |
| Weighted clustering coefficient | Ratio of the actual number of connected edges of a node to the maximum possible number of connected edges | Proportion of connectivity between ecological source | [49] |
| Node weight | Network node weights | Weighting of ecological source | [50] |
| Unit weight | The average weight of the edges connected by the network nodes | Average weight of corridors connected by ecological source | [50] |
| Weight distribution difference | Degree of aggregation and dispersion of the distribution of node-connected edge weights | Aggregation and dispersion of weight distribution of ecological corridors connected to ecological source | [50] |
| Betweenness | The importance of two nodes connected to each other | Importance of connectivity between ecological source | [49] |
| PageRank | Metrics for assessing the importance of network nodes | Degree of importance of ecological source | [39] |
Publisher’s Note: MDPI stays neutral with regard to jurisdictional claims in published maps and institutional affiliations. |
© 2022 by the authors. Licensee MDPI, Basel, Switzerland. This article is an open access article distributed under the terms and conditions of the Creative Commons Attribution (CC BY) license (https://creativecommons.org/licenses/by/4.0/).
Share and Cite
Yang, L.; Niu, T.; Yu, Q.; Zhang, X.; Wu, H. Relationship between Topological Structure and Ecosystem Services of Forest Grass Ecospatial Network in China. Remote Sens. 2022, 14, 4700. https://doi.org/10.3390/rs14194700
Yang L, Niu T, Yu Q, Zhang X, Wu H. Relationship between Topological Structure and Ecosystem Services of Forest Grass Ecospatial Network in China. Remote Sensing. 2022; 14(19):4700. https://doi.org/10.3390/rs14194700
Chicago/Turabian StyleYang, Linzhe, Teng Niu, Qiang Yu, Xiao Zhang, and Heng Wu. 2022. "Relationship between Topological Structure and Ecosystem Services of Forest Grass Ecospatial Network in China" Remote Sensing 14, no. 19: 4700. https://doi.org/10.3390/rs14194700
APA StyleYang, L., Niu, T., Yu, Q., Zhang, X., & Wu, H. (2022). Relationship between Topological Structure and Ecosystem Services of Forest Grass Ecospatial Network in China. Remote Sensing, 14(19), 4700. https://doi.org/10.3390/rs14194700


