Abstract
Ship detection and management in coastal regions are challenging tasks due to the complex appearances of ships and the background. For further applications in the context of fisheries monitoring and vessel traffic services, a single-channel synthetic aperture radar (SAR) is mounted on a number of maneuvering and inexpensive rotor platforms, which are utilized according to the consideration of flexible observation, cost savings, weight, and space constraints. In this paper, a hierarchical scheme of ship detection, ship imaging, and classification is proposed. It mainly includes three parts. First, a mixture statistical model of semi-parametric K-lognormal distribution based on adaptive background windows with a constant false alarm rate (CFAR) is proposed for ship prescreening in SAR imagery. Then, the discrimination stage, combined with ship imaging via the difference between the true ship targets and the false ones in the aspects of micro-Doppler motion properties, is performed. Finally, the simulation and field data processing results are presented to validate the proposed scheme.
1. Introduction
Synthetic aperture radar (SAR) is an active ground imaging system, which is known for its all-weather capabilities, wide swath, and high resolution [1]. In recent years, more and more SAR systems are equipped on some flexible platforms for ship surveillance and management, and will be widely applied in ocean observation in the future. For further applications in coastal regions, some single-channel SAR systems are mounted on a number of airborne platforms. Compared with the other SAR platforms, such as spaceborne SAR [2] and missile-borne SAR [3], airborne SAR platforms can easily realize repeat observation, and can be beneficial to ship detection in coastal regions. Therefore, it is significant to develop the single-channel airborne SAR automatic ship detection algorithms. In recent research on SAR automatic ship detection systems, many systems are mounted on spaceborne SAR for its wide swathes—for instance, RADARSAT-2, TerraSAR-X, and Gaofen [4,5,6]. Compared with spaceborne SAR, airborne SAR is better for more flexible tasks [7]. With the development of imaging techniques and varied modes in SAR systems, numerous algorithms of multi-channel SAR ship detection are performed to improve performance; for instance, references [8,9,10,11] have done a good job by combining the sea interferogram’s magnitude and phase (SIMP) in along-track interferometric SAR (ATI-SAR). Although multi-channels SAR systems improve the detectability of ship targets, single-channel SAR systems are often equipped with the consideration of cost saving, weight constraint, and more flexible observation [12,13,14]. In recent years, some ship detection algorithms from SAR imagery based on deep learning have been widely applied [15,16,17,18,19,20,21,22]. Deep learning is a trend of ship detection from SAR images in the future, and has made significant progress, but it usually conforms to the optical ship detector (OSD) and the post-processing of spaceborne SAR images, and depends on a high resolution or on complex computation, which makes it not suitable for a real-time SAR system such as airborne SAR [23,24,25]. For a single-channel airborne SAR, a ship detection system requires real-time processing; constant false alarm rate (CFAR) detection is a good choice, but a single CFAR cannot be directly performed for SAR images [26]. Some modified algorithms have improved the performance of ship detection, such as multilayer CFAR detector [27], modified CFAR detectors [28], and so on. However, these CFAR detectors cannot be suitable for ship target detection in coastal regions. The scheme commonly contains three main stages [29]: preprocessing, prescreening (ship candidate detection), and discrimination; the whole scheme is illustrated in Figure 1.
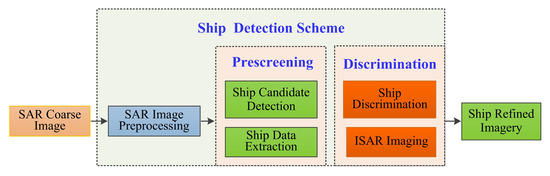
Figure 1.
Illustration of ship detection and imaging scheme.
Preprocessing is an initial stage in which the land areas are masked out of the image being processed. A common approach for land masking in spaceborne SAR systems is to register the SAR image with geographic maps, as this method is not perfect in the airborne SAR systems; the existing coastal regions are not known precisely, and registration errors occur [30]. In order to accommodate for this issue, a fast land masking method with land area constraint is proposed. Compared with the masking methods of spaceborne SAR, there will be fewer pseudo targets existing, and these pseudo targets will be eliminated in the following prescreening and discrimination stages, which are totally ignored in recent publications. In the prescreening stage, modeling the background statistically with CFAR processing is often used. Consequently, many studies focus on the distribution of sea clutter, and some classical distributions of sea clutter, such as Weibull [31], K [32], and Gamma [33], are proposed to assess their performance. In order to accommodate the complex sea clutter, a linear combination of K distribution and Wishart distribution is performed, as K distribution has arisen mainly to represent radar sea clutter [34]. This combination has inspired us with the idea of building a mixture distribution for modeling both the sea clutter and the ship targets. A lognormal distribution [35] is suitable for modeling the metallic target, while ships are typically constructed from large flat metal sheets. Then, a linear combination of K distribution and lognormal distribution named K-lognormal distribution is proposed in this paper. Further, we give an adaptive window for a background statistic that can perfectly combine with the mixture distribution. Using the modified background window, the proportions of the sea clutter region and the target region, as well as the statistical properties of the clutter data and the ship target data, are obtained. In order to obtain the entire ship candidates, the required false alarm rates (CFAR threshold) are usually very low in the stage of prescreening. Consequently, some false targets are included, which will be removed in the subsequent precise detection.
The innovative work of this paper is summarized as follows. In this paper, for ship target detection on the sea, the proposed adaptive background window is combined with the mixed two parameter model to better and faster characterize the distribution characteristics of sea clutter and ships, and the adaptive threshold method can accurately separate the target and clutter, and support the distribution of the two parameter model more accurately. The proposed method can achieve adaptive ship target detection in coastal areas, and has engineering feasibility. In addition, ship detection based on deep learning methods is also a hot topic of current research. However, such methods may be easily limited by the focus quality of the ship and the size of the ship target in the image, making it less effective in detecting small ship targets and severely defocused ship targets, which is difficult to adapt to the complex marine environment. In contrast, the proposed method in this paper has good results under the condition of small and defocused targets. The simulation and measured data also show that deep learning methods are less effective with small and defocused targets.
Coastal surveillance and ship detection are cited as being two of the main motivations of this paper, and the whole procedure is organized as follows: Firstly, the modified prescreening method based on the mixture model and the adaptive background window are analyzed in Section 2. Secondly, an improved discrimination algorithm, combined with ship imaging, is proposed to reduce the false rate in the stage of prescreening. Thirdly, the results of real data processing used to evaluate the proposed detection scheme are described in Section 4. Finally, conclusions are drawn in Section 5.
2. Modified Prescreening Algorithm
The conventional ship detection algorithms of single-channel SAR are proposed from the view of the ship targets off the coast, without considering the impacts of coastal regions [30]. In this section, a preprocessing step is performed, which is introduced to eliminate the effect of coastal regions before prescreening. The whole preprocessing is done in the SAR image domain, and mainly includes three aspects: sea-land segmentation, land masking, and morphological offset. After the preprocessing, the modified mixture distribution model, combined with an adaptive window and CFAR for ship candidate detection is analyzed in detail; the whole flowchart is illustrated in Figure 2.
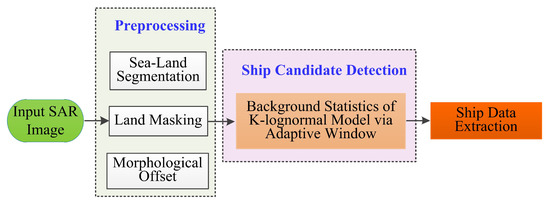
Figure 2.
Flowchart of prescreening.
2.1. Preprocessing
In order to implement sea–land segmentation, we firstly perform the mean filtering operation and amplitude normalization. We assume that a SAR image is illustrated by in the image domain as Figure 3a, and we binarize the input SAR image using the Otsu algorithm [30], which can adaptively divide the image into two parts: one is the background (sea surface) and the other contains the bright targets (land and ship targets), shown in Figure 3c. After the binarization, the image can be rewritten as
where T is the expected threshold. In addition, some holes-filling methods will also be applied to eliminate the hole-regions, and to protect the following land masking operation. For ship targets in the SAR imagery, metallic ship targets may have “fore and aft separation”, as is shown in Figure 3. In order to accommodate this issue, morphological offsets such as morphology dilation and erosion are applied to fill the separation and some isolated holes. Further, land masking is necessary, not only for the obvious reason that only ships in the ocean are of interest, but also because ship detectors can produce high numbers of false alarms when applied to land areas. In this operation, we include a minimum land area constraint to prevent the ships themselves from being masked out. Then, a volume traversal is performed to obtain the boundaries of each ship candidate. Assume there are ship candidates in the image, and
where and are the boundaries of the k-th ship candidate in the range and azimuth direction, respectively. and represent the length and width of the k-th ship candidate in the image domain, respectively. Finally, an adaptive background window, which is the double of and , is utilized to extract the background and the ship candidates for further prescreening.
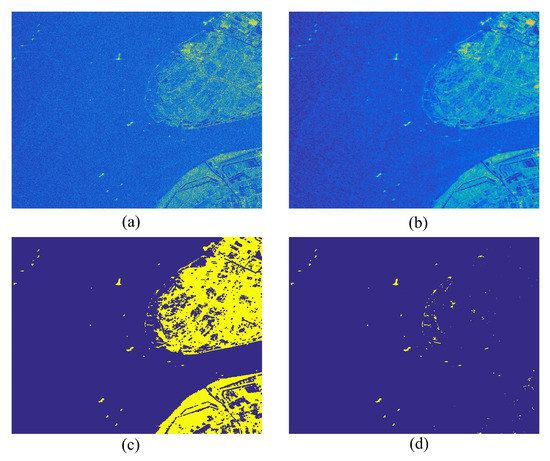
Figure 3.
Preprocessing. (a) Original SAR image; (b) after mean-filtering; (c) after Otsu and morphological offset; (d) after land masking.
2.2. K-Lognormal Model for Prescreening
In this part, a modified mixture model for ship detection is performed for prescreening. The previous studies have shown that the K distribution is suitable for modeling the sea clutter [32], and a lognormal distribution is suitable for modeling the SAR data collected from metallic targets [35], such as ship targets. Based on the advantages of the mixture model, a K-lognormal model is proposed, which uses a K distribution to describe the sea background, and a lognormal distribution to describe the ship and other metal targets. The probability density function of the K distribution can be expressed as
where , and denotes the mean value. denotes the shape parameter, L denotes the number of image views, denotes the Gamma function, and denotes the second kind of modified Bessel function of order . In order to obtain an accurate K distribution, we need to estimate the parameters of . Traditional parameter estimation methods (such as the maximum likelihood method) have the problems of a large amount of calculation and a low efficiency; in order to avoid complicated estimation processes and a large amount of calculation, Blacknell et al. [36] proposed the use of the statistical value of pixels in the background window to replace the estimated value for approximate fitting. The statistical value of can be expressed as
where denotes the expected operation. Furthermore, we used lognormal distribution to describe the target distribution, and its probability density function can be expressed as
where denotes the standard deviation. Next, the K-lognormal distribution model can be obtained by mixing the K-lognormal distribution model with the lognormal distribution model in a certain proportion, which can be expressed as
where , , and . When = 0, the formula can describe the self-distribution characteristics of the target to be detected. When = 0, the formula can describe the background distribution characteristics of the target to be detected. For the above mixture model, we only need to use the parameter estimation method to obtain the value of in different target regions to obtain the mixture distribution model of the target and the background to be detected. In practical engineering applications, due to the real-time property of the parameter estimation method, there may be problems such as too many iterations. In order to avoid the complex parameter estimation, we use the coefficient solving method for the multi parameter distribution model, which approximates the fitting by using the proportion of the number of fitting pixels used in each distribution model to the total number of pixels. Using the above mixture model as the background distribution in CFAR detection, the false alarm probability formula can be expressed as
where denotes the false alarm probability; given the false alarm probability and solving formula (8), the threshold T is obtained. Then, we can make a preliminary judgment of the target to be detected by the threshold detection of the target and the background.
Based on a target selected with an adaptive background window in Figure 3, the fitting and comparative analysis of a single K-distribution model and a mixed distribution model is carried out. The selected target is shown in Figure 4. In order to verify the fitting results of the proposed mixture distribution model, single-background K-distribution fitting and mixture distribution model fitting are carried out for the ship target in Figure 4, and the results are shown in Figure 5. Compared with the single K-distribution fitting in Figure 5a, the fitting curve of the mixture distribution model in Figure 5b can better approximate the amplitude distribution characteristics of the target to be detected.
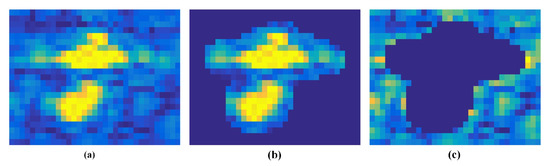
Figure 4.
Separation of the target to be detected from the background. (a) Target and background to be detected; (b) Target to be detected; (c) Background to be detected.
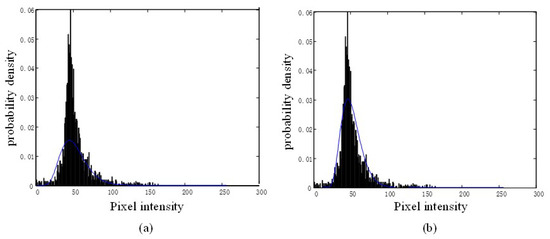
Figure 5.
Comparison of fitting results of two models. (a) K-distribution model; (b) Mixture distribution model.
First, from the comparison of fitting results in Figure 5, it is obvious that the mixed distribution model in Figure 5b can accurately fit the distribution characteristics of the target to be detected and its surrounding background, compared with the single K distribution model. It should be noted that the view number of the image in Figure 5a is 2. According to the mean and variance of the target to be detected and the background in Figure 4a, the graphical parameter v = 3.32 of the k distribution parameter is obtained using formula (5), and then the k distribution curve is fitted. For Figure 5b, according to the mean and variance of the target background (c) to be detected, the shape parameter v = 2.18 is calculated using formula (5). According to the ratio of the number of target pixels to be detected in Figure 4b to the number of target background pixels to be detected in Figure 4c and , and = 0.58 can be obtained, and then the mixed model distribution can be easily fitted.
3. Ship Discrimination
Through the above rough detection method, most non-ship targets such as land residues can be eliminated, but there will still be some false targets that cannot be eliminated, which will cause a large false alarm. In order to further reduce the false alarm rate, this paper proposes a target fine detection algorithm based on the characteristics of ship motion. Ship targets have translational motion and rotational motion, but pseudo-targets do not have that characteristic. The target to be detected after rough detection is further purified, to realize the fine detection of ship targets on the sea.
In order to better analyze the motion characteristics of ships, the center point of ships is taken as an example from the perspective of SAR imaging. Firstly, the imaging geometric model is analyzed (as shown in Figure 6). The radar platform moves at a uniform speed along the flight track, and v denotes the speed. Assume that at time , the carrier height is h. At this time, the velocity components of the ship target are , , and , respectively. The oblique angle of the beam ray direction is , and is the oblique distance when the beam centerline sweeps through the target. Taking the center point of the ship target as an example, the instantaneous oblique distance (approximately to the fourth order) can be expressed as
where
where represents the coefficients containing only the carrier motion and not the ship motion, in which this part is compensated in SAR focusing imaging; is each coefficient including ship motion, and this part of the component is unknown. After the SAR image is focused, for the center point of the ship, the residual oblique distance caused by the ship’s own motion is
where is a constant. This residual oblique distance seriously affects the focusing of the ship center point, and there are space–variance characteristics due to the inconsistency of the residual oblique distance at each position of the ship. In order to further analyze the influence of residual skew distance, the echo signal in the range frequency domain and the azimuth time domain after range compression can be expressed as (its window function form is ignored here)
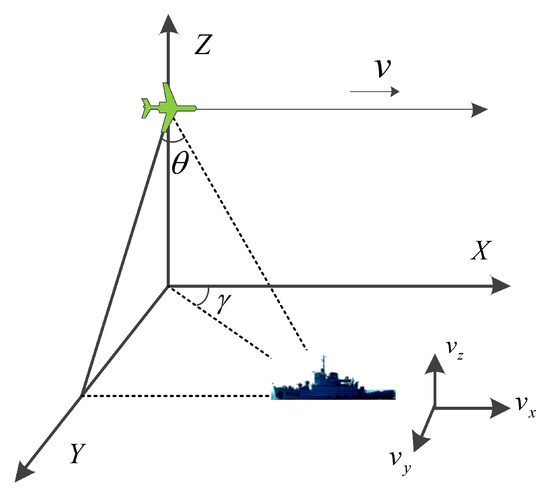
Figure 6.
Geometric model of ship target imaging using the mobile platform SAR.
It is not difficult to find that the residual skew distance has a certain influence on the envelope and phase, and that the sensitivity of phase to error is significantly higher than that of the envelope. According to formula (12), the primary term of the residual oblique distance affects the azimuth focus position, which will change the focus position of the final target, and this part is mainly caused by the radial motion speed of the ship, while the high-order term determines the image focus quality. If the target to be detected has radial motion velocity, it can be determined that the detection target is a ship target. However, if there is no radial motion velocity of the target to be detected, it does not mean that the target to be detected is a pseudo target. We analyze the ship motion characteristics of short synthetic aperture time under the mobile platform. In Figure 7a, the ship moves perpendicular to the radar beam direction. At this time, there is no radial motion velocity in the residual oblique distance. In Figure 7b, if the ship moves along the radar beam direction, there is no rotational motion component of the ship in the residual oblique distance. Therefore, the problem of ship target precise detection can be transformed into the determination of the first-order term and a high-order term of phase in the target to be detected; that is, to judge whether the moving target to be detected has radial motion speed and its own rotational characteristics, and then to determine whether it is a real ship target.
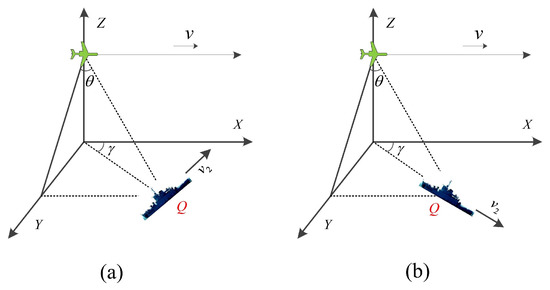
Figure 7.
Analysis of ship motion characteristics. (a) Only self sway; (b) only radial motion exists.
3.1. Radial Motion Judgment of Target to Be Detected
After SAR focusing processing, because the ship target is a non-cooperative target and its imaging motion characteristics are unknown, it is difficult to realize ship imaging by using the unified focusing idea of SAR imaging. In order to carry out fine focus imaging on non-cooperative targets, the ISAR imaging method needs to be used to realize the fine focus imaging of the target to be detected. ISAR imaging is generally divided into four steps:
- (1)
- Envelope alignment to remove the envelope migration caused by the overall movement of the target.
- (2)
- Phase compensation to remove the phase error caused by the overall movement of the target.
- (3)
- Keystone transform; removing the over distance cell migration caused by the rotation of the target itself.
- (4)
- Azimuth imaging.
It is assumed that the signal of the target to be detected after separation is
where is the envelope, denotes the range change caused by the target translation, which has the same impact on each scattering point on the target, and it can reflect the distance change caused by the radial motion of the ship to be detected; devotes the distance change caused by target rotation. Its size is related to the position of the target scattering point. It is also the source of ISAR high-resolution imaging. This item is mainly caused by the swing of the ship itself. The purpose of envelope alignment is to remove the influence of on envelope offset. Because the scattering points caused by the two adjacent echoes move very little; that is, their real envelopes are very similar, the correlation of adjacent envelopes can be used for alignment. After envelope alignment, formula (14) becomes:
At this time, the overall offset of the envelope extracted using the envelope alignment can accurately reflect the radial velocity component of the ship; that is, for pseudo targets such as land, the radial component of the carrier has been completely removed and there is no radial velocity component in the SAR focusing process, so the envelope will not have the problem of over range cell migration. We take a range unit of SAR imaging as the threshold, and set the overall offset of the extracted envelope to exceed the threshold; that is, the target to be detected is considered as a ship target.
3.2. Entropy Judgment of Target to Be Detected
In order to eliminate the pseudo target in the target to be detected, according to the analysis of ship motion characteristics, it is difficult to determine this only by relying on a single judgment of ship radial motion speed, which needs to be further judged according to the motion characteristics of ship swing. In order to distinguish the pseudo target from the real ship target, it can be further distinguished by judging whether the target to be detected has achieved precise focusing, and the image entropy can directly reflect the image focusing quality. Therefore, this section proposes to combine the image entropy judgment method of the target to be detected with the radial velocity judgment method, to realize the precise focusing detection of the ship target.
The echo phase after envelope alignment still contains ; at this time, the influence of on the phase needs to be removed. After phase compensation, formula (14) can be rewritten as
According to formula (15), the echo is only affected by . After the above processing, the imaging of the target to be detected can be transformed into the ISAR imaging turntable model, and the geometric diagram is shown in Figure 8. The motion of the ship target is complex, and there are three dimensions of swing, resulting in the change of also being complex. Here, taking a point with coordinate as an example, the instantaneous phase can be obtained
where is the effective rotation speed. When the coherent accumulation angle is small, the rotation speed of the ship target can be considered as a constant. In formula (16), the primary rotation term determines the final focusing position of the target point without affecting the focusing quality. The secondary rotation term affects the focusing performance of the image. For the envelope migration caused by the rotation term, the keystone transform can remove its influence, and then the signals of each scattering point of the target can be controlled in a single range cell, which is conducive to subsequent processing. However, the phase is more obviously affected by rotation, resulting in time-varying echo Doppler. The traditional Fourier change cannot accurately estimate the Doppler frequency. It is necessary to use parameter estimation methods such as time-frequency analysis to estimate the time-frequency distribution of each range cell, and then to take out the frequency distribution at a certain time to form the ISAR image of the target according to the combination of range cell, to realize the precise focusing imaging of the target to be detected.
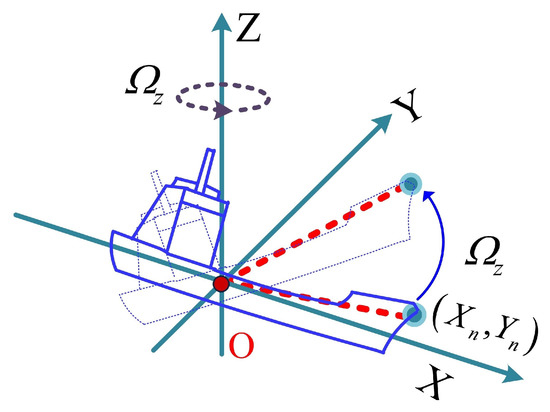
Figure 8.
ISAR turntable model of ship target.
ISAR imaging precise focusing processing is performed on all targets to be detected. For land targets, good focusing has been achieved during SAR imaging, and the change of image entropy is small. At this time, for ship targets, the image is defocused before ISAR precise focusing, so that the image entropy changes greatly before and after precise focusing. The change rate of image entropy can truly reflect whether the target to be detected is a ship target. For the target image (set to ) to be detected, is the pixel density and is the energy of the target image to be detected, and then the image entropy can be defined as
The minimum entropy change rate of the image, determined as the ship target via radial velocity judgment, is taken as the threshold, and those higher than this threshold are determined as the ship target [37]. Assuming that there are targets to be detected after rough detection of the ship targets, it is determined that there are ship targets among the targets to be detected according to the radial velocity of the ship targets. The entropy change rate is obtained by using statistics of image entropy before and after fine focusing on the ship targets, and then the precise detection and judgment is carried out on targets to be detected
To sum up, through the joint judgment of the radial velocity of the target to be detected and its motion characteristics such as swing, the target to be detected can be accurately detected, the pseudo target can be eliminated, and the false alarm rate can be reduced. The precise focusing of the ship target is realized in the process of precise detection.
4. Simulation Verification and Processing of Field Data
In order to verify the effectiveness of the proposed ship detection and imaging algorithm, simulation data and field data are used to illustrate the effectiveness of image preprocessing. The simulation data are used to illustrate the effectiveness of image preprocessing, the radial velocity judgment method in ship detection and ISAR imaging, and the measured data are used to verify the effectiveness of the whole algorithm.
4.1. Simulation Data Verification
The simulation geometric model is shown in Figure 9. There are three ship targets in the scene, and the ship model is shown in Figure 10. The motion parameters of the mobile platform are shown in Table 1, and the ship motion parameters are shown in Table 2. In the simulation scene, a ship target is placed at the center of the beam. In addition, one ship target is placed along and perpendicular to the radar line of sight, with an interval of 1 km; B and C move at a speed of 10 m/s along the route, while A swings in place. In the echo data at this time, A and C exist in the same distance unit and cannot be separated.
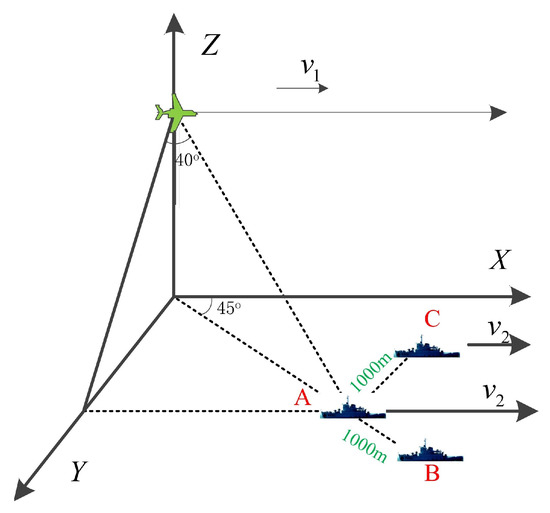
Figure 9.
Geometric diagram of ship target imaging simulation by airborne radar.
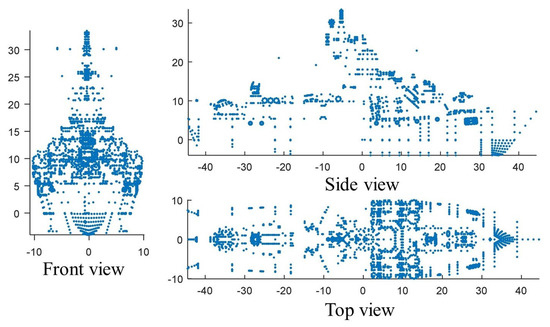
Figure 10.
Ship model diagram.

Table 1.
SAR system parameters. A linear FM signal is used for transmission.
Table 2.
Ship motion parameters.
Figure 11 shows the image of the SAR coarse focus, in which the ship targets A and C cannot be separated from the data domain on the same range unit, and can be separated in the image domain after coarse focus. Since ship target A has no speed, its final focus position is located at the azimuth center, while for ships B and C, their radial speeds make them deviate from the azimuth center. After ship detection, the ship target is accurately separated, as shown in the rectangular window in Figure 11. The separated ship targets can be obtained by returning the detection results to the original SAR image, as shown in Figure 12. It is easy to see that the ship target after SAR coarse focus processing has poor imaging results due to the motion component of the ship itself, which cannot meet the imaging requirements. Further ISAR precise focus imaging is needed.
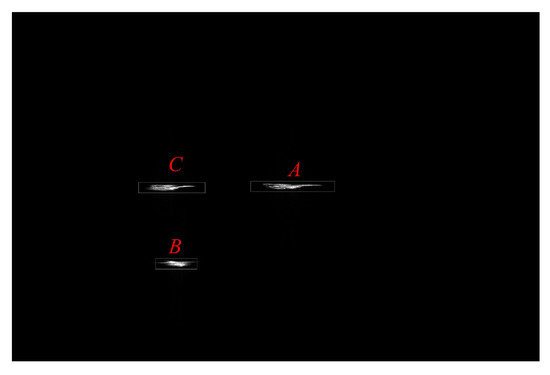
Figure 11.
SAR rough focusing and ship detection result.
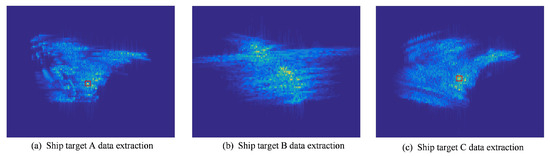
Figure 12.
Ship target extraction result.
In order to verify the effectiveness of using radial velocity to determine the ship target in ship precision detection, the point target with the largest energy is extracted from ship targets A and C as the reference point, respectively, and the target is placed in the data center for azimuth eight-fold upsampling interpolation. It can be found that the main energy peaks are located in the center at this time, as shown by the dotted line in Figure 13. The radial velocity of the reference point is determined. After determination, it is found that the point with radial velocity deviates from the central position, while the point target without radial velocity is still in the central position. This phenomenon verifies that the radial velocity will cause the final position offset of the azimuth point, and it can determine whether the target is a ship. It should be noted that this method can only determine that the target to be detected is a ship target, but it cannot be sure that it must not be a ship target. The determination of radial velocity provides a certain basis for the subsequent precise detection of the entropy change rate.
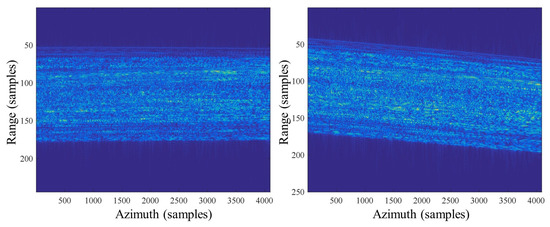
Figure 13.
Determination result of ship target radial velocity.
Next, ISAR imaging is performed on the separated individual targets, and the results are shown in Figure 14. It can be seen that after ISAR imaging, the imaging results of each target are clearer, and the structure of the ship target can be distinguished. In addition, due to the complex sway of the ship target, the imaging plane of each ISAR image is different, which leads to different observation angles of each ISAR image to the ship target; furthermore, due to the difference in the rotating speed of each target relative to the line of sight of the radar, the ISAR imaging result and size are both different.
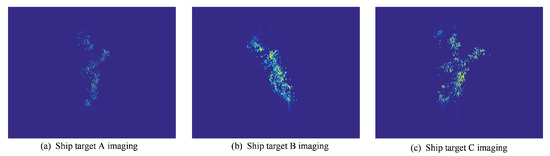
Figure 14.
ISAR precise focus imaging results.
4.2. Processing Results of Field Data
In order to verify the effectiveness of the proposed algorithm, the field data of a certain spaceborne SAR (the field data in the preprocessing of this article) is used. Figure 15 shows the detection results of a spaceborne SAR ship using the reference detection algorithm in [37]. The reference algorithm in [37] only uses a single K distribution for detection. It can be seen that the use of a single distribution model will cause most ship targets to miss alarms, as shown by the elliptical dashed line in the figure. In addition, because the reference algorithm does not have a precise detection algorithm, there is a certain false alarm in the final detection result, as shown by the rectangular dashed box in Figure 15a. Moreover, we also use a deep learning network for ship target detection. The detected network is YOLOx, and the training data adopts the SSDD data and HRSID data; the detection results are shown in Figure 15b. It can be seen from Figure 15b that some small ships are not detected. Therefore, the detection accuracy of the ship detection method based on deep learning is relatively low, and the alarm leakage rate is high. This is mainly because the deep learning method may be greatly affected by the size of the ship target.
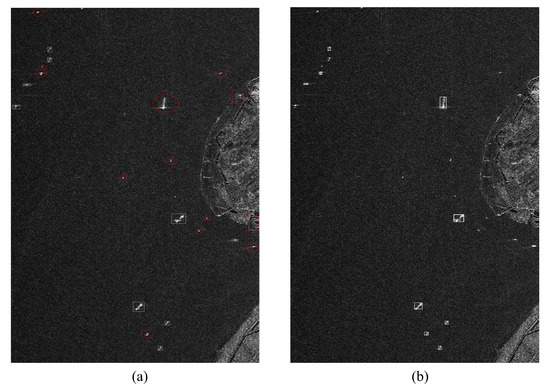
Figure 15.
Results of reference algorithm. (a) The reference algorithm in [37]; (b) Deep learning network.
Figure 16a is the rough detection result of the ship mentioned in this paper. It can be seen that the proposed mixed distribution is more accurate than the single distribution model in the rough detection, and there is no missing alarm. However, there are still three false targets on land (dotted rectangular box) in rough detection, which has a certain false alarm rate. In order to reduce this false alarm, the precise detection algorithm proposed in this paper is further adopted. As shown in Figure 16b, three land targets are eliminated, which reduces the false alarm rate to a certain extent. It should be noted that there may be a false alarm target in the detection result of the algorithm proposed in this paper, as shown in the triangular area in the figure.
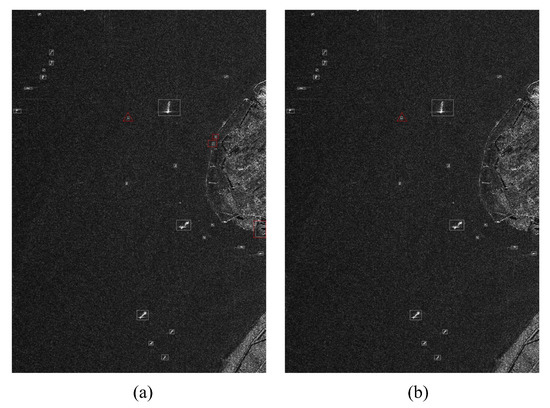
Figure 16.
Detection results of the proposed algorithm. (a) Rough detection results; (b) Precise detection results.
Further, taking the real data of a helicopter-borne SAR on a sea port as an example, the focus image of the SAR to be detected is shown in Figure 17a. It can be seen that the land part is well focused, but the ship target and other targets are defocused due to their own motion. The reference algorithm is used to detect ship targets in the image to be detected, and the result is shown in Figure 17b; similar to the results of the above-mentioned spaceborne SAR, the reference algorithm has certain missed and false alarms. The rough detection results of the proposed method are shown in Figure 17c, and it can be found that the proposed method does not have missing alarms, but there are still some false alarms. In order to more clearly reflect the comparison between the ship target reference algorithm and the rough detection result of the proposed algorithm, we extract the result of the reference algorithm and the rough detection result of the ship. As shown in Figure 17c,d, it can be seen that in the rough detection of the ship, compared with the reference algorithm, there are more false alarm targets (shown in the dashed box). After the coarse detection of 38 ship targets to be detected, it can be determined that there are 5 ship targets based on the prediction of radial motion. The minimum change in entropy of these five ship targets is 0.2193, as shown by the dotted line in Figure 18. Using this as a threshold to perform entropy change rate statistics on the remaining ship targets, 18 pseudo-targets are eliminated out of 38 targets, and the final 20 accurate ship targets are obtained, as shown in Figure 17f. Figure 17g shows the results of the detection algorithm based on the deep learning network. From Figure 17g and Table 3, one can see that its detectability is the worst, mainly because the detection algorithm of the deep learning network is sensitive to the quality of the image to be detected. Since the image to be detected is seriously defocused, the detection ability of the deep learning algorithm is weak. In actuality, the image to be detected may not be perfectly focused, and so it may be difficult for the detection algorithm based on deep learning to achieve a good performance. Compared with the traditional detection algorithm, the proposed method has a higher detection accuracy and can better adapt to the complex detection environment after two-step detection processing.
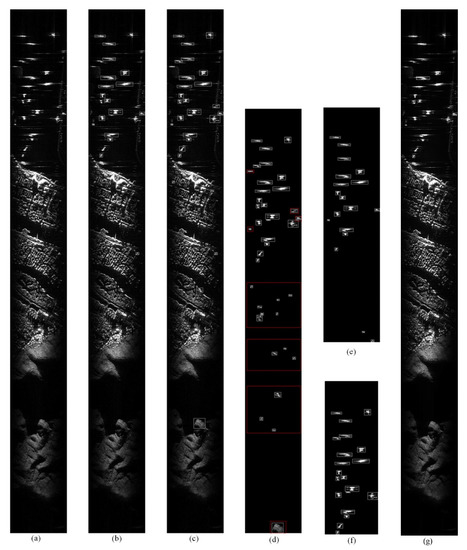
Figure 17.
Comparison of detection results between the reference algorithm and proposed algorithm. (a) SAR focus image to be detected; (b) Reference algorithm detection results; (c) The rough detection results of the proposed algorithm; (d) Extraction of rough detection results of the proposed algorithm; (e) Reference algorithm detection result extraction; (f) Extraction of precise detection results using the proposed algorithm; (g) Results based on deep learning network.
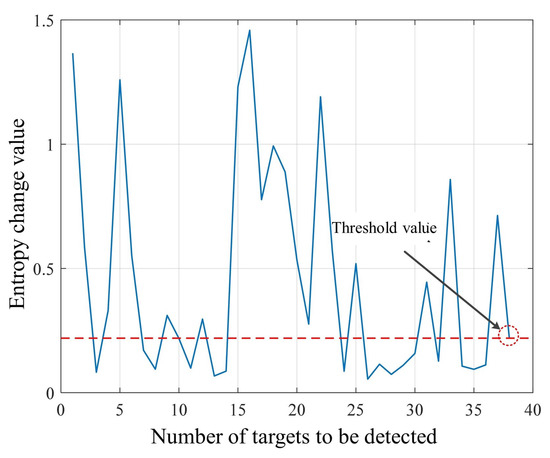
Figure 18.
Entropy change rate result.
Table 3.
Results of ship detection.
In order to further measure the quality of ship inspection, this article uses the quality factors of inspection to describe it, which can be expressed as
where denotes the accurate number of detected ships, denotes the actual number of ship targets in the image to be detected, and denotes the number of false alarms. When the quality factor is closer to 1, the ship detection effect is better. Table 3 shows the quality factors of the reference algorithm and the proposed algorithm in the measured data, and the comparison shows that the proposed algorithm has better detection performance, which verifies the effectiveness of the proposed method.
Taking a single target separated from the helicopter-borne SAR data as an example (the elliptical area in Figure 17f), ISAR imaging is performed on it. The result is shown in Figure 19. Swing and other factors cause the image to be severely defocused. After ISAR focus processing, the target is well focused, and the ship target can be further calibrated to determine and recognize the size of the ship.
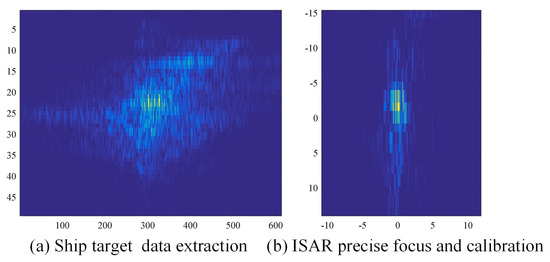
Figure 19.
Ship target data extraction and fine focusing processing.
5. Conclusions
In the process of ship target detection in a coastal area via airborne SAR, due to the influence of complex sea clutter distribution, land, and other factors, the traditional detection algorithm may not be applicable. Based on this, this paper proposes a two-step hierarchical processing algorithm of rough detection and precise detection. First, the image preprocessing is used to eliminate the land area, and the target to be detected is obtained by using an adaptive background window. Afterwards, considering that the traditional single background distribution model may not be suitable for complex sea backgrounds, a K-lognormal mixture distribution model combining background and target is proposed, and is combined with the CFAR detection algorithm to achieve a rough detection of ship targets. Finally, it is further proposed to use the ship’s own motion characteristics to determine whether the target to be detected is a ship target, so as to realize the precise detection of the ship. The proposed method can adaptively set the background window size in combination with the target, while avoiding a high number of false alarms and missed detections, and can effectively detect ship-like targets in complex sea conditions. The measured data verifies the effectiveness of the proposed method.
Author Contributions
Z.L. developed the proposed approach and wrote the manuscript. Z.L., Y.X. and J.C. conducted the experiments and organized the manuscript. H.Y., H.Z. and B.G. commented on the manuscript and made useful suggestions. All authors have read and agreed to the published version of the manuscript.
Funding
This research was funded by the National Natural Science Foundation of China, grant number 61901531, and the Natural Science Foundation of Hunan Province, grant number 2021JJ40781.
Data Availability Statement
Not applicable.
Acknowledgments
The authors thank all the anonymous reviewers for their valuable comments, which helped to improve the quality of this article.
Conflicts of Interest
The authors declare no conflict of interest.
References
- Cumming, G.; Wong, F.H. Digital Processing of Synthetic Aperture Radar Data. Algorithms Implement. 2015, 1, 108–110. [Google Scholar]
- Chen, J.; Zhang, J.; Jin, Y.; Yu, H.; Liang, B.; Yang, D.G. Real-Time Processing of Spaceborne SAR Data with Nonlinear Trajectory Based on Variable PRF. IEEE Trans. Geosci. Remote Sens. 2022, 60, 1–12. [Google Scholar] [CrossRef]
- Li, Z.; Xing, M.; Liang, Y.; Gao, Y.; Chen, J.; Huai, Y.; Zeng, L.; Sun, G.C.; Bao, Z. A frequency-domain imaging algorithm for highly squinted SAR mounted on maneuvering platforms with nonlinear trajectory. IEEE Trans. Geosci. Remote Sens. 2016, 54, 4023–4038. [Google Scholar] [CrossRef]
- Askari, F.; Zerr, B. Automatic Approach to Ship Detection in Spaceborne Synthetic Aperture Radar Imagery: An Assessment of Ship Detection Capability Using Radarsat. Technical Report SACLANTCEN-SR-338. 2000. Available online: https://www.semanticscholar.org/paper/An-Automatic-Approach-to-Ship-Detection-in-Aperture-Askari-Zerr/0881f3c222242988c05442fb6475adf94064128f?p2df (accessed on 7 June 2022).
- Velotto, D.; Nunziata, F.; Migliaccio, M.; Lehner, S. Dual-Polarimetric TerraSAR-X SAR Data for Target at Sea Observation. IEEE Geosci. Remote Sens. Lett. 2013, 10, 1114–1118. [Google Scholar] [CrossRef]
- Sun, Z.; Dai, M.; Leng, X.; Lei, Y.; Xiong, B.; Ji, K.; Kuang, G. An Anchor-Free Detection Method for Ship Targets in High-Resolution SAR Images. J. Sel. Top. Appl. Earth Obs. Remote Sens. 2021, 14, 7799–7816. [Google Scholar] [CrossRef]
- Chen, J.; Yu, H.; Liang, B.; Peng, J.; Sun, G.C. MoCo/Autofocus in Airborne Synthetic Aperture Radar: A Review. IEEE Geosci. Remote Sens. Mag. 2022, 10, 185–206. [Google Scholar] [CrossRef]
- Gao, G.; Shi, G. Ship Detection in Dual-Channel ATI-SAR Based on the Notch Filter. IEEE Trans. Geosci. Remote Sens. 2017, 55, 4795–4810. [Google Scholar] [CrossRef]
- Gao, G.; Luo, Y.; Ouyang, K.; Zhou, S. Statistical Modeling of PMA Detector for Ship Detection in High-Resolution Dual-Polarization SAR Images. IEEE Trans. Geosci. Remote Sens. 2016, 54, 4302–4313. [Google Scholar] [CrossRef]
- Gao, G.; Wang, X.; Lai, T. Detection of Moving Ships Based on a Combination of Magnitude and Phase in Along-Track Interferometric SAR—Part I: SIMP Metric and Its Performance. IEEE Trans. Geosci. Remote Sens. 2015, 53, 3565–3581. [Google Scholar] [CrossRef]
- Gao, G.; Wang, X.; Lai, T. Detection of Moving Ships Based on a Combination of Magnitude and Phase in Along-Track Interferometric SAR—Part II: Statistical Modeling and CFAR Detection. IEEE Trans. Geosci. Remote Sens. 2015, 53, 3582–3599. [Google Scholar] [CrossRef]
- Leng, X.; Ji, K.; Zhou, S.; Xing, X. Ship Detection Based on Complex Signal Kurtosis in Single-Channel SAR Imagery. IEEE Trans. Geosci. Remote Sens. 2019, 57, 6447–6461. [Google Scholar] [CrossRef]
- Joshi, S.K.; Baumgartnerv, S.V. Automatic CFAR Ship Detection in Single–Channel Range-Compressed Airborne Radar Data. In Proceedings of the 2019 20th International Radar Symposium (IRS), Ulm, Germany, 26–28 June 2019. [Google Scholar] [CrossRef]
- Joshi, S.K.; Baumgartner, S.V. Sea clutter model comparison for ship detection using single channel airborne raw SAR data. In Proceedings of the 12th European Conference on Synthetic Aperture Radar, Aachen, Germany, 4–7 June 2018. [Google Scholar]
- Chen, C.; He, C.; Hu, C.; Pei, H.; Jiao, L. A Deep Neural Network Based on an Attention Mechanism for SAR Ship Detection in Multiscale and Complex Scenarios. IEEE Access 2019, 7, 104848–104863. [Google Scholar] [CrossRef]
- Fu, J.; Sun, X.; Wang, Z.; Fu, K. An Anchor-Free Method Based on Feature Balancing and Refinement Network for Multiscale Ship Detection in SAR Images. IEEE Trans. Geosci. Remote Sens. 2021, 59, 1331–1344. [Google Scholar] [CrossRef]
- Bao, W.; Huang, M.; Zhang, Y.; Xu, Y.; Liu, X.; Xiang, X. Boosting Ship Detection in SAR Images With Complementary Pretraining Techniques. IEEE J. Sel. Top. Appl. Earth Obs. Remote Sens. 2021, 14, 8941–8954. [Google Scholar] [CrossRef]
- Deng, Z.; Sun, H.; Zhou, S.; Zhao, J. Learning Deep Ship Detector in SAR Images From Scratch. IEEE Trans. Geosci. Remote Sens. 2019, 57, 4021–4039. [Google Scholar] [CrossRef]
- Yang, R.; Pan, Z.; Jia, X.; Zhang, L.; Deng, Y. A Novel CNN-Based Detector for Ship Detection Based on Rotatable Bounding Box in SAR Images. IEEE J. Sel. Top. Appl. Earth Obs. Remote Sens. 2021, 14, 1938–1958. [Google Scholar] [CrossRef]
- Zhang, X.; Huo, C.; Xu, N.; Jiang, H.; Cao, Y.; Ni, L.; Pan, C. Multitask Learning for Ship Detection From Synthetic Aperture Radar Images. IEEE J. Sel. Top. Appl. Earth Obs. Remote Sens. 2021, 14, 8048–8062. [Google Scholar] [CrossRef]
- Cui, Z.; Li, Q.; Cao, Z.; Liu, N. Dense Attention Pyramid Networks for Multi-Scale Ship Detection in SAR Images. IEEE Trans. Geosci. Remote Sens. 2019, 57, 8983–8997. [Google Scholar] [CrossRef]
- He, Y.; Gao, F.; Wang, J.; Hussain, A.; Yang, E.; Zhou, H. Learning Polar Encodings for Arbitrary-Oriented Ship Detection in SAR Images. IEEE J. Sel. Top. Appl. Earth Obs. Remote Sens. 2021, 14, 3846–3859. [Google Scholar] [CrossRef]
- Avolio, C.; Zavagli, M.; Paterino, G.; Paola, N.; Costantini, M. A Near Real Time CFAR Approach for Ship Detection on Sar Data Based on a Generalised-K Distributed Clutter Estimation. In Proceedings of the 2021 IEEE International Geoscience and Remote Sensing Symposium IGARSS, Brussels, Belgium, 11–16 July 2021. [Google Scholar] [CrossRef]
- Idicula, S.M.; Paul, B. Real time SAR Ship Detection using novel SarNeDe method. In Proceedings of the 2021 IEEE International Geoscience and Remote Sensing Symposium IGARSS, Brussels, Belgium, 11–16 July 2021. [Google Scholar] [CrossRef]
- Zhu, M.; Hu, G.; Zhou, H.; Wang, S. H2Det: A High-Speed and High-Accurate Ship Detector in SAR Images. IEEE J. Sel. Top. Appl. Earth Obs. Remote Sens. 2021, 14, 12455–12466. [Google Scholar] [CrossRef]
- Wang, Z.; Wang, R.; Fu, X.; Xia, K. Unsupervised Ship Detection for Single-Channel SAR Images Based on Multiscale Saliency and Complex Signal Kurtosis. IEEE Geosci. Remote Sens. Lett. 2022, 19, 1–5. [Google Scholar] [CrossRef]
- Hou, B.; Chen, X.; Jiao, L. Multilayer CFAR Detection of Ship Targets in Very High Resolution SAR Images. IEEE Geosci. Remote Sens. Lett. 2015, 12, 811–815. [Google Scholar] [CrossRef]
- Dai, H.; Du, L.; Wang, Y.; Wang, Z. A Modified CFAR Algorithm Based on Object Proposals for Ship Target Detection in SAR Images. IEEE Geosci. Remote Sens. Lett. 2016, 13, 1925–1929. [Google Scholar] [CrossRef]
- Wang, Y.; Liu, H. A Hierarchical Ship Detection Scheme for High-Resolution SAR Images. IEEE Trans. Geosci. Remote Sens. 2012, 50, 4173–4184. [Google Scholar] [CrossRef]
- Crisp, D.J. The State-of-the-Art in Ship Detection in Synthetic Aperture Radar Imagery; Defence Science and Technology (DSTO), Department of Defence, Australian Government: Canberra, ACT, Australia, 2004. [Google Scholar]
- Schleher, D.C. Radar detection in Weibull clutter. IEEE Trans. Aerosp. Electron. Syst. 1976, 6, 736–743. [Google Scholar] [CrossRef]
- Bocquet, S. Calculation of Radar Probability of Detection in K-Distributed Sea Clutter and Noise. Research Report DSTO-TN-1000. 2011. Available online: https://xueshu.baidu.com/usercenter/paper/show?paperid=6e85578c572b4f657536e67471f322e4 (accessed on 7 June 2022).
- Qin, X.; Zhou, S.; Zou, H.; Gao, G. A CFAR detection algorithm for generalized Gamma distributed background in high-resolution SAR images. IEEE Geosci. Remote Sens. Lett. 2013, 10, 806–810. [Google Scholar] [CrossRef]
- Liu, T.; Yang, Z.; Yang, J.; Gao, G. CFAR Ship Detection Methods Using Compact Polarimetric SAR in a K-Wishart Distribution. IEEE J. Sel. Top. Appl. Earth Obs. Remote Sens. 2019, 12, 3737–3745. [Google Scholar] [CrossRef]
- Zhou, X.; Peng, R.; Wang, C. A two-component K-lognormal mixture model and its parameter estimation method. IEEE Trans. Geosci. Remote Sens. 2015, 53, 2640–2651. [Google Scholar] [CrossRef]
- Blacknell, D. Comparison of parameter estimators for K-distribution. Radar Sonar Navig. IEE Proc. 1994, 141, 45–52. [Google Scholar] [CrossRef]
- Wang, X.; Chen, C. Ship Detection for Complex Background SAR Images Based on a Multiscale Variance Weighted Image Entropy Method. IEEE Geosci. Remote Sens. Lett. 2017, 14, 184–187. [Google Scholar] [CrossRef]
Publisher’s Note: MDPI stays neutral with regard to jurisdictional claims in published maps and institutional affiliations. |
© 2022 by the authors. Licensee MDPI, Basel, Switzerland. This article is an open access article distributed under the terms and conditions of the Creative Commons Attribution (CC BY) license (https://creativecommons.org/licenses/by/4.0/).