Abstract
The study evaluates the impacts of India’s COVID-19 lockdown and unlocking periods on the country’s ambient air quality. India experienced three strictly enforced lockdowns followed by unlocking periods where economic and social restrictions were gradually lifted. We have examined the in situ and satellite data of NO2 emissions for several Indian cities to assess the impacts of the lockdowns in India. Additionally, we analyzed NO2 data acquired from the Sentinel-5P TROPOMI sensor over a few districts of the Punjab state, as well as the National Capital Region. The comparisons between the in situ and satellite NO2 emissions were performed for the years 2019, 2020 and up to July 2021. Further analysis was conducted on the satellite data to map the NO2 emissions over India during March to July for the years of 2019, 2020 and 2021. Based on the in situ and satellite observations, we observed that the NO2 emissions significantly decreased by 45–55% in the first wave and 30% in the second wave, especially over the Northern Indian cities during the lockdown periods. The improved air quality over India is indicative of reduced pollution in the atmosphere due to the lockdown process, which slowed down the industrial and commercial activities, including the migration of humans from one place to another. Overall, the present study contributes to the understanding of the trends of the ambient air quality over large geographical areas using the Sentinel-5P satellite data and provides valuable information for regulatory bodies to design a better decision support system to improve air quality.
1. Introduction
In the last week of December 2019, an unusual type of pneumonia spreading quickly was reported in Wuhan city in the People’s Republic of China [1]. During the early period, it was treated as a new form of pneumonia. After a group of infections was reported by Wuhan Municipal Health Commission to the World Health Organization (WHO) on 31 December 2019, the WHO published the first news of the outbreak of this virus on 5 January 2020 by identifying it as Coronavirus Disease 2019 (COVID-19), a sequel of pneumonia [2]. The patients with this disease showed similar symptoms as of Severe Acute Respiratory Syndrome (SARS) and Middle East Respiratory Syndrome (MERS) [3]. Following this, several studies suggested that COVID-19 patients suffered from coughs, severe body pain, unusually high fever, fatigue, loss of smell and taste, infection in the lungs and shortness of breath or breathing difficulties, resulting in unpreventable casualties [4,5]. On 13 January 2020, the first international case of COVID-19 was reported in Thailand (https://www.who.int/news-room/detail/29-06-2020-covidtimeline, accessed on 21 August 2020). In response to the increased cases of COVID-19 in Wuhan, the first lockdown was implemented by the Chinese authorities on 23 January 2020, which resulted in the prohibition of gatherings and the movement of individuals. With the sharp and continuous amplification of COVID-19-positive cases around the world, the WHO declared the novel coronavirus outbreak a Public Health Emergency of International Concern (PHEIC) on 30 January 2020, and on the same day, the first COVID-19-positive case was registered in India (https://www.mohfw.gov.in/, accessed on 21 August 2020). Subsequently, the WHO declared the COVID-19 outbreak as a pandemic on 11 March 2020 (by this time, a total of 71 confirmed cases of COVID-19 had been reported in India). It was observed that the known modes of transmission of COVID-19 were in the form of coughs/sneezes, personal contact, contaminated objects and mass gatherings, and, so far, the identified methods of prevention against COVID-19 are physical distancing, quarantine, maintaining hand hygiene, wearing face masks and avoiding contact with virus-infected persons [6,7]. Moreover, several studies have also reported that the rate of spread of COVID-19 may vary with varying atmospheric conditions, such as temperature, pressure, rainfall etc. [2,3,8,9,10].
According to the Worldometer elaboration of the latest United Nations data, the population of India totals 1,380,004,385 (as of 2020), representing approximately 17.7% of the world’s population, and the average population density is 464 per km2 and ranks 31st in the world (https://www.worldometers.info/world-population/india-population, accessed on 21 August 2020). Considering the potential explosion of COVID-19-positive cases in such a hugely and densely populated country, from 25 March 2020 to 14 April 2020, the Indian government announced and implemented a nationwide complete lockdown for 21 days (Table 1). This was followed by less restrictive lockdowns and unlocking in phases (see Table 2 for more details on these lockdown/unlocking phases). During the lockdown periods, most of the economic activities, trade, industry, employment for daily wage workers, school, colleges, universities and public and private companies’ offices were either halted or completely shut down, resulting in reduced power consumption (e.g., Aruga et al. [11]) and a massive loss in GDP (e.g., Kanitkar [12]). By August 2020, most social distancing restrictions were lifted due to the severe impacts of the lockdowns on people’s livelihoods and social relationships [13,14,15,16,17,18].

Table 1.
Lockdown and unlocking phases in India, duration and areas closed/opened (excluding the unlocking phase 4 from 1 September to 30 September 2020).

Table 2.
Lockdown and unlocking phases in India, duration and areas closed/opened (excluding the unlocking phase in 2021 during wave 2).
However, by mid-September, 2020, the death toll from COVID-19 in India had risen to around 75,000, and the disease was spreading rapidly due to the total cessation of the lockdowns and the opening of commercial and economic activities, as well as the increasing dominance of the more contagious COVID-19 “delta” variant. Although the world economy was drastically slowed due to the lockdowns imposed by various countries, the virus is thought by many to have been a boon for environmental recovery (for the atmospheric environment in particular). For the first time since the industrial revolution, all of the industrial activities in India and around the world were suspended during the lockdown period, giving the atmospheric environment time to recover due to the absence of industrial air pollution.
In the last two decades, global warming and climate change have emerged as hot topics for scientific research, which led to the study of and research on the phenomena behind global warming, climate change and pollution in the Earth’s atmosphere. Over the years, pollution has largely impacted the ecology and environment, as well as human health, due to air pollutants such as ozone (O3), nitrogen dioxide (NO2), carbon monoxide (CO), particulate matter (PM) in different size fractions (PM0.1 μm, PM2.5 μm and PM10 μm), volatile organic compounds (VOCs) and polycyclic aromatic hydrocarbons (PAHs), which have led to oxidative stress, viral and bacterial infections, asthma, hypertension, heart disease and chronic lung disease, and may further lead to damage to the cardio-respiratory and immune systems [19,20,21,22,23]. Due to COVID-19 restrictions around the world, there was a significant decrease in the consumption of diesel, petrol and other petroleum fuels’ combustion, which also led to a significant reduction in NO2 emissions in the developing (India, China, etc.) and western developed world [24,25]. Several studies have been conducted to understand the impacts of lockdown periods on ambient air quality at national and global scales.
Such studies have shown that the cessation of industrial units and vehicular movement caused a great improvement in air quality [26,27,28,29]. Air pollution and air quality have become global issues, and have impacts at the local, regional and global scale. Particulate matter and pollutant gases (NOx/SOx/CO) not only affect the environment, but also affect human health and cause various types of respiratory problems. Various studies have shown the influence of aerosols on the radiation budget [30,31], human health [32] and even the intensity of monsoons [33]. Long-term exposure to particulate matter, NOx and ozone can cause an increase in cardiovascular mortality [34,35]. According to the national ambient air quality monitoring program, the particulate matter (PM2.5 and PM10) emissions are the highest in India, followed by NO2, SO2 and CO [36]. The primary source of NOx pollutants is anthropogenic action, industrial activities and exhausts from vehicles. The air quality index (AQI) and the corresponding NO2 concentrations are shown in Table 3. During the lockdown periods, all industrial, manufacturing and engineering activities, as well as all types of traffic, were suspended by the government of India, and this improved the air quality to a great extent.

Table 3.
AQI categories and concentration ranges for India (source: CPCB).
This paper investigates the impact of the lockdown and unlocking periods on the atmospheric environment of India during 2019, 2020 and 2021, through an analysis of in-situ and Sentinel-5P satellite remote sensing data. A key point of this research is to evaluate in situ emissions of NO2 against satellite-based NO2, so as to better understand the accuracy of the satellite estimates. To our knowledge, this is the most comprehensive study on the spatio-temporal variation of atmospheric NO2 during the COVID-19 era (2019–2021) in India. First, an analysis of in situ data was conducted for several northern cities in India to understand the trends in air quality and validate the satellite-based estimates. Subsequently, a national-level analysis was conducted using the satellite data to understand the overall air quality status during India’s national lockdown and unlocking periods. This research effort highlights the promising applications of combining in-situ and satellite-based approaches to assess changes in the air quality over Indian cities, and can potentially be applied in other countries in future works.
2. Data and Methods
In this study, we used a combination of satellite remote sensing data (Sentinel-5P data), in situ NO2 data and climate forecast data, as explained in more detail below.
2.1. Datasets
2.1.1. Sentinel-5P Data
TROPOMI is a passive-sensing hyperspectral nadir-viewing imager onboard the Sentinel-5 Precursor (S-5P) satellite, launched on 13 October 2017. The S-5P is a near-polar sun-synchronous orbit satellite flying at a height of 817 km, with an overpass local time at ascending node (LTAN) of 13:30 and a repeat cycle of 17 d (KNMI, 2017). The TROPOMI works in a non-filtering push broom setup, with an instantaneous field of view of 108° and an estimated time of around 1 s. The outcome is an area width of approximately 2600 km and an along-track goal of 7 km and day-by-day worldwide inclusion (KNMI, 2017). It has four separate spectrometers, measuring the ultraviolet (UV), UV–visible (UV-VIS), near-infrared (NIR) and short-wavelength infrared (SWIR) spectral bands, of which the NIR and SWIR bands are new compared to its predecessor, OMI [37]. The NO2 sections are inferred utilizing TROPOMI’s UV–vis spectrometer backscattered sunlight-based radiation estimations in the 405–465 nm frequency range [38,39]. The swath area is partitioned into 450 individual valuation pixels, which bring about a close nadir resolution of 7 × 3.5 km. The total NO2 slant column density is retrieved from Level 1b UV–vis radiance and solar irradiance spectra utilizing the DOAS strategy [40]. The NO2 retrieval and assimilation scheme and the data product have been described in detail [37,38,39,41,42].
The TROPOMI NO2 processing system is based on the algorithm developments for the DOMINO-2 product and for the EU QA4ECV NO2 reprocessed dataset for OMI and has been adopted for TROPOMI. The assimilation modeling system uses the 3-dimensional global TM5-MP chemistry transport model at a resolution of 1 × 1 degree as an essential element. In this research, near-real-time NO2 concentration images were created using the Google Earth engine. These images were pre-processed and corrected and stored in the Google Earth engine database.
2.1.2. Station Data
Station data of Amritsar, Bhatinda, Ludhiana Jalandhar, Khanna, Patiala, Delhi–Anand Vihar, Gurugram, Ghaziabad and Noida were obtained from the dashboard of the Central Control Room for Air Quality Management—All India.
2.1.3. CFSR
The Climate Forecast System, NCEP version 2 (CFSv2), is an upgraded version of CFS version 1 (CFSv1). It is a reanalysis product first developed as part of the Climate Forecast System by NCEP in 2004, with quasi-global coverage, and is a fully coupled atmosphere–ocean–land model used by NCEP for seasonal prediction [43]. CFSR has a 3D variational analysis scheme of the upper-air atmospheric state, with 64 vertical levels and a horizontal resolution of 38 km, spanning the period 1 January 1979 to the present day [43].
2.2. Methodology
For our study, we utilized the in-site atmospheric NO2 data (obtained from the Central Control Room for Air Quality Management—All India) over North Indian cities, especially of Punjab state, from January 2019 to July 2021, covering the pre-COVID-19 period as well as all lockdown and unlocking periods during the first and second COVID-19 waves. NO2 is one of the major air pollutants in India and is highly dependent on local sources because of its short residential time in the atmosphere [44]. The in situ data were compared with remote sensing data from the Sentinel-5P/Tropospheric Monitoring Instrument (TROPOMI) acquired during the same period, to understand the utility of remote sensing data for places where actual in situ data are not available for the continuous monitoring of air pollutants.
3. Results and Discussion
During pre-monsoon season (March to May), the north-west region of India heats up due to the location of the sun over the Tropic of Cancer. A hot, low-pressure area develops over this region because of this excessive heating. During this season, the normal surface wind direction is westerly to north-westerly and wind speed is between 1 and 19 kmph. Normally, the sky remains cloud-free and this helps in radiative cooling during nighttime. The maximum day temperature ranges from 26 °C to 41 °C and the minimum temperature ranges from 11 °C to 25 °C. The normal monthly rainfall, between 16 mm and 34 mm, is received during this season. Thunderstorms and associated rainfall are caused due to the interaction of westerlies and easterlies under the influence of passing western disturbances. These interactions often lead to the formation of dust storms, locally known as Andhis. After pre-monsoon season, monsoon season prevails from June to September. It is the main rainfall season for this region. The onset of monsoonal rains happens by the last week of June. The wind direction also reverses and the easterlies set in, which brings moisture-laden winds to the region. With the onset of monsoonal rainfall, the day and night temperatures show a significant drop.
During the morning hours, a low-level temperature inversion is formed because of radiative cooling of the ground. This inversion leads to the trapping of air pollutants near to the ground level, because of which the ambient air quality deteriorates. This low-level inversion is broken after the heating of the ground by the sun during the day. The clear skies and wind flow help in the dispersion of air pollutants. The effect of meteorological parameters over the dispersion of air pollutants was observed in all preceding and following years and during the current study period. Meteorological parameters only affect the transport media in the source–transport–receptor analysis of air pollution. The COVID-19-induced lockdowns resulted in the closure of pollution-generating sources. As a result, the ambient air quality improved drastically, as discussed below.
Figure 1 shows the concentration of NO2 emissions over India, obtained from the Sentinel-5P, from March to July 2019. It is observed that high values of NO2 emission clusters are recorded over the thermal power plant belts of Punjab, the National Capital Region (NCR) of Delhi, Western Uttar Pradesh, Chhattisgarh, Jharkhand, Orissa and West Bengal. An extremely high NO2 concentration of greater than 321 mole/km2 was observed over a few areas. Figure 2 depicts the concentrations of NO2 emissions over India from March to July 2020. After forced lockdown 1 on 24 March 2020 by the Indian government, more than half of the country experienced low NO2 concentrations (i.e., below 70 moles/km2) (see Figure 2). A reduced NO2 concentration was observed in the early stage of lockdown 1 itself, even in the high-concentration clusters in the thermal power plant belts and Northern India. This fall in the thermal power plant belt was attributed to a drop in power requirements because of the shutdown of all industrial activities due to lockdown 1. The same trend was observed in April and May 2020 during other lockdown periods. Only a few industries were permitted to operate during unlocking period 1, which started on 1 June 2020. We observed that the NO2 emissions over India remained low in June and July 2020, compared to that in June and July 2019. Figure 3 depicts the concentrations of NO2 emissions over India from March to July 2021. As the lockdown imposed in 2021 was not as strict as that of 2020 and industries were permitted to operate, it can be seen that the NO2 emissions in 2021 were of the same level as in 2019. The changes in NO2 concentration over eight cities of NW India, namely Amritsar, Jalandhar, Khanna, Patiala Delhi–Anand Vihar Terminal, Gurugram, Ghaziabad and Noida, during March–July of 2019 to 2021, are shown in Table 4. The NO2 concentrations were reduced significantly over these eight cities in the year 2020, with respect to 2019 and 2021. An approximately 18% reduction in average NO2 concentration was observed in 2020 with regard to concentrations in 2019, and around a 19% increase in the average NO2 concentration was observed in 2021 with respect to concentrations in 2020 during March–July. The maximum reduction of 28% in the average monthly NO2 concentration over all cities was observed in the month of April 2020 with respect to April 2019. Similarly, the maximum increase of 36% was observed in April 2021 with respect to April 2020.
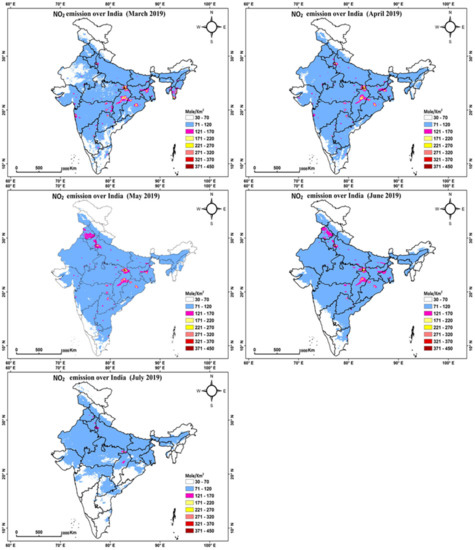
Figure 1.
NO2 emissions over India as observed by Sentinel-5P from March to July 2019.
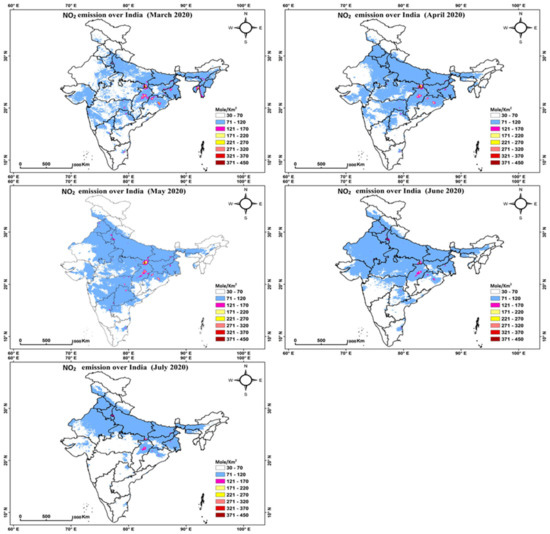
Figure 2.
NO2 emissions over India as observed by Sentinel-5P during lockdowns (phase 1–3) and unlocking periods (phase 1–2) from March to July 2020.
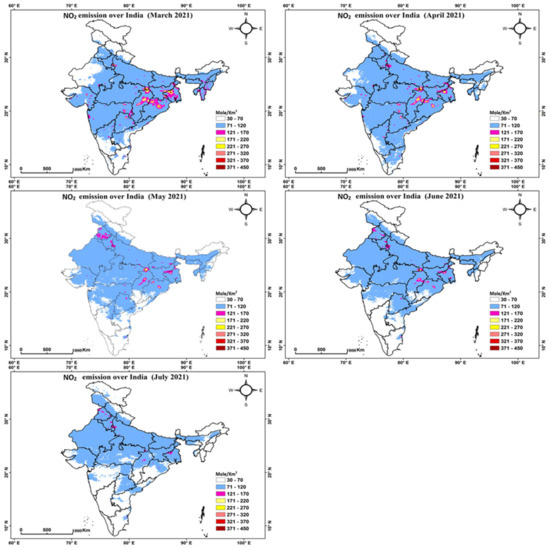
Figure 3.
NO2 emissions over India as observed by Sentinel-5P during wave 2 from March to July 2021.

Table 4.
Comparison of changes in NO2 concentration over eight North Indian cities during COVID-19-induced lockdown in 2020 (March–July) with regard to 2019 and 2021.
The concentrations of NO2 in ambient air during the study period, i.e., March to July of 2019, 2020 and 2021, were measured and compared by using both in situ observations and satellite-based observations. The Sentinel-5P and in situ observations of NO2 concentrations (7-day moving average) over the cities of NW India, namely Amritsar, Jalandhar, Khanna, Patiala Delhi-Anand Vihar Terminal, Gurugram, Ghaziabad and Noida, are plotted in Figure 4 and Figure 5, respectively. It can be seen that the Sentinel-5P data follow the same trend as those of in situ observations. During the inter-year comparison, it can be seen that the concentration of NO2 significantly decreased during the lockdown phases in 2020. It can be seen that the continuity of in situ observations is affected by the non-serviceability of sensors during the lockdown periods. This results in the creation of data gaps. This limitation can be overcome by the use of the Sentinel-5P dataset, as Sentinel-5P data exhibit a positive correlation with in situ observations. Figure 6 shows the anomalies of the monthly mean temperature for 40 years over India. A significant negative anomaly is observed during March, April and May, caused by the very active western disturbances that may have passed over the Northern Indian plains during the pre-monsoon season of 2020 (datasets are not presented for brevity). This has also played a role in the reduction in NO2 concentrations.
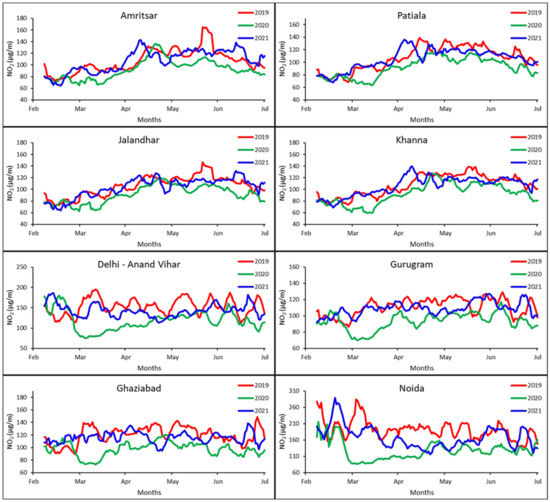
Figure 4.
Sentinel-5P satellite-based NO2 emission comparisons over Amritsar, Jalandhar, Khanna, Patiala Delhi–Anand Vihar, Gurugram, Ghaziabad and Noida during 2019, 2020 and 2021.
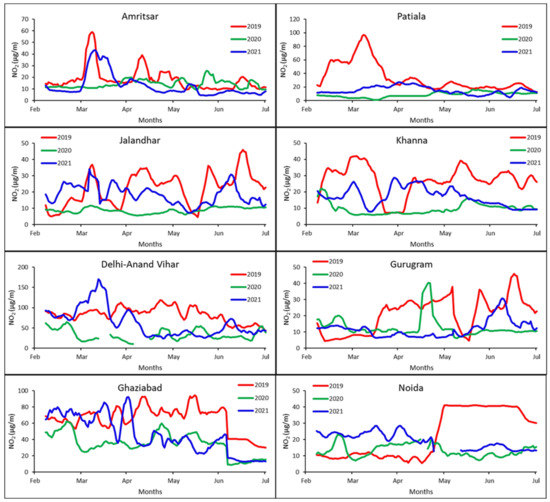
Figure 5.
Ground-based NO2 emission comparison over Amritsar, Bhatinda, Ludhiana Jalandhar, Khanna, Patiala, Delhi–Anand Vihar, Gurugram, Ghaziabad and Noida for the period of 2019 to 2021 (source: CPCB).
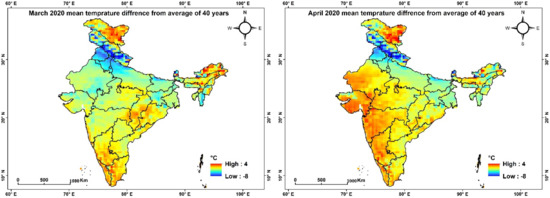
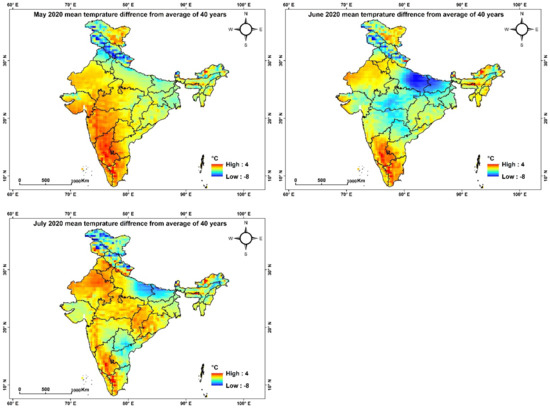
Figure 6.
Mean temperature difference from the average of 40 years (1980–2020). Higher and lower values indicate increased and decreased temperatures, respectively, compared to average.
Further, during lockdowns 1–3, most of the industrial and commercial activities were suspended. Therefore, the combined effect of active western disturbances and the lockdowns may have significantly reduced the surface temperature. However, during June, the regularity of the western disturbance may have decreased—this was the time that the unlocking process had commenced, resulting in the re-starting of industrial activities. Both the reduction in the western disturbances and the re-opening of the industrial processes were probably responsible for the enhanced surface temperature. The same can be seen in Figure 6, indicating a shift towards and registering normal surface temperatures during June and July 2020.
4. Conclusions
COVID-19 has impacted normal life on the Earth’s surface, with such severe impacts not seen previously in the last 100 years. Due to COVID-19 restrictions, the labor class and poor people are among the most affected due to the cessation of all economic and industrial units around the world. However, the decrease in air pollution at the cost of hunger cannot be justified. Regarding the changes in the trends of air pollution during the COVID-19 period, it is concluded that air pollution levels in the northern cities of India decreased during the forced lockdown period across the country. The lockdown appears to have caused pronounced improvements over several large, densely populated cities in the northern part of India.
Consequently, the Siwalik range of the Himalayas was clearly visible from the rooftops in Jalandhar. The improved air quality was demonstrated by in situ observations and remote sensing data as well. This study has proven the reduction in NO2 emissions over India during the lockdown periods. A reduced surface temperature was reported during lockdown periods 1–3. It is possible that an active western disturbance and the closure of industrial and commercial activities were responsible for the reduced surface temperatures over India. Overall, the present study contributes to the understanding of the trends of the ambient air quality over large geographical areas using the Sentinel-5P satellite remote sensing data and provides important information for regulatory bodies to develop a better decision support system to improve the air quality. Monitoring of the air quality through satellite remote sensing would certainly help the local government to develop a better policy to sustain the good air quality for public health. Further, the results concluded that the NO2 concentration was reduced during the COVID-19 pandemic significantly over the study area; we found that an 18% reduction in the average NO2 concentration was witnessed in 2020 with respect to concentrations in 2019, and around a 19% increase in the average NO2 concentration was observed in 2021 with respect to concentrations in 2020 during March–July, whereas a reduction of 28% in the average monthly NO2 concentration over all cities was observed in the month of April 2020 with respect to April 2019. The study further highlights the important of Sentinel-5P satellite-based NO2 emissions, as a path-breaking finding to determine the rate of pollution in study areas with limited physical observatories. However, in the current study, the effects of meteorological parameters on the dispersion of the NO2 concentration were not delineated for the study periods. This limitation will be addressed in future works with an emphasis on the role of meteorological parameters in pollution dispersion over North Indian cities.
Author Contributions
Conceptualization, A.K.T.; formal analysis, A.K.T., A.K.S., P.K., B.S.K., M.K., A.K., J.N.T., S.P.T. and B.A.J.; resources, B.A.J. and P.K.; writing—original draft preparation, A.K.T., A.K.S., P.K., B.S.K., M.K., A.K., J.N.T., S.P.T. and B.A.J.; writing—review and editing, A.K.T., A.K.S., P.K., B.S.K., M.K., A.K., J.N.T., G.C.K., S.P.T. and B.A.J. All authors have read and agreed to the published version of the manuscript.
Funding
This research received no external funding.
Data Availability Statement
Publicly available datasets were analyzed in this study. This data can be found here https://app.cpcbccr.com/ and https://www.sentinel-hub.com/.
Acknowledgments
The authors are grateful to the European Space Agency (ESA), NOAA and the Central Pollution Control Board (CPCB), the Delhi Pollution Control Committee (DPCC), the Uttar Pradesh Pollution Control Board (UPPCB) and the SAFAR Project, MoES, for freely providing the data. A.K.T. is grateful to the HoD, Remote Sensing and GIS, University of Jammu, Jammu, for providing the necessary facilities to carry out the research work.
Conflicts of Interest
The authors declare no conflict of interest.
References
- Bherwani, H.; Gupta, A.; Anjum, S.; Anshul, A.; Kumar, R. Exploring dependence of COVID-19 on environmental factors and spread prediction in India. NPJ Clim. Atmos. Sci. 2020, 3, 38. [Google Scholar] [CrossRef]
- Li, Q.; Guan, X.; Wu, P.; Wang, X.; Zhou, L.; Tong, Y.; Ren, R.; Leung, K.S.M.; Lau, E.H.Y.; Wong, J.Y.; et al. Early Transmission Dynamics in Wuhan, China, of Novel Coronavirus–Infected Pneumonia. N. Engl. J. Med. 2020, 382, 1199–1207. [Google Scholar] [CrossRef]
- Wang, J.; Tang, K.; Feng, K.; Lv, W. High temperature and high humidity reduce the transmission of COVID-19. Available at SSRN 2020, 355176, 2020b. [Google Scholar] [CrossRef]
- Holshue, M.L.; DeBolt, C.; Lindquist, S.; Lofy, K.H.; Wiesman, J.; Bruce, H.; Spitters, C.; Ericson, K.; Wilkerson, S.; Tural, A.; et al. First Case of 2019 Novel Coronavirus in the United States. N. Engl. J. Med. 2020, 382, 929–936. [Google Scholar] [CrossRef]
- Perlman, S. Another Decade, Another Coronavirus. N. Engl. J. Med. 2020, 382, 760–762. [Google Scholar] [CrossRef]
- Jarvis, C.I.; Van Zandvoort, K.; Gimma, A.; Prem, K.; Klepac, P.; Rubin, G.J.; Edmunds, W.J. Quantifying the impact of physical distance measures on the transmission of COVID-19 in the UK. BMC Med. 2020, 18, 124. [Google Scholar] [CrossRef]
- Avtar, R.; Kumar, P.; Supe, H.; Jie, D.; Sahu, N.; Mishra, B.K.; Yunus, A.P. Did the COVID-19 Lockdown-Induced Hydrological Residence Time Intensify the Primary Productivity in Lakes? Observational Results Based on Satellite Remote Sensing. Water 2020, 12, 2573. [Google Scholar] [CrossRef]
- Gupta, S.; Raghuwanshi, G.S.; Chanda, A. Effect of weather on COVID-19 spread in the US: A prediction model for India in 2020. Sci. Total Environ. 2020, 728, 138860. [Google Scholar] [CrossRef]
- Rosario, D.K.A.; Mutz, Y.S.; Bernardes, P.C.; Conte-Junior, C.A. Relationship between COVID-19 and weather: Case study in a tropical country. Int. J. Hyg. Environ. Health 2020, 229, 113587. [Google Scholar] [CrossRef]
- Tosepu, R.; Gunawan, J.; Effendy, D.S.; Lestari, H.; Bahar, H.; Asfian, P. Correlation between weather and Covid-19 pandemic in Jakarta, Indonesia. Sci. Total Environ. 2020, 725, 138436. [Google Scholar] [CrossRef]
- Aruga, K.; Islam, M.; Jannat, A. Effects of COVID-19 on Indian Energy Consumption. Sustainability 2020, 12, 5616. [Google Scholar] [CrossRef]
- Kanitkar, T. The COVID-19 lockdown in India: Impacts on the economy and the power sector. Glob. Transit. 2020, 2, 150–156. [Google Scholar] [CrossRef]
- Akritidis, D.; Zanis, P.; Georgoulias, A.K.; Papakosta, E.; Tzoumaka, P.; Kelessis, A. Implications of COVID-19 Restriction Measures in Urban Air Quality of Thessaloniki, Greece: A Machine Learning Approach. Atmosphere 2021, 12, 1500. [Google Scholar] [CrossRef]
- Liu, F.; Wang, M.; Zheng, M. Effects of COVID-19 lockdown on global air quality and health. Sci. Total Environ. 2020, 755, 142533. [Google Scholar] [CrossRef]
- Keller, C.A.; Evans, M.J.; Knowland, K.E.; Hasenkopf, C.A.; Modekurty, S.; Lucchesi, R.A.; Oda, T.; Franca, B.B.; Mandarino, F.C.; Suárez, M.V.D.; et al. Global impact of COVID-19 restrictions on the surface concentrations of nitrogen dioxide and ozone. Atmos. Chem. Phys. 2021, 21, 3555–3592. [Google Scholar] [CrossRef]
- Petetin, H.; Bowdalo, D.; Soret, A.; Guevara, M.; Jorba, O.; Serradell, K.; García-Pando, C.P. Meteorology-normalized impact of the COVID-19 lockdown upon NO2 pollution in Spain. Atmos. Chem. Phys. Discuss. 2020, 20, 11119–11141. [Google Scholar] [CrossRef]
- Grange, S.K.; Lee, J.D.; Drysdale, W.S.; Lewis, A.C.; Hueglin, C.; Emmenegger, L.; Carslaw, D.C. COVID-19 lockdowns highlight a risk of increasing ozone pollution in European urban areas. Atmos. Chem. Phys. 2021, 21, 4169–4185. [Google Scholar] [CrossRef]
- Lelieveld, J.; Klingmüller, K.; Pozzer, A.; Pöschl, U.; Fnais, M.; Daiber, A.; Münzel, T. Cardiovascular disease burden from ambient air pollution in Europe reassessed using novel hazard ratio functions. Eur. Heart J. 2019, 40, 1590–1596. [Google Scholar] [CrossRef]
- Lee, J.-T.; Son, J.-Y.; Cho, Y.-S. The adverse effects of fine particle air pollution on respiratory function in the elderly. Sci. Total Environ. 2007, 385, 28–36. [Google Scholar] [CrossRef]
- Zoran, M.A.; Savastru, R.S.; Savastru, D.M.; Tautan, M.N. Assessing the relationship between ground levels of ozone (O3) and nitrogen dioxide (NO2) with coronavirus (COVID-19) in Milan, Italy. Sci. Total Environ. 2020, 740, 140005. [Google Scholar] [CrossRef]
- Martelletti, L.; Martelletti, P. Air Pollution and the Novel Covid-19 Disease: A Putative Disease Risk Factor. SN Compr. Clin. Med. 2020, 2, 383–387. [Google Scholar] [CrossRef]
- Wang, L.; Wang, Y.; Ye, D.; Liu, Q. Review of the 2019 novel coronavirus (SARS-CoV-2) based on current evidence. Int. J. Antimicrob. Agents 2020, 55, 105948. [Google Scholar] [CrossRef]
- Chen, Y.; Liu, Q.; Guo, D. Emerging coronaviruses: Genome structure, replication, and pathogenesis. J. Med. Virol. 2020, 92, 418–423. [Google Scholar] [CrossRef]
- Paital, B. Nurture to nature via COVID-19, a self-regenerating environmental strategy of environment in global context. Sci. Total Environ. 2020, 729, 139088. [Google Scholar] [CrossRef]
- Das, K.; Paital, B. The synergy between philosophy and science, need of the contemporary society. Int. J. Humanit. Soc. Sci. Res. 2020, 6, 45–51. [Google Scholar]
- Fan, C.; Li, Y.; Guang, J.; Li, Z.; Elnashar, A.; Allam, M.; De Leeuw, G. The Impact of the Control Measures during the COVID-19 Outbreak on Air Pollution in China. Remote Sens. 2020, 12, 1613. [Google Scholar] [CrossRef]
- Mahato, S.; Pal, S.; Ghosh, K.G. Effect of lockdown amid COVID-19 pandemic on air quality of the megacity Delhi, India. Sci. Total Environ. 2020, 730, 139086. [Google Scholar] [CrossRef]
- Sharma, S.; Zhang, M.; Anshika; Gao, J.; Zhang, H.; Kota, S.H. Effect of restricted emissions during COVID-19 on air quality in India. Sci. Total Environ. 2020, 728, 138878. [Google Scholar] [CrossRef]
- Xu, K.; Cui, K.; Young, L.-H.; Hsieh, Y.-K.; Wang, Y.-F.; Zhang, J.; Wan, S. Impact of the COVID-19 Event on Air Quality in Central China. Aerosol Air Qual. Res. 2020, 20, 915–929. [Google Scholar] [CrossRef]
- Chylek, P.; Wong, J. Effect of absorbing aerosols on global radiation budget. Geophys. Res. Lett. 1995, 22, 929–931. [Google Scholar] [CrossRef]
- Penner, J.E.; Dickinson, R.E.; O’Neill, C.A. Effects of Aerosol from Biomass Burning on the Global Radiation Budget. Science 1992, 256, 1432–1434. [Google Scholar] [CrossRef]
- Lighty, J.; Veranth, J.M.; Sarofim, A.F. Combustion Aerosols: Factors Governing Their Size and Composition and Implications to Human Health. J. Air Waste Manag. Assoc. 2000, 50, 1565–1618. [Google Scholar] [CrossRef]
- Lal, M.; Cubasch, U.; Voss, R.; Waszkewitz, J. Effect of transient increase in greenhouse gases and sulphate aerosols on monsoon climate. Curr. Sci. 1995, 69, 752–763. [Google Scholar] [CrossRef]
- Khaniabadi, Y.O.; Goudarzi, G.; Daryanoosh, S.M.; Borgini, A.; Tittarelli, A.; De Marco, A. Exposure to PM10, NO2, and O3 and impacts on human health. Environ. Sci. Pollut. Res. 2017, 24, 2781–2789. [Google Scholar] [CrossRef]
- World Health Organization. Review of Evidence on Health Aspects of Air Pollution–REVIHAAP Project: Technical Report. World Health Organization; WHO Regional Office for Europe: København, Denmark, 2013. [Google Scholar] [CrossRef]
- Gaur, A.; Tripathi, S.N.; Kanawade, V.P.; Tare, V.; Shukla, S.P. Four-year measurements of trace gases (SO2, NOx, CO, and O3) at an urban location, Kanpur, in Northern India. J. Atmos. Chem. 2014, 71, 283–301. [Google Scholar] [CrossRef]
- Veefkind, J.P.; Aben, I.; McMullan, K.; Förster, H.; de Vries, J.; Otter, G.; Claas, J.; Eskes, H.J.; de Haan, J.F.; Kleipool, Q.; et al. TROPOMI on the ESA Sentinel-5 Precursor: A GMES mission for global observations of the atmospheric composition for climate, air quality and ozone layer applications. Remote Sens. Environ. 2012, 120, 70–83. [Google Scholar] [CrossRef]
- Van Geffen, J.H.G.M.; Boersma, K.F.; Van Roozendael, M.; Hendrick, F.; Mahieu, E.; De Smedt, I.; Sneep, M.; Veefkind, J.P. Improved spectral fitting of nitrogen dioxide from OMI in the 405–465 nm window. Atmos. Meas. Technol. 2015, 8, 1685–1699. [Google Scholar] [CrossRef]
- Van Geffen, J.H.G.M.; Eskes, H.J.; Boersma, K.F.; Maasakkers, J.D.; Veefkind, J.P. TROPOMI ATBD of the Total and Tropospheric NO2 Data Products, S5P-KNMI-L2-0005-RP, Issue 1.2.0. 2018. Available online: https://sentinel.esa.int/documents/247904/2476257/sentinel-5p-tropomi-atbd-no2-data-products (accessed on 20 August 2020).
- Platt, U.; Stutz, J. Introduction. In Differential Optical Absorption Spectroscopy; Springer: Berlin/Heidelberg, Germany, 2008; pp. 1–4. [Google Scholar] [CrossRef]
- Eskes, H.; Van Geffen, J.; Boersma, F.; Eichmann, K.-U.; Apituley, A.; Pedergnana, M.; Sneep, M.; Veefkind, J.P.; Loyola, D. Sentinel-5 precursor/TROPOMI Level 2 Product User Manual Nitrogendioxide. Document Number: S5P-KNMI-L2-0021-MA. 2019. Available online: https://sentinel.esa.int/documents/247904/2474726/Sentinel-5P-Level-2-Product-User-Manual-Nitrogen-Dioxide.pdf (accessed on 20 August 2020).
- Sneep, M. Sentinel 5 Precursor/TROPOMI KNMI and SRON Level 2 Input Output Data Definition. 2019. Available online: https://sentinel.esa.int/documents/247904/3119978/Sentinel-5P-Level-2-Input-Output-Data-Definition (accessed on 20 August 2020).
- Saha, S.; Moorthi, S.; Wu, X.; Wang, J.; Nadiga, S.; Tripp, P.; Behringer, D.; Hou, Y.-T.; Chuang, H.-Y.; Iredell, M.; et al. The NCEP Climate Forecast System Version 2. J. Clim. 2014, 27, 2185–2208. [Google Scholar] [CrossRef]
- Chauhan, A.; Singh, R.P. Effect of Lockdown on HCHO and Trace Gases over India during March 2020. Aerosol Air Qual. Res. 2021, 21, 200445. [Google Scholar] [CrossRef]
Publisher’s Note: MDPI stays neutral with regard to jurisdictional claims in published maps and institutional affiliations. |
© 2022 by the authors. Licensee MDPI, Basel, Switzerland. This article is an open access article distributed under the terms and conditions of the Creative Commons Attribution (CC BY) license (https://creativecommons.org/licenses/by/4.0/).