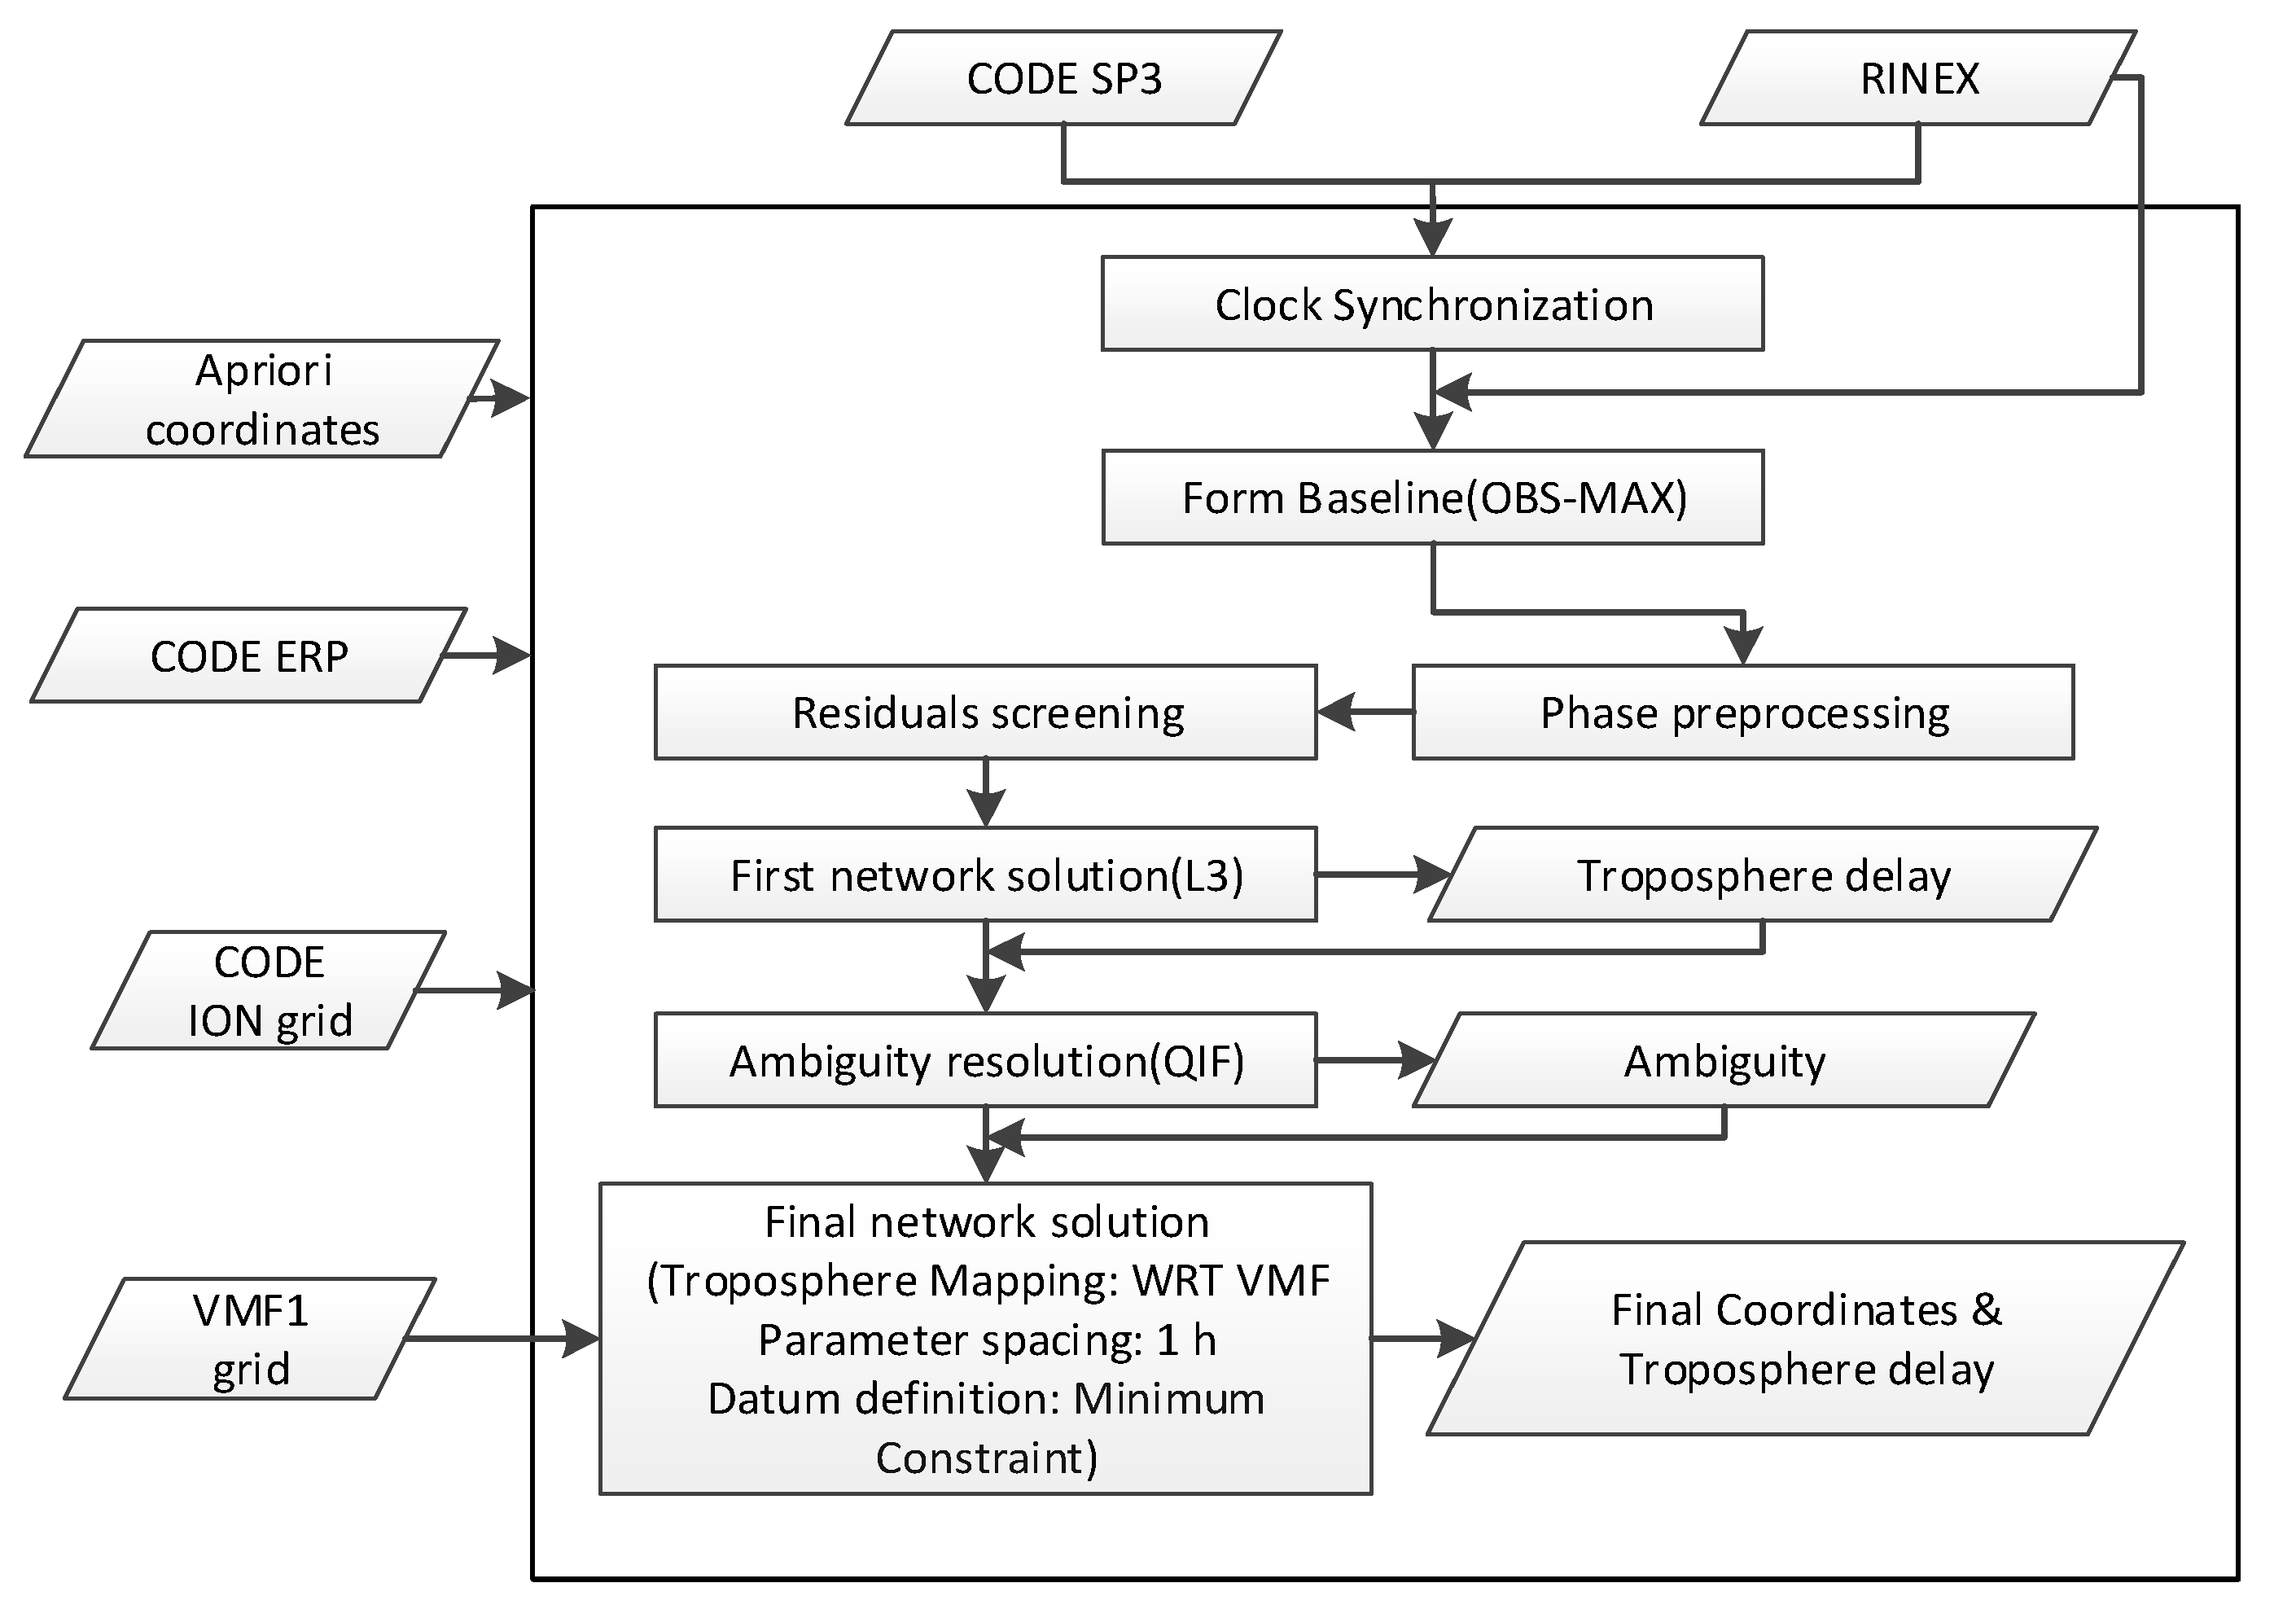
Figure 1.
DD network processing scheme.
Figure 1.
DD network processing scheme.
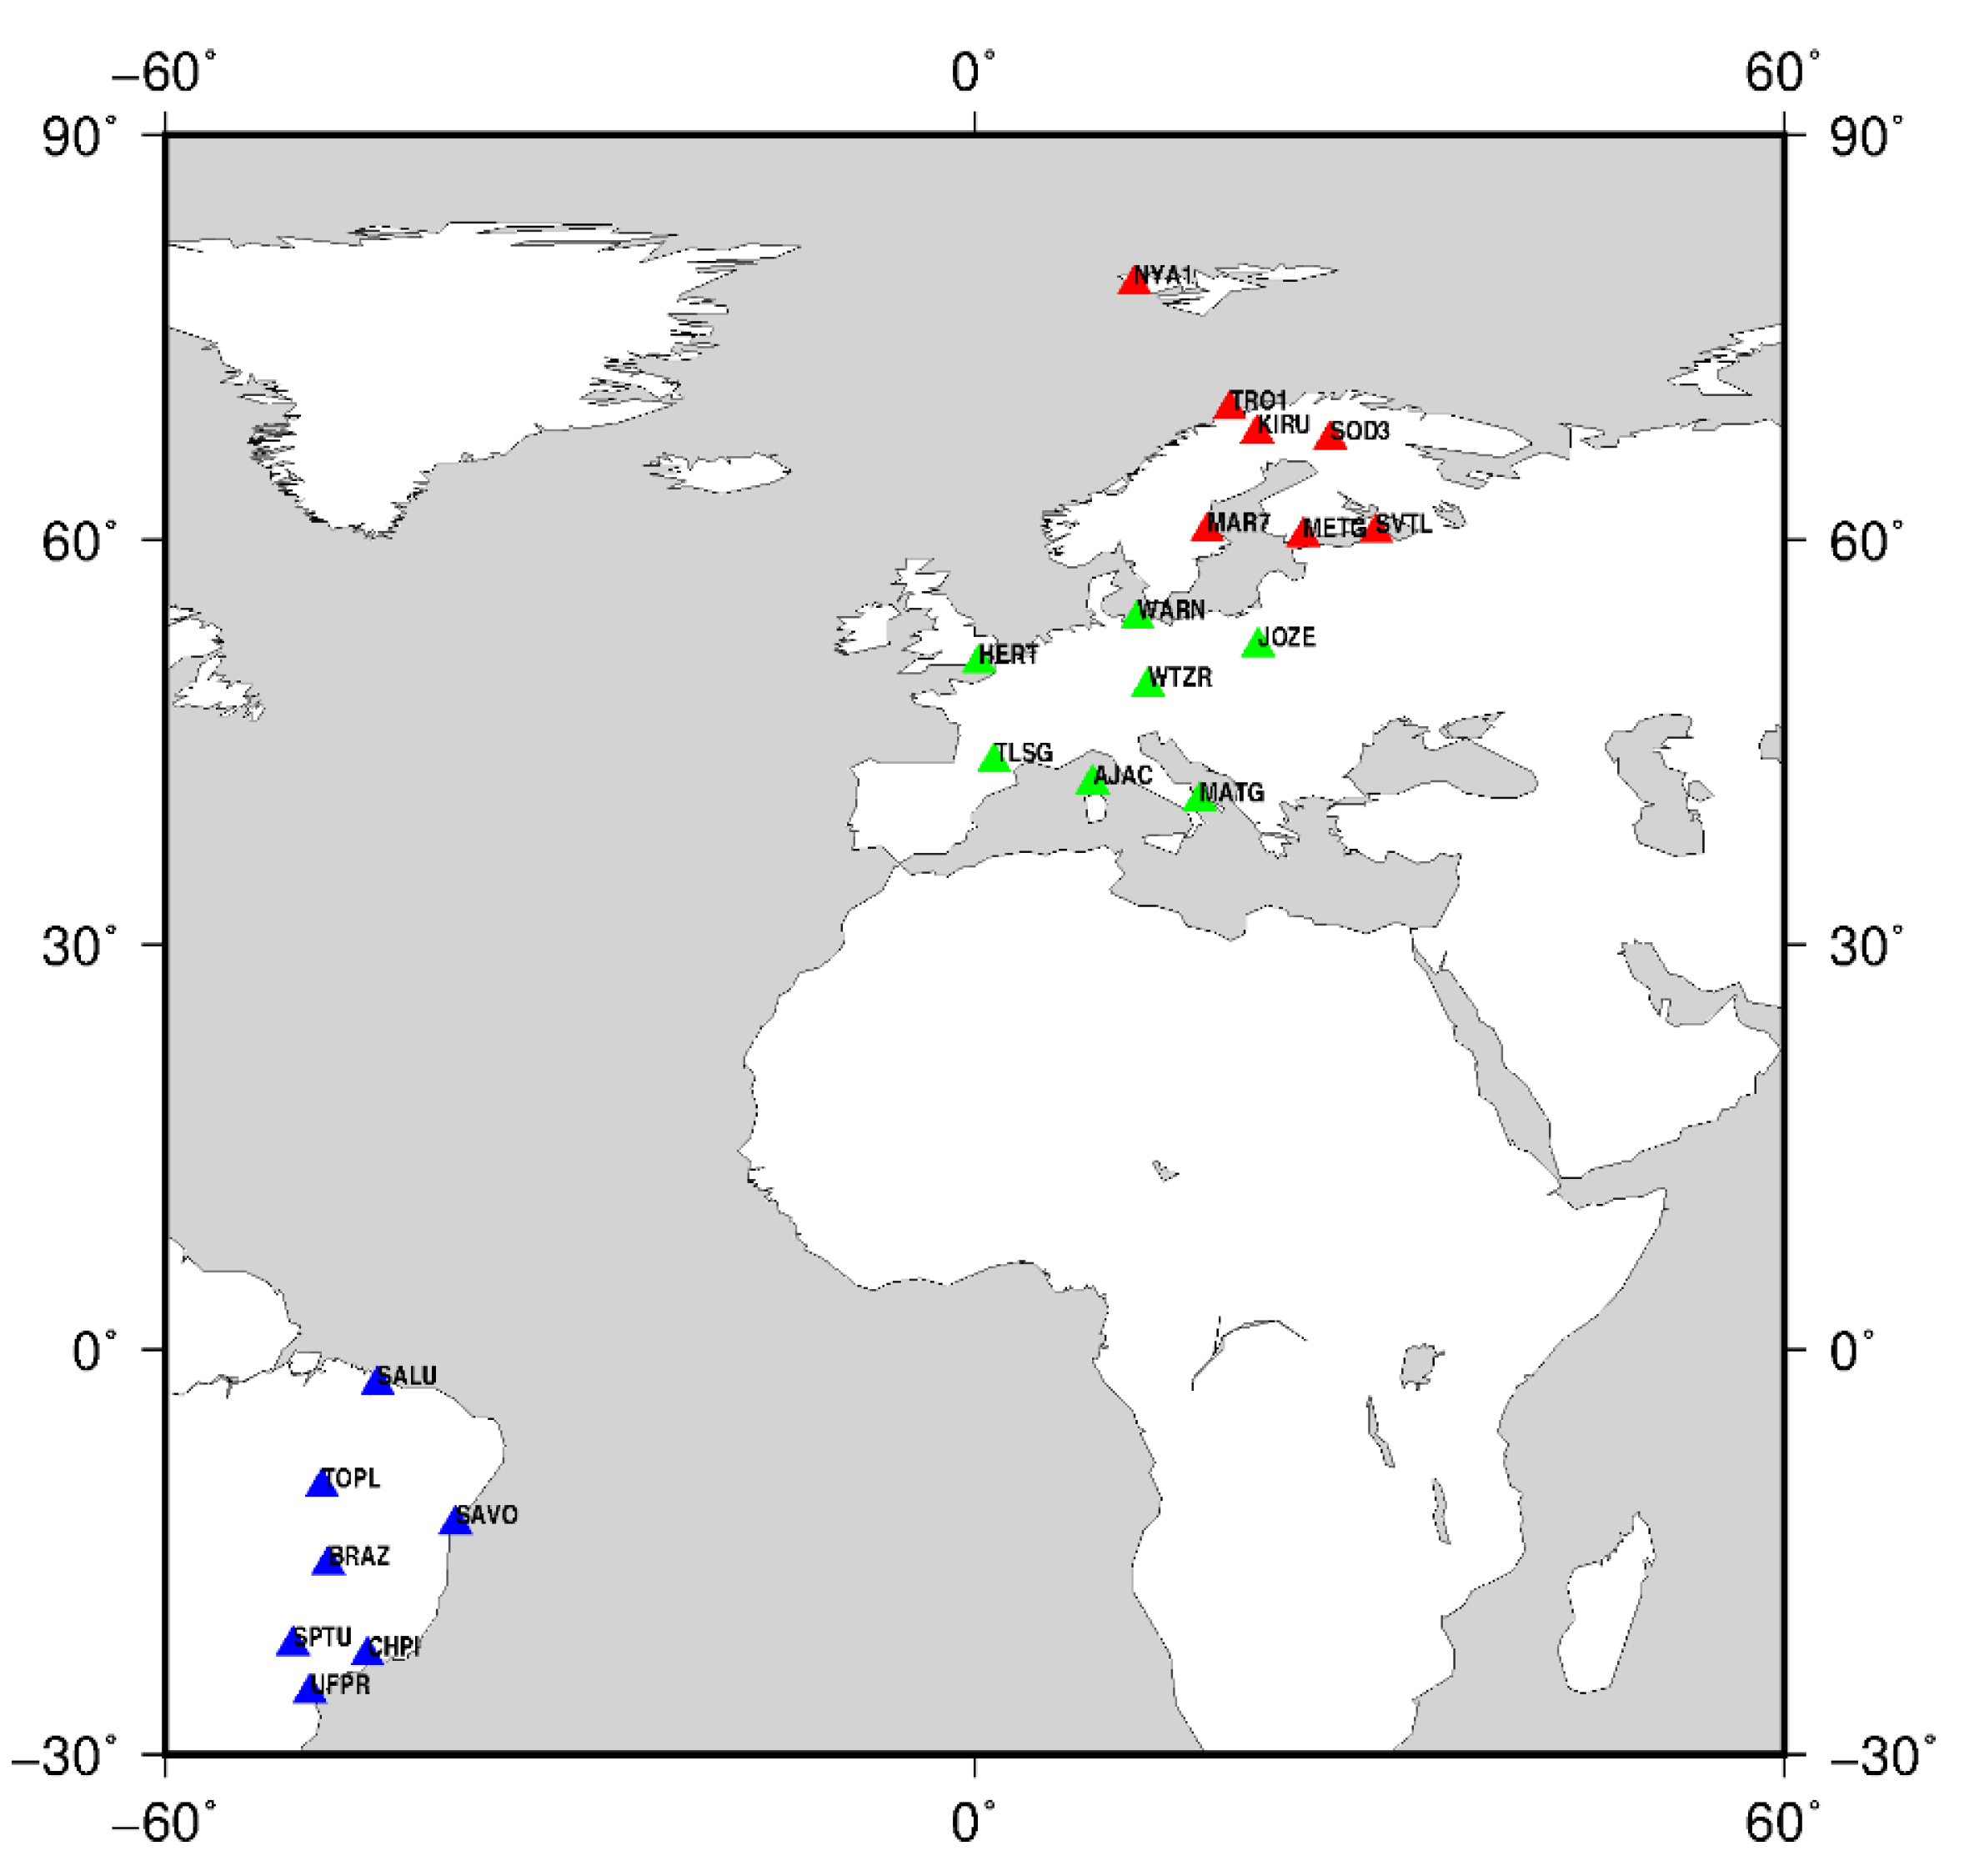
Figure 2.
The IGS tracking stations of the high (red triangle), middle (green triangle), and low latitude networks (blue triangle).
Figure 2.
The IGS tracking stations of the high (red triangle), middle (green triangle), and low latitude networks (blue triangle).
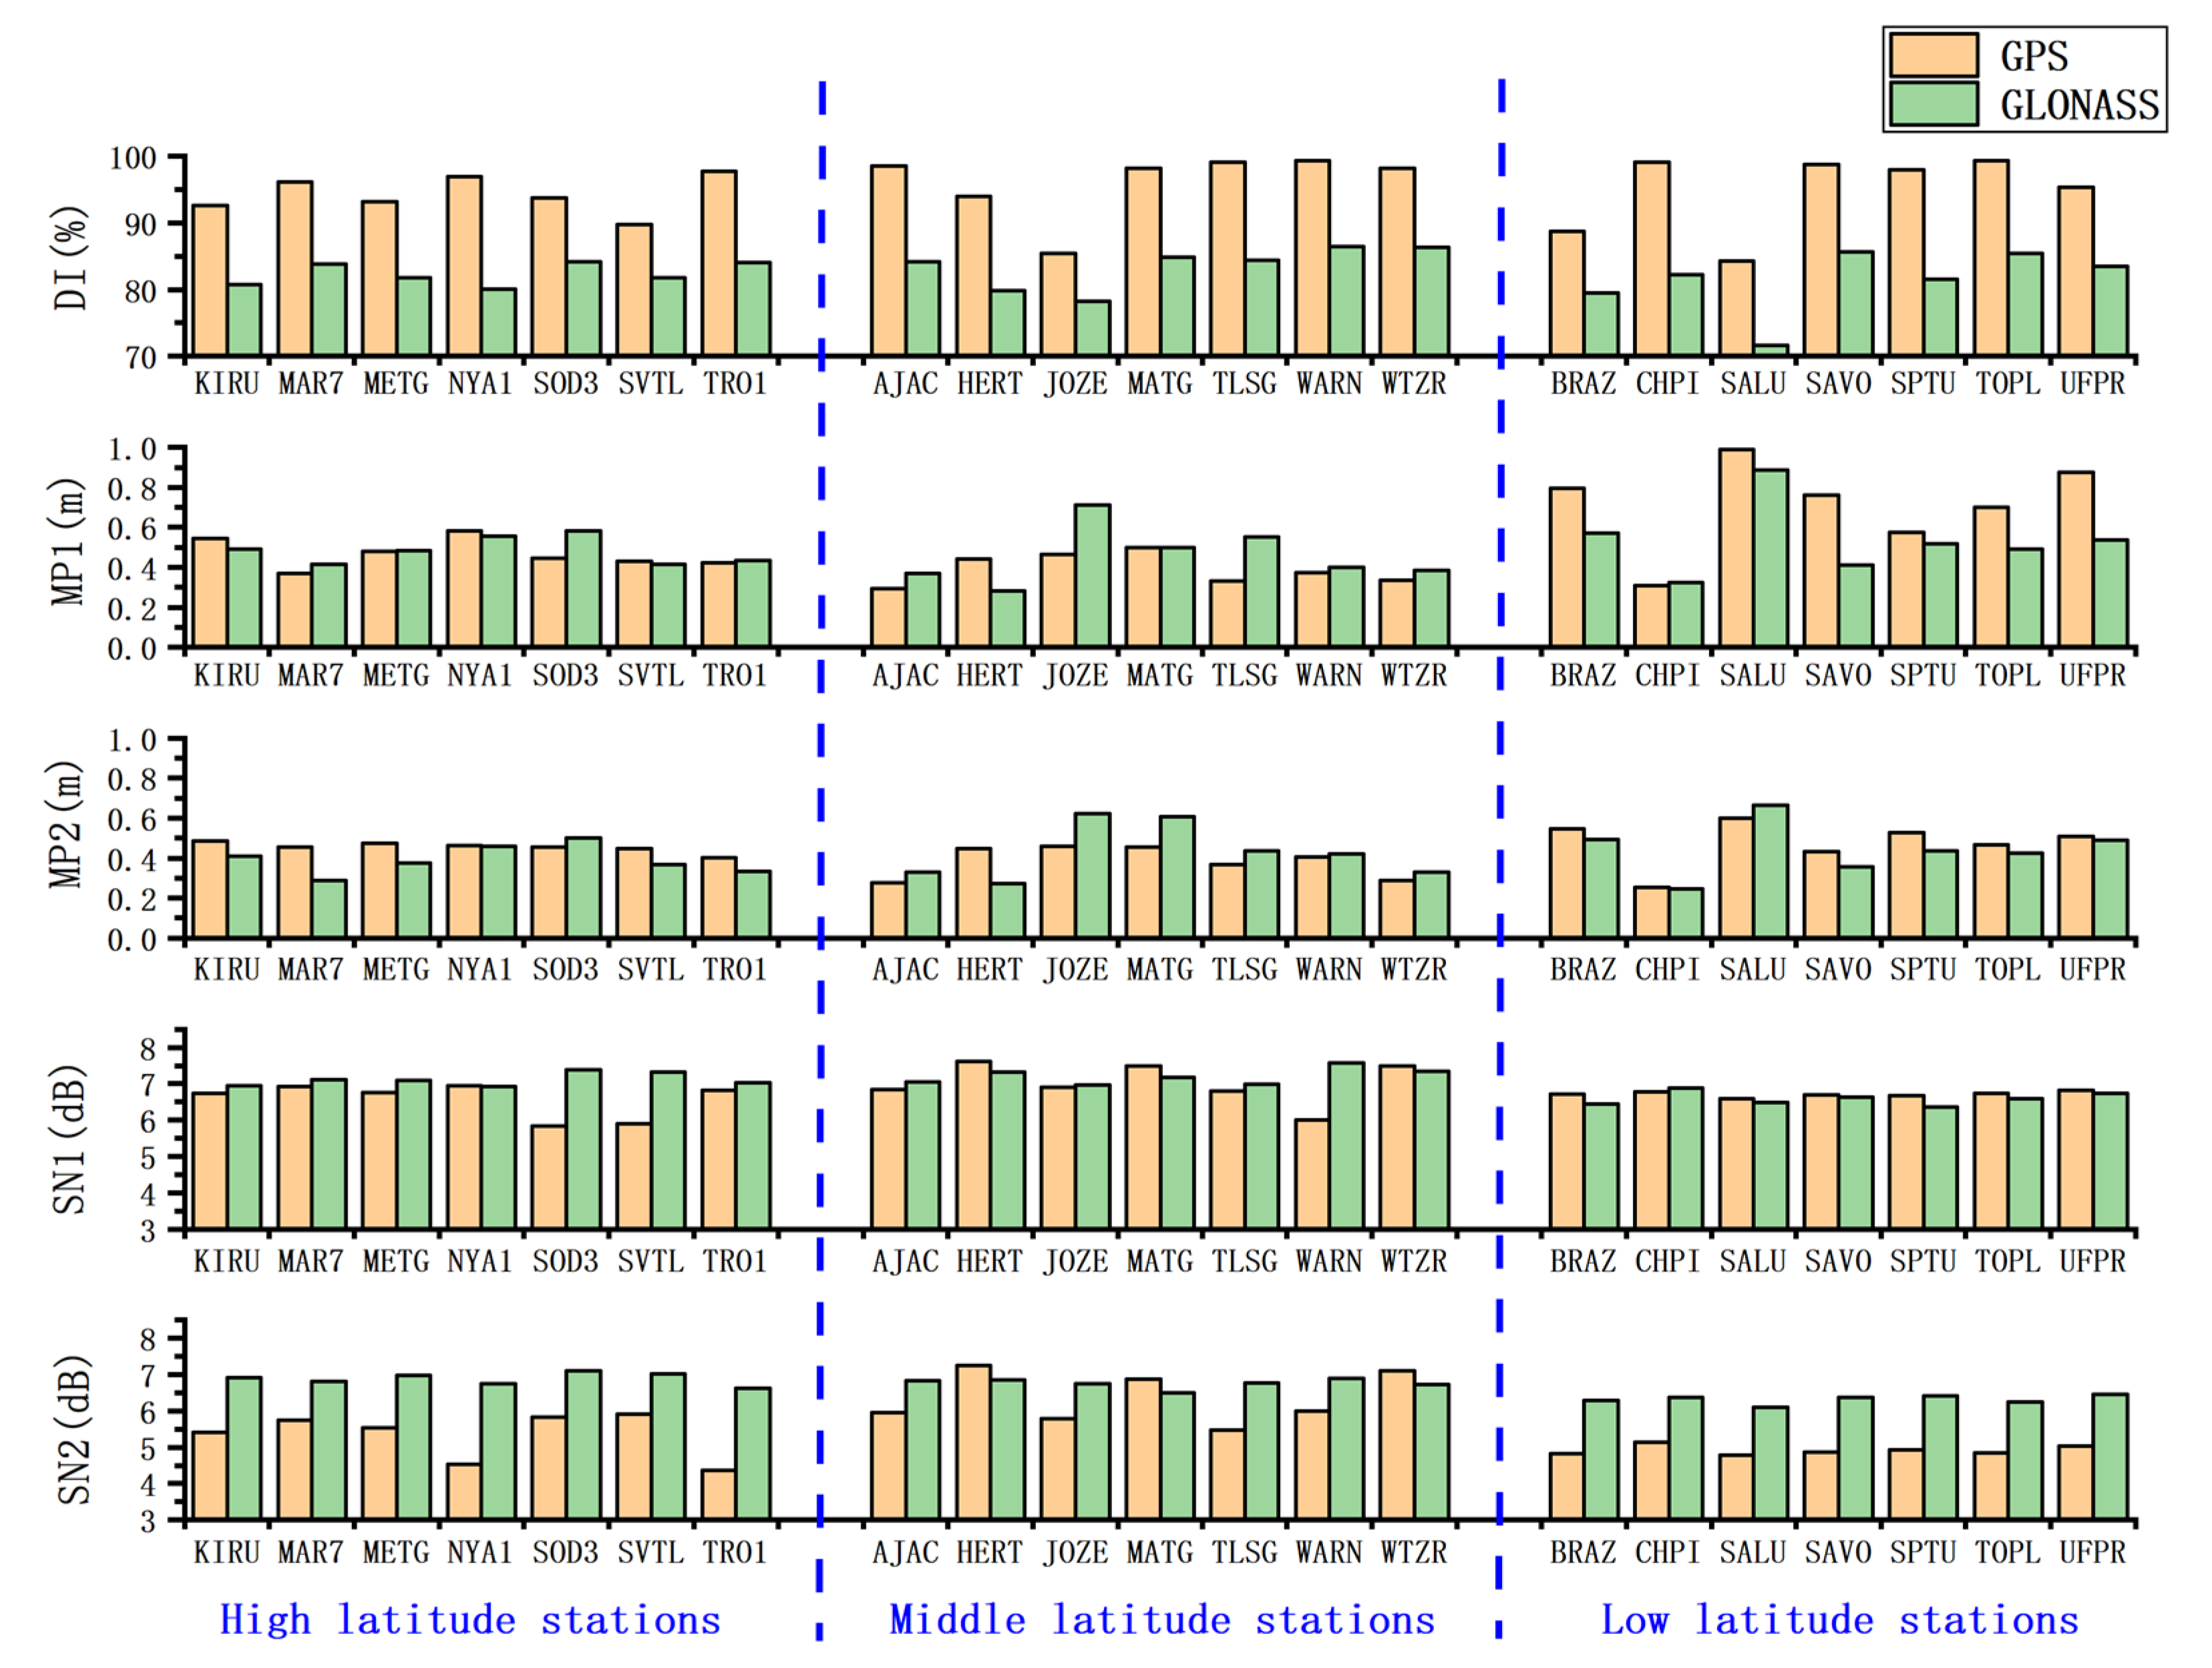
Figure 3.
The results of the data quality check.
Figure 3.
The results of the data quality check.
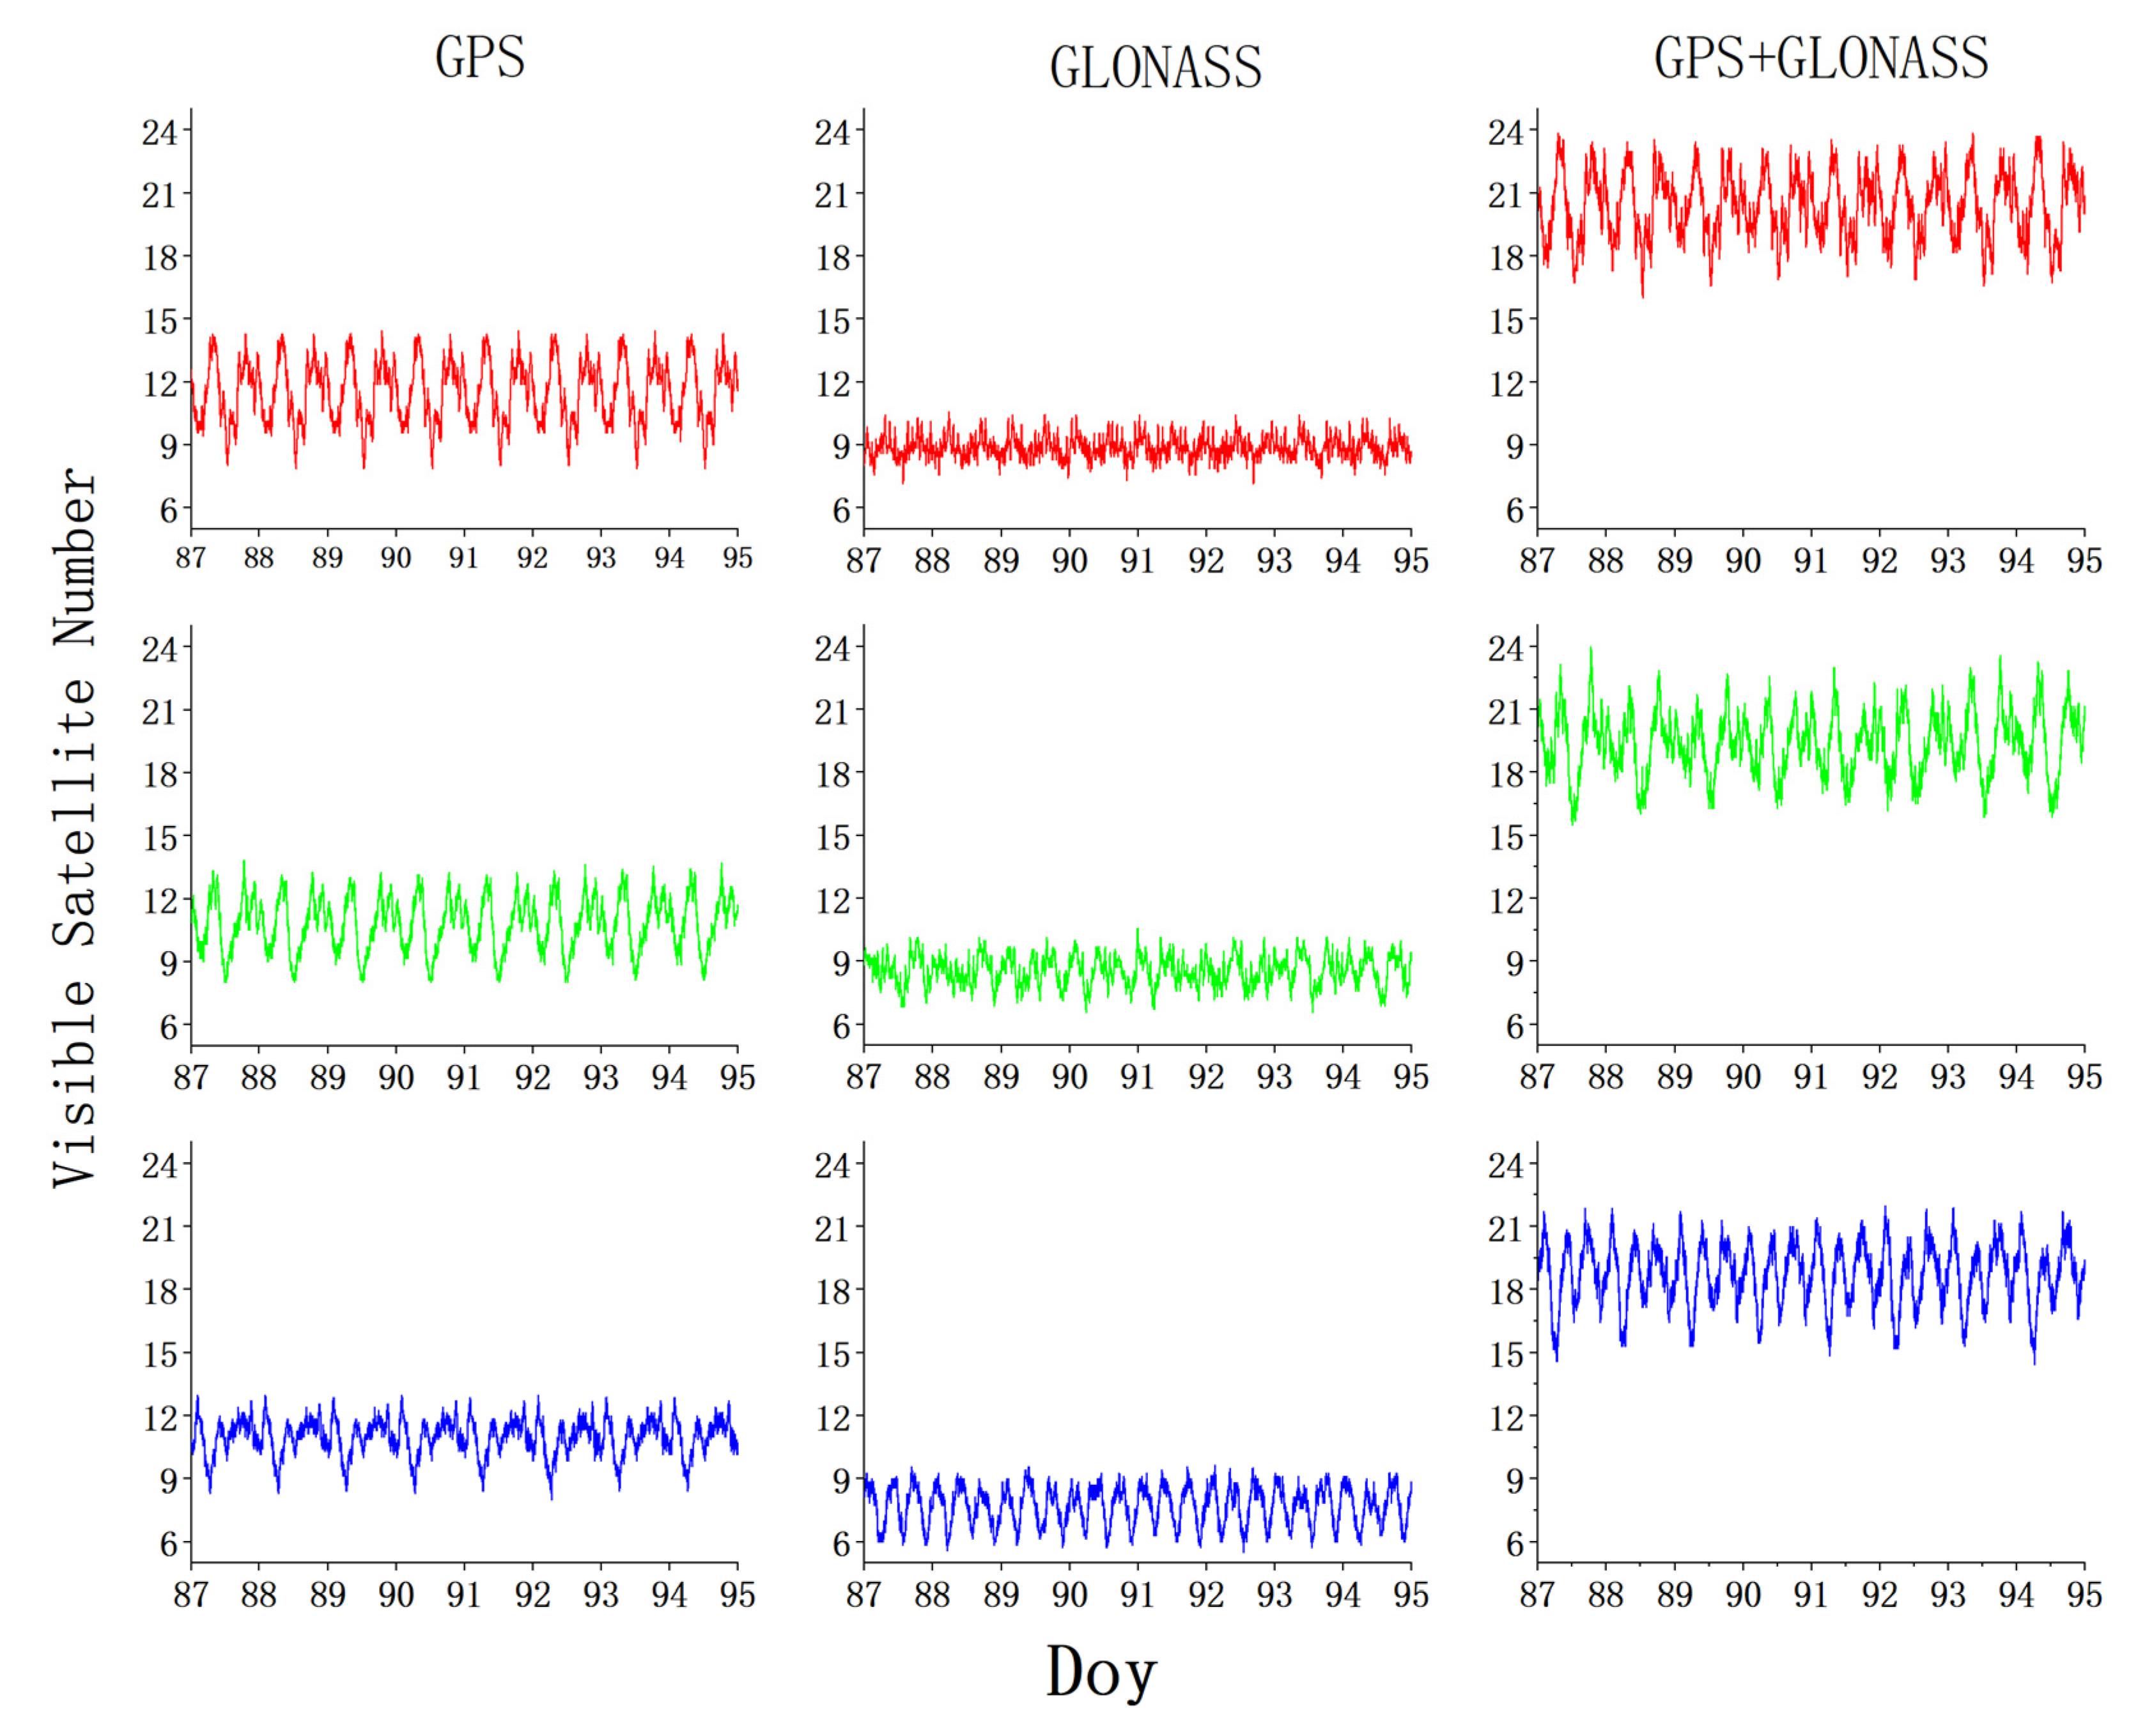
Figure 4.
The average number of visible satellites of GPS, GLONASS, and GPS+GLONASS in the high (red), middle (green), and low (blue) latitude networks.
Figure 4.
The average number of visible satellites of GPS, GLONASS, and GPS+GLONASS in the high (red), middle (green), and low (blue) latitude networks.
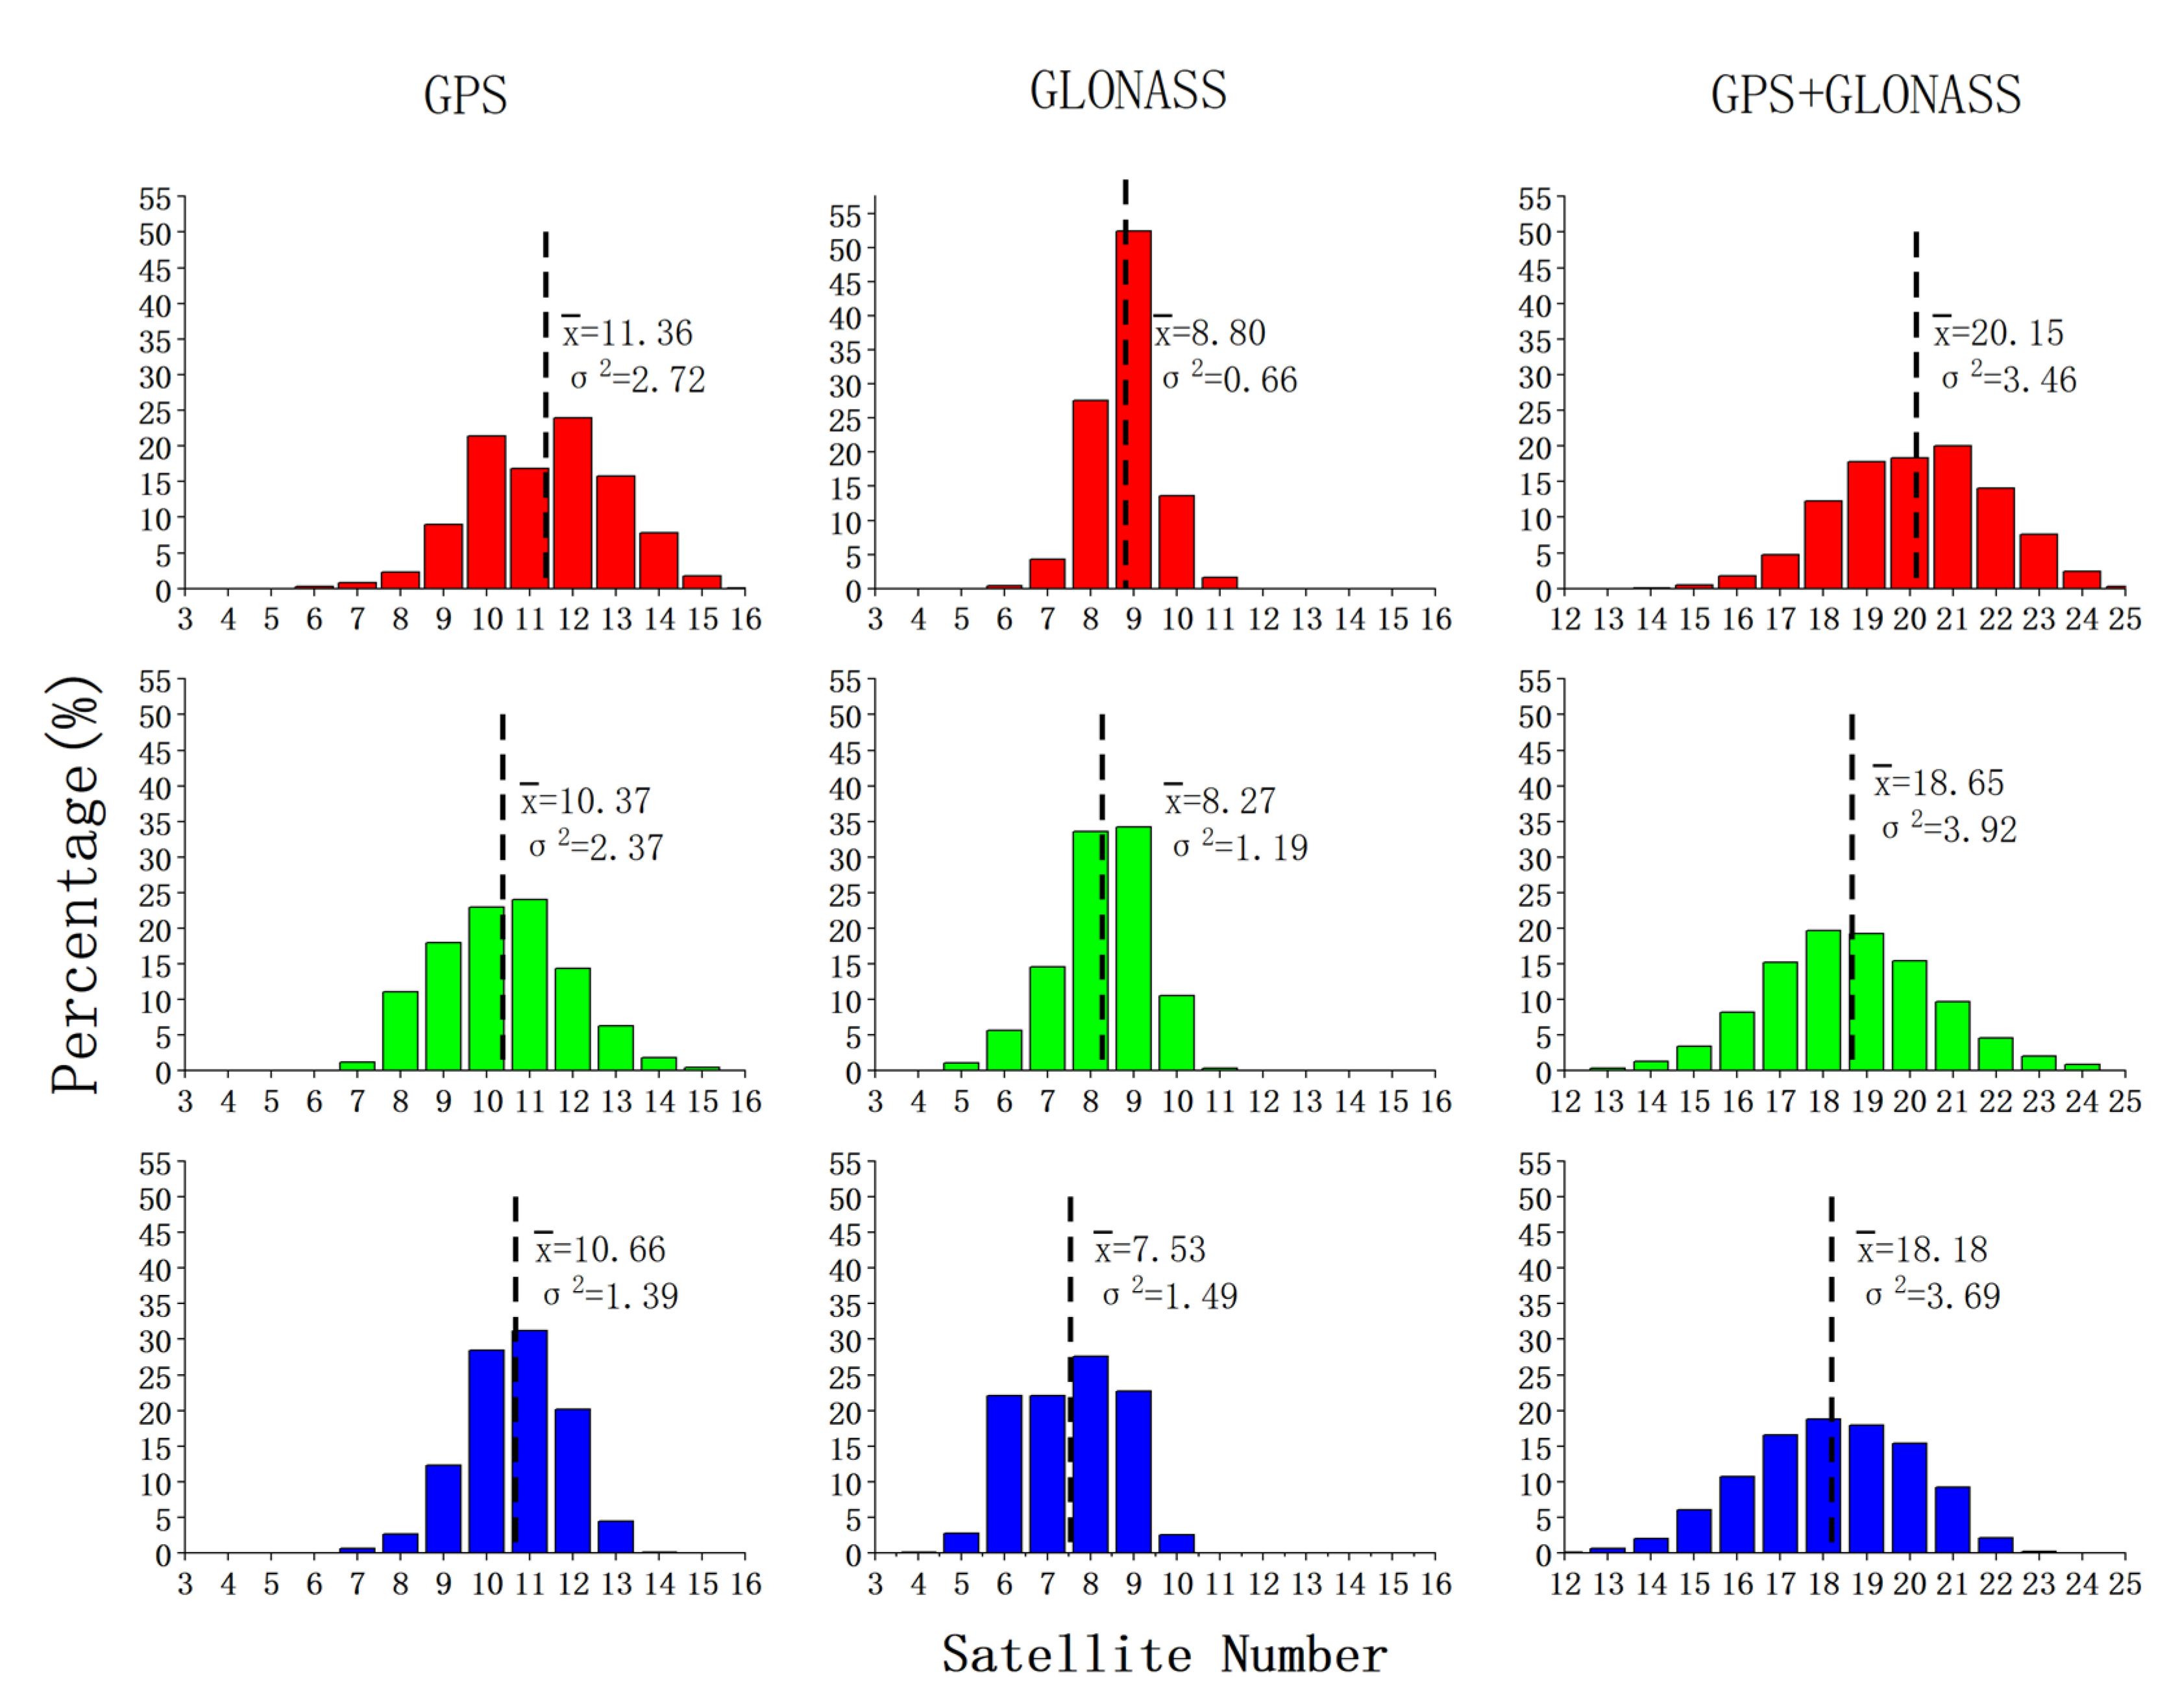
Figure 5.
The histogram of visible satellites in the high (red), middle (green), and low (blue) latitude networks. The position of the dashed line and the value indicate the average number of visible satellites. The represents the variance of the visible satellites’ distribution. Please note that the horizontal axis of GPS and GLONASS visible satellites differs from that of GPS+GLONASS.
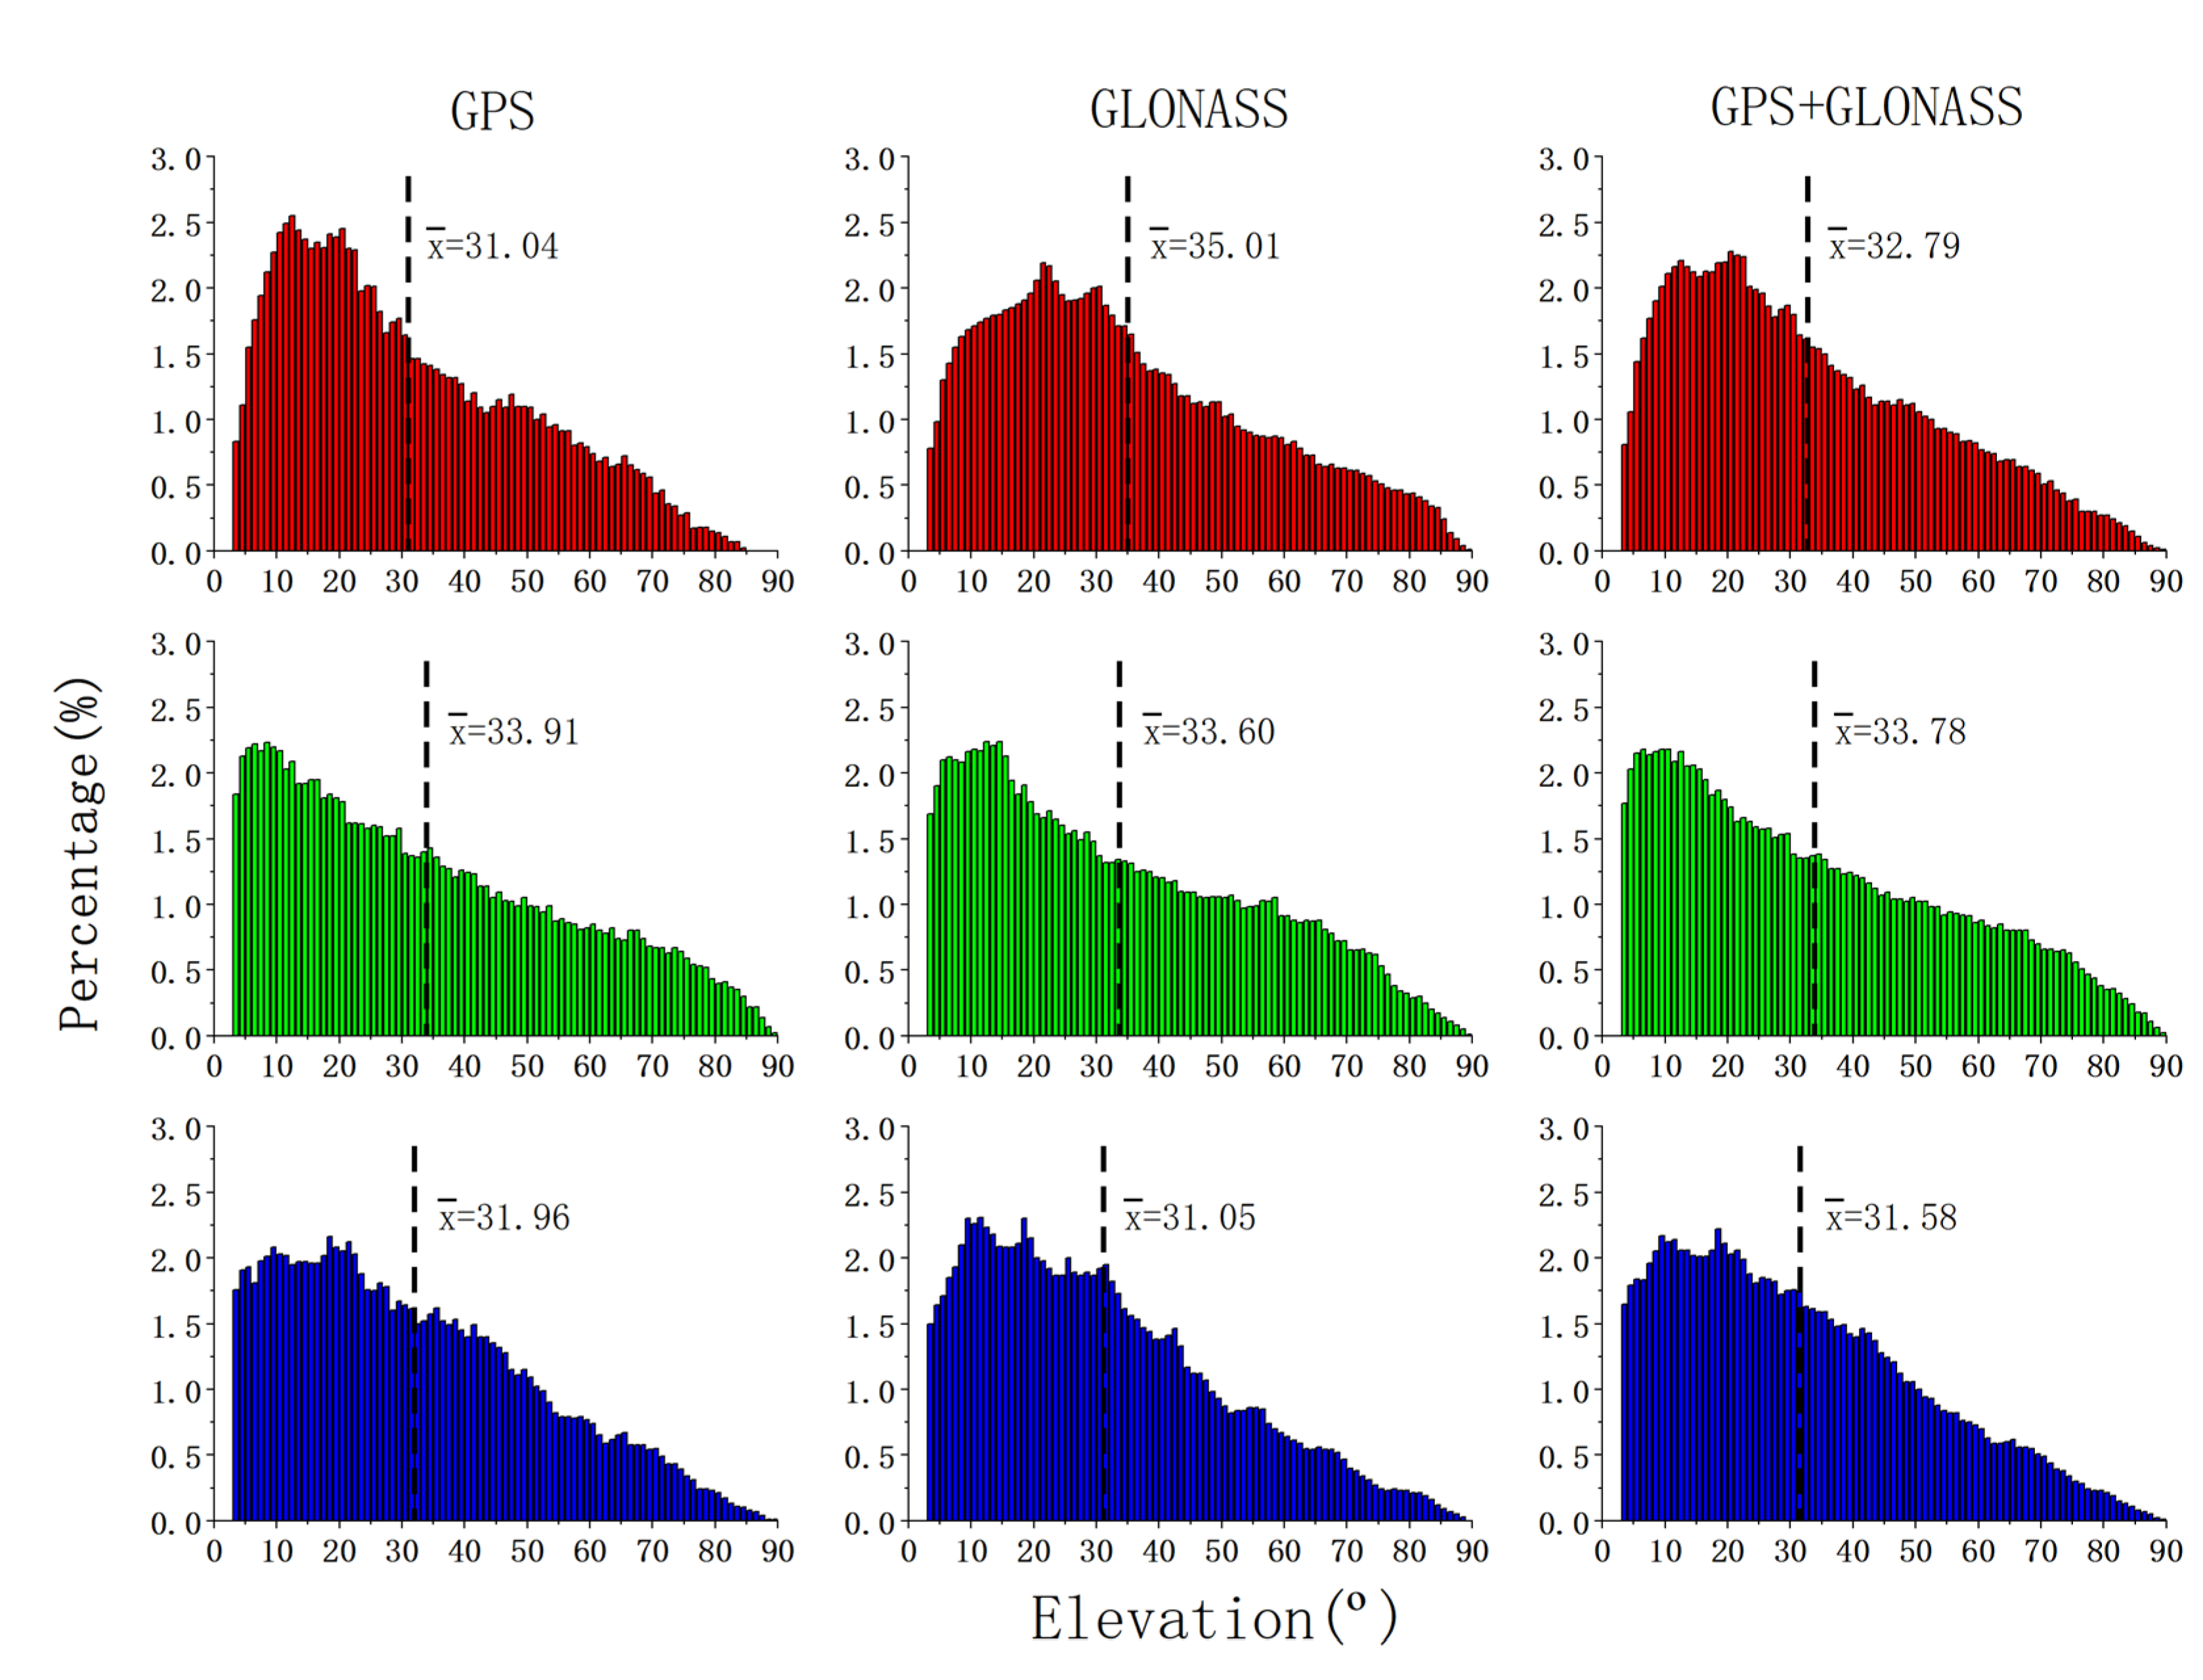
Figure 6.
The histogram of elevation distribution of the high (red), middle (green), and low (blue) latitude networks, the position of the dashed line and the value indicate the mean elevation.
Figure 6.
The histogram of elevation distribution of the high (red), middle (green), and low (blue) latitude networks, the position of the dashed line and the value indicate the mean elevation.
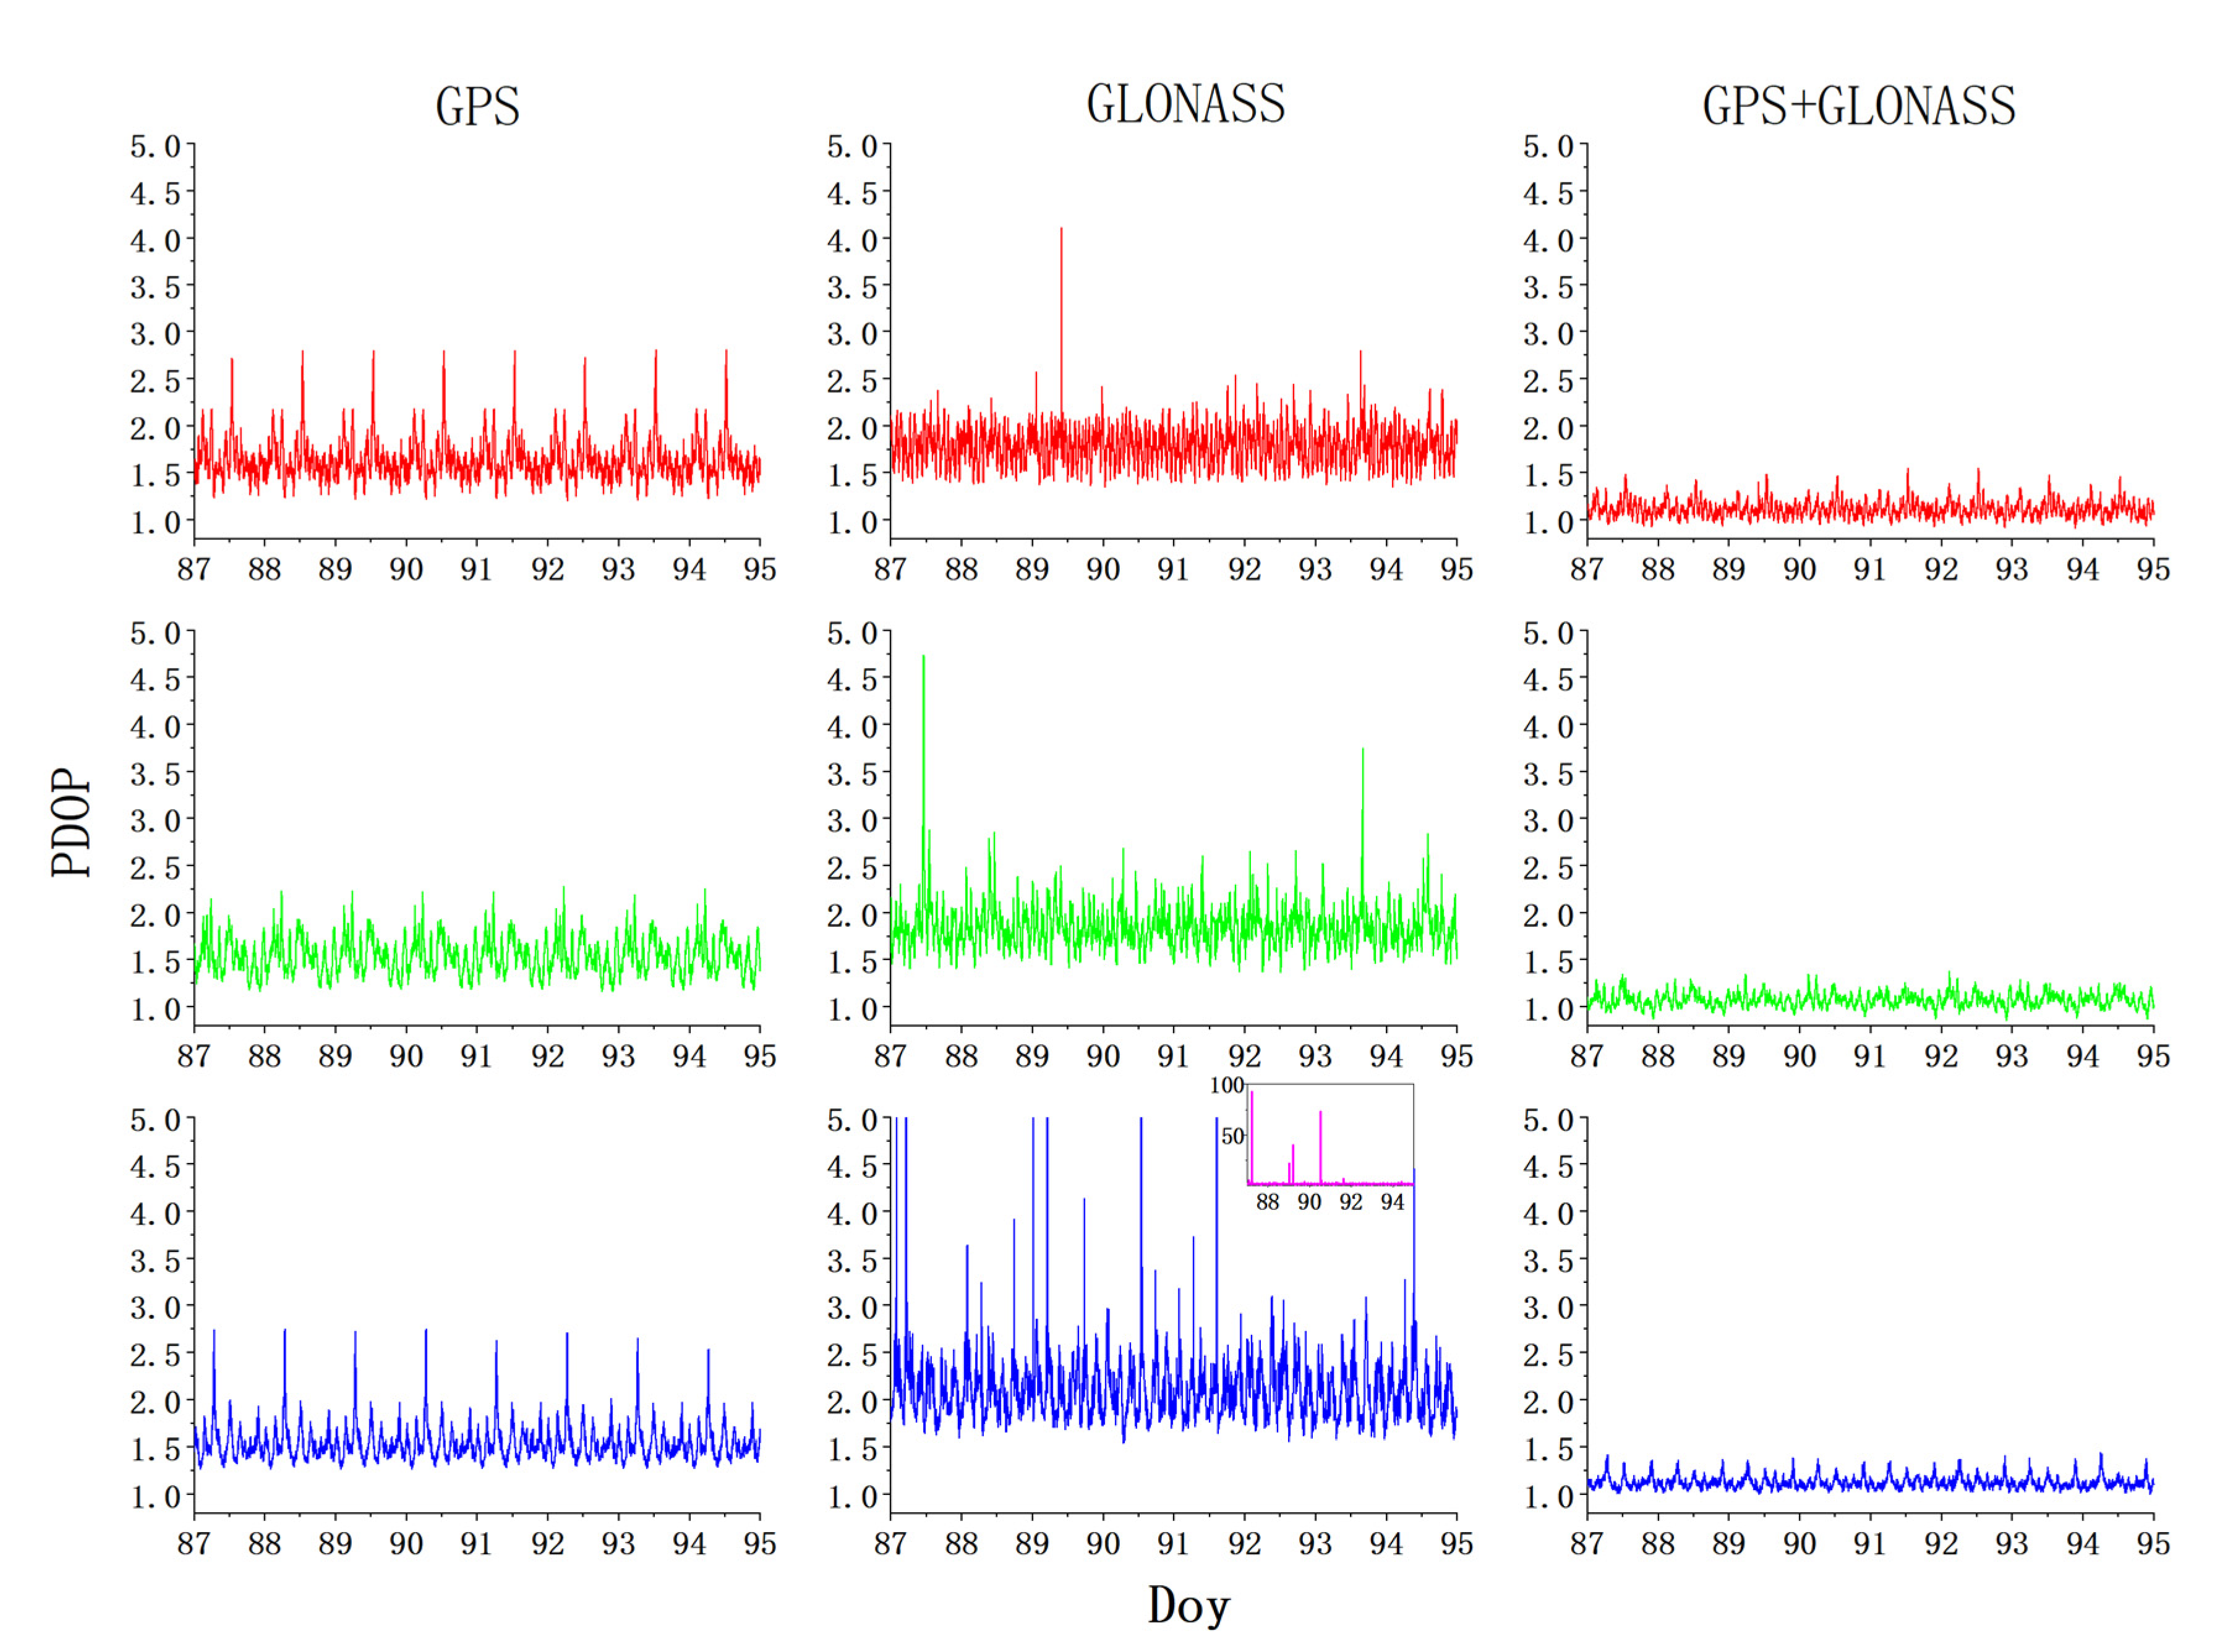
Figure 7.
The PDOP of GPS, GLONASS, and GPS+GLONASS in the high (red), middle (green), and low (blue) latitude networks (The GLONASS PDOP for the low latitude network exceed the coordinate threshold, and the small picture in the upper right corner with the rose thread shows the full view of the PDOP).
Figure 8.
The coordinate error series of station SOD3, WTZR, and SPTU estimated with DD processing.
Figure 8.
The coordinate error series of station SOD3, WTZR, and SPTU estimated with DD processing.
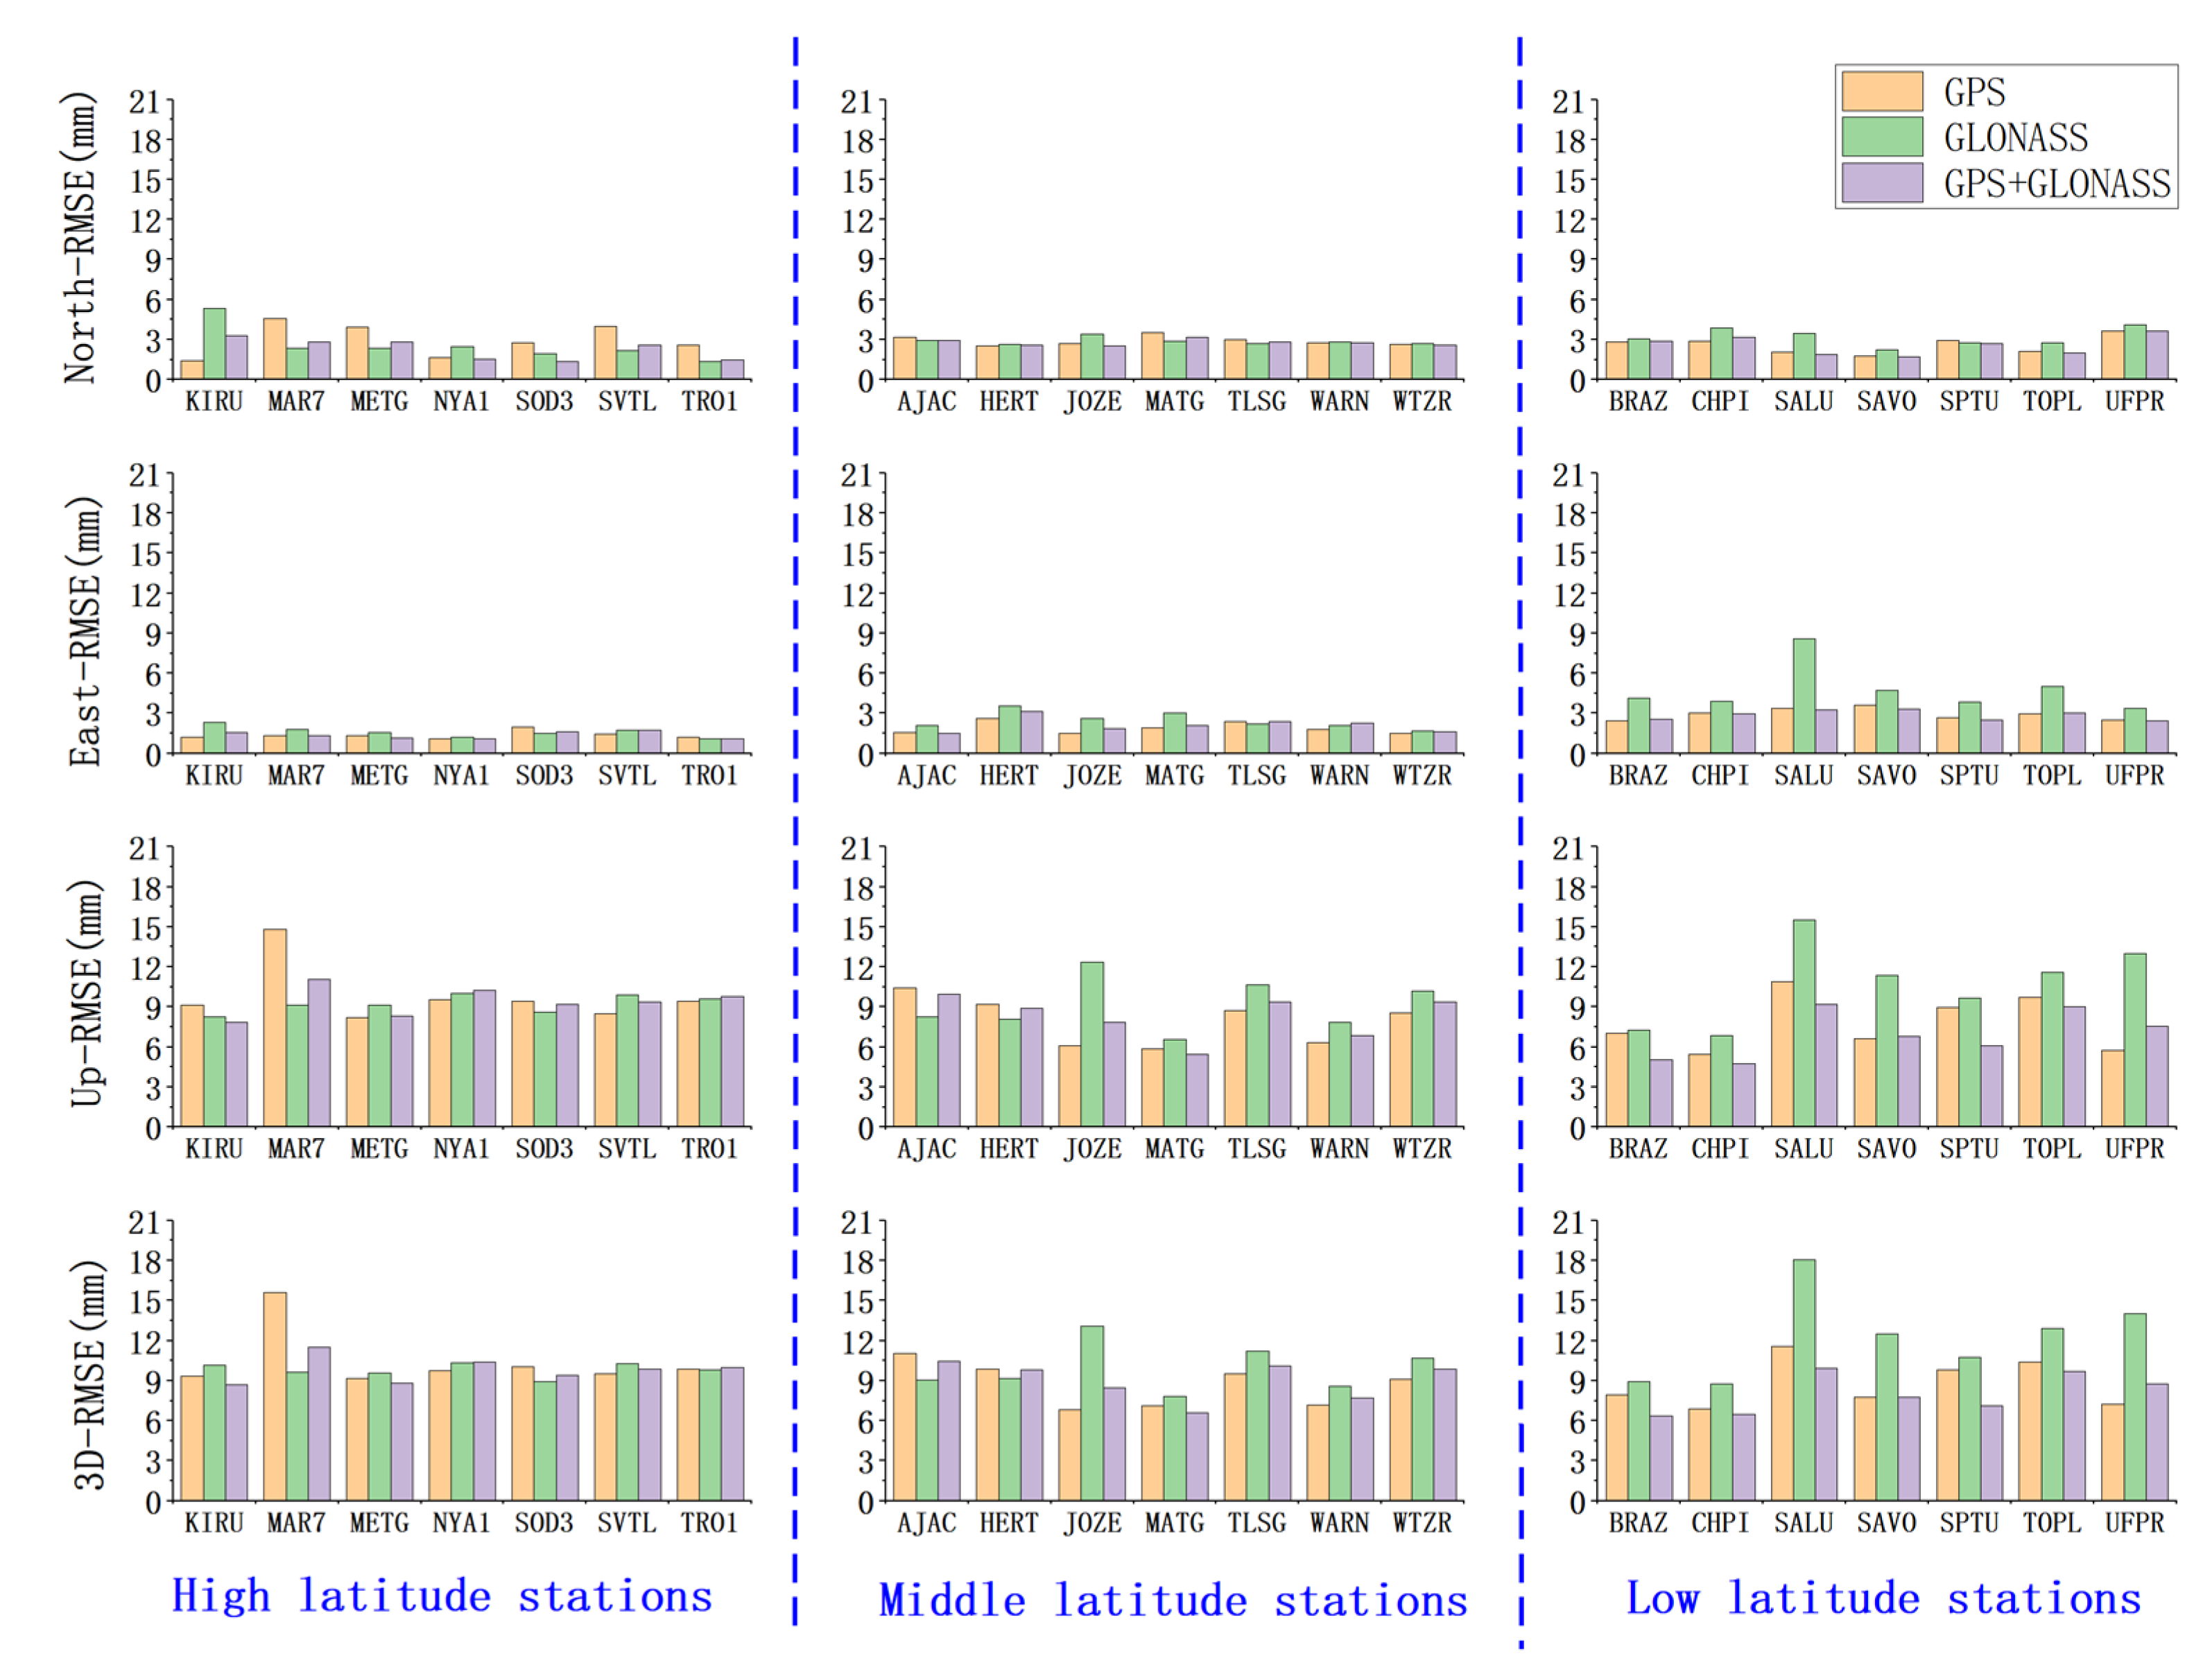
Figure 9.
The RMSE of coordinates estimated with DD processing.
Figure 9.
The RMSE of coordinates estimated with DD processing.
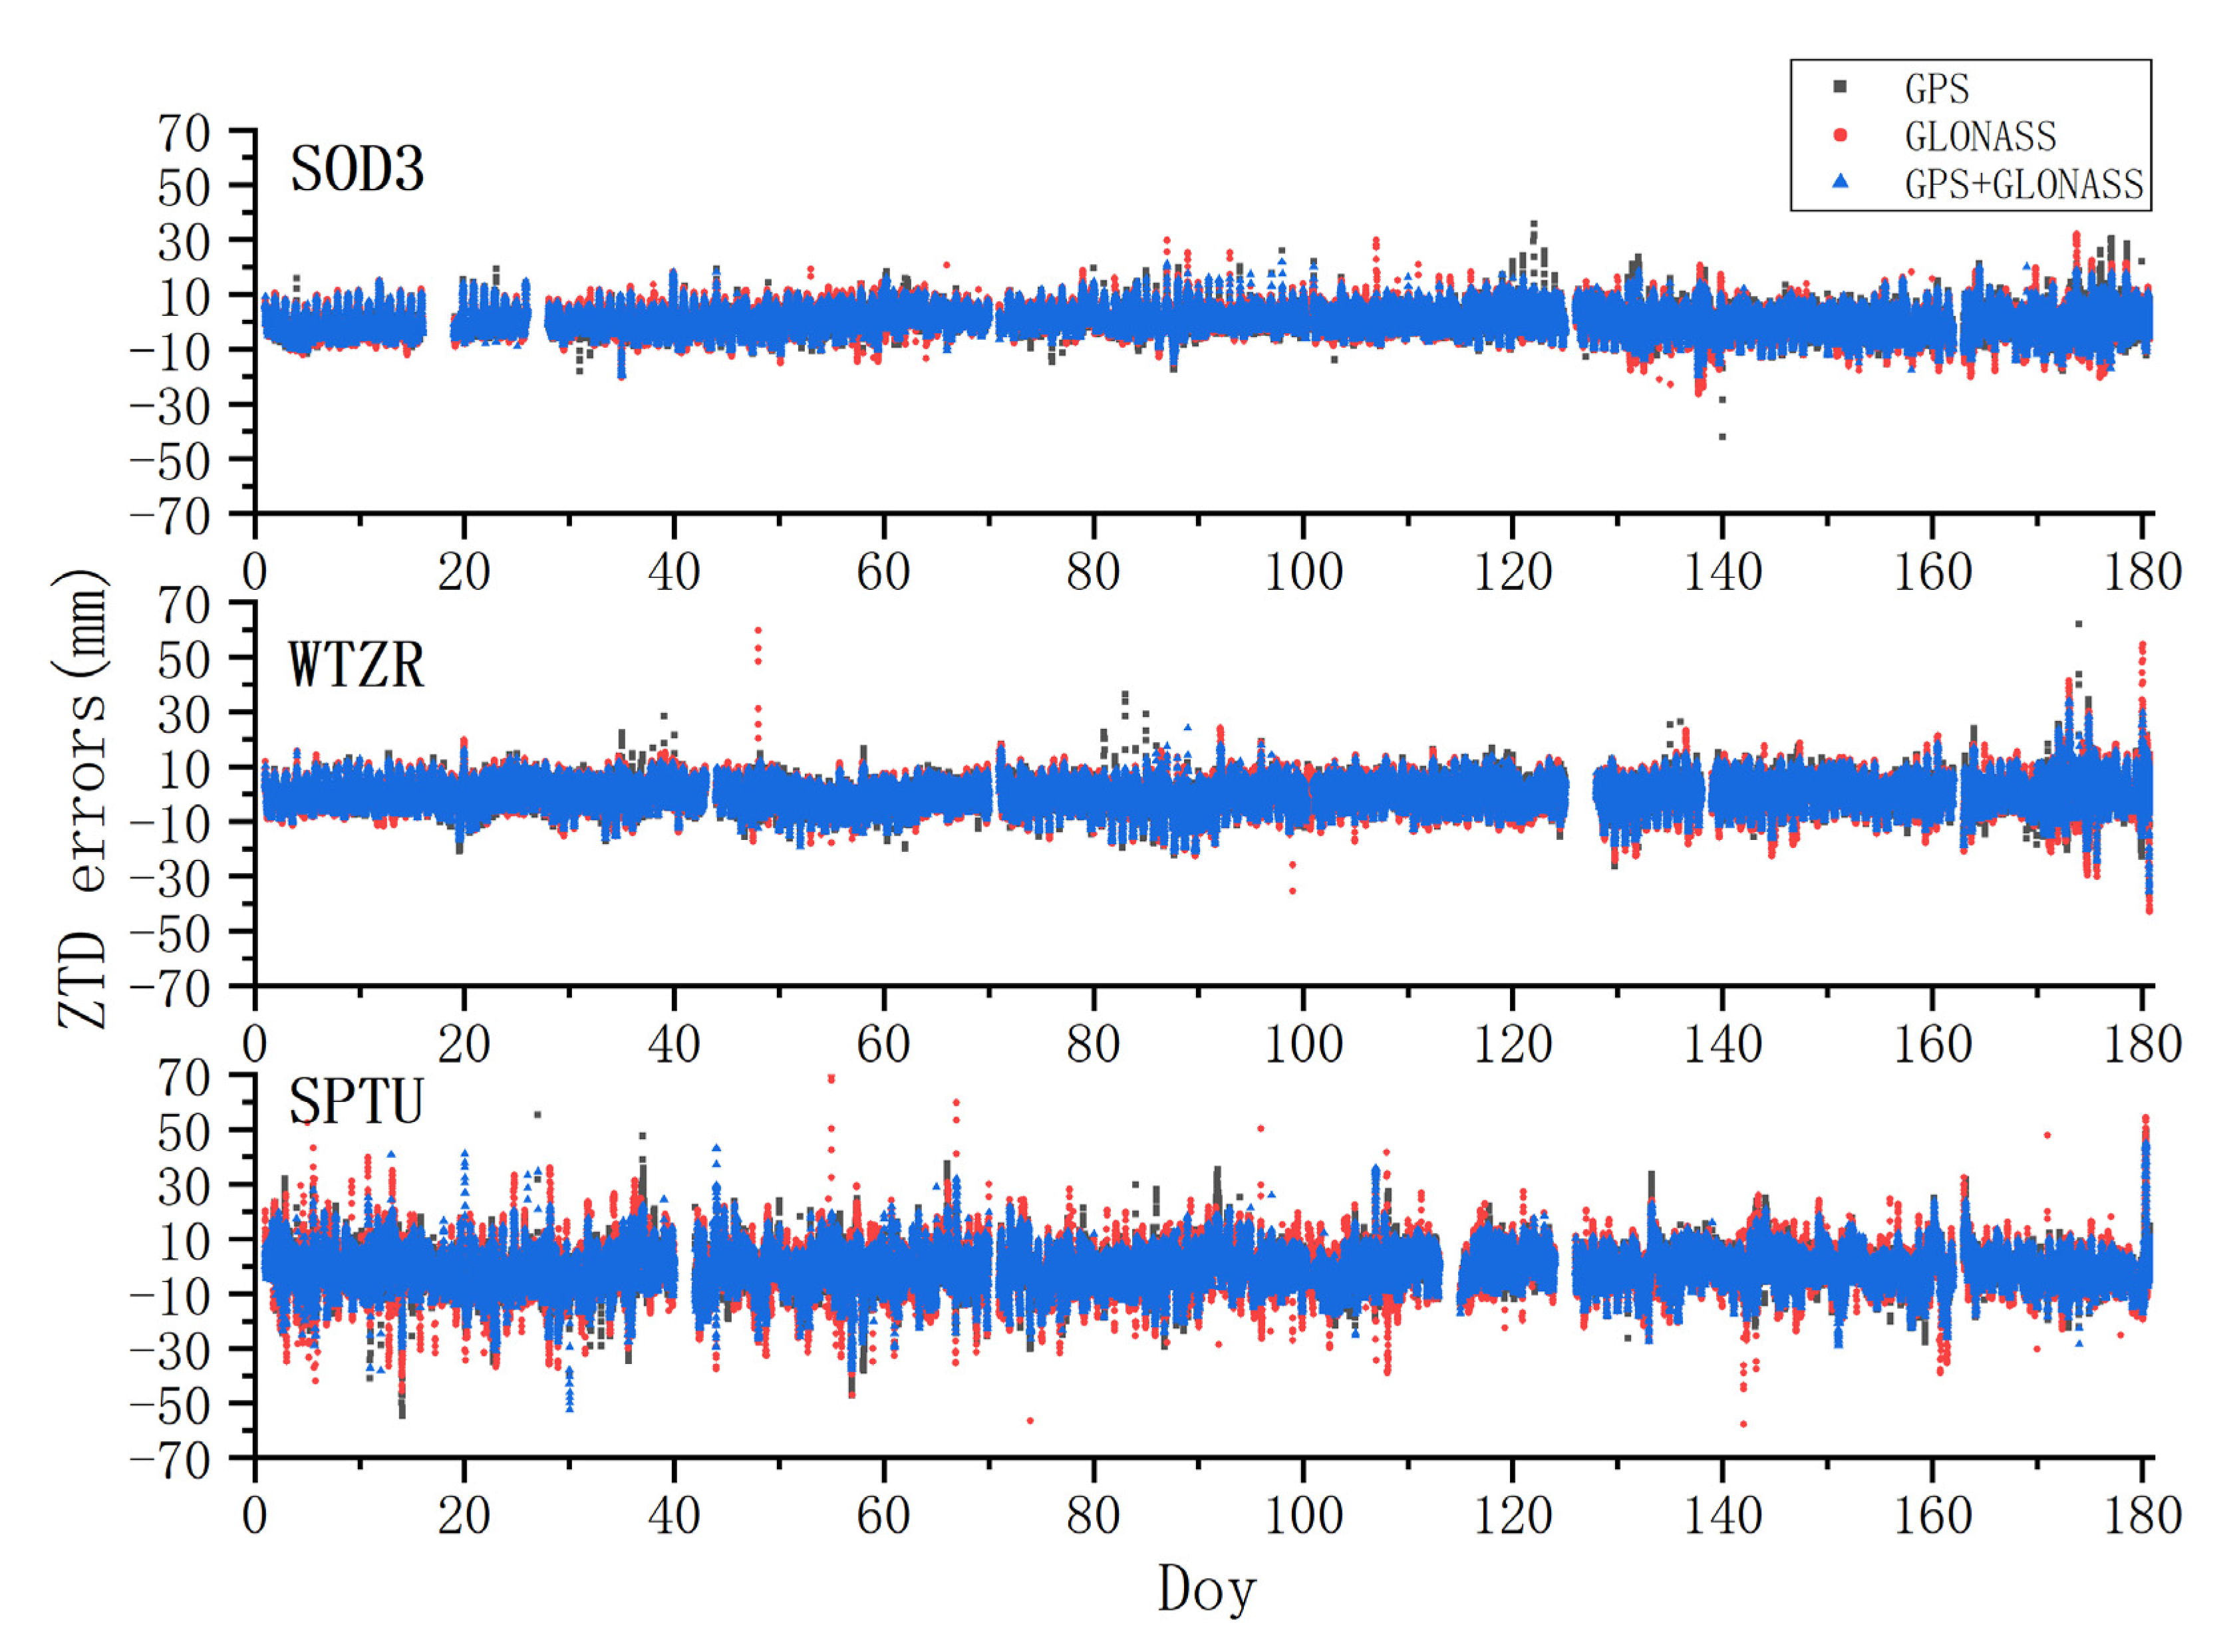
Figure 10.
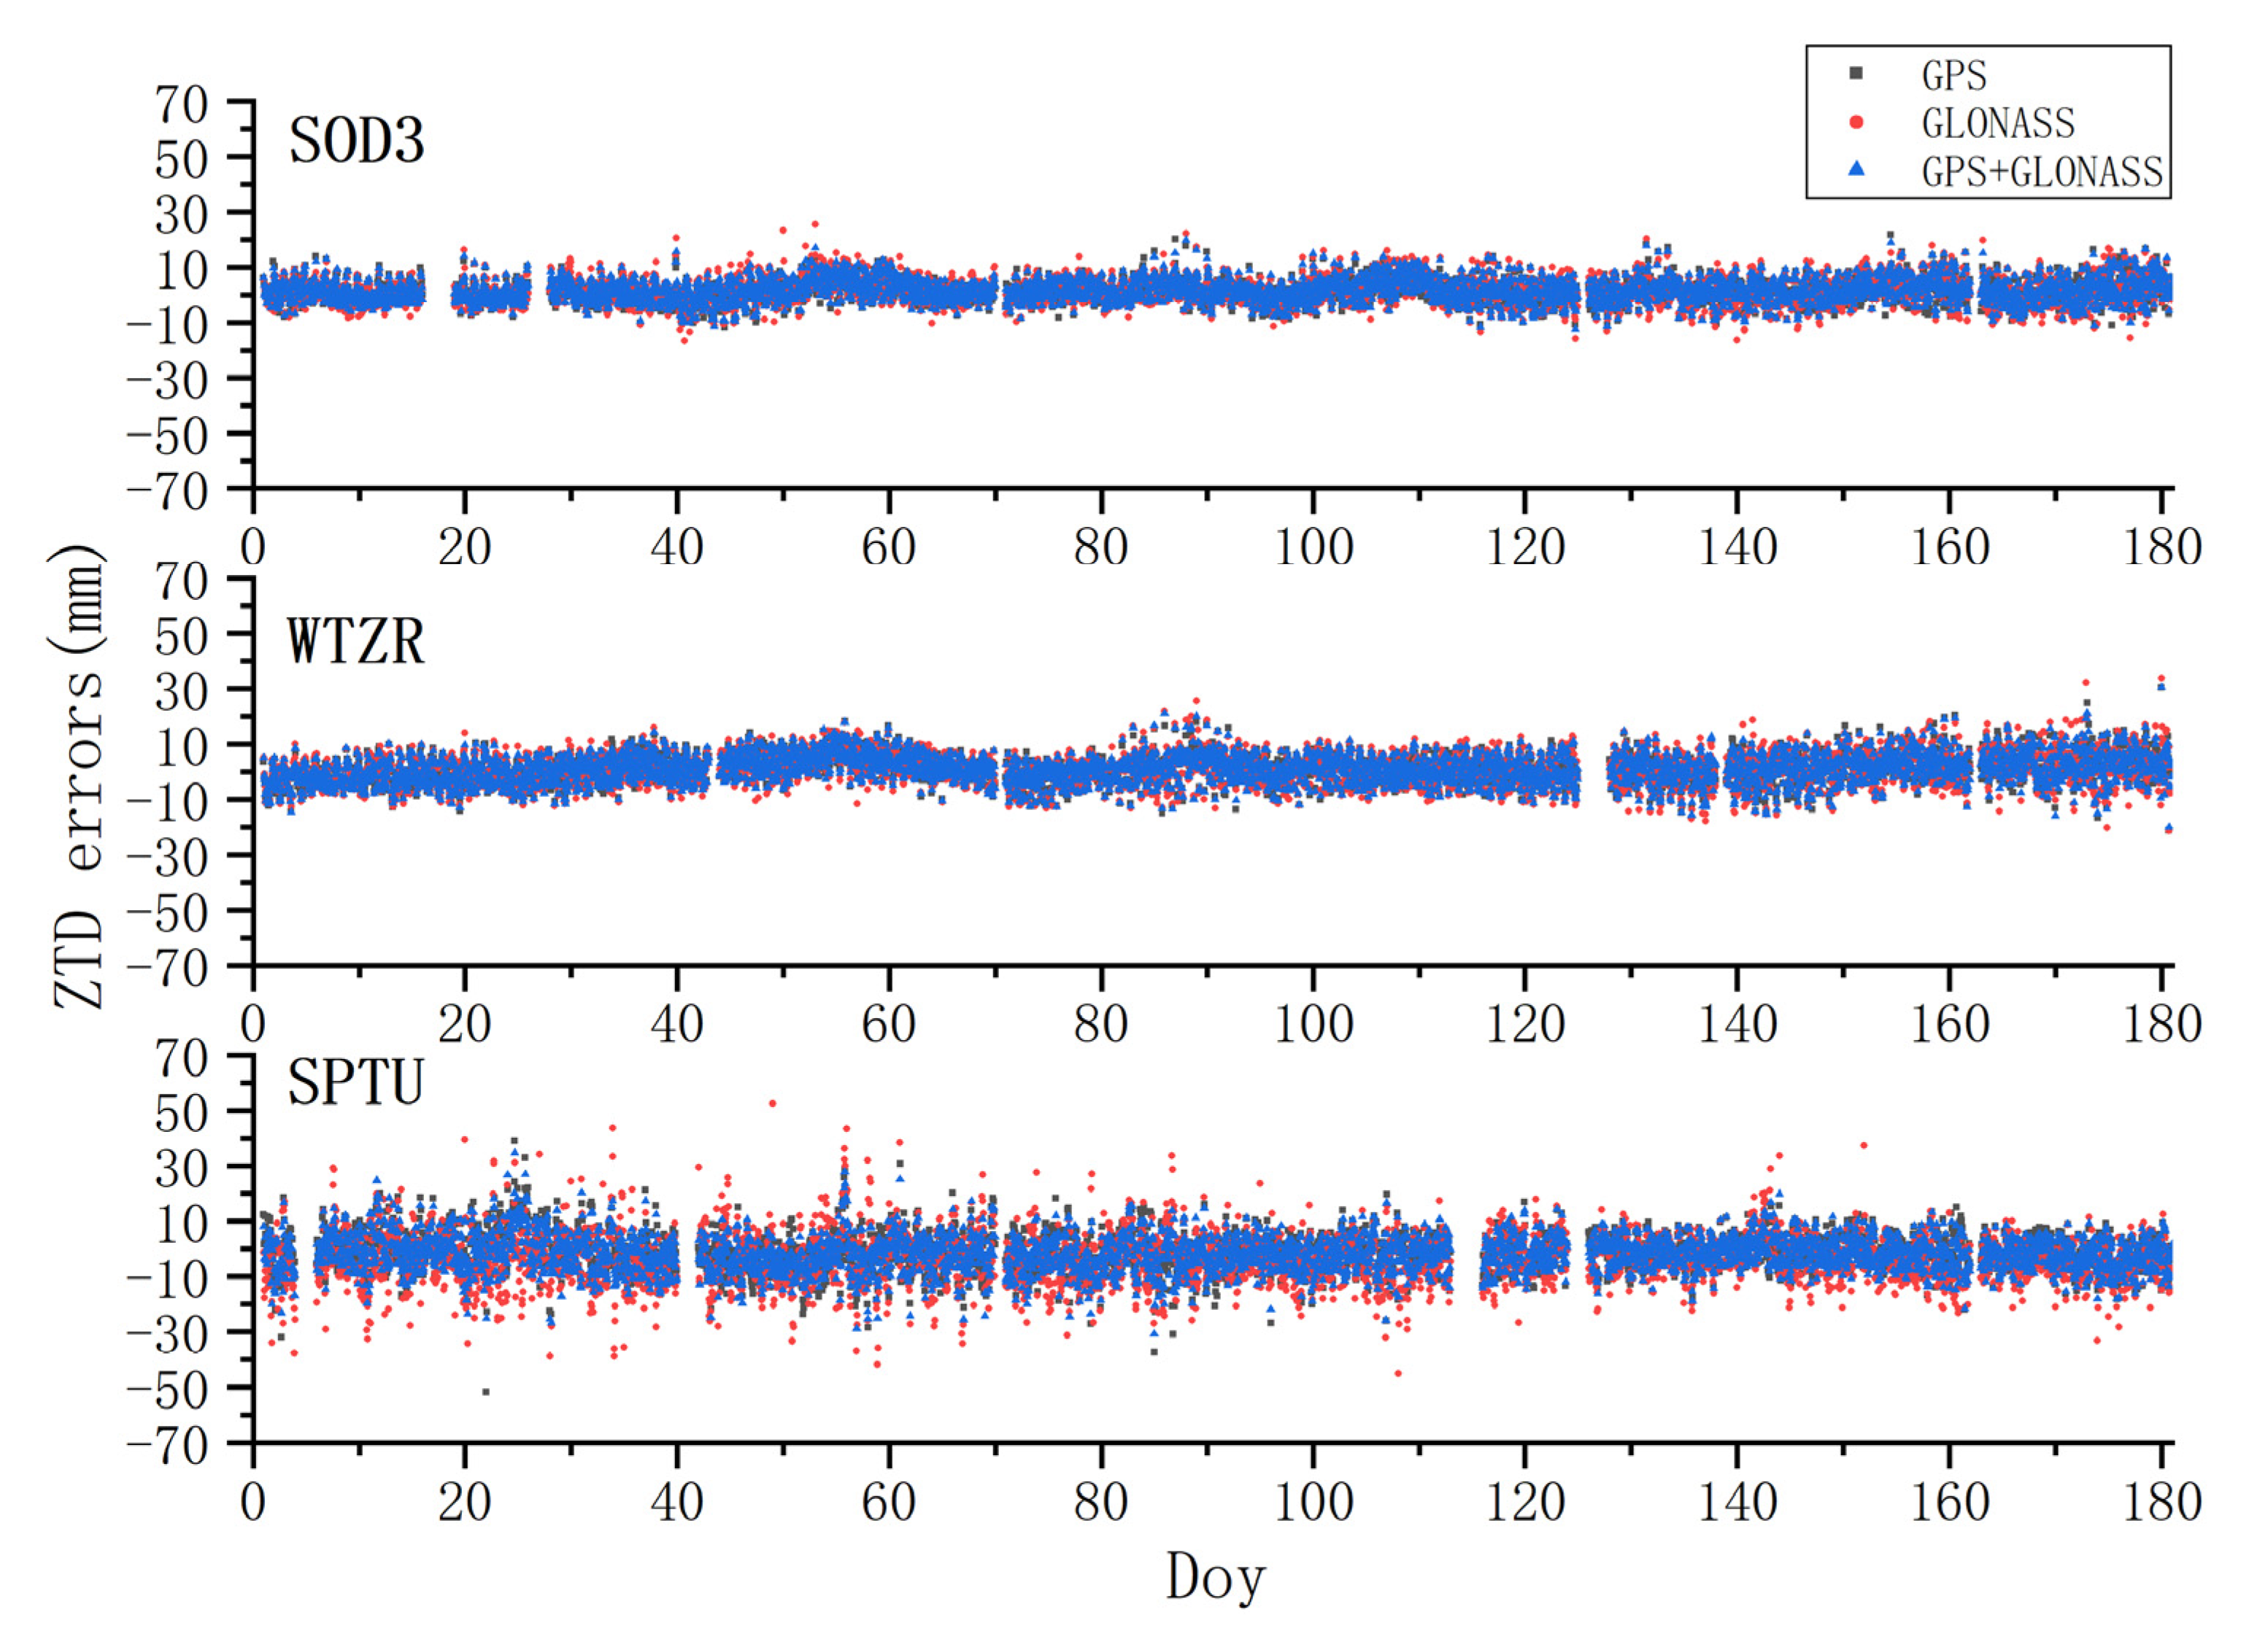
The ZTD error series of station SOD3, WTZR, and SPTU estimated with DD processing.
Figure 10.
The ZTD error series of station SOD3, WTZR, and SPTU estimated with DD processing.
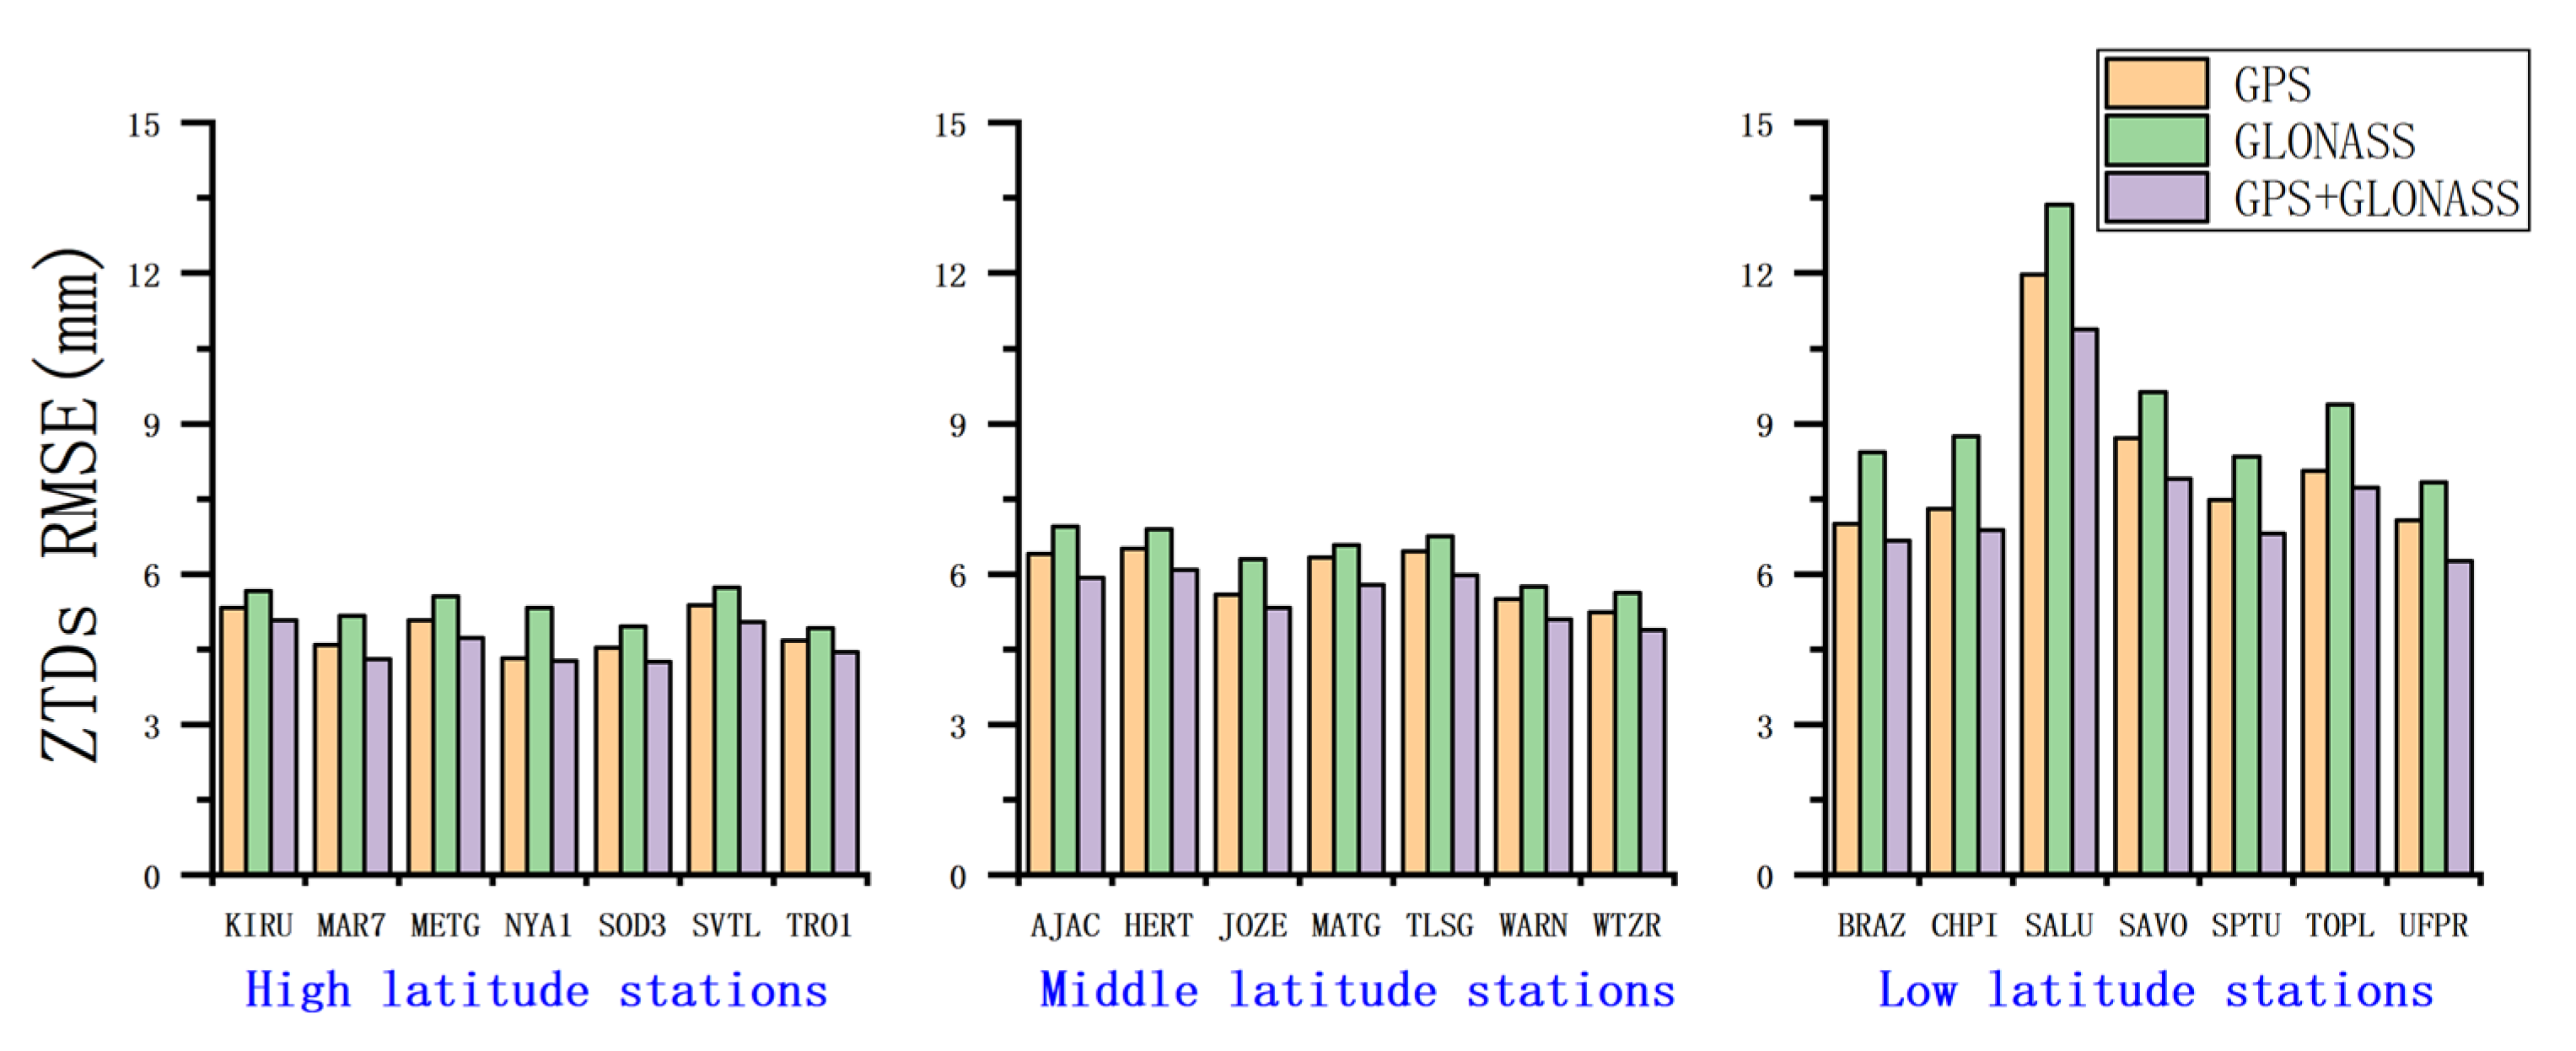
Figure 11.
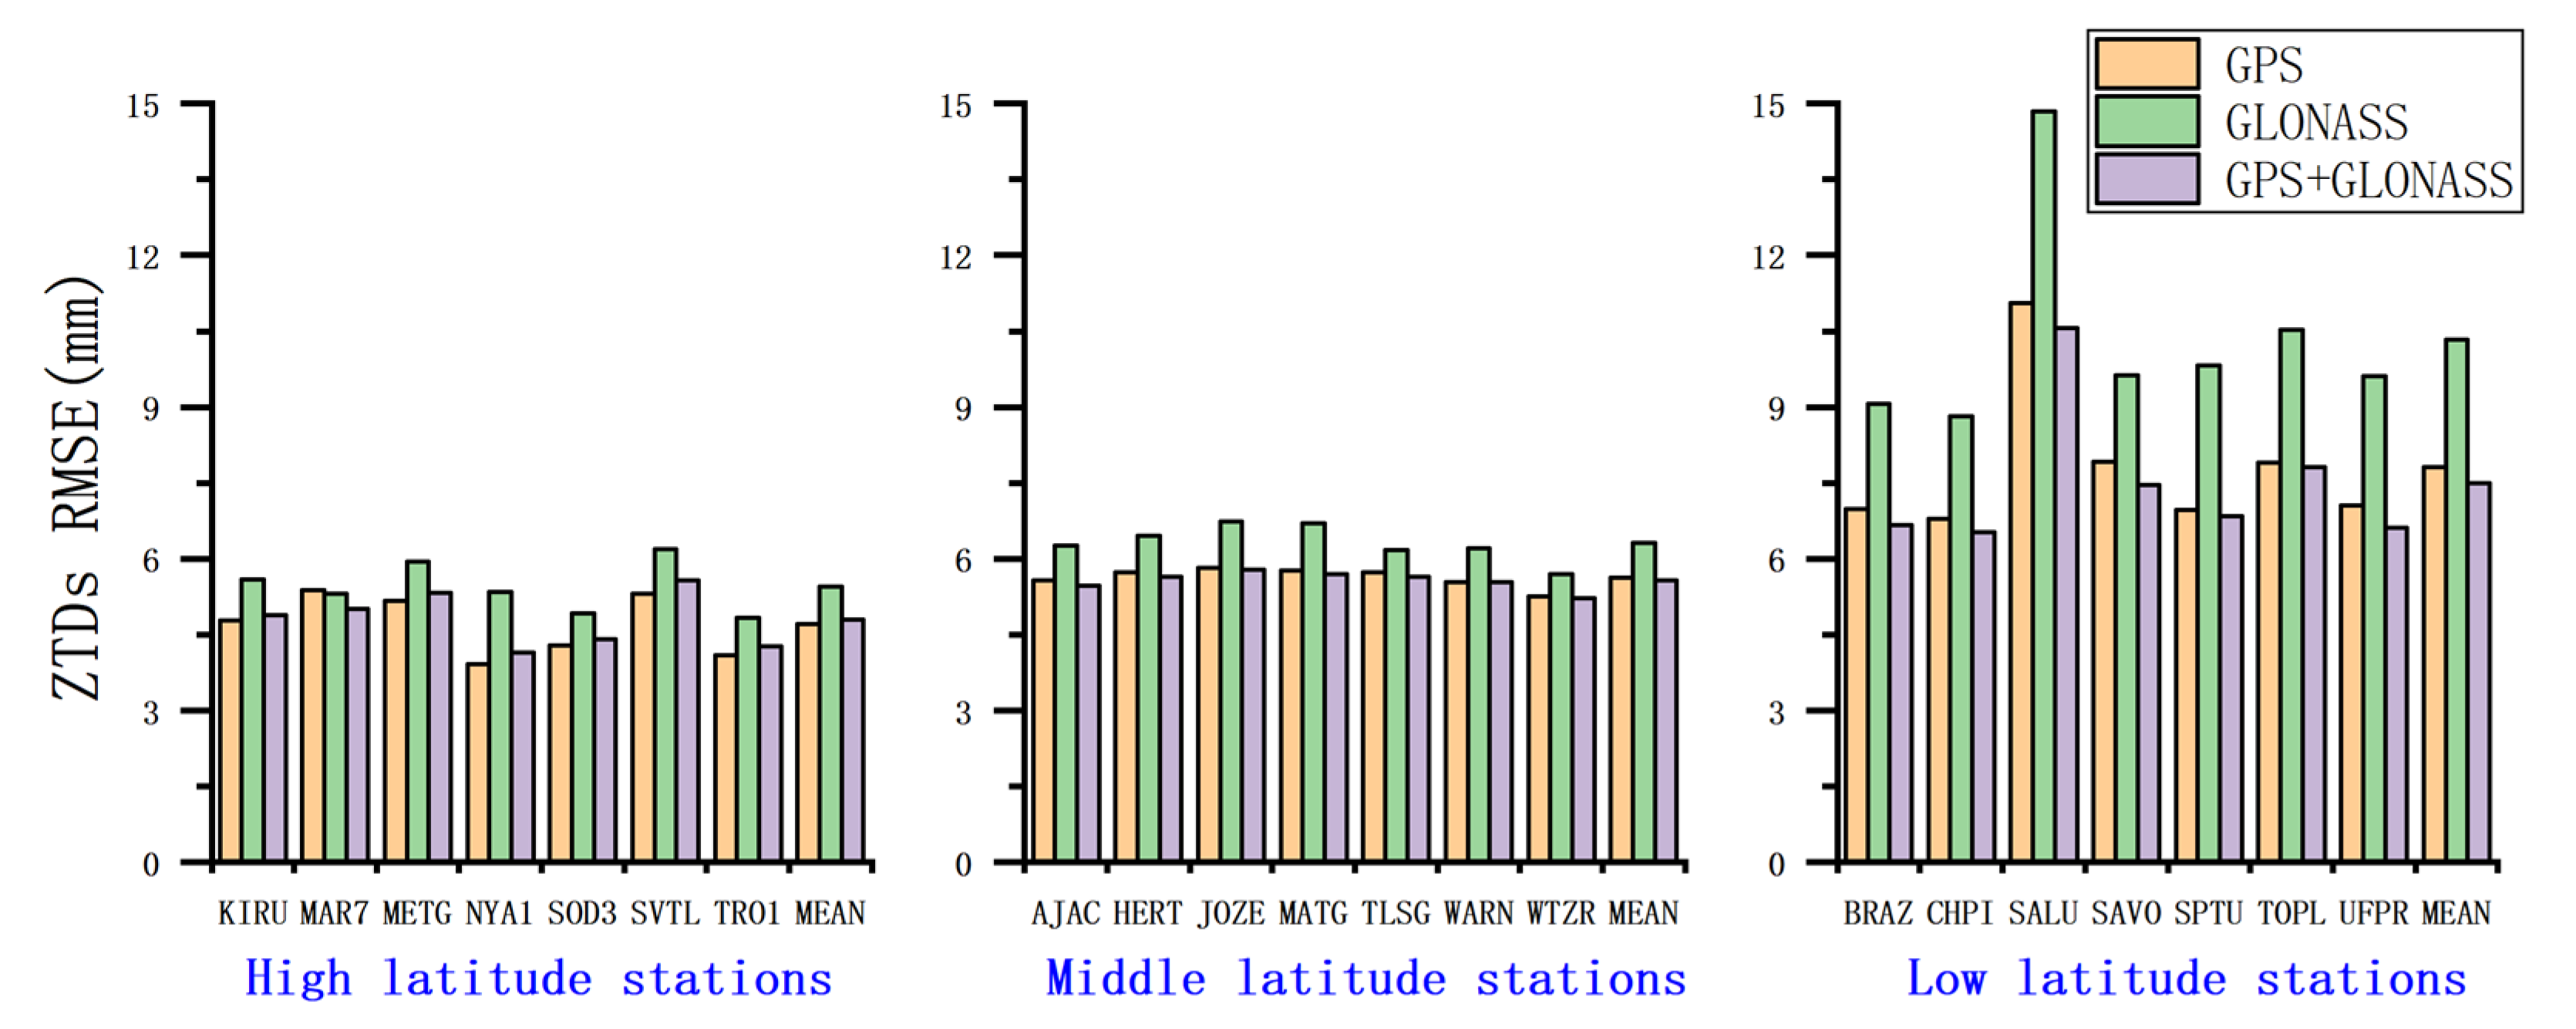
The RMSE of ZTDs estimated with DD processing.
Figure 11.
The RMSE of ZTDs estimated with DD processing.
Figure 12.
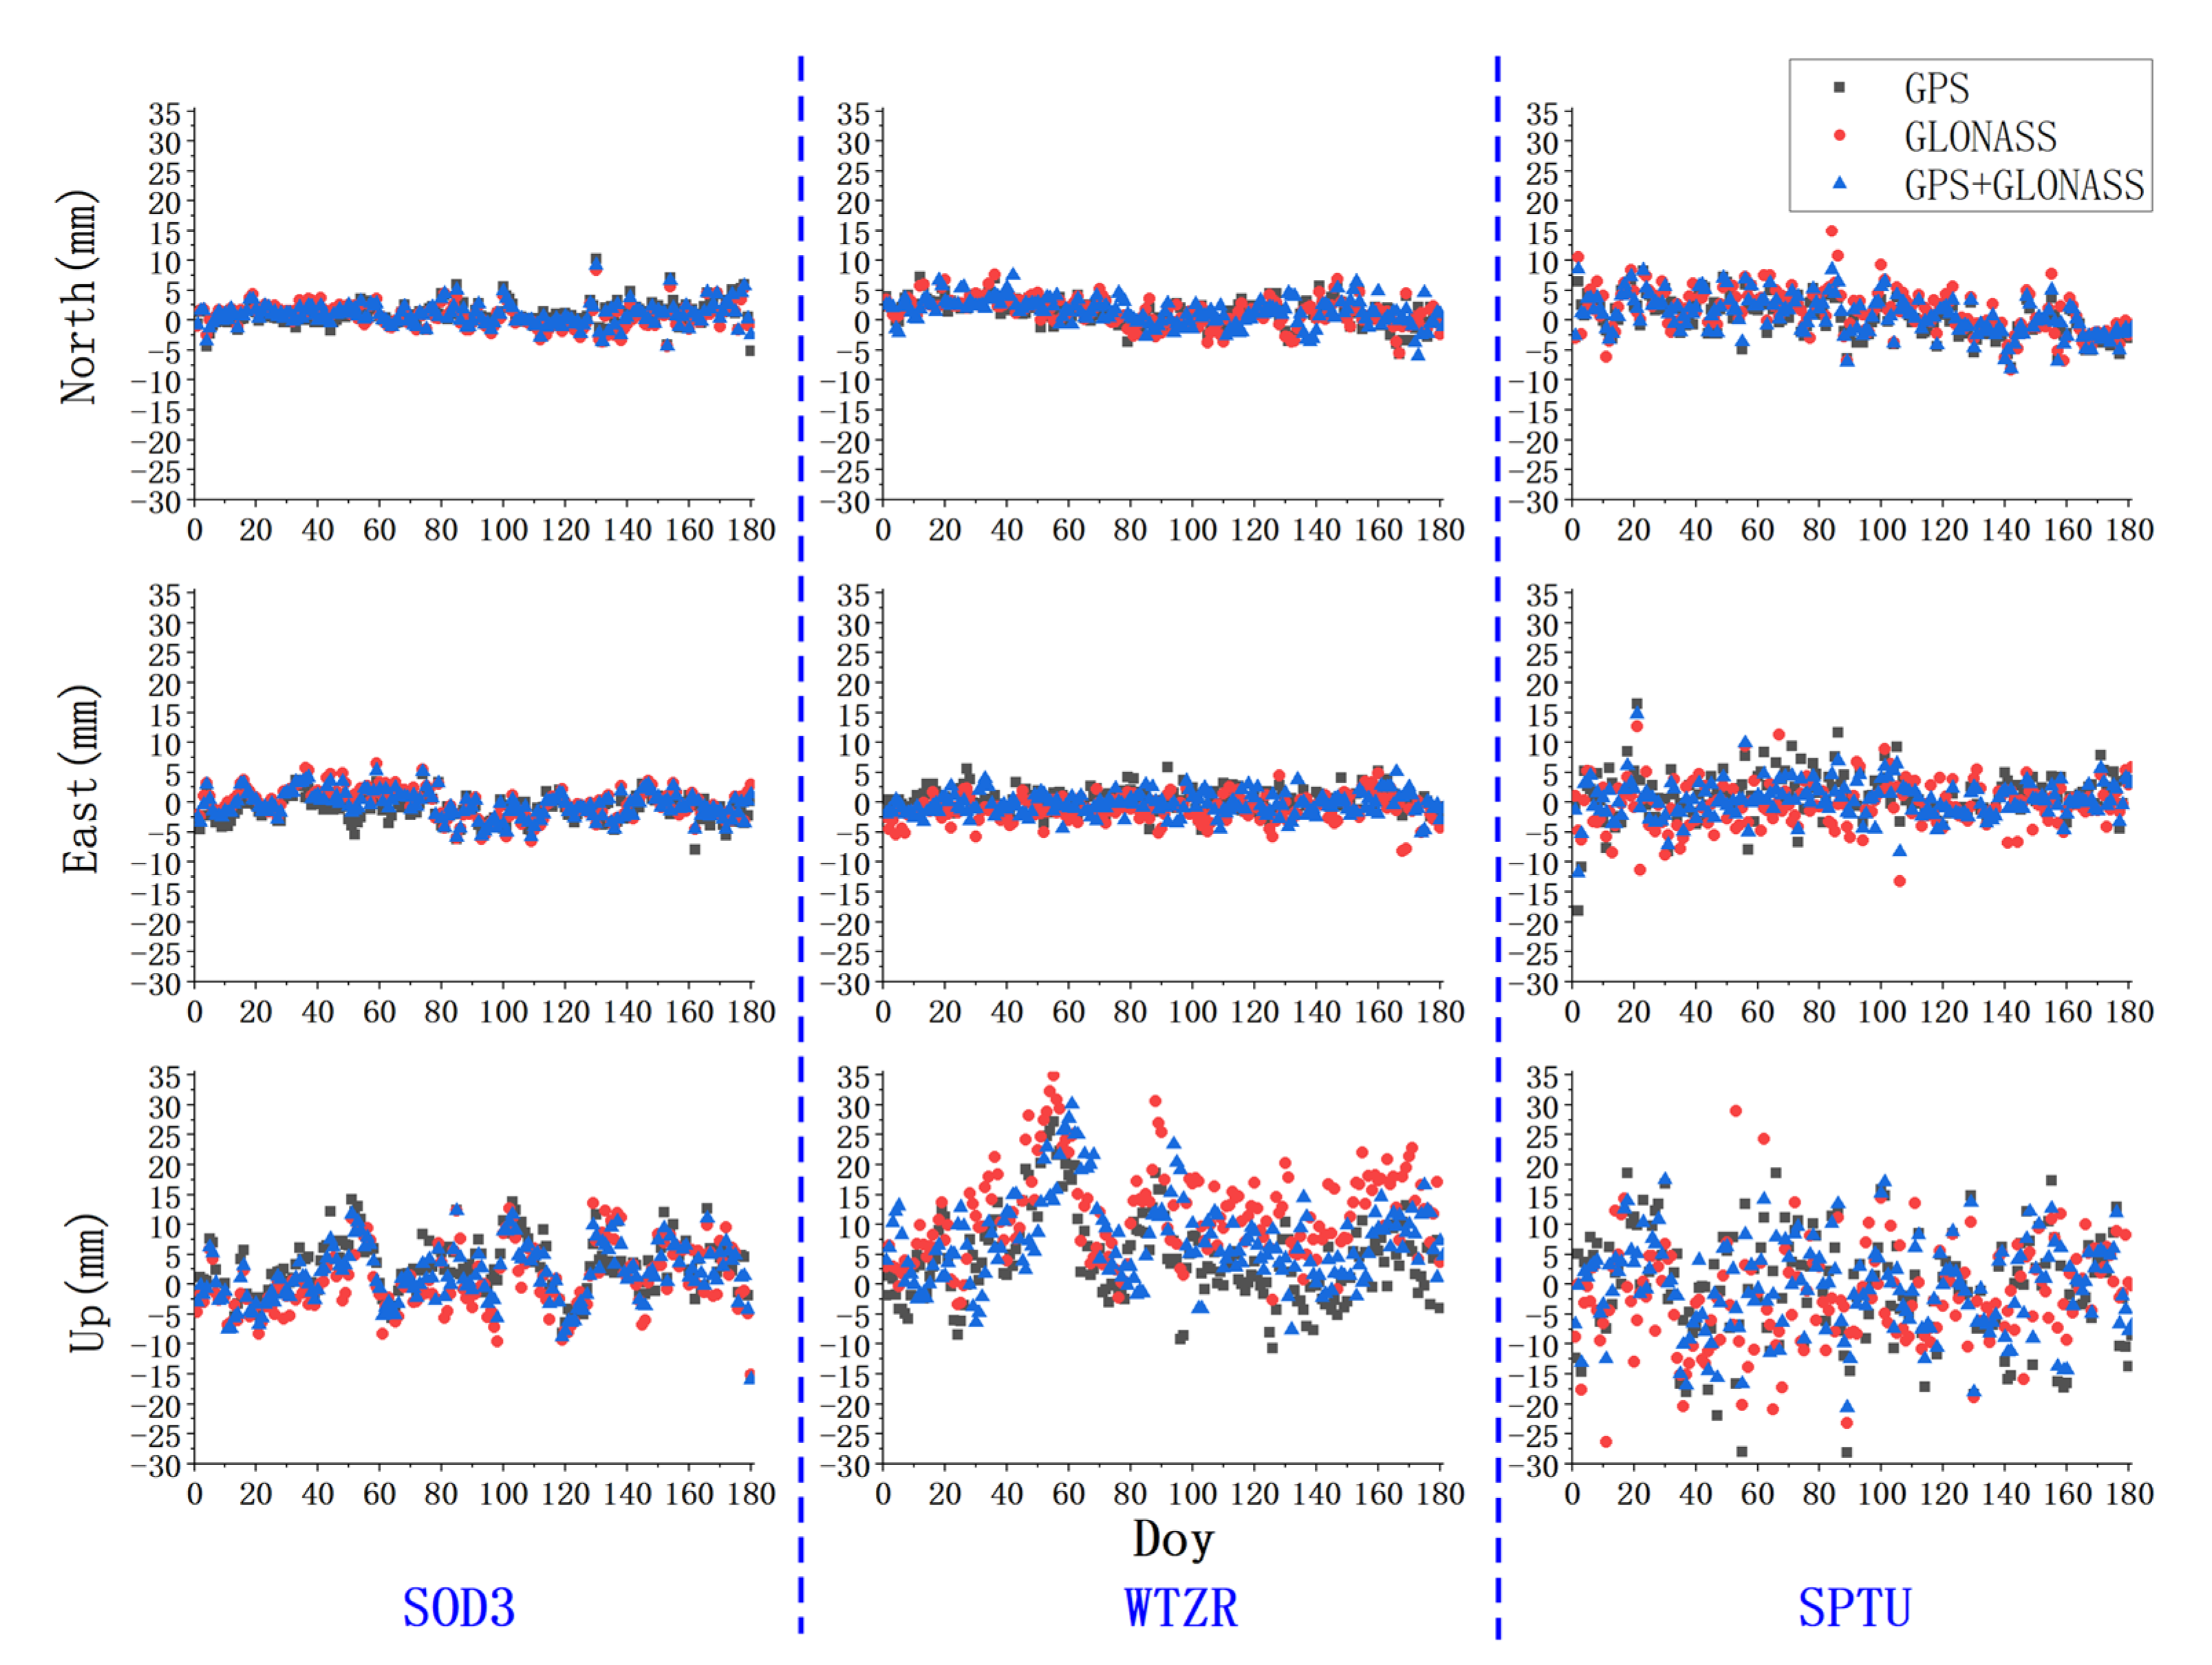
The coordinate error series of station SOD3, WTZR, and SPTU estimated with PPP.
Figure 12.
The coordinate error series of station SOD3, WTZR, and SPTU estimated with PPP.
Figure 13.
The RMSE of coordinates of all the stations estimated with PPP.
Figure 13.
The RMSE of coordinates of all the stations estimated with PPP.
Figure 14.
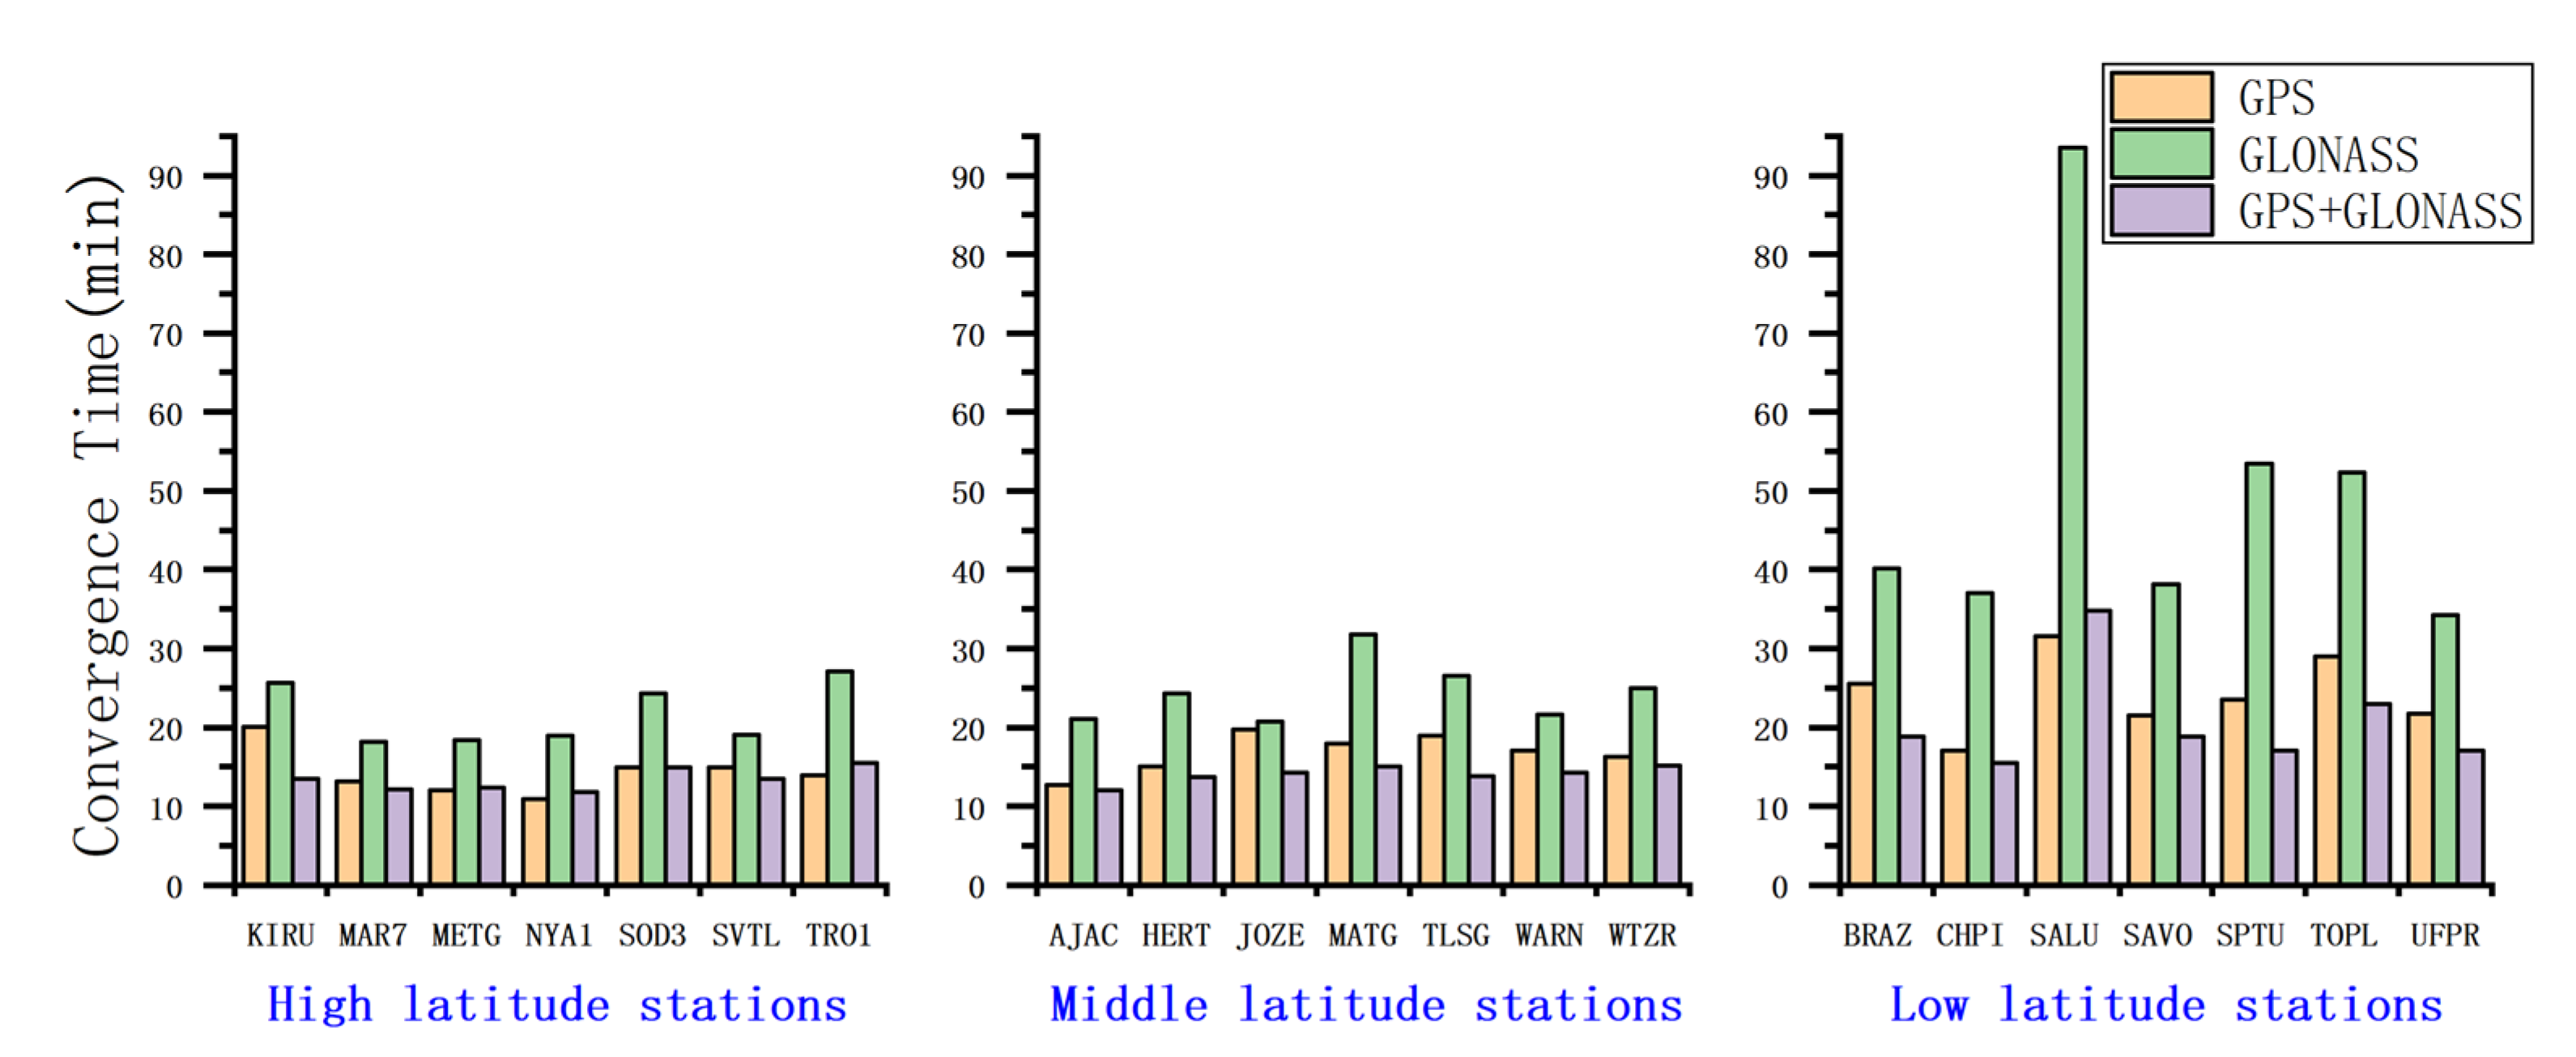
The convergence time of PPP.
Figure 14.
The convergence time of PPP.
Figure 15.
The ZTD error series of station SOD3, WTZR, and SPTU estimated with PPP.
Figure 15.
The ZTD error series of station SOD3, WTZR, and SPTU estimated with PPP.
Figure 16.
The RMSE of ZTDs estimated with PPP.
Figure 16.
The RMSE of ZTDs estimated with PPP.
Table 1.
The processing strategies of PPP.
Table 1.
The processing strategies of PPP.
| Item | Processing Strategies |
|---|
| Signal selection | L1 and L2 |
| Sampling rate | 30 s |
| Elevation mask | 3° |
| Precise products | CODE final precise products |
| Weight for observations | Elevation-dependent weighting |
| Receiver clock | Estimated as white noise |
| Ionosphere | IF combination |
| Troposphere | GPT2, VMF1 |
| Ocean tidal loading | FES2004 |
| DCB | CODE DCB monthly files |
| Antenna center offset and variation | IGS14.atx |
| Processing mode | PPP static in 24 h window |
| Strategy | Forward extended Kalman filter |
Table 2.
The GNSS receivers and the antenna + radome types of the high latitude stations.
Table 2.
The GNSS receivers and the antenna + radome types of the high latitude stations.
| Station Name | Receiver Type | Antenna + Radome Type |
|---|
| KIRU | SEPT POLARX5 | SEPCHOKE_B3E6 SPKE |
| MAR7 | TRIMBLE ALLOY | LEIAR25.R3 LEIT |
| METG | SEPT POLARX5 | TRM59800.00 SCIS |
| NYA1 | TRIMBLE NETR8 | ASH701073.1 SNOW |
| SOD3 | JAVAD TRE_3 DELTA | JAVRINGANT_DM SCIS |
| SVTL | JAVAD TRE_3 DELTA | JAVRINGANT_DM JVDM |
| TRO1 | TRIMBLE NETR9 | TRM59800.00 SCIS |
Table 3.
The GNSS receivers and the antenna + radome types of the middle latitude stations.
Table 3.
The GNSS receivers and the antenna + radome types of the middle latitude stations.
| Station Name | Receiver Type | Antenna + Radome Type |
|---|
| AJAC | SEPT POLARX5 | TRM115000.00 NONE |
| HERT | LEICA GRX1200GGPRO | LEIAT504GG NONE |
| JOZE | SEPT POLARX5 | SEPCHOKE_B3E6 NONE |
| MATG | LEICA GR10 | LEIAR25 NONE |
| TLSG | SEPT POLARX5TR | TRM59800.00 NONE |
| WARN | JAVAD TRE_3 DELTA | LEIAR25.R4 LEIT |
| WTZR | LEICA GR50 | LEIAR25.R3 LEIT |
Table 4.
The GNSS receivers and the antenna + radome types of the low latitude stations.
Table 4.
The GNSS receivers and the antenna + radome types of the low latitude stations.
| Station Name | Receiver Type | Antenna + Radome Type |
|---|
| BRAZ | TRIMBLE NETR9 | TRM57971.00 NONE |
| CHPI | SEPT POLARX5 | TPSCR.G3 NONE |
| SALU | TRIMBLE NETR9 | TRM115000.00 NONE |
| SAVO | TRIMBLE NETR9 | TRM115000.00 NONE |
| SPTU | TRIMBLE NETR9 | TRM57971.00 NONE |
| TOPL | TRIMBLE NETR9 | TRM115000.00 NONE |
| UFPR | TRIMBLE NETR9 | TRM115000.00 NONE |
Table 5.
The mean value of each data quality indicator in the three networks.
Table 5.
The mean value of each data quality indicator in the three networks.
| | Indicator | DI (%) | MP1 (m) | MP2 (m) | SN1 (dB) | SN2 (dB) |
|---|
| Region | | G | R | G | R | G | R | G | R | G | R |
|---|
| High latitude network | 94.33 | 82.37 | 0.47 | 0.48 | 0.45 | 0.39 | 6.56 | 7.12 | 5.33 | 6.88 |
| Middle latitude network | 96.11 | 83.46 | 0.39 | 0.46 | 0.39 | 0.43 | 7.02 | 7.20 | 6.35 | 6.76 |
| Low latitude network | 94.81 | 81.33 | 0.72 | 0.53 | 0.48 | 0.44 | 6.72 | 6.59 | 4.92 | 6.32 |
Table 6.
The mean RMSE of coordinates of each network estimated with DD processing and their comparison among different processing modes (where R/G indicates the accuracy comparison of GLONASS and GPS results, (G + R)/G indicates the accuracy comparison of GPS+GLONASS results and GPS estimates. The positive red and negative green values indicate the percentage increment and reduction of accuracy, respectively).
| | System | G (mm) | R (mm) | G + R (mm) | R/G (%) | (G + R)/G (%) |
|---|
| Component | |
|---|
| N | 2.99 | 2.58 | 2.27 | +13.79 | +24.29 |
| E | 1.38 | 1.60 | 1.38 | −16.17 | +0.00 |
| U | 9.87 | 9.24 | 9.41 | +6.35 | +4.66 |
| 3D | 10.40 | 9.73 | 9.77 | +6.50 | +6.05 |
| N | 2.91 | 2.88 | 2.78 | +1.14 | +4.48 |
| E | 1.90 | 2.47 | 2.12 | −30.17 | −11.77 |
| U | 7.89 | 9.14 | 8.25 | −15.79 | −4.59 |
| 3D | 8.62 | 9.89 | 8.96 | −14.74 | −3.96 |
| N | 2.60 | 3.18 | 2.57 | −22.13 | +1.37 |
| E | 2.94 | 4.79 | 2.87 | −62.86 | +2.39 |
| U | 7.77 | 10.74 | 6.93 | −38.24 | +10.89 |
| 3D | 8.71 | 12.18 | 7.92 | −39.93 | +9.00 |
Table 7.
The ambiguity fixing rate of DD processing (G, R, and G + R in black body denote the data processing mode, respectively. No bold G, R, and G + R represent the ambiguity fixing rate of GPS+GLONASS processing mode, respectively).
Table 7.
The ambiguity fixing rate of DD processing (G, R, and G + R in black body denote the data processing mode, respectively. No bold G, R, and G + R represent the ambiguity fixing rate of GPS+GLONASS processing mode, respectively).
| | System | G (%) | R (%) | G + R |
|---|
| Region | | G (%) | R (%) | G + R (%) |
|---|
| High latitude network | 70.3 | 63.9 | 69 | 62.8 | 66.5 |
| Middle latitude network | 53.1 | 56 | 51.5 | 54.8 | 53.0 |
| Low latitude network | 74.7 | 26.4 | 74.6 | 33.9 | 57.5 |
Table 8.
The mean RMSE of ZTDs estimated with DD processing for each network and their comparison between different processing modes (The positive red and negative green values indicate the percentage increment and reduction of accuracy, respectively).
Table 8.
The mean RMSE of ZTDs estimated with DD processing for each network and their comparison between different processing modes (The positive red and negative green values indicate the percentage increment and reduction of accuracy, respectively).
| | System | G (mm) | R (mm) | G + R (mm) | R/G (%) | G + R/G (%) |
|---|
| Region | |
|---|
| High latitude network | 4.70 | 5.45 | 4.80 | −15.85 | −2.08 |
| Middle latitude network | 5.63 | 6.32 | 5.57 | −12.26 | +1.06 |
| Low latitude network | 7.81 | 10.33 | 7.50 | −32.24 | +4.00 |
Table 9.
The mean RMSE of coordinates for each network estimated with PPP and their comparison between different processing modes (The positive red and negative green values indicate the percentage increment and reduction of accuracy, respectively).
Table 9.
The mean RMSE of coordinates for each network estimated with PPP and their comparison between different processing modes (The positive red and negative green values indicate the percentage increment and reduction of accuracy, respectively).
| | System | G (mm) | R (mm) | G + R (mm) | R/G (%) | G + R/G (%) |
|---|
| Component | |
|---|
| N | 2.66 | 2.30 | 2.16 | +13.62 | +18.78 |
| E | 3.16 | 3.13 | 2.83 | +0.87 | +10.37 |
| U | 6.67 | 6.86 | 6.15 | −2.83 | +7.87 |
| 3D | 7.92 | 8.03 | 7.18 | −1.37 | +9.35 |
| N | 2.97 | 3.56 | 3.14 | −19.83 | −5.63 |
| E | 2.64 | 3.21 | 2.56 | −21.77 | +2.99 |
| U | 7.54 | 9.08 | 7.62 | −20.40 | −1.03 |
| 3D | 8.56 | 10.39 | 8.69 | −21.43 | −1.52 |
| N | 3.44 | 3.86 | 3.48 | −12.06 | −0.96 |
| E | 3.91 | 4.09 | 3.14 | −4.54 | +19.73 |
| U | 8.19 | 8.87 | 7.23 | −8.30 | +11.79 |
| 3D | 9.78 | 10.52 | 8.66 | −7.58 | +11.40 |
Table 10.
The mean convergence time of PPP for each network and their comparison between different processing modes (The red values indicate the percentage reduction of convergence time and the green values indicate the percentage increment of convergence time).
Table 10.
The mean convergence time of PPP for each network and their comparison between different processing modes (The red values indicate the percentage reduction of convergence time and the green values indicate the percentage increment of convergence time).
| | System | G (min) | R (min) | G + R (min) | R/G (%) | G + R/G (%) |
|---|
| Region | |
|---|
| High latitude network | 14.26 | 21.66 | 13.39 | 51.90 | 6.11 |
| Middle latitude network | 16.81 | 24.43 | 14.03 | 45.28 | 16.57 |
| Low latitude network | 24.27 | 49.83 | 20.73 | 105.30 | 14.60 |
Table 11.
The mean RMSE of ZTDs estimated with the PPP of each network and their comparison between different processing modes (The positive red and negative green values indicate the percentage increment and reduction of accuracy, respectively).
Table 11.
The mean RMSE of ZTDs estimated with the PPP of each network and their comparison between different processing modes (The positive red and negative green values indicate the percentage increment and reduction of accuracy, respectively).
| | System | G (mm) | R (mm) | G + R (mm) | R/G (%) | G + R/G (%) |
|---|
| Region | |
|---|
| High latitude network | 4.84 | 5.33 | 4.59 | −10.10 | +5.19 |
| Middle latitude network | 6.00 | 6.41 | 5.58 | −6.82 | +6.98 |
| Low latitude network | 8.23 | 9.39 | 7.59 | −14.08 | +7.79 |
