Article

Study on the Impact of the Doppler Shift for CO2 Lidar Remote Sensing

1
Department of Atmospheric and Oceanic Sciences & Institute of Atmospheric Sciences, Fudan University, Shanghai 200438, China
2
Chinese Academy of Meteorological Sciences, China Meteorological Administration, Beijing 100081, China
3
Key Laboratory of Radiometric Calibration and Validation for Environmental Satellites, National Satellite Meteorological Center (National Center for Space Weather) and Innovation Center for FengYun Meteorological Satellite (FYSIC), China Meteorological Administration (CMA), Beijing 100081, China
*
Author to whom correspondence should be addressed.
Remote Sens. 2022, 14(18), 4620; https://doi.org/10.3390/rs14184620
Submission received: 13 July 2022 / Revised: 17 August 2022 / Accepted: 6 September 2022 / Published: 16 September 2022

Abstract

:
Atmospheric carbon dioxide (CO2) is recognized as the most important component of the greenhouse gases, the concentration of which has increased rapidly since the pre-industrial era due to anthropogenic emissions of greenhouse gases (GHG). The accurate monitoring of carbon dioxide is essential to study the global carbon cycle and radiation budget on Earth. The Aerosol and Carbon Detection Lidar (ACDL) instrument onboard the Atmospheric Environmental Monitoring Satellite (AEMS) was successfully launched in April 2022, which allows a new perspective to quantify the global spatial distribution of atmospheric CO2 with high accuracy. In this work, the impact of the Doppler shift on CO2 measurements for an integrated-path differential absorption (IPDA) light detection and ranging (lidar) system was evaluated to meet the weighted column-averaged mixing ratio of carbon dioxide (XCO2) measurement requirements of less than one part per million (ppm). The measurement uncertainties due to the Doppler shift were first evaluated in airborne IPDA observations. The result shows that most of the Doppler shift is in the range of 6–8 MHz, resulting in 0.26-0.39 ppm deviations in the XCO2 results. The deviations between the XCO2 retrievals and in situ measurements decreased to 0.16 ppm after the correction of the Doppler shift from 11:28:29 to 11:28:49 in the flight campaign. In addition, the online Doppler shift accounts for 98% of the deviations between XCO2 retrievals and in situ measurements. Furthermore, the impact of the Doppler shift on ACDL measurements is also assessed. The differences between the XCO2 retrievals with and without Doppler shift are used to quantify measurement uncertainties due to the Doppler effect. The simulations reveal that a pointing misalignment of 0.067 mrad can lead to a mean bias of about 0.30 ppm (0.072%) in the CO2 column. In addition, CO2 measurements are more sensitive to the Doppler shift at high altitudes for IPDA lidar, so the largest differences in the CO2 columns are found on the Qinghai–Tibet Plateau in China.

1. Introduction

Global warming has been unequivocal since the pre-industrial era, leading to melting sea ice, rising sea level, biodiversity loss, and other global issues [1]. The fifth assessment report of the International Panel on Climate Change (IPCC) indicated that anthropogenic emissions of greenhouse gases (GHG) and other anthropogenic forcings are the main causes of global warming [2]. The anthropogenic emissions of non-CO2 greenhouse gases, such as methane and nitrous oxide, contribute significantly to climate change [3,4,5,6,7,8,9]. In addition, atmospheric carbon dioxide (CO2), as the most important part of the greenhouse gases directly augmented by human activities, plays a significant role in the global carbon cycle and radiation budget on Earth. The CO2 concentration has increased from approximately 277 parts per million (ppm) in 1750 to 409.85 ± 0.1 ppm in 2019 due to human activities, according to the report of Global Carbon Budget 2020 [10]. However, CO2 sources and sinks remain poorly understood, especially in dynamic regions with large carbon stocks and strong vulnerability to climate change [11]. Therefore, accurate assessments of CO2 are essential to predict climate change at both regional and global scales.
Space-borne spectrometers have been used to monitor atmospheric CO2, with the advantages of wide coverage and multi-temporal and multispectral capability. At an earlier stage, the accuracy of multi-purpose instruments, such as SCIMACHY, AIRS, and IASI, is limited because of their coarse resolution [12,13,14]. Subsequently, several satellites were designed for atmospheric CO2 measurements in particular. TanSat (Chinese Carbon Dioxide Observation Satellite Mission) was launched in December 2016 and OCO-3 was launched in May 2019 [15,16]. The passive measurement technique has some inherent limitations; for example, it requires sunlight and can be easily affected by clouds and aerosols, resulting in sparse coverage at high latitudes. Moreover, short-wave infrared spectrometers can only work during the day and the thermal spectrometers suffer from low measurement sensitivity in the lower troposphere [17]. In contrast, active space sensors enable observations to be taken at all latitudes and all times of year owing to their own illumination. Additionally, the small footprints allow measurements through gaps in clouds, increasing data availability. However, this also results in a smaller viewing swath width.
Several active CO2 missions have been proposed. In 2008, the European Space Agency (ESA) proposed the Advanced Space Carbon and Climate Observation of Planet Earth (A-SCOPE) program, which is one of the six candidate Earth Explorer missions [18]. The development of lidar systems has been carried out in Germany (DLR) and France (IPSL). German Aerospace Center developed a 1.57 μm integrated path differential absorption lidar applying an OPO laser transmitter [19]. The observations of atmospheric CO2 were performed and were consistent with the in situ measurements [20]. The National Research Council’s 2007 Decadal Survey recommended the Active Sensing of CO2 Emissions over Nights, Days, and Seasons (ASCENDS) mission [21]. Many groups were involved in developing candidate lidar approaches and technologies for ASCENDS [22,23,24,25]. The Jet Propulsion Laboratory developed a 2.05 μm CO2 laser absorption spectrometer (LAS), in collaboration with Lockheed Martin Coherent Technologies. Four airborne campaigns were carried out during 2006-2009, and the result showed that the precision of the tropospheric CO2 column was approximately 4 ppmv [26]. The NASA Langley Research Center (LaRC) designed a double-pulsed 2 μm IPDA lidar system with a Ho:Tm:YLF laser and InGaAs photodiode detectors. The airborne testing was conducted at different flight altitudes and topographic surfaces in 2014, showing an accuracy of 0.28% relative to the in situ measurements [25]. The Goddard Space Flight Center developed a pulsed multi-wavelength IPDA approach for CO2 detection. The 2016 flight campaigns demonstrated precisions of 0.7 ppm over desert surfaces and 1 ppm over snow surfaces [27]. However, neither of them has been launched yet. In 2015, the future plan regarding satellite development was released by the National Development and Reform Commission (NDRC), Ministry of Finance (MOF), and Chinese National Space Administration (CNSA) to have a better understanding of the aerosol, trace gases, and GHG concentrations in the atmosphere. A 1.57 μm airborne double-pulse integrated-path differential absorption (IPDA) light detection and ranging (lidar) system was developed by the Shanghai Institute of Optics and Fine Mechanics, Chinese Academy of Science. Many flight experiments were conducted to verify the reliability of the CO2 measurements. Zhu et al. used the pulse integration method to improve the signal-to-noise ratio in the inversion process, and the results had a good agreement with the in situ measurements [28]. The aircraft measurements were also compared with OCO-2 and the Carbon Tracker CO2 datasets, showing a similar variation [29]. In April 2022, the Aerosol and Carbon Detection Lidar (ACDL) instrument onboard the Atmospheric Environmental Monitoring Satellite (AEMS), also known as DaQi-1(DQ-1), was successfully launched, which will provide more data to quantify the CO2 sources and sinks [30].
Although the active techniques have some significant benefits, the challenges must be addressed to meet the XCO2 measurement requirements of less than 1 ppm. Hence, evaluating and attributing the measurement error is necessary to ensure high-quality XCO2 measurements. A series of studies analyzed the potential sources of measurement errors. The systematic errors arising from frequency stability, bandwidth, and spectral impurity were investigated by Ehret [31]. Kiemle assessed the random uncertainty in the averaged methane column (XCH4) due to instrument noise, reporting a precision of about 1% over vegetation [32]. Zaccheo et al. (2014) evaluated the impact of meteorological uncertainties (temperature, moisture, and pressure) on XCO2 retrievals from laser differential absorption spectroscopy (LAS) measurements. The equivalent error ranged from 0.2 to 0.8 ppm, and an optimum laser wavelength will help to reduce the CO2 measurement error [33]. Han et al studied the influence of atmospheric factors on the performance of a ground-based DIAL system [34]. In addition, the Doppler effect will also pose significant systematic errors. Zhu Yadan investigated the impact of the Doppler effect on CO2 measurement for airborne IPDA lidar [35]. However, the Doppler effect seems to be underestimated, because the Doppler effect was only considered when the signal was received. The measurement error caused by the Doppler shift remains poorly understood. Furthermore, the ACDL, the first space-borne integrated path differential absorption (IPDA) light detection and ranging in China, aboard AEMS was launched this year. Understanding the impact of the Doppler effect on XCO2 measurement will help improve the accuracy of CO2 retrieval.
The main objective of this paper is to evaluate the impact of the Doppler shift in a systematic way. The airborne atmospheric carbon dioxide lidar (ACDL) system was developed and a flight campaign was conducted in Shanhaiguan, China, in March 2019. The assessment of the influence of the Doppler shift on XCO2 measurement was first performed on airborne measurements. A look-up table of absorption cross sections with various frequencies offset from the line center was established. The differences in XCO2 arising from the frequency offset were calculated to evaluate the impact on the XCO2 measurement. The assessment was also conducted on spaceborne measurements to reduce the uncertainty of XCO2 from satellite observations. Unlike airborne measurements, the optical thickness was simulated by a forward model, rather than observations. This paper is organized as follows. An overview of the IPDA instrument and its principle is presented in Section 2. The assessment of the impact of the Doppler shift on airborne measurements and spaceborne measurements is presented in Section 3. Finally, discussions and conclusions are given in Section 4 and Section 5, respectively.

2. Materials and Methods

2.1. Airborne Flight Overview

A 1.57 μm airborne double-pulse IPDA lidar system was developed by the Shanghai Institute of Optics and Fine Mechanics. The airborne IPDA lidar system consists of a laser transmitter, an instrument control, an environmental control, and a lidar transceiver subsystem. The distributed-feedback (DFB) laser diode (LD) is used as a reference laser and is modulated by a fiber-coupled electro-optic modulator (EOM). For the stabilization of the reference laser, a multi-pass cell is used with a compact size of Φ 100 × 80 mm. The double pulses (1572.024 and 1572.085 nm) are switched at 200 pulse separation (30 Hz). The receiver telescope with a diameter of 150 mm collects the backscatter and focuses it onto the InGaAs avalanche photodiode (APD) detector. More details about the ACDL are described in Zhu et al. [28].
The first flight experiment onboard Yunshuji-8 (Yun-8) was conducted during March 2019 over Shanhaiguan, China. Figure 1 shows the experimental site and tracks of the flight on 14 March. The routing resulted in datasets being acquired over a variety of surfaces, including the ocean, residential areas, and mountain areas. Furthermore, several observations with clouds offer the opportunity to investigate its performance over low, broken clouds. Three other instruments (GPS, AIMMS, and UGGA) were also onboard to provide supporting information for CO2 detection. A Global Positioning System (GPS) was installed to record the position, speed, and angles (pitch, roll, and yaw) of the aircraft in real time. The atmospheric temperature, pressure, humidity, and other meteorological parameters were acquired using an Aircraft Integrated Meteorological Measurement System (AIMMS) during the flight. The accuracies of the temperature and relative humidity measurements were 0.3 °C and 2%, and the resolutions were 0.01 °C and 0.05%, respectively. The UGGA provided in situ measurements of CO2 in the dry mole fraction with a high precision of <0.30 ppm. In addition to the takeoffs and landings, several descents and ascents were also conducted during the experiment, and the carbon dioxide profiles were recorded by UGGA. Thus, the weighted column-averaged mixing ratio of carbon dioxide could be calculated from the in situ measurement using the same weighting function. This enabled direct comparisons between in situ measurements and the XCO2 obtained from the IPDA lidar.

2.2. IPDA LIDAR Principle

The IPAD lidar transmits two laser pulses of adjacent wavelengths referring to the online and offline wavelengths, respectively. The online wavelength is located near the peak of the CO2 absorption line, which is sensitive to CO2. On the contrary, the offline wavelength is located at the position of weak CO2 absorption. The receiver telescope collected the backscattered signal from a “hard” target in the nadir viewing. Due to gas absorption along the measurement path, the laser pulse of the online wavelength is strongly attenuated compared with the offline wavelength. The online and offline wavelengths are close enough that the scattering and absorption of atmospheric aerosols and other gaseous molecules are almost identical [22]. Hence, the column-averaged dry-air mixing ratio of carbon dioxide can be inferred from the comparison of the two echo signals.
The observed differential optical depth of CO2 between the online and offline wavelengths can be expressed as [36]
D A O D = R S R d Δ σ ( p ( r ) , T ( r ) ) ρ C O 2 ( r ) n d r y a i r ( r ) d r
where D A O D is the differential optical depth of CO2 and Δ σ ( p ( r ) , T ( r ) ) is the differential absorption cross section, ρ C O 2 ( r ) is the dry air volume mixing ratio of CO2, n d r y a i r ( r ) is the dry air number density, and R S and R d are the elevations of the scattering surface and aircraft, respectively. The D A O D can be calculated directly from the measurements:
D A O D = 1 2 l n P ( λ o n , r ) P 0 ( λ o f f ) P ( λ o f f , r ) P 0 ( λ o n )
where P 0 ( λ o n ) and P 0 ( λ o f f ) represent the power of the monitoring signals of the online and offline pulses, and P ( λ o n , r ) and P ( λ o f f , r ) are the online and offline echo signals, respectively. n d r y a i r ( r ) can be defined as
n d r y a i r ( r ) = n a i r ( r ) 1 1 + ρ H 2 O ( r ) = N A p ( r ) R T ( r ) 1 1 + ρ H 2 O ( r )
where n a i r ( r ) is the air number density, ρ H 2 O ( r ) is the dry air volume mixing ratio of H2O, N A is Avogadro’s number, and R is the gas constant.
According to the hydrostatic equation and the ideal gas law, the equation can be converted into a function of pressure
D A O D = P s P d ρ C O 2 ( p ) σ o n ( p , T ) σ o f f ( p , T ) ( 1 + ρ H 2 O ( p , T ) ) g M d r y a i r N A d p
Then, X C O 2 is given by
X C O 2 = P S P d ρ C O 2 ( p ) W F ( p , T ) d p P s P d W F ( p , T ) d p = D A O D P S P d W F ( p , T ) d p
W F ( p , T ) = σ o n ( p , T ) σ o f f ( p , T ) ( 1 + ρ H 2 O ( p , T ) ) g M d r y a i r N A
where W F ( p , T ) is the weighting function depicting the contribution of different atmospheric layers to X C O 2 .

2.3. Doppler Effect

The Doppler shift refers to the change in frequency owing to the relative movement of the source or receiver of electromagnetic radiation [37]. For electromagnetic waves, the velocity of light is the same with respect to any observer; thus, the special theory of relativity is applied to estimate the change in frequency [38]. When an electromagnetic wave is emitted from a moving transmitter with velocity v and the receiver remains stationary, the Doppler shift due to the moving source can be expressed as
Δ f = v   c o s θ c f
where f is the original frequency and θ denotes the angle between the direction of the wave and the velocity of the transmitter. We can see that the magnitude of the Doppler shift depends on the relative velocity of the source with respect to the receiver and origin frequency of the transmitter. The movement toward the receiver produces a positive frequency shift, while movement away from the receiver produces a negative frequency shift.
For the flight campaign, the IPAD lidar onboard Yunshuji-8 (Yun-8) transmits two laser pulses and collects the echo signal scattered by the ground or cloud. Two successive Doppler effects are involved in the process of wave propagation, as shown in Figure 2. First, the moving source transmits a laser pulse of frequency f to the ground P. The frequency observed by point P can be expressed as
f = ( 1 v 2 / c 2 ) 1 ( v / c ) c o s θ 1 f
Then, the laser pulse of frequency f is re-emitted by ground and collected by the moving receiver as frequency f
f = 1 + ( v / c ) c o s θ 2 ( 1 v 2 / c 2 ) f
where θ 1 and θ 2 are the angles of the velocity of transmitter with respect to the direction of the wave. The distinction between θ 1 and θ 2 can be neglected. Thus, the ratio of the transmitted and received frequency is given by
f f = 1 + ( v / c ) c o s θ 1 1 ( v / c ) c o s θ 1
To the first order in v / c , the Doppler shift in frequency due to relative motion of airplane can be simplified to
Δ f = f f = 2 v   c o s θ 1 c f

3. Results

3.1. CO2 Retrieval Overview

The IPDA lidar measures the backscattered signal from a “hard” target (such as the Earth’s surface or the top of dense clouds). The vertical-path DAOD of CO2 was directly calculated from measurements combined with the geometry of the aircraft according to Equation (2). P ( λ o n , r ) and P ( λ o f f , r ) were determined by a sophisticated search for the maximum value of the on/offline measurements. Note that the raw signal was the combination of the lidar echo and the instrument noise generated by detector dark currents, the shot noise of the laser, and the solar background noise, so the background noise was estimated and removed before DAOD calculation [39,40]. Furthermore, shot averaging of DAOD with 1500 shot pairs was applied to reduce the random error.
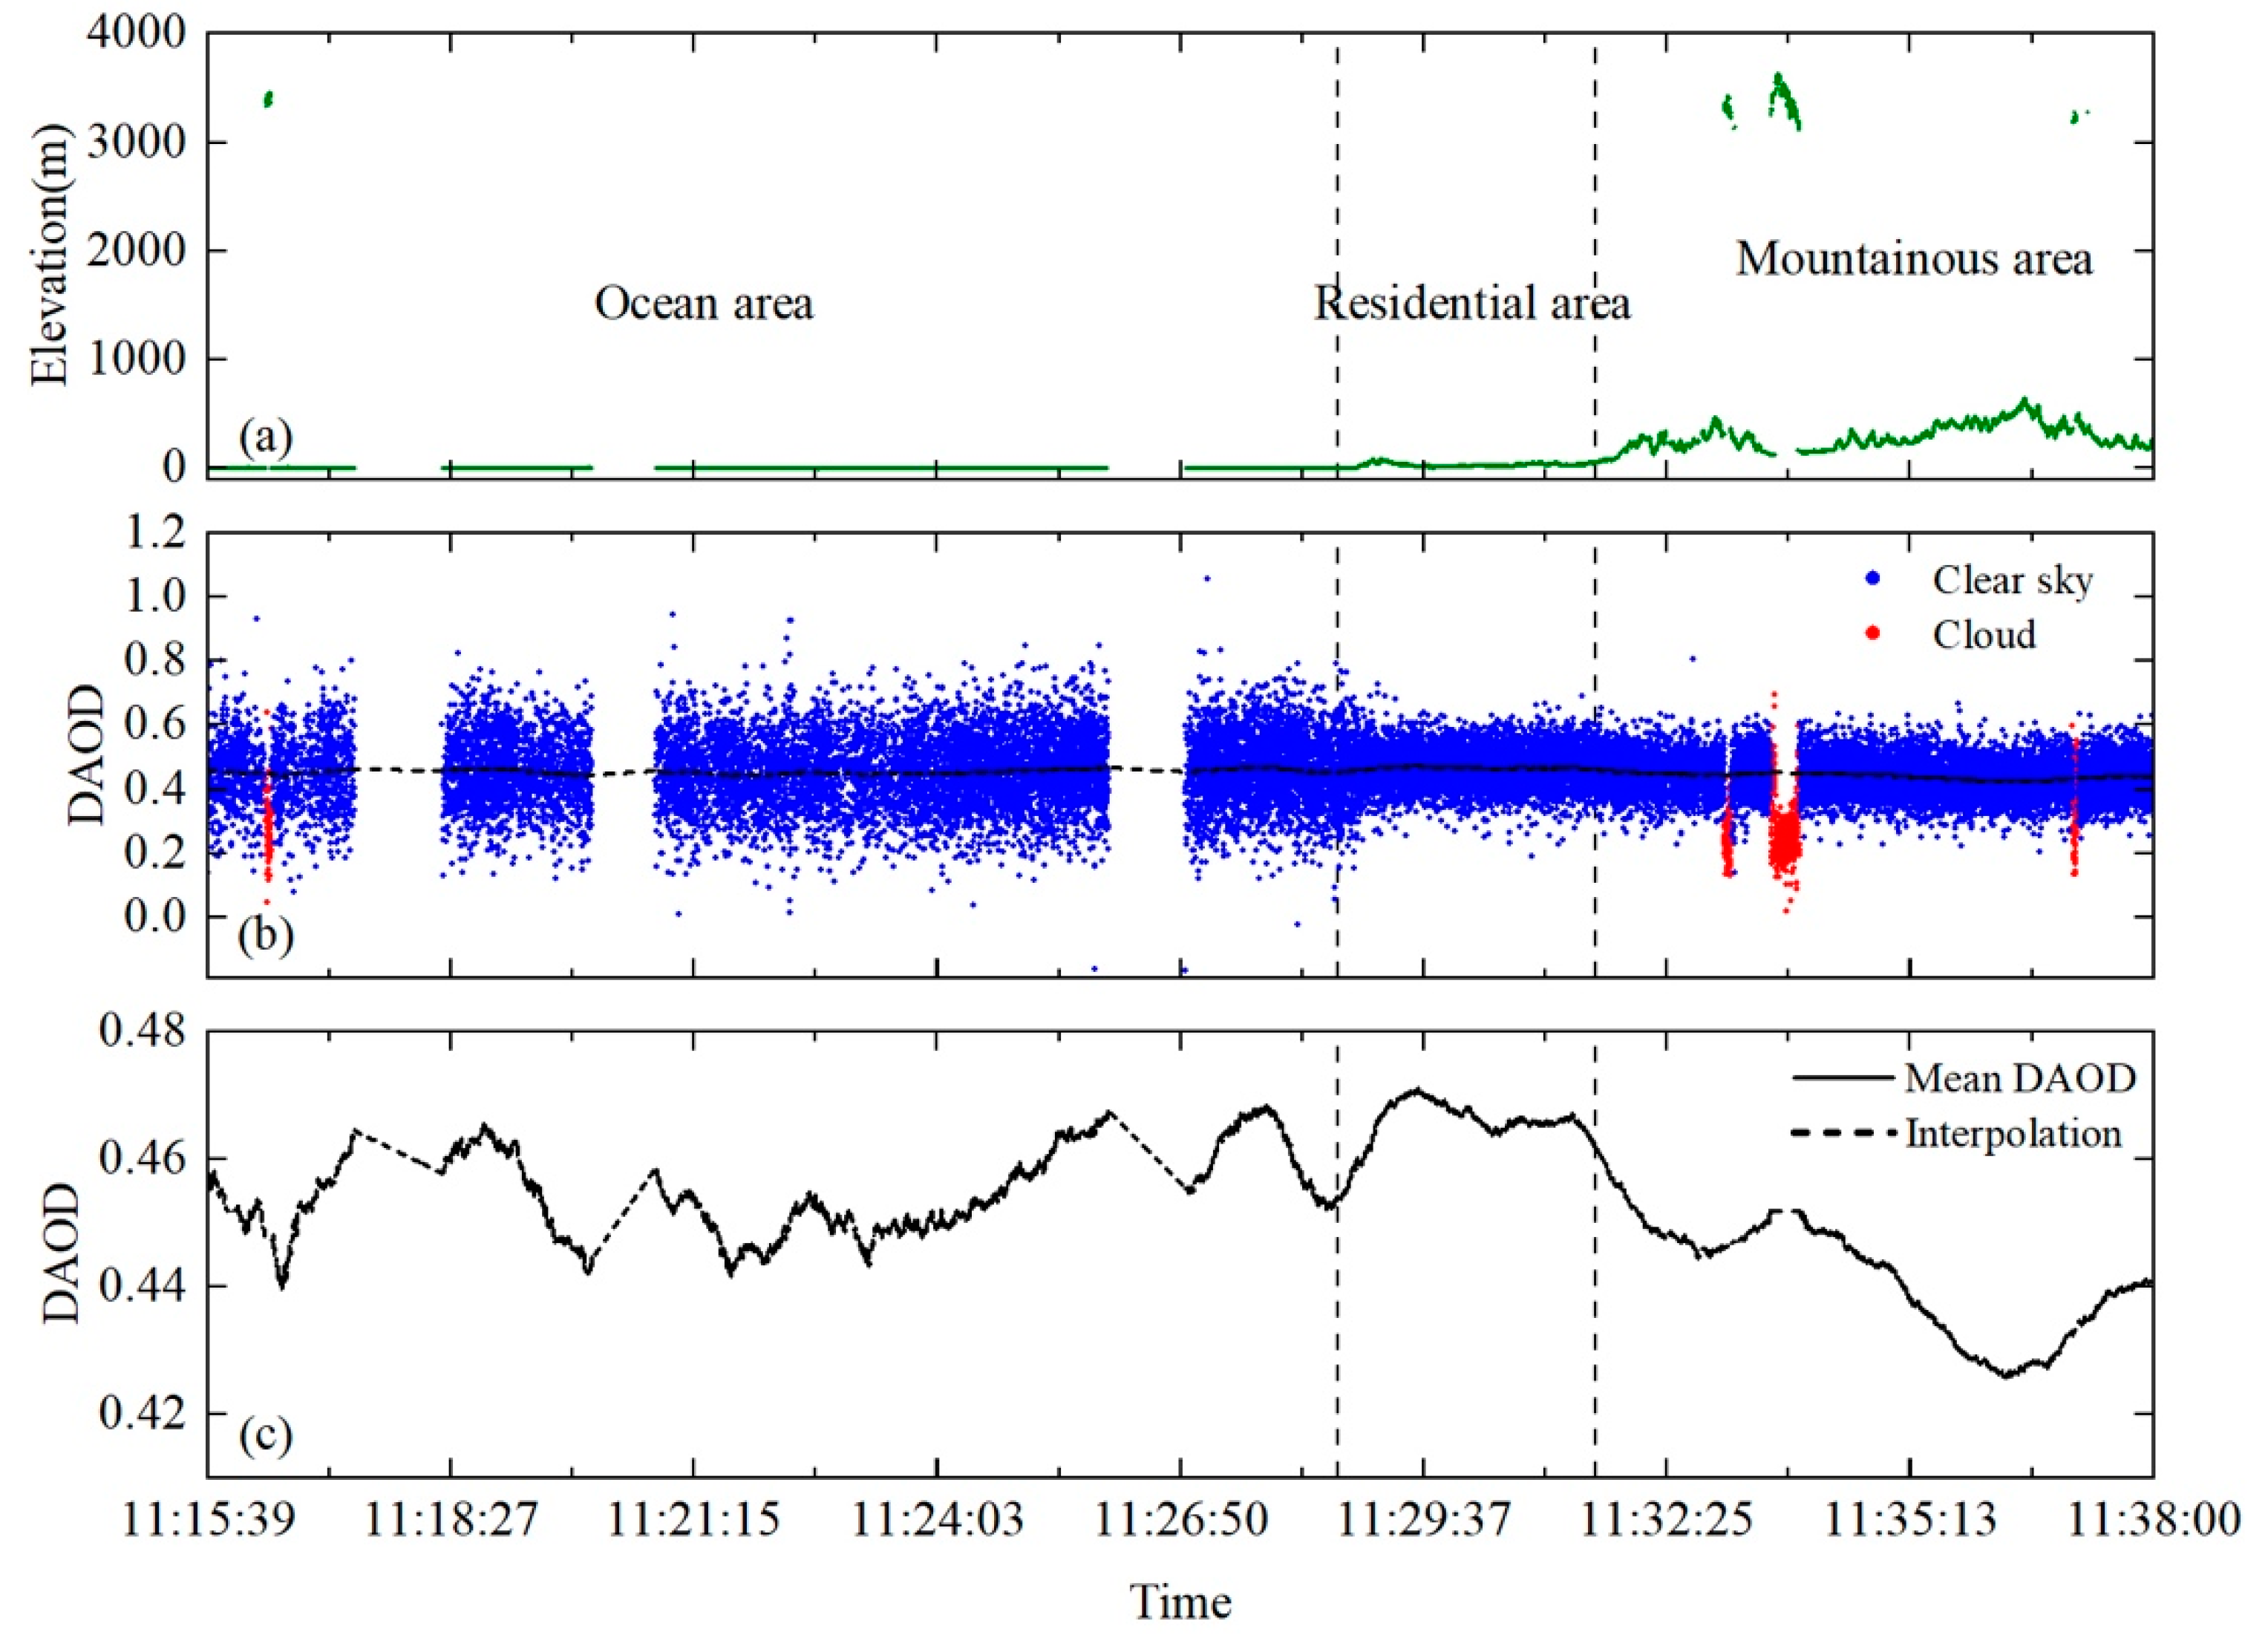
The measurements of CO2 on 14 March 2019 are shown in Figure 3. Figure 3a depicts the surface scattering elevation (SSE) during the flight period. The SSE, derived from the delay of the airborne IPDA echo signals, was less than 1000 m at the ground’s surface and about 3000 m at the clouds’ top surfaces. Figure 3b shows a DAOD result based on a single shot measurement. The blue dots represent the normal measurements and the red dots represent the measurements with optically thick clouds. The standard deviations of DAOD values over the ocean, mountainous, and residential areas were 0.109, 0.065, and 0.059, respectively. The distribution of DAODs over the ocean exhibited dramatic fluctuations compared with those over mountainous and residential areas, indicating a high random error over the ocean. Figure 3c shows the DAOD measurement with a 1500-point moving average. The dashed line represents the result of linear interpolation where the measurements were not available. The mean DAOD values varied with land surface conditions. A lower DAOD was observed over the mountains of about 0.441. This was associated with a shorter observed path resulting from the higher elevation in the mountains. The mean DAOD values in residential areas were slightly larger than those in the ocean by 0.01.
The weighting function describes the sensitivity of the IPAD lidar to atmospheric CO2 at different geometric altitudes. It is determined by the intensity of the absorption line, the online frequency offset from the line’s center, and the dry air density, as shown in Equation (1). The vertical profiles of pressure, temperature, and humidity are required for WF calculation. Here, they were obtained by the AIMMS instrument during the vertical spiral maneuvers. Then, the absorption cross sections at a set of pressures and temperatures were calculated based on the HITRAN 2020 database. Since the calculation of the cross section takes a lot of time, a four-dimensional look-up table of absorption cross sections was created in advance to improve the efficiency of the WF calculation.
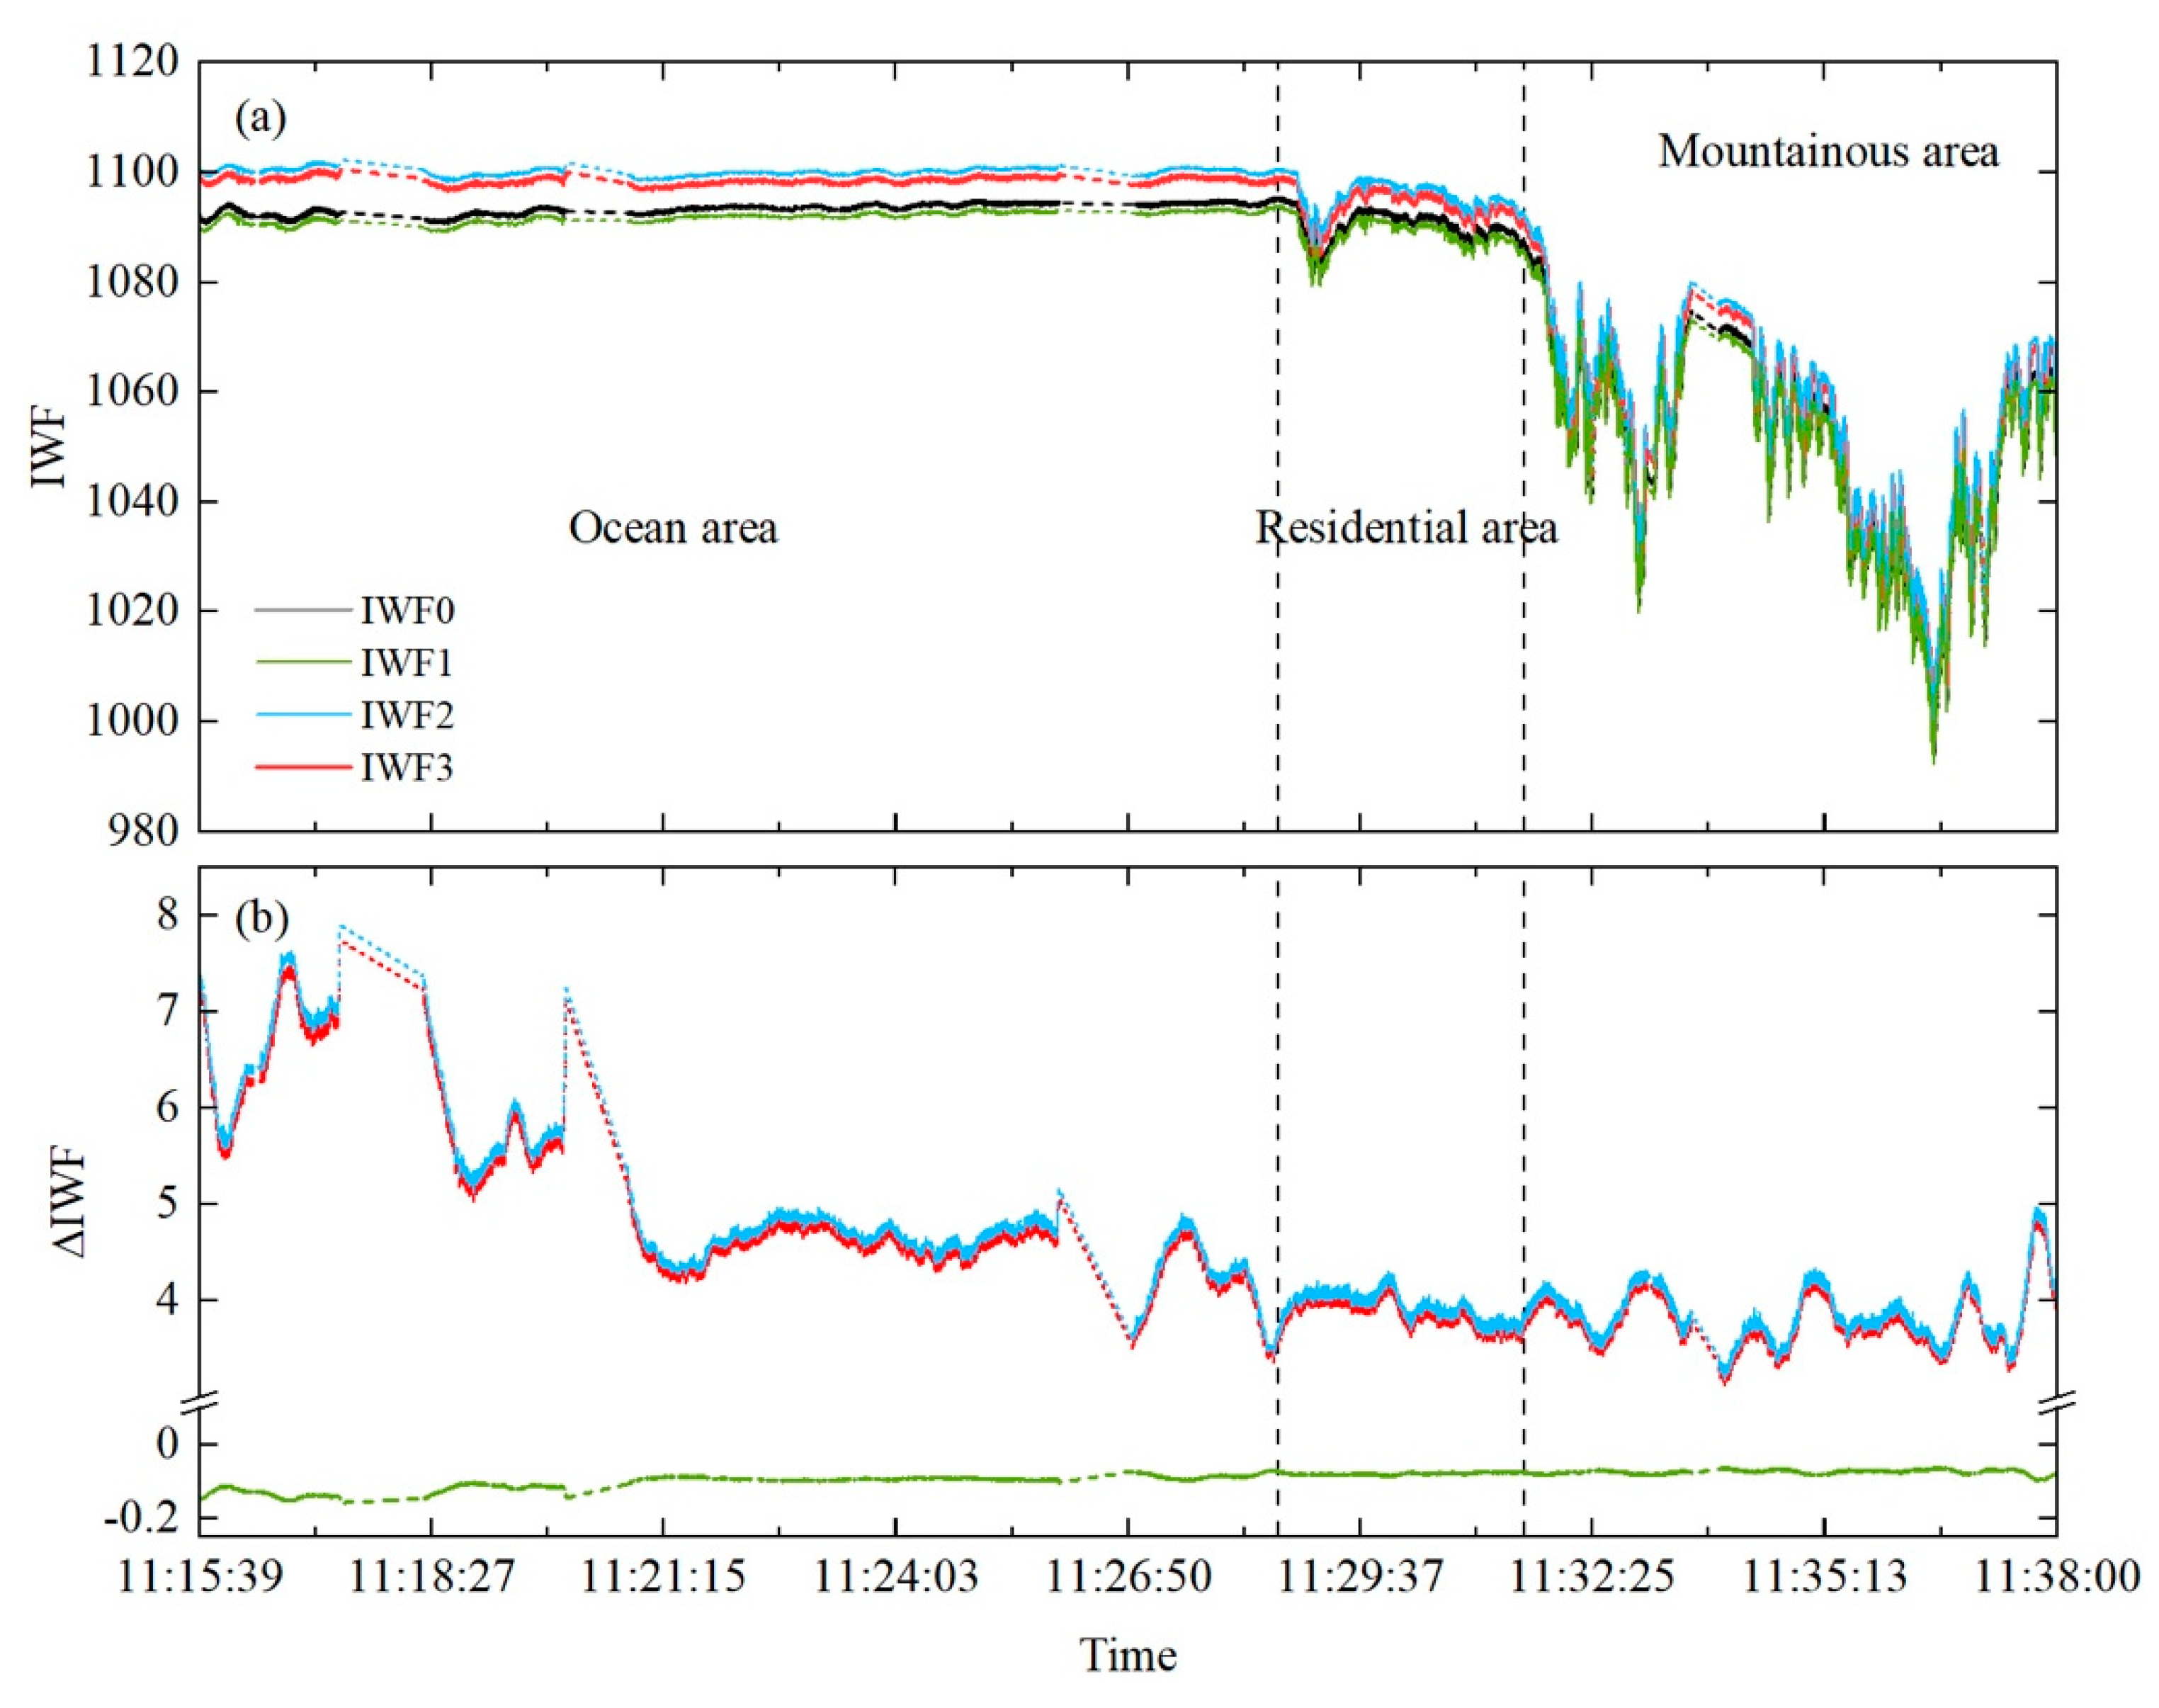
Figure 4 shows the integrated weighting function (IWF) for each measurement. The mean values of the IWF over the ocean, mountainous, and residential areas were 1093.6, 1050.3, and 1090.2, respectively. The IWF values were higher over the ocean owing to the longer optical path, and lower IWF values were found over the mountainous area. In addition, the IWF exhibited a stable trend over the ocean. However, a drastic fluctuation in IWF occurred over mountains. This is because the value of IWF was mainly determined by the flight altitude. The surface was very flat for the ocean, but fluctuated dramatically for mountains.
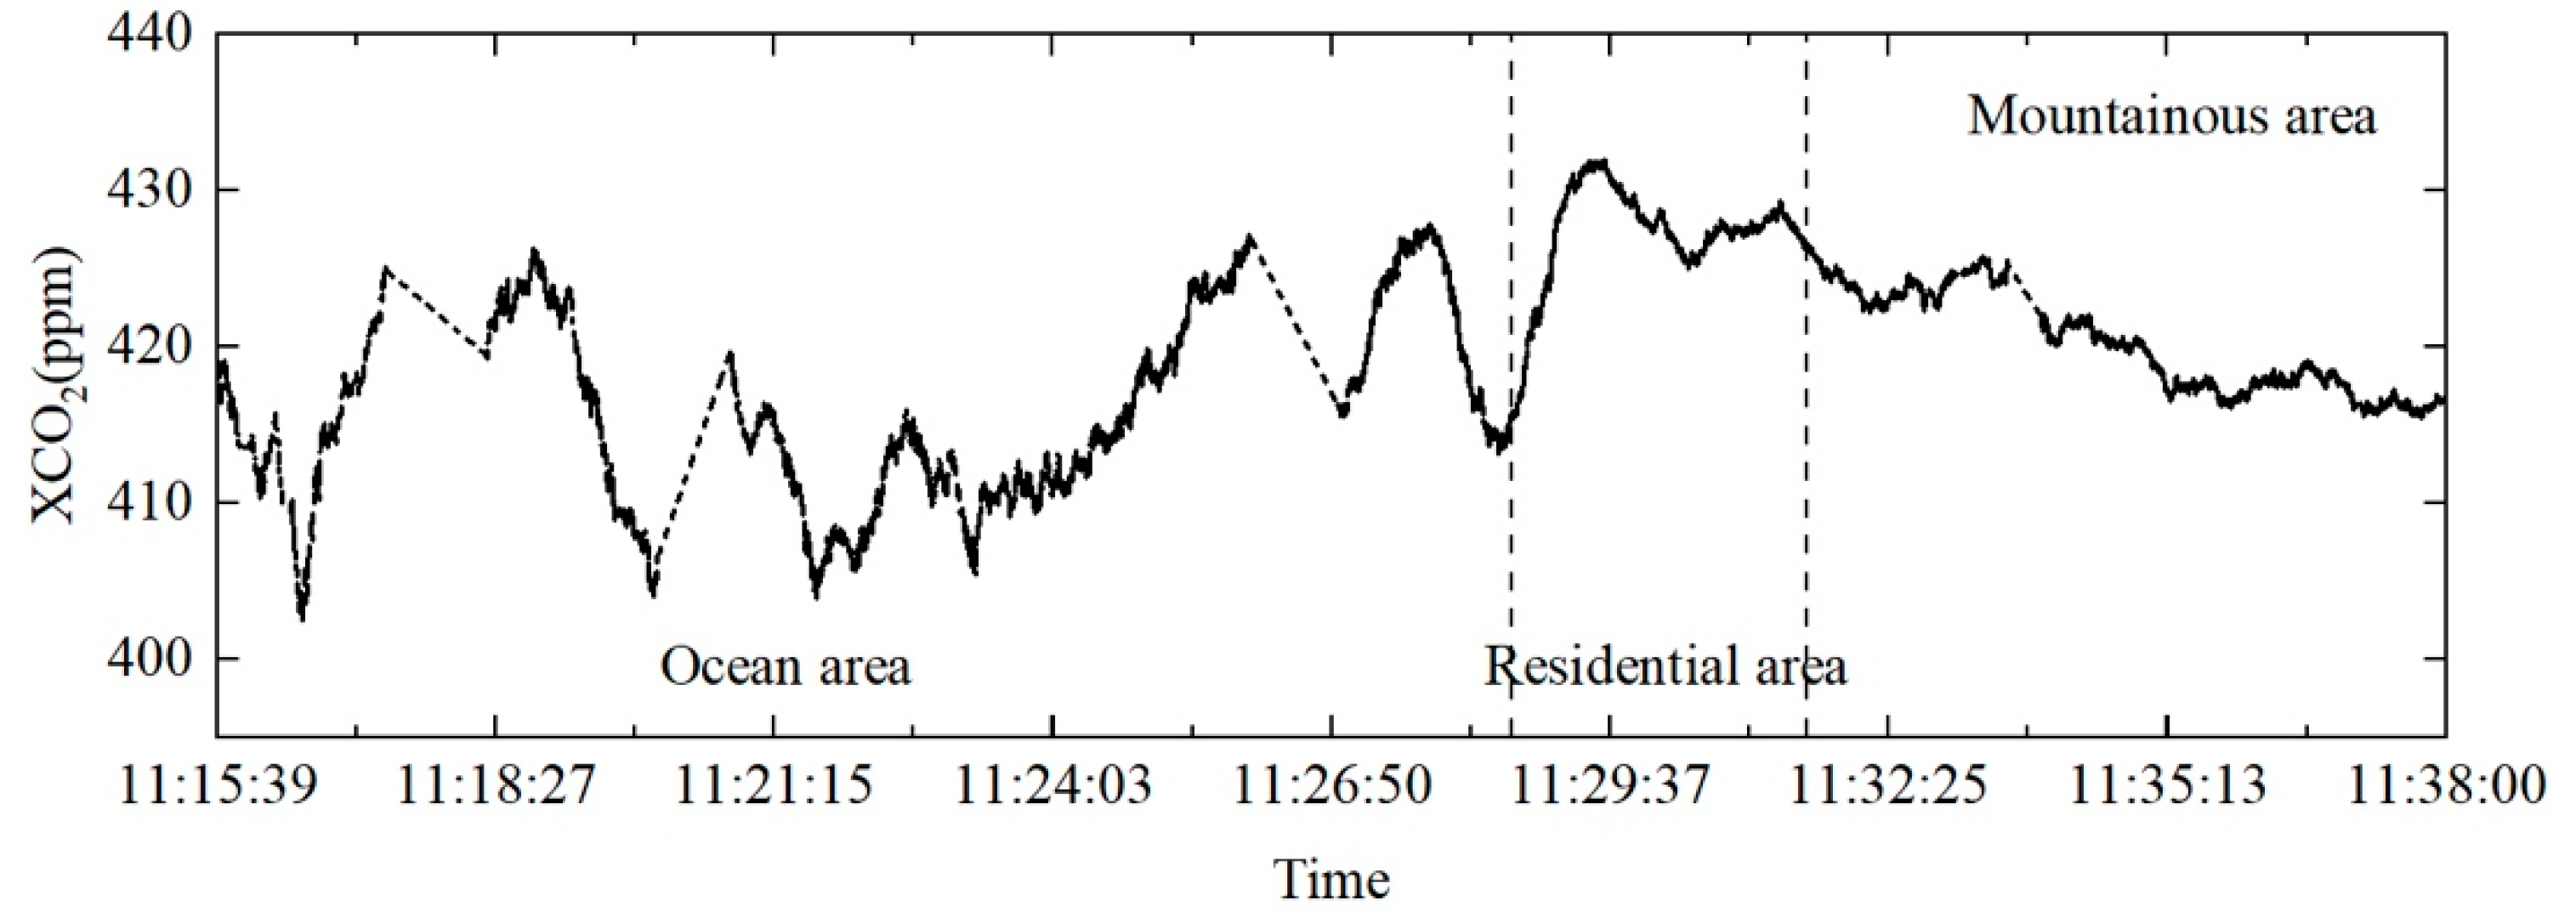
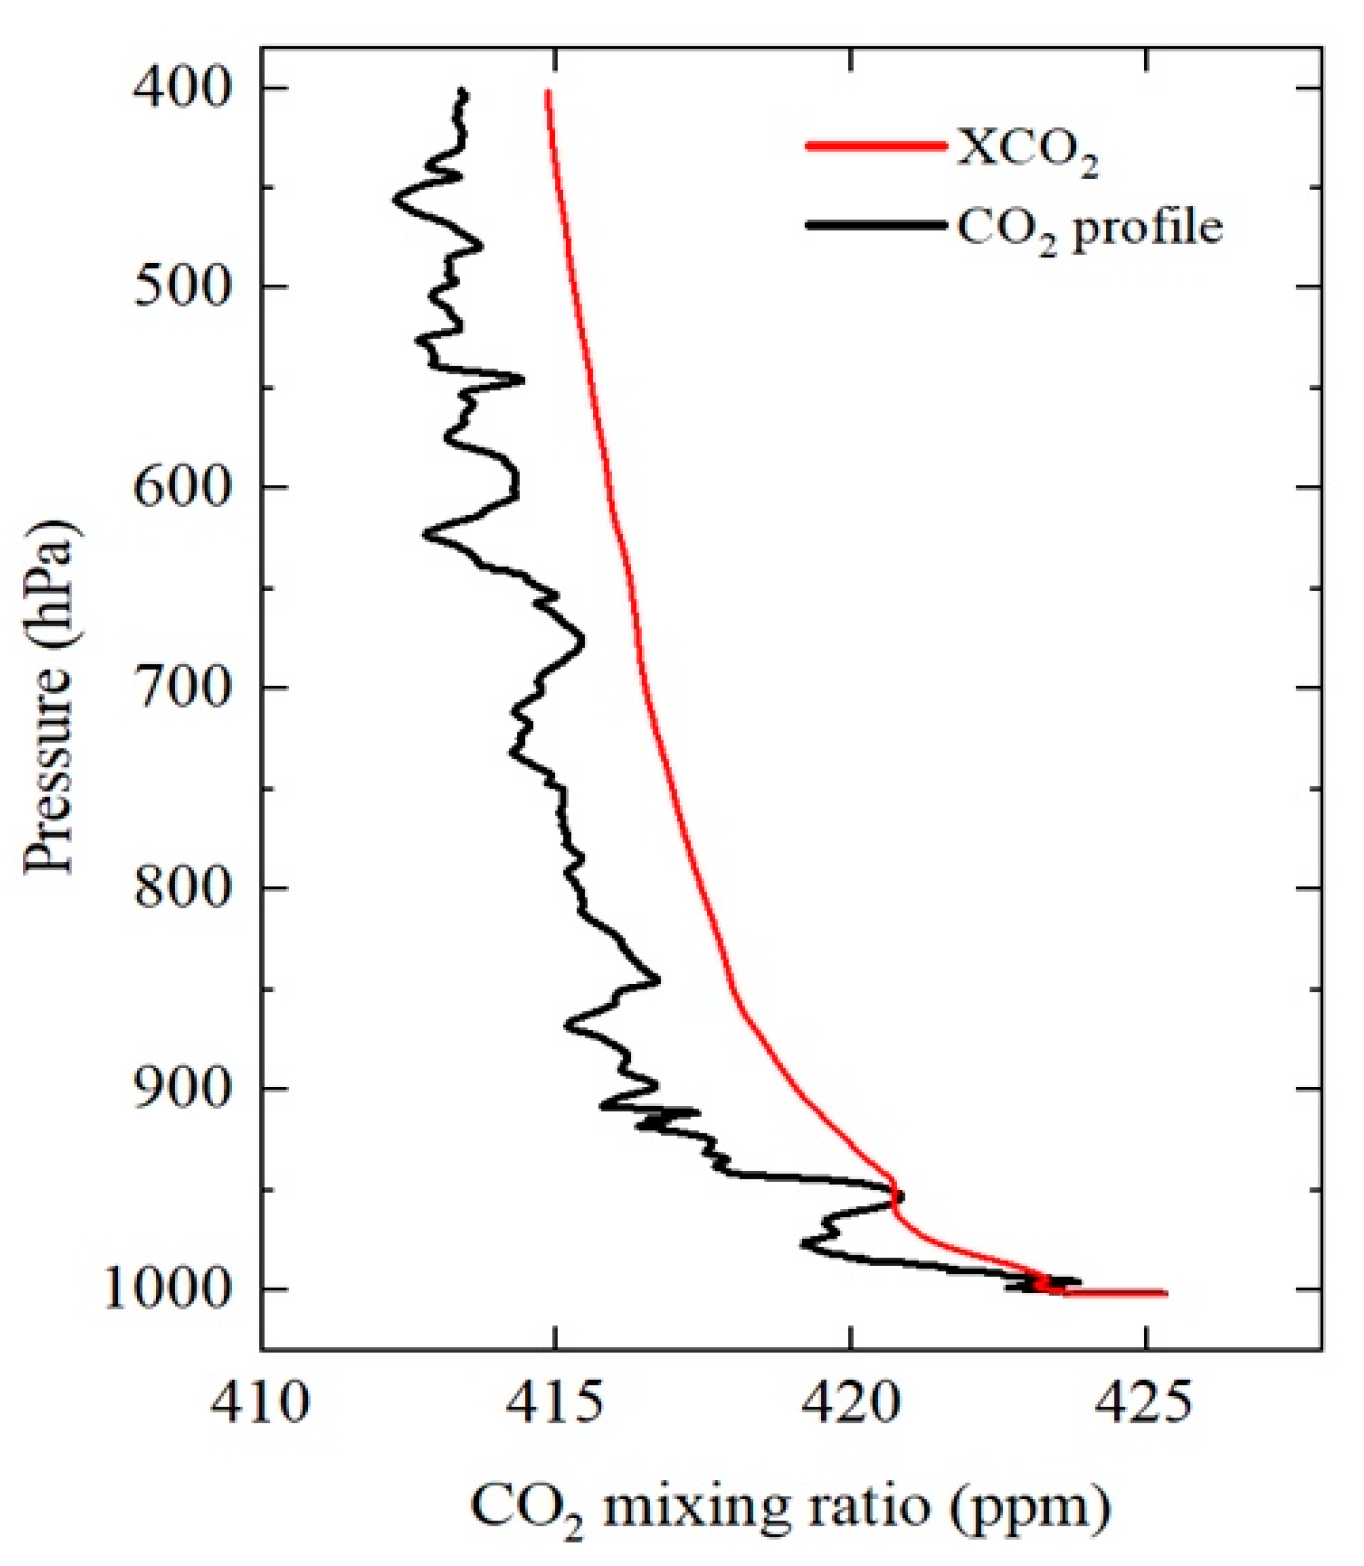
The XCO2 retrievals of IPDA measurements on 14 March 2019 are shown in Figure 5. The XCO2 ranged from approximately 400 to 430 ppm. The mean values of XCO2 over the ocean, residential, and mountainous areas were 416.80, 427.40, and 419.88 ppm, respectively. The XCO2 of residential areas was about 10 ppm higher than that of the ocean due to the large anthropogenic sources of CO2. Moreover, the strong uptake in oceans may also be attributed to the large gradient. The standard deviation of CO2 over the oceans was relatively large, which was related to the low signal-to-noise ratio (SNR) of the observations over the ocean. In contrast, the trend of CO2 columns over mountainous areas was relatively stable, which was due to the high SNR of the observations over mountainous areas. The XCO2 of mountainous areas was about 7.5 ppm lower than that of the residential areas. This may be caused by two aspects. Firstly, plants can take in CO2 by photosynthesis during the day, which will result in a lower CO2 column; secondly, the lower fossil fuel emissions from human activities over mountains will also lead to a lower CO2 column. The IPDA measurements were validated against the in situ measurements to estimate the accuracy of the CO2 retrievals. Figure 6 presents the in situ profiles for CO2. The black line represents the mixing ratio of CO2 and the red line represents the CO2 column. The UGGA instrument records the profiles of the CO2 mixing ratio during the vertical spiral maneuvers. Then, the profiles of CO2 mixing ratios were converted to weighted average column dry air volume mixing ratios by using the same weighting function applied in the retrieval process. The CO2 column measured by the UGGA instrument was about 414.837 ppm during the spiral-down segment. Additionally, the coincident XCO2 retrieved from the IPDA lidar was about 416.149 ppm from 11:28:29 to 11:28:49. The deviations between IPDA and the in situ measurements were about 1.312 ppm.

3.2. Impact of the Doppler Effect on Airborne Measurements

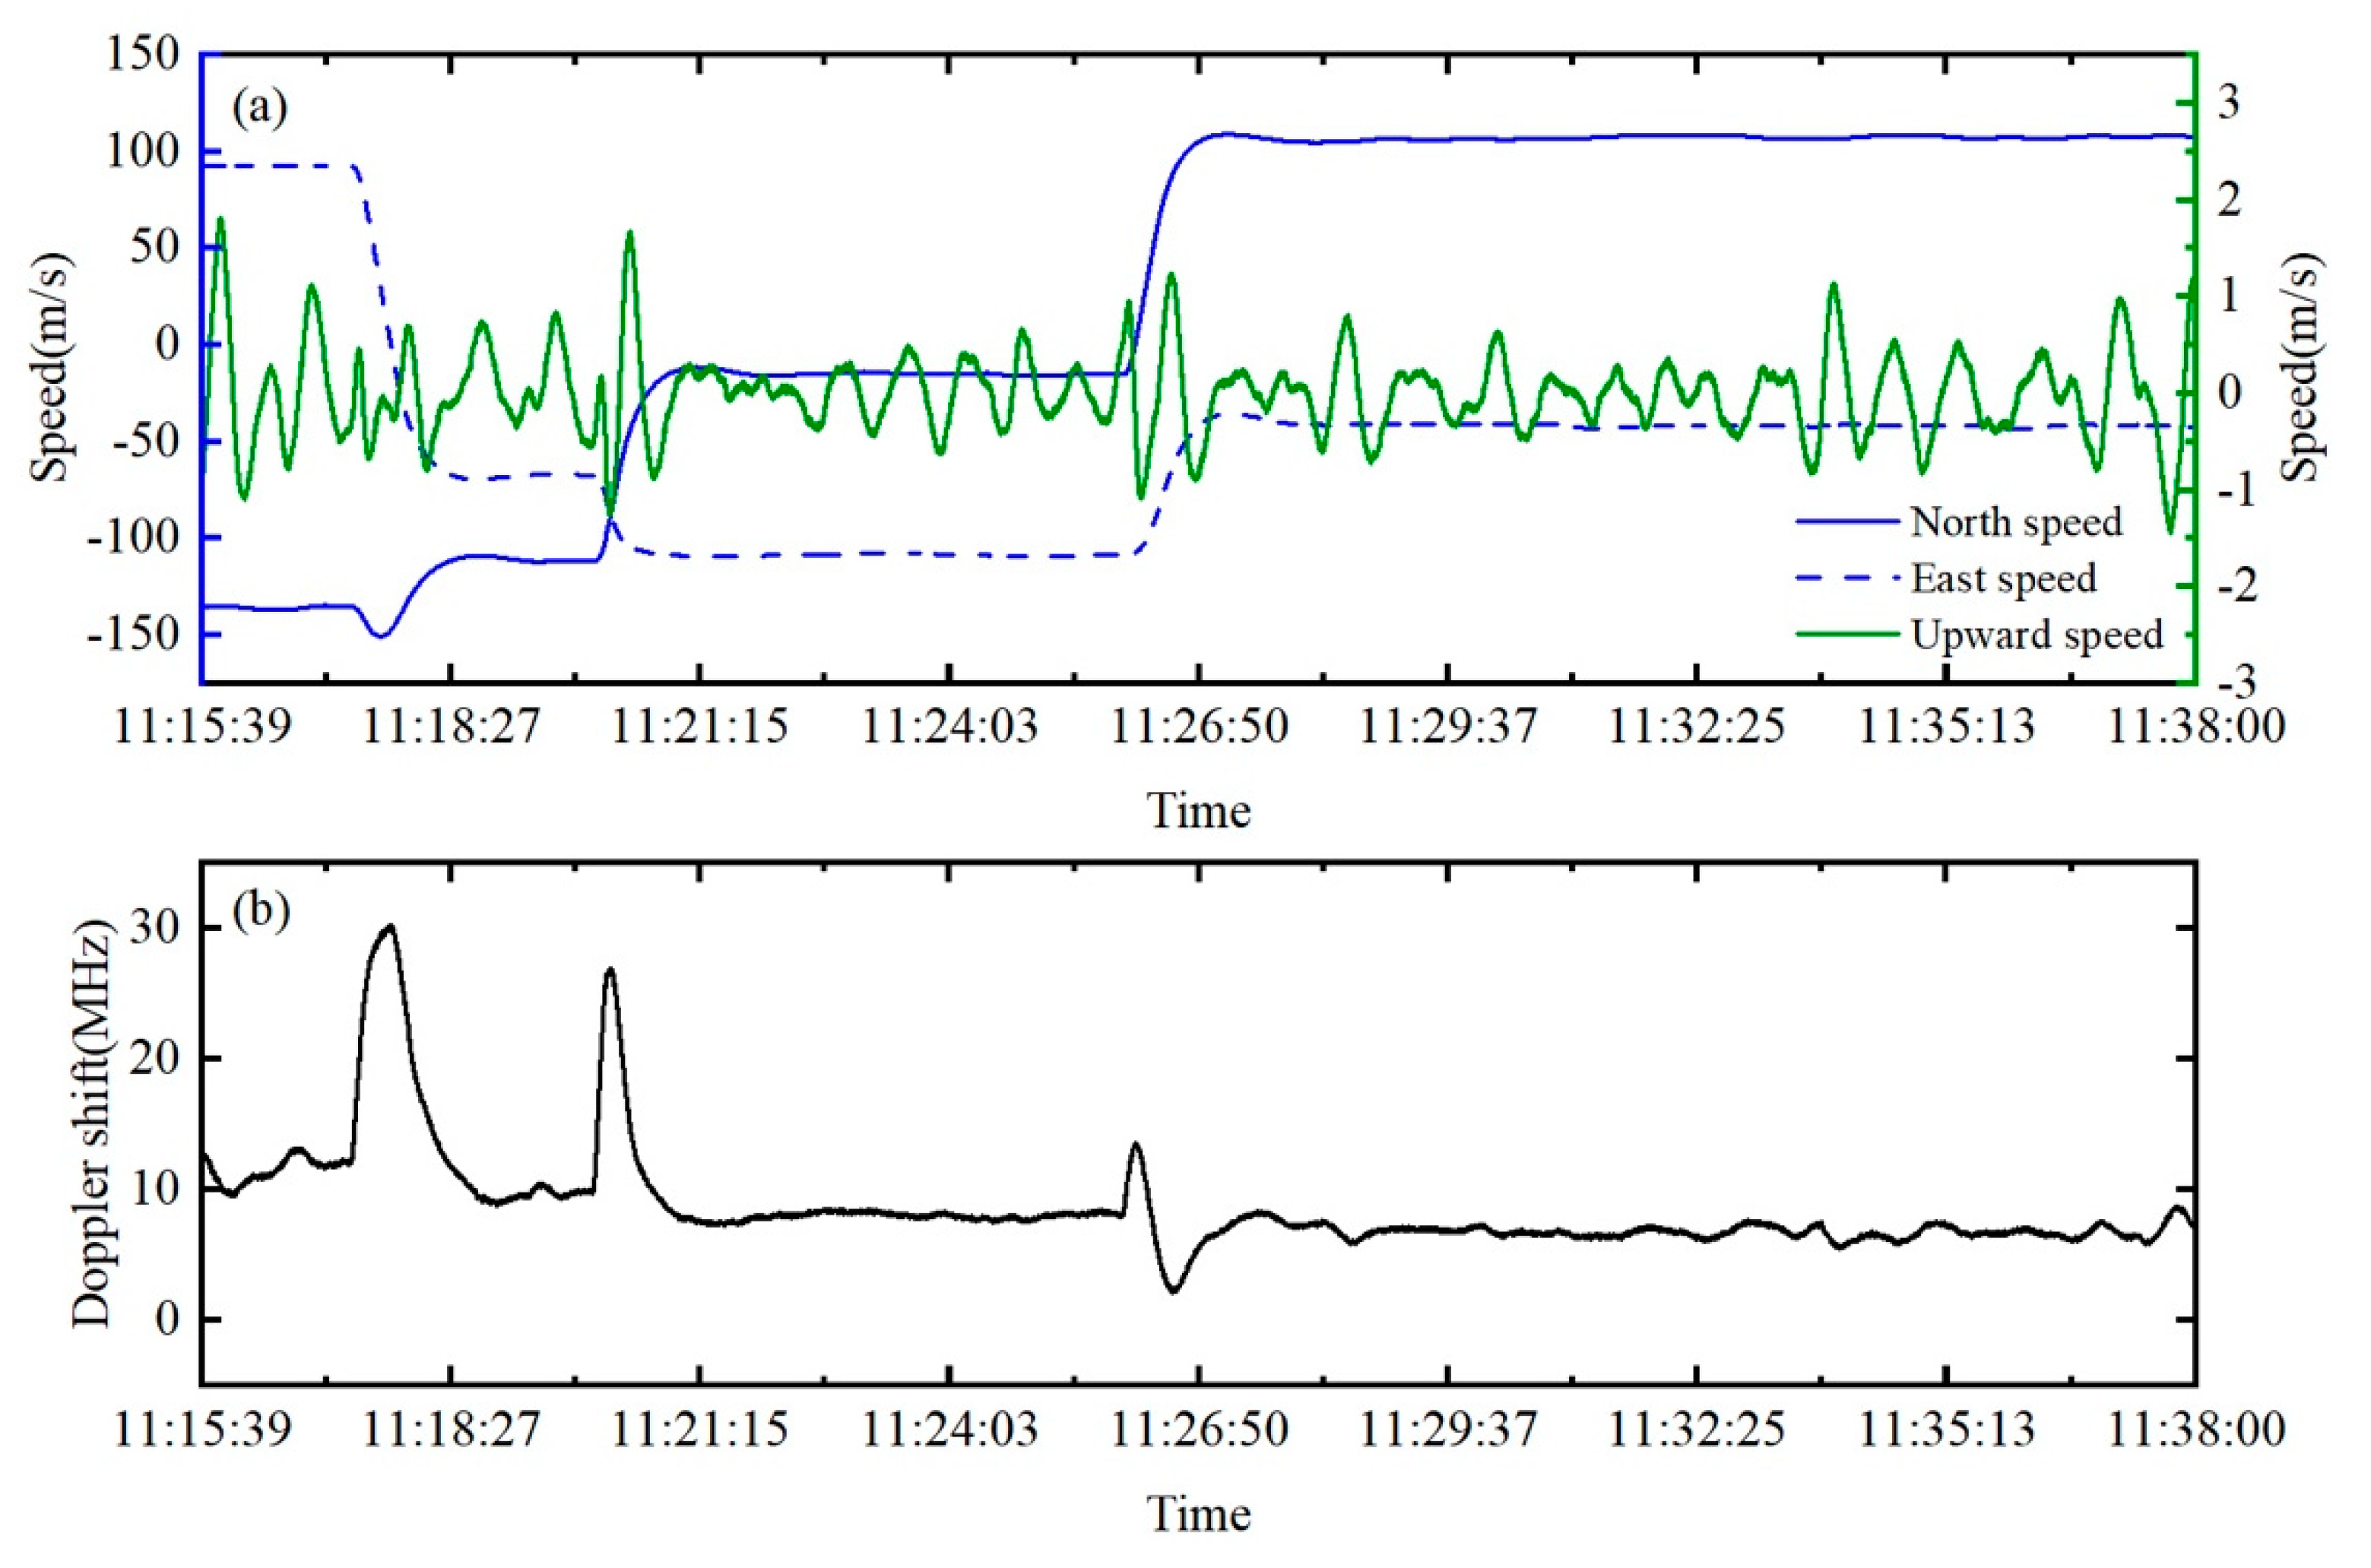
Due to the instability of the aircraft’s attitude, the velocity will generate a component vector in the direction of wave propagation after being resolved. This component vector will lead to a Doppler shift in the frequency. The north, east, and vertical velocities of the aircraft in the flight campaign are presented in Figure 7a. The aircraft initially traveled at high speeds, then stabilized roughly at 115 m/s for an even distribution of the laser footprint. Figure 7b displays the Doppler shift of the laser pulse at online and offline wavelengths due to the moving platform. The Doppler shift was similar at online and offline wavelengths. Most of the Doppler shifts were within the range of 6–8 MHz. However, three peaks could be clearly noticed. These may have been caused by the turn of the aircraft. The attitude angles (roll angle, pitch angle, and yaw angle) are relatively large when the plane turns, which will result in a larger Doppler shift.
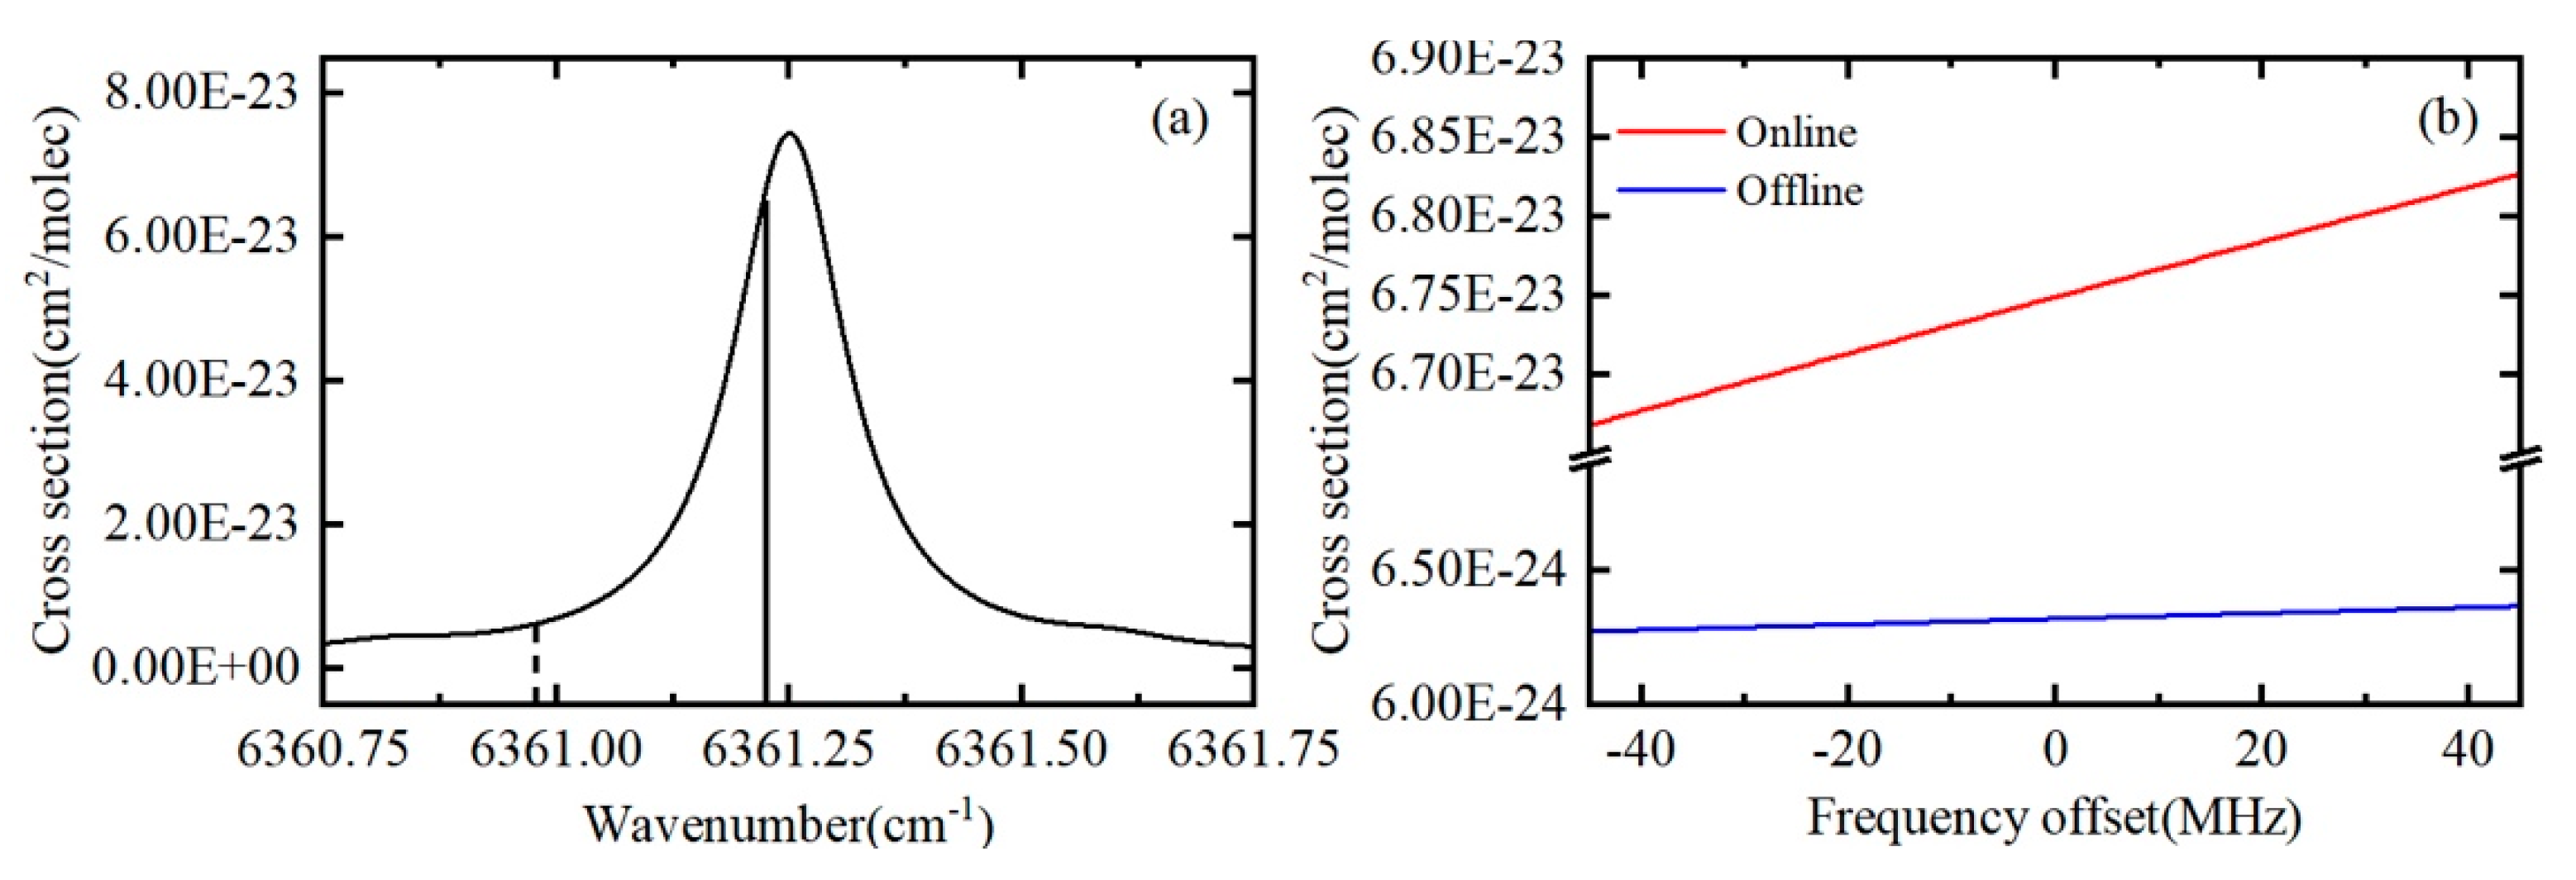
Figure 8a shows the absorption cross section of CO2 at T = 296 K and p = 1013.25 hPa. The solid and dashed vertical lines indicate the online and offline results of the IPDA lidar, respectively. The absorption cross section will first increase and then decrease with the increase in frequency shift. Figure 8b shows the absorption cross sections of CO2 at different frequency offsets from the online and offline results. The absorption cross section was in the range of 6.65 × 10⁻²³–6.84 × 10⁻²³ cm2/molecule around the online wavelength, which was much greater than the absorption cross section of the offline wavelength. Owing to the strong online absorption, the differential optical depth will be larger and enable a higher signal-to-noise ratio during the detections. The derivative of the cross section with respect to frequency was about 1.05 × 10⁻²⁷ cm2/(molecule·MHz) around the offline wavelength, implying a low sensitivity to frequency shifts, while the derivative around the online wavelength was 16 times larger. Thus, a small drift in frequency will result in a dramatic change in the absorption cross section, which further affects the IWF results.
A comparison of the IWF results on 14 March 2019 is presented in Figure 9. Figure 9a shows the original IWF results and the IWF results with the Doppler effect. The impact of the Doppler shift of the offline, online, and the combination of both bands was analyzed. In the following context, the above three IWF results are simply expressed as IWF results1, IWF results2, and IWF results 3. All of the IWF results exhibited similar trends. IWF results2 were significantly larger than the original IWF results. This was because a positive online Doppler shift due to the moving platform led to an increase in the absorption cross section of CO2, which in turn resulted in a larger IWF. The mean values of IWF over the ocean, mountainous, and residential areas were 1098.7, 1054.2, and 1094.1, respectively. It can be seen that IWF results1 were close to the original IWF results, and the mean values of IWF over the ocean, mountainous, and residential areas were 1093.5, 1050.2, and 1090.1, respectively. This indicates that the IWF is insensitive to the offline frequency shift, and this conclusion coincides with the results shown in Figure 8. IWF results3 were similar to IWF results2. The absolute difference between the original and Doppler-shifted results in IWF are presented in Figure 9b. The differences between the original IWF and IWF results2 were in the range of 3.1–7.8. There seemed to be a drift in the IWF differences due to the changes in surface conditions over the flight track. The differences over the ocean were about 1.1 greater than those over mountains and residential areas. The mean difference between the original IWF results and IWF results1 was about 0.1. The mean difference between the original IWF results and IWF results3 was about 4.23. The online Doppler shift can account for 98% of the difference, and that of the offline wavelength can account for 2% of the difference, which indicates the frequency shift of the online wavelength plays a dominant role in the IWF results. The impact of the Doppler shift on the offline wavelength can be neglected to improve efficiency.
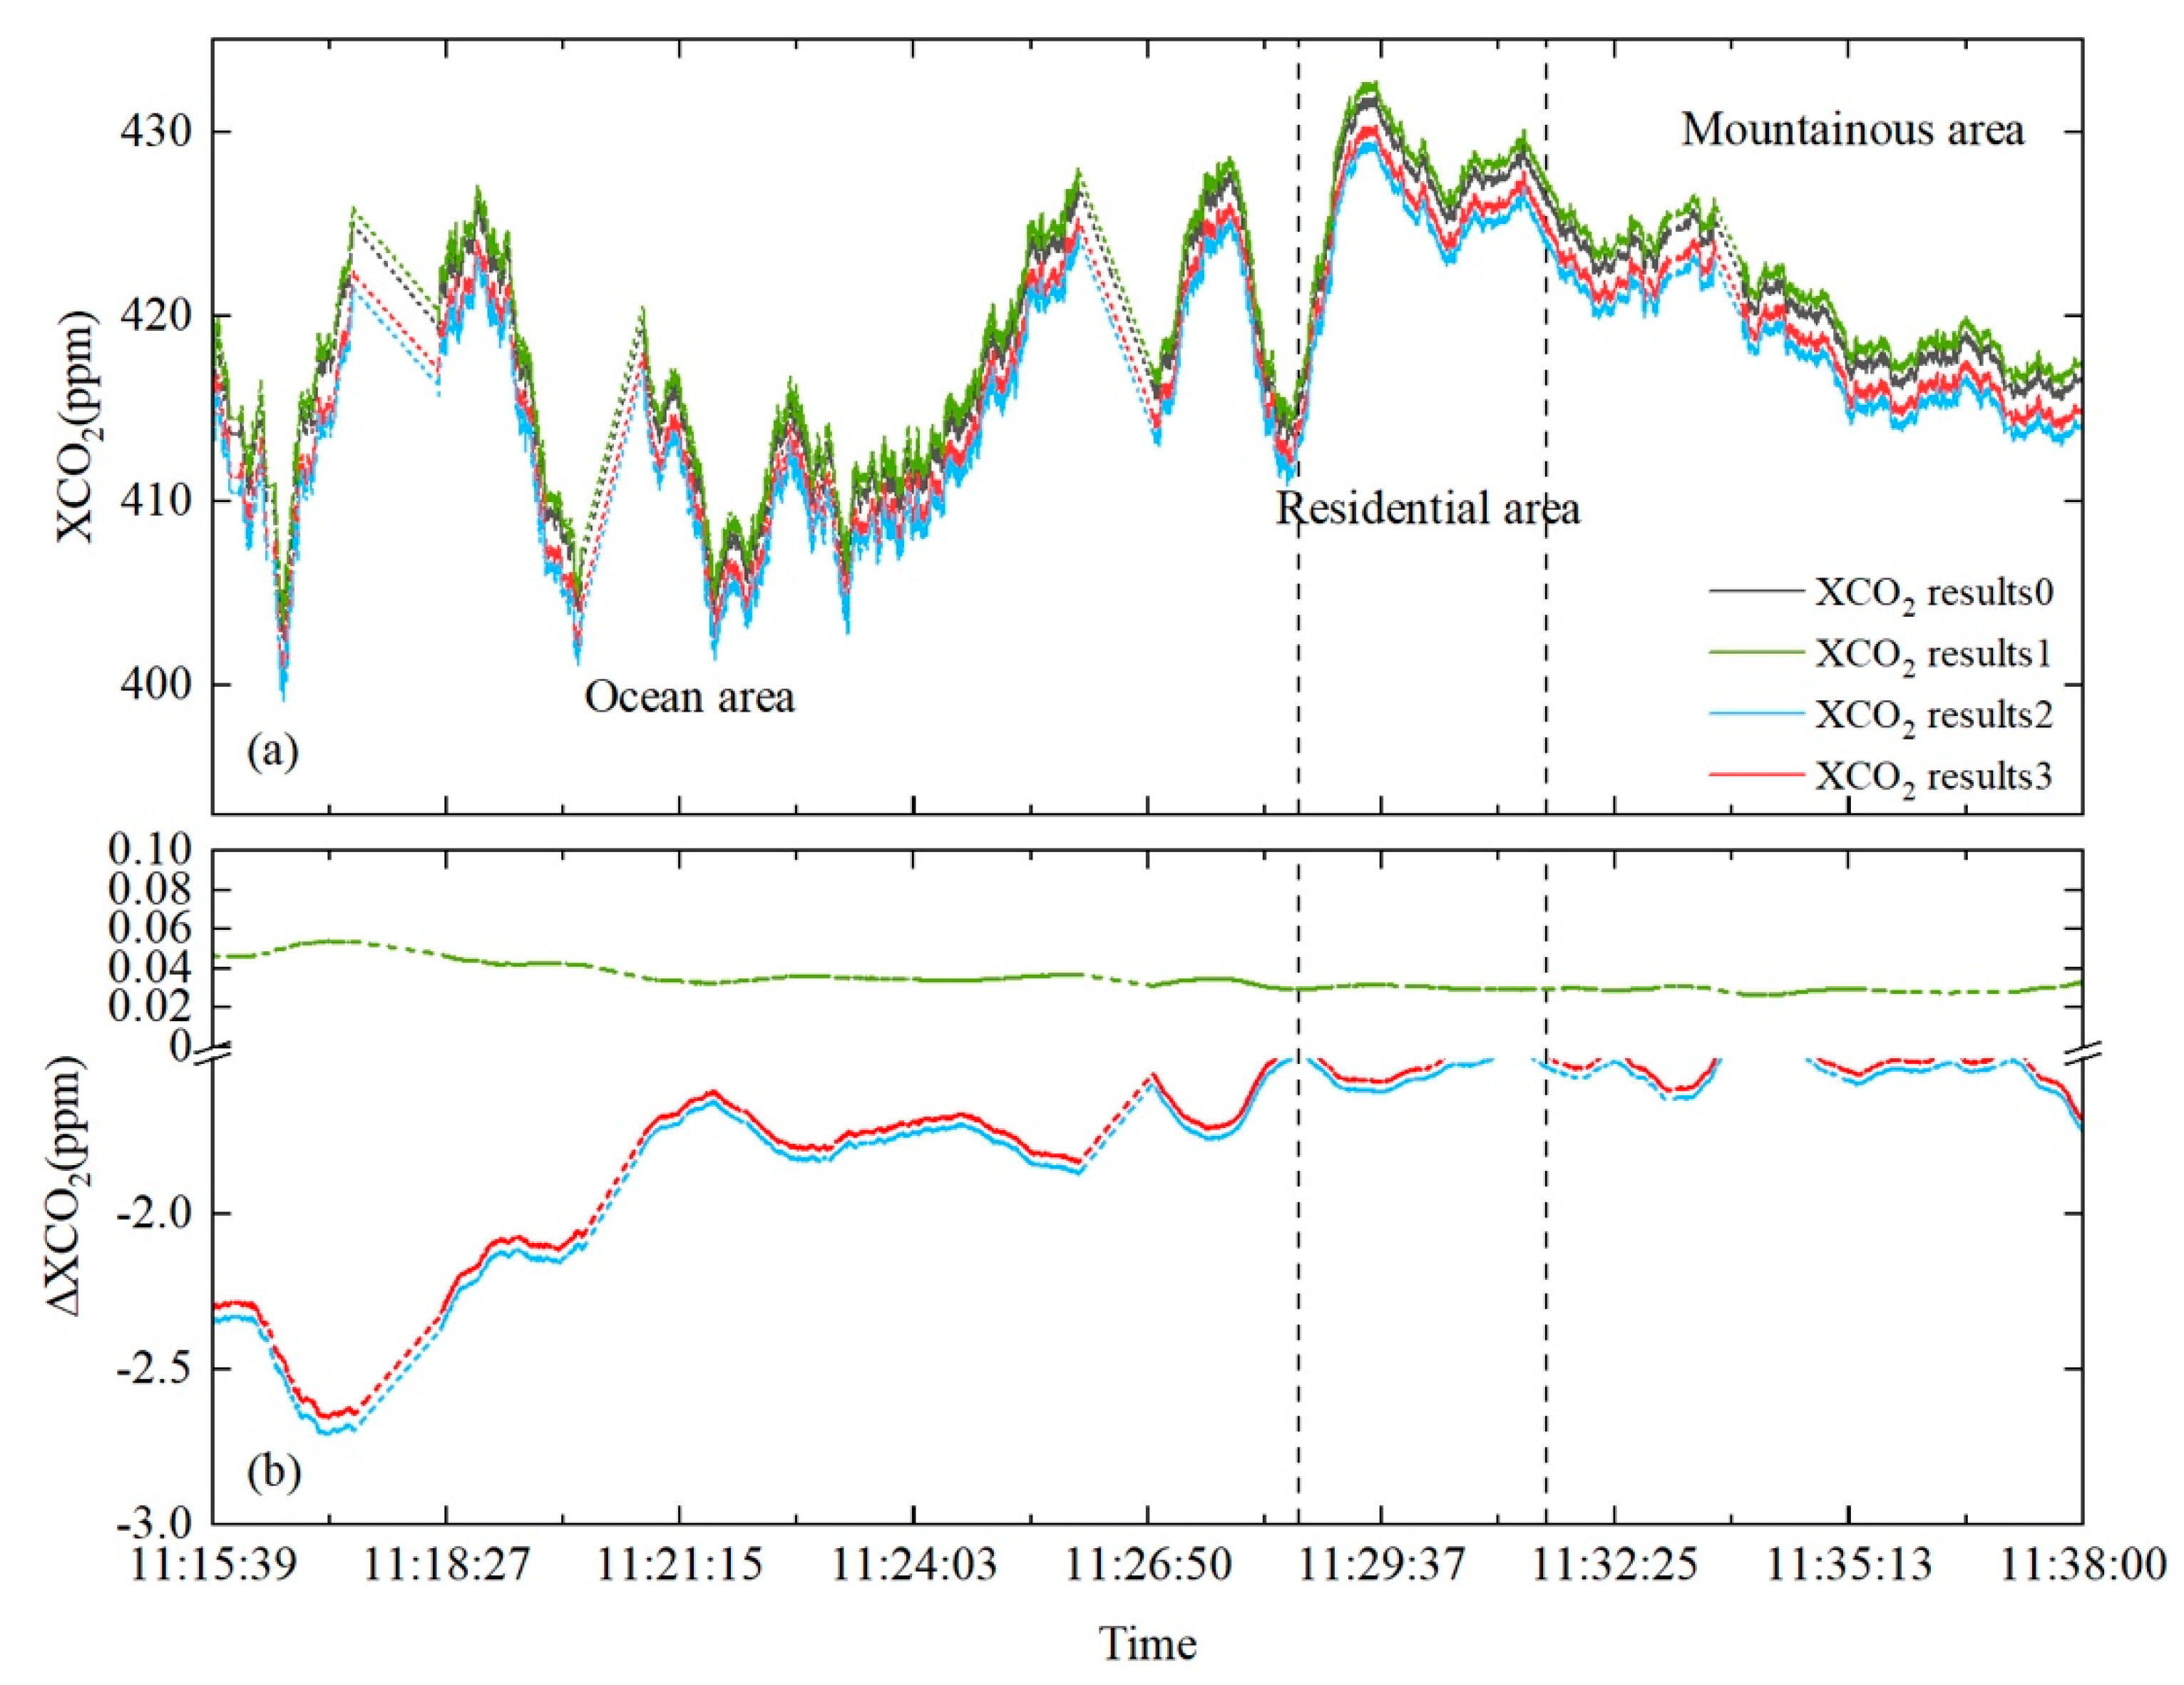
Figure 10 shows the impact of the Doppler effect on XCO2 retrievals. XCO2 results2 were obviously lower than the original XCO2 results due to the larger IWF. The mean values of XCO2 over the ocean, residential, and mountainous areas were 414.92, 425.86, and 418.33 ppm, respectively, while XCO2 results1 were slightly greater than the original XCO2 results. This was related to the positive offline Doppler shifts, which resulted in a lower IWF. We note that, in this case, the impact of the offline Doppler shifts was in the opposite direction of that of the online shifts and there was a small offset between the two Doppler effects. The deviations in the XCO2 results are presented in Figure 10b. The mean deviations in the XCO2 retrievals between XCO2 results3 and the original XCO2 results were about 1.6 ppm. The maximum deviation was found over the oceans of about 2.7 ppm. This was caused by the larger attitude angles of the aircraft, as shown in Figure 7a, which resulted in a large Doppler shift. The deviations over mountainous and residential areas were about 1.5 ppm. The mean CO2 column of XCO2 results3 was about 414.677 ppm from 11:28:29 to 11:28:49. The bias between IPDA and the in situ measurements was reduced to 0.16 ppm (from 1.312 ppm) after considering the Doppler effect. Therefore, the impact of the Doppler effect must be quantified to meet the XCO2 measurement requirements of less than 1 ppm.

3.3. Impact of the Doppler Effect on Spaceborne Measurements

In this study, we also evaluated the impact of the Doppler shift on spaceborne measurements for IPDA lidar. The Aerosol and Carbon Detection Lidar (ACDL) instrument onboard the AEMS was successfully launched on 16 April 2022. The main objective of ACDL is to quantify the global spatial distribution of atmospheric CO2 with high accuracy to provide a scientific basis for future projections of CO2 sources and sinks. AEMS is a sun-synchronous satellite orbiting at an altitude of 705 km with an inclination of 98.203°. It has a mass of 2850 kg and a design life of 8 years. The equator-crossing time is about 13:30 p.m. local solar time, with a 16-day repeat cycle. The ACDL is the first space-borne integrated path differential absorption (IPDA) light-detection and ranging instrument. Several tunable fiber laser transmitters are applied for the simultaneous measurement of the absorption from a CO2 line in the 1575 nm band, the surface height and aerosol backscatter in the 1064 nm band, and the polarization of clouds and aerosols in the 532 nm band. ACDL operates in the nadir mode with an opening angle of 0.1 mrad. It can accomplish 20 measurements within one second. The laser transmitter energy at 1.57 µm is about 75 mJ. The laser echoes reflected by the hard target are collected by the receiver telescope with a diameter of 1000 mm and then recorded by the photon-counting detector. The CO2 columns can be estimated via the differential optical depth between online and offline, as described in Section 2.2.
According to the principle of the Doppler shift introduced in Section 2.3, the rapidly moving satellite (v ∼= 7000 m/s) will lead to a Doppler shift when the line-of-sight points off-nadir by an angle θ in the along-track direction. Here, simulations of space-borne measurement were conducted to assess the impact of the Doppler effect on CO2 measurement.
The optical depths for the CO2 band were calculated using the Line-By-Line Radiative Transfer Model and the High-Resolution Transmission Molecular Absorption (HITRAN) database 2020 version. A Voigt line shape function was assumed for each absorption line to account for collision and Doppler broadening effects during the simulation. In addition, the atmospheric state (vertical profiles of temperature, moisture, and pressure) from the ERA5 reanalysis database was also required as the input of the model. The CO2 profiles were acquired from the Total Carbon Column Observing Network (TCCON) GGG2020 data. We assumed an observation altitude of 40 km due to the limitations of the NWP data. The CO2 profiles were interpolated to the sample locations along with temperature and water vapor from the assimilation data. Although the simulation covered only a portion of the path relevant to the geometry of the satellite observations, it could represent the portion of the atmosphere that has an important role in measurement techniques. The echo signal may be reflected by the cloud tops in some cases, but it is not discussed here.
In this paper, simulations were conducted over China. The pointing misalignment in the direction of the platform velocity was assumed to be 0.067 mrad. The atmospheric state vector pairs were used to simulate the optical depths observed by the instrument. The difference between the XCO2 retrievals with and without the Doppler shift was used to assess the influence of the Doppler effect. Figure 11a depicts the distribution of the CO2 columns at midday on 10 April 2021. The total columns of CO2 over China ranged from approximately 413.4 to 419.7 ppm. About 80% of the XCO2 exceeded 417 ppm due to the large anthropogenic sources of CO2 in the winter and the low rate of photosynthesis in April. The spatial distribution of XCO2 varied significantly with a large east–west gradient. Higher total columns are observed in the eastern part of China, especially in Beijing–Tianjin–Hebei (BTH) region, which were closely linked to the fossil fuel emissions from human activities. XCO2 enhancements were also observed in northwestern China. They may be associated with the sparse distribution of vegetation. Lower XCO2 was distributed in the Qinghai–Tibet Plateau. The CO2 emissions were relatively low due to there being less human activity on the Plateau. The uptake in rivers and lakes could also be attributed to the lower CO2 columns. XCO2 reduction was also found in Yunnan Province with dense vegetation due to the strong uptake of photosynthesis of plants.
Figure 11b presents the DAOD simulations of IPDA lidar over China. The DAOD values were in the range of 0.45 to 0.83, with a mean value of 0.70. The spatial distribution of DAOD was similar to that of the CO2 columns in some aspects; for example, both values were larger in eastern China than in western China. However, there were also some differences. The spatial distribution of DAOD in China showed a close relationship with terrain properties. DAOD distribution was divided into three parts according to the ladder topography. The lowest DAOD was found on the Qinghai–Tibet Plateau due to the shorter laser path. The DAOD in the plateaus and basins area was 0.2 larger than that on the Qinghai–Tibet Plateau. The broad plains exhibited a higher DAOD of about 0.8. This was because the DAOD values were determined not only by the CO2 concentration, but also by the laser path.
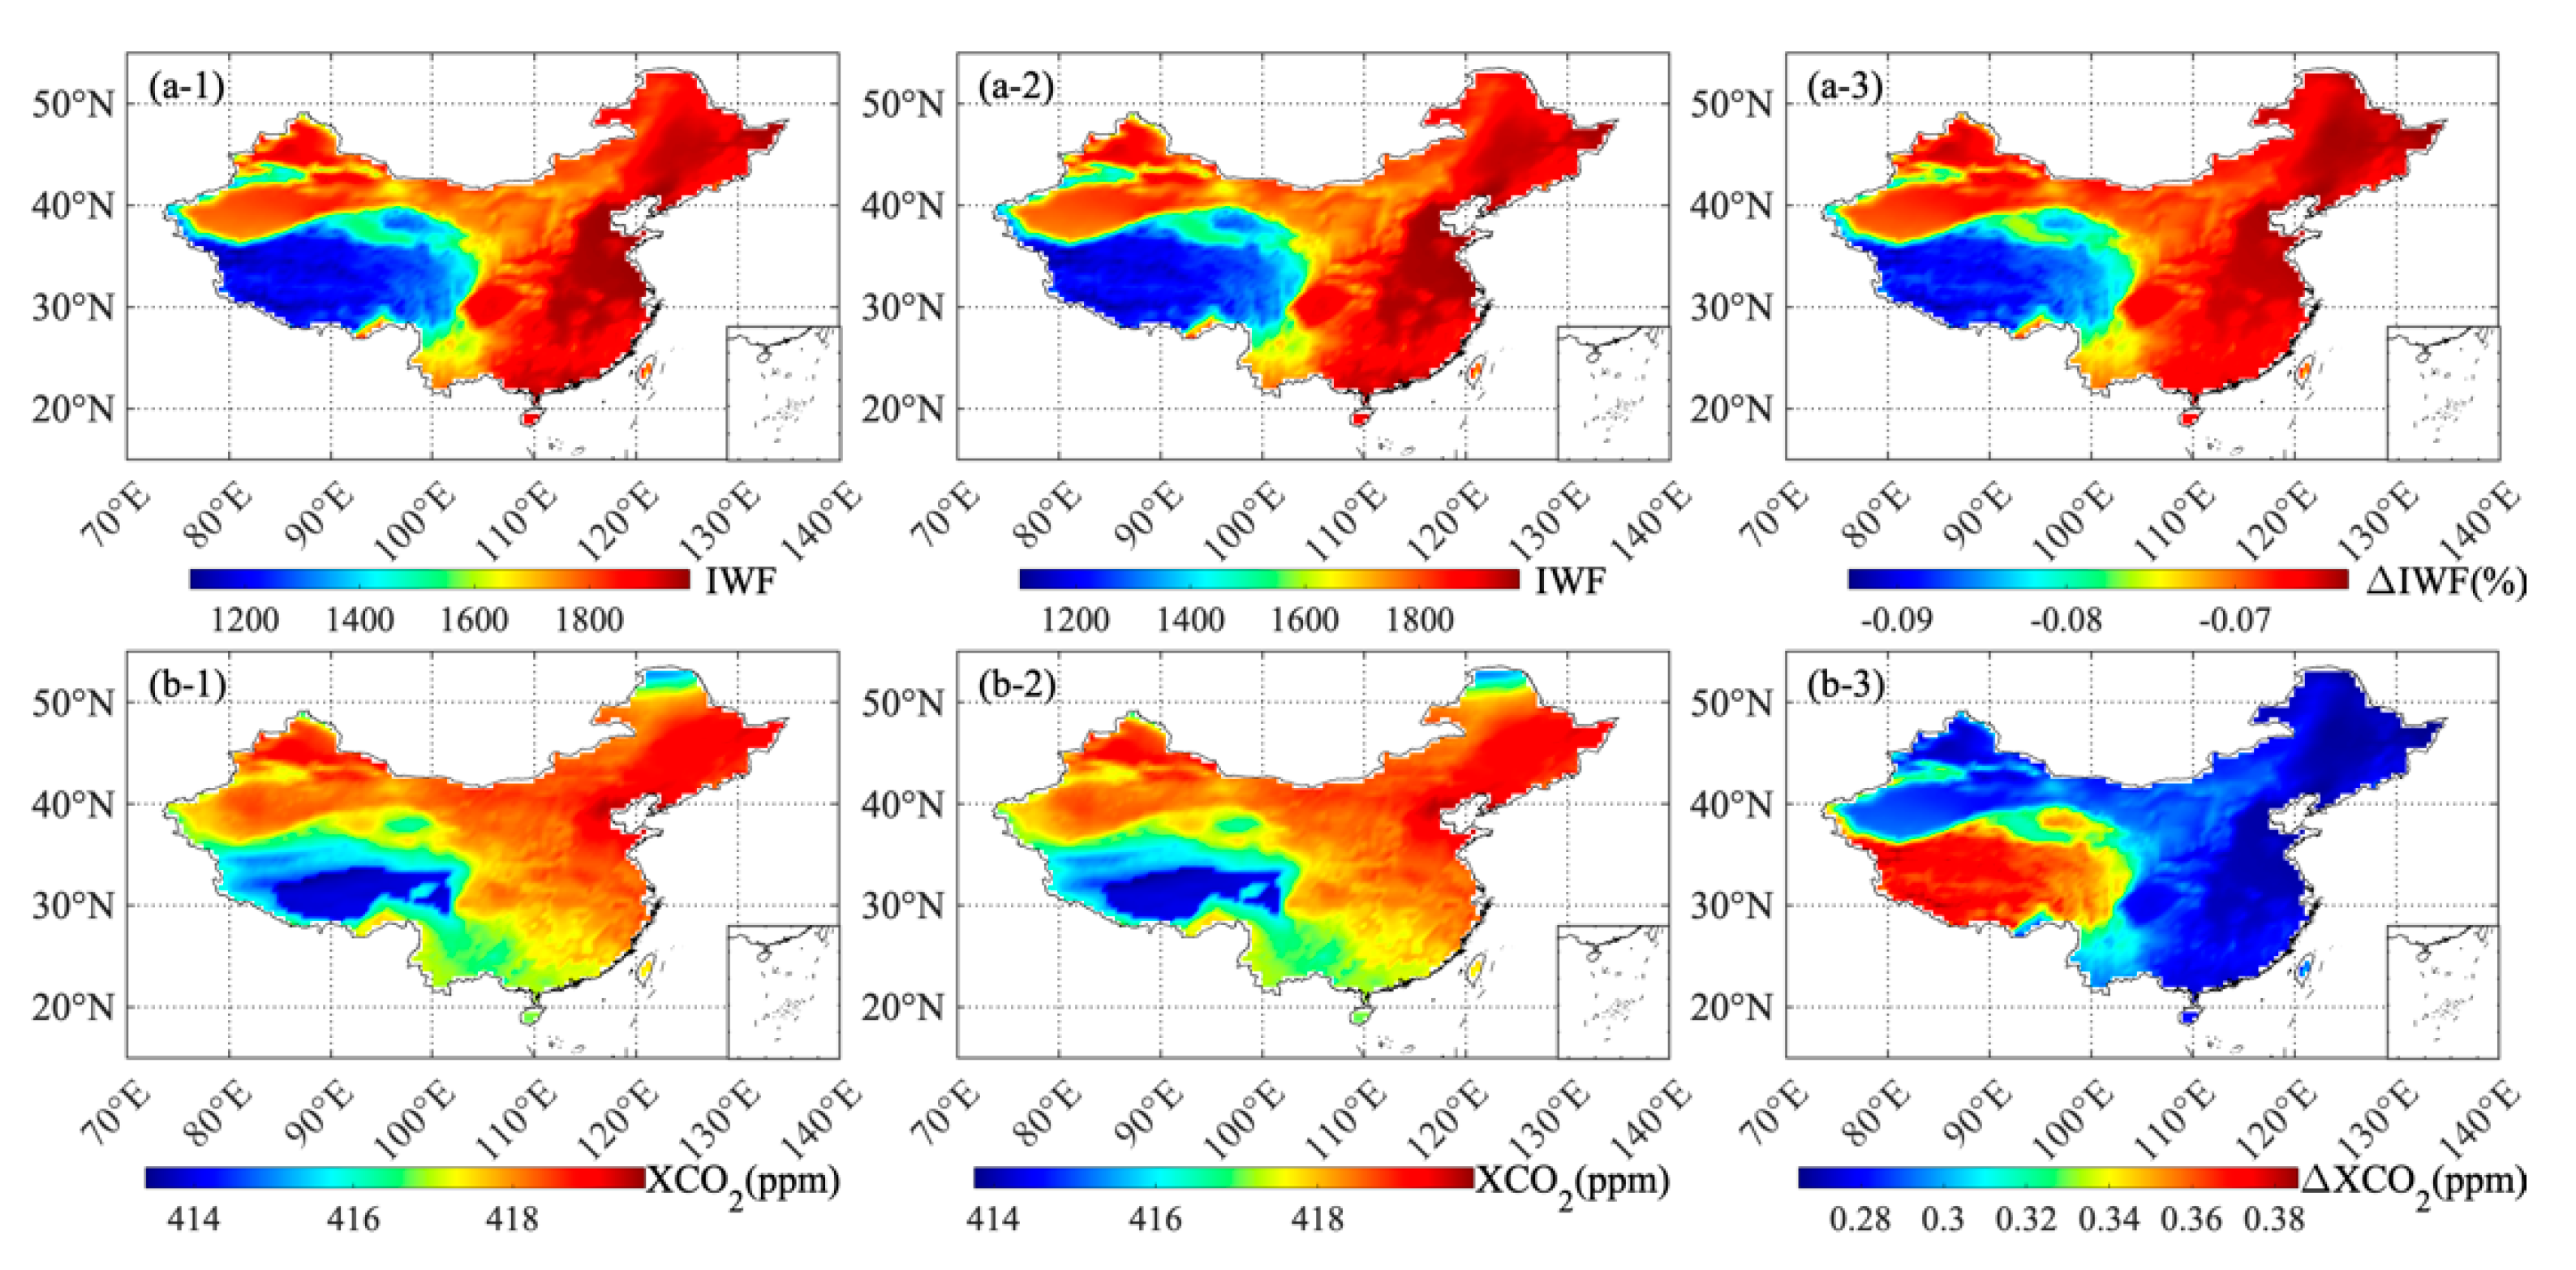
Subsequently, the IWF results were calculated according to Equation (6). The comparison between the IWF results with and without Doppler shift on 10 April 2021 is displayed in panel (a) of Figure 12. The IWF results were distributed in the range of 1102–1975. The spatial distributions of IWF in both Figure 12(a-1) and 12(a-2) show similar characteristics to those of the DAOD results. Figure 12(a-3) presents the absolute differences between the above two IWF results. All of the deviations were negative, indicating that the IWF results without Doppler shift were smaller than the IWF results with Doppler shift. The relative difference was about −0.07%, except for the Qinghai–Tibet Plateau, and this difference corresponded to an absolute difference of approximately −1.25. The absolute difference on the Qinghai–Tibet Plateau is smaller than that on the other regions, about −1.05, due to the shorter laser path. However, the relative difference on the Qinghai–Tibet Plateau was larger than that on the other regions, at about −0.09%. The reason will be discussed in the following section.
Figure 12(b-1) and Figure 12(b-2) show the XCO2 results retrieved from the ACDL simulations with and without Doppler shift, respectively. The comparison of XCO2 retrievals between 12(b-1) and 12(b-2) was carried out to reveal the impact of the Doppler effect on CO2 measurement. The bias was positive and ranged from 0.26 to 0.39 ppm, as shown in Figure 12(b-3), which implies that the XCO2 retrievals without Doppler shift were higher than those with Doppler shift. This is because the XCO2 results were inversely correlated with the IWF values. The lower IWF in Figure 12(a-2) led to a higher CO2 column in Figure 12(b-2). The largest differences in the CO2 columns between 12(b-1) and 12(b-2) were found on the Qinghai–Tibet Plateau. In this region the mean difference in the XCO2 results was about 0.38 ppm, which corresponds to a relative difference of approximately 0.09%.

4. Discussion

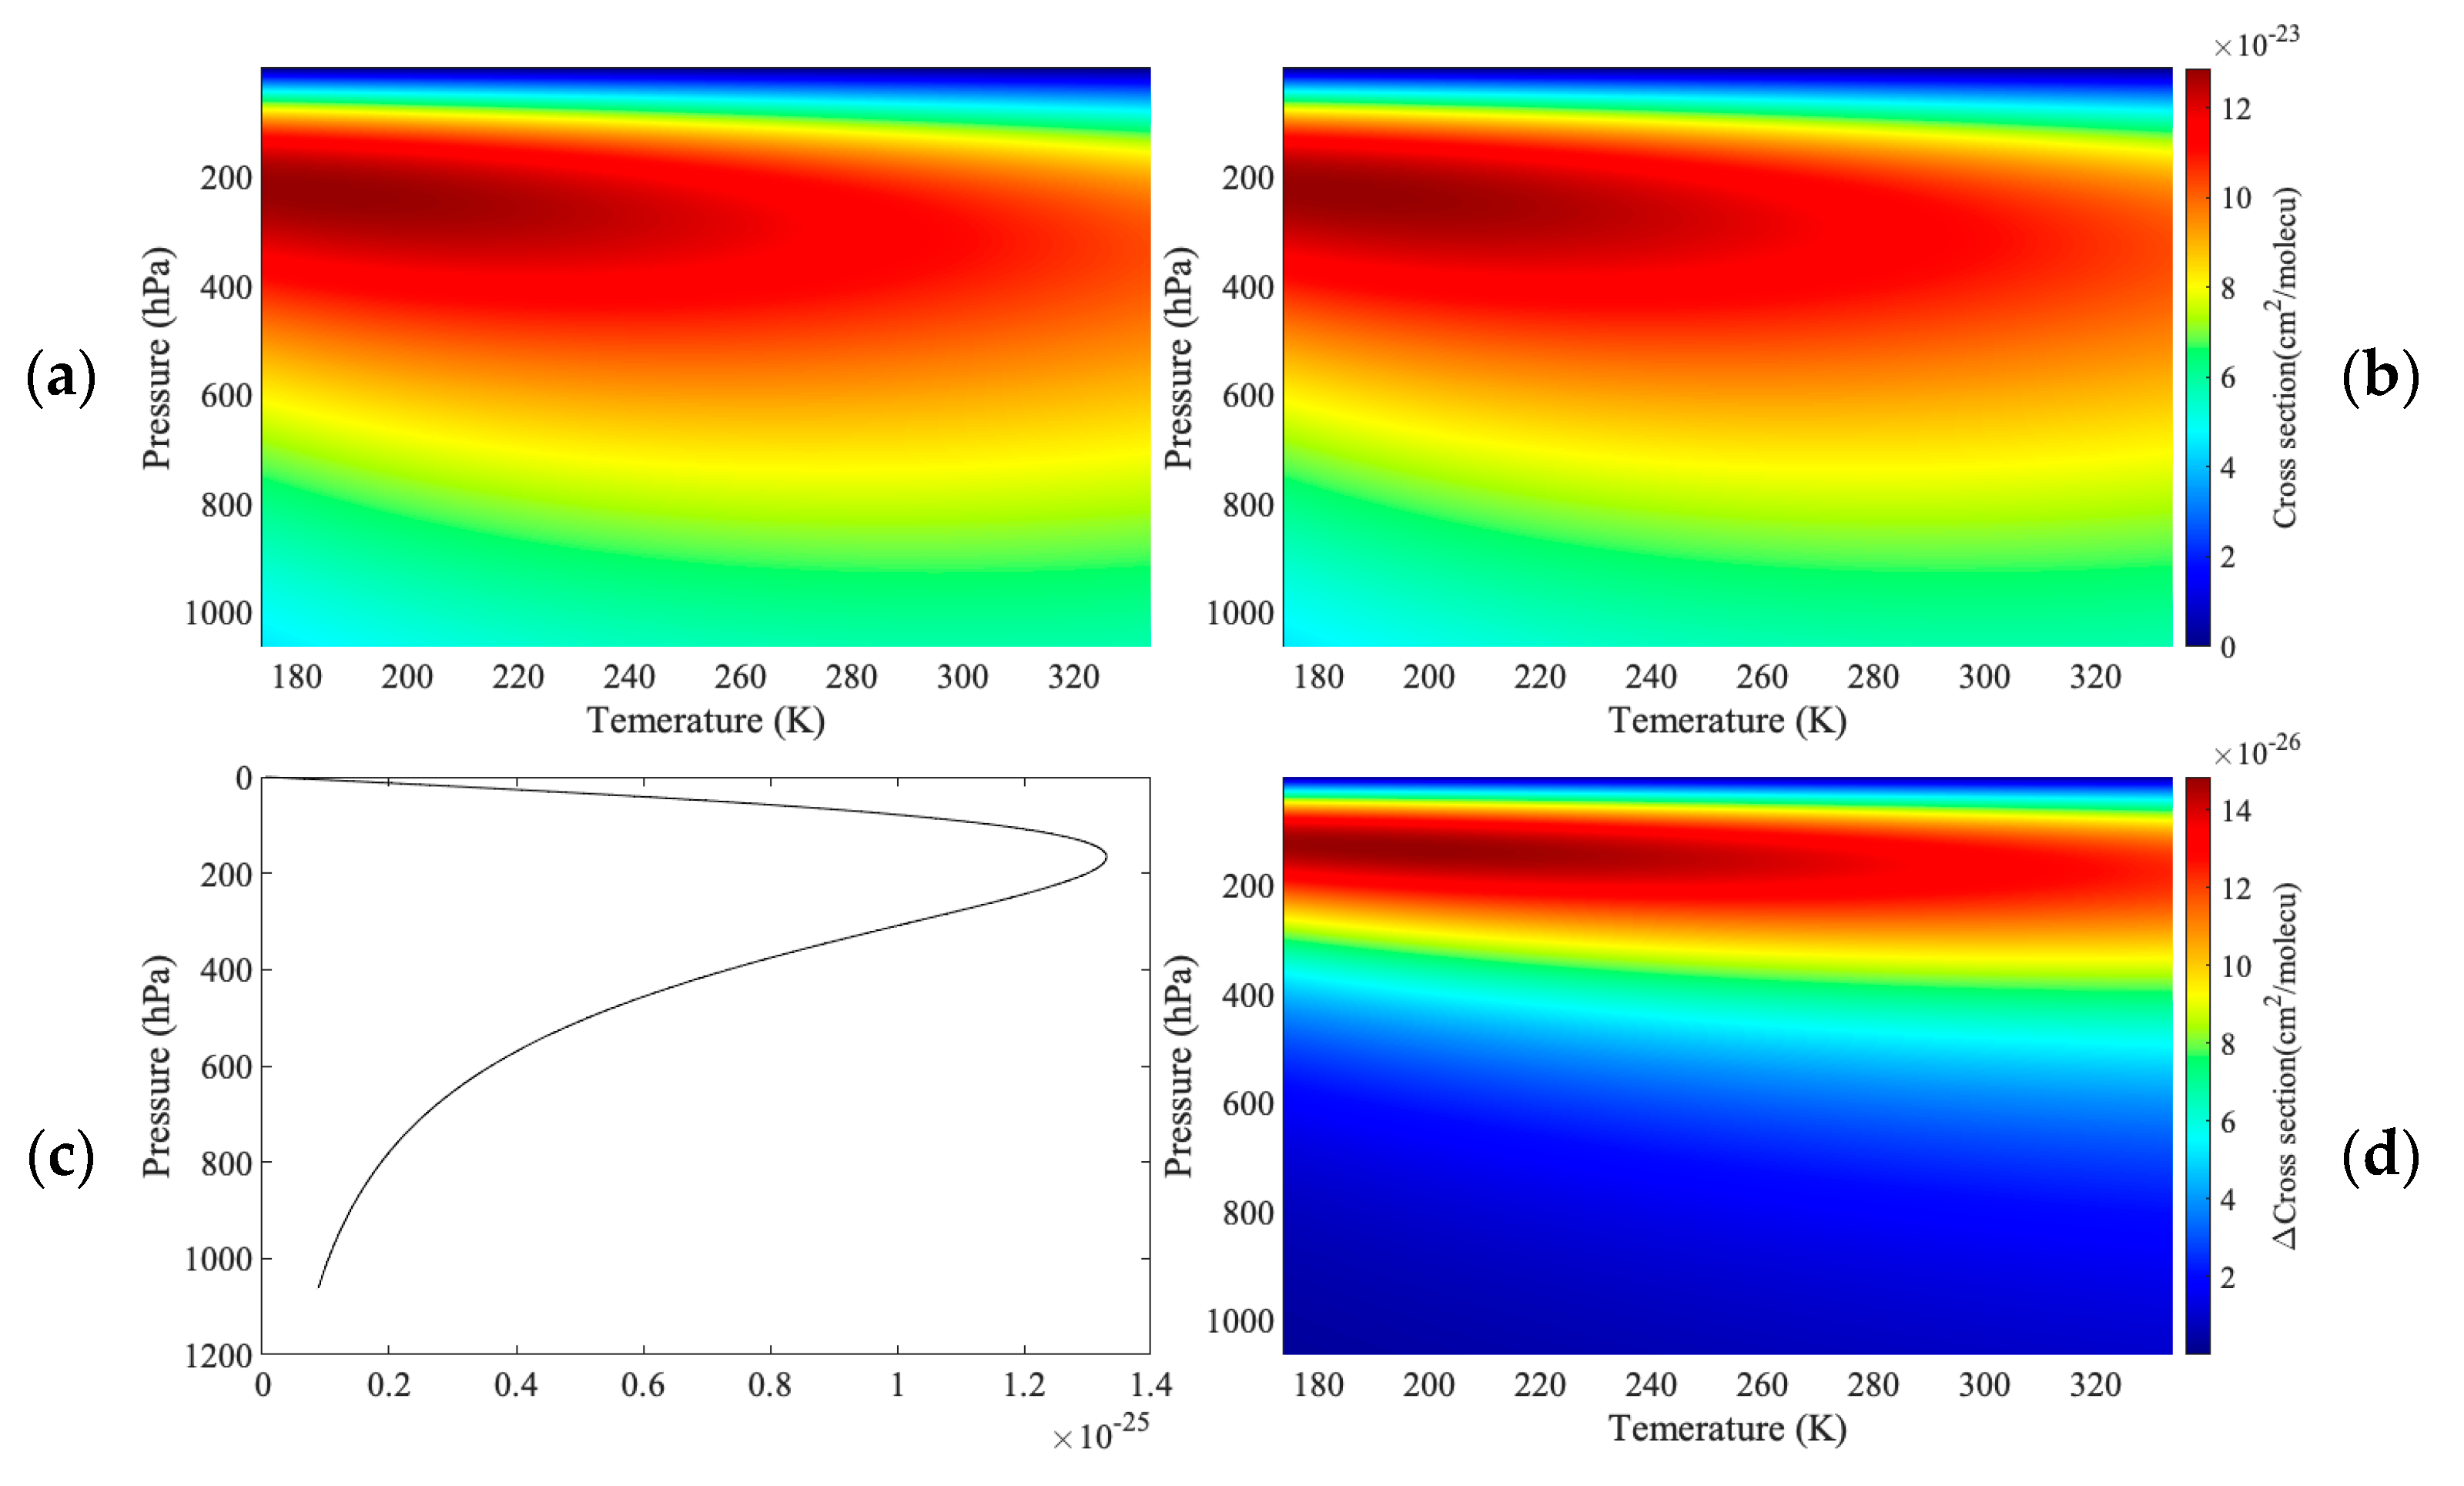
The comparison experiments demonstrated that a larger relative difference in IWF and CO2 columns occurred on the Qinghai–Tibet Plateau, assuming the same pointing misalignment. This indicates that CO2 measurements on the Qinghai–Tibet Plateau are more susceptible to the Doppler effect. A sensitivity analysis of the absorption cross section was performed to understand the phenomenon. Figure 13a shows the differential absorption cross section between online and offline without Doppler shift. The differential absorption cross section without Doppler shift had a greater sensitivity to pressure. The differential absorption cross section increased as the pressure decreased between approximately 260 and 1063 hPa and reached the highest point at around 260 hPa, then decreased as the pressure decreased between 0 and 260 hPa. Figure 13b depicts the differential absorption cross section with Doppler shift. The distribution showed similar characteristics to Figure 13a. The absolute deviations in the differential absorption cross section are shown in Figure 13d. A longitudinal section of the deviations between 13a and 13b at 296 K is presented in Figure 13c. It can be seen that the absolute deviations of the differential absorption cross section between 13a and 13b due to the Doppler shift also showed a high sensitivity to pressure. The absolute deviations were relatively small above 400 hPa. The absolute deviations exhibited a strong negative correlation with the pressure between 160 and 1063 hPa, while they showed a positive correlation in the range of 0–160 hPa. Therefore, the deviations in the differential absorption cross sections were larger along the laser path on the Qinghai–Tibet Plateau, which would lead to a significant relative difference in the IWF results. This is also the reason for the large difference in the CO2 columns caused by the Doppler shift over the Qinghai–Tibet Plateau. The greater deviations from higher altitudes (lower pressure) will be diluted during line-of-sight integration with signals from the lower altitudes, which exhibited smaller deviations.

5. Conclusions

In this study, the impact of the Doppler shift on CO2 retrievals was analyzed to gain a better understanding of the performance of the integrated path differential absorption lidar. The measurement uncertainties caused by the Doppler shift were evaluated for both airborne observations and spaceborne measurements. The airborne data obtained from the first flight campaign of a 1.57 μm double-pulse IPDA LIDAR system on 14 March 2019 were analyzed. The column-averaged dry-air mixing ratio of carbon dioxide was retrieved over a variety of surfaces. The mean values of XCO2 were 416.80, 427.40, and 419.88 ppm over the ocean, residential, and mountainous areas, respectively. The deviation between the XCO2 retrievals and in situ measurements was about 1.312 ppm. The instability of the aircraft’s attitude led to a Doppler shift in the flight campaign. It was found that the absorption cross section around the online wavelength was very sensitive to frequency shift, suggesting that a small drift in frequency can result in a deviation in the IWF results. The Doppler shift due to the instability of the aircraft’s attitude was estimated. The results show that the Doppler shifts of 6-8 MHz could lead to a difference of about 3.1–7.8 in the IWF results and 0.26–0.39 ppm in the XCO2 results during the flight campaign. The deviation between the XCO2 retrievals and in situ measurements decreased from about 1.312 ppm to 0.16 ppm after the correction of the Doppler shift. Therefore, the impact of the Doppler effect must be quantified to meet the XCO2 measurement requirements of less than 1 ppm. It was found that the online Doppler shift played a dominant role in the deviations between the XCO2 retrievals and in situ measurements, which can account for 98% of the deviations. Thus, the impact of the offline Doppler shift can be neglected to improve efficiency.
Furthermore, the influences of the Doppler shift on spaceborne ACDL measurements of CO2 were also evaluated. The simulations were calculated using the Line-By-Line Radiative Transfer Model with a pointing misalignment of 0.067 mrad. The differences between the XCO2 retrievals with and without Doppler shifts were used to assess the impact of the Doppler effect. A mean bias of about 0.30 ppm in CO2 columns was caused by the Doppler shift, which corresponded to a relative difference of approximately 0.072%. In addition, the largest differences in CO2 columns were found on the Qinghai–Tibet Plateau. This was because the absolute deviations in the differential absorption cross section due to Doppler shift were relatively larger at high altitudes (lower pressure), which will lead to a significant deviation in XCO2 results on the Qinghai–Tibet Plateau. On the contrary, the laser path in the plain was longer due to the lower surface elevation; thus, the larger deviations from higher altitudes (lower pressure) will be diluted during line-of-sight integration with signal from the lower altitudes, which will lead to a small deviation in the XCO2 results.
This study can help to reduce the measurement uncertainties and improve the reliability of CO2 retrievals. Atmospheric states are required for simulation. Presently, the assessment of the Doppler shift was only conducted based on the simulations of the meteorological reanalysis of ERA5. Differences in meteorological reanalysis can also lead to bias in the impact of the Doppler shift. Future comparisons of the impact of the Doppler shift between different meteorological data will be performed. In addition, the accuracy of CO2 measurements was also limited by other factors, such as the uncertainties of the absorption line parameters in the HITRAN database. In the future, further studies are required to improve the accuracy of the absorption line of CO2.

Author Contributions

Conceptualization, X.Z. (Xingying Zhang), L.Z. and X.C.; methodology, X.C. and L.Z.; validation, X.C. and L.Z.; formal analysis, S.Y.; investigation, Z.D., X.Z. (Xin Zhang) and Y.J.; resources, S.Y.; data curation, X.C.; writing—original draft preparation, X.C.; writing—review and editing, X.Z. (Xingying Zhang) and L.Z.; visualization, X.C.; supervision, S.Y.; funding acquisition, X.Z. (Xingying Zhang) All authors have read and agreed to the published version of the manuscript.

Funding

This research was funded by the National Key R&D Program of China, grant number 2017YFB0504001; the National Key R&D Program of China, grant number 2021YFE0118000; the National Natural Science Foundation of China, grant number 41775028; and the Dragon Programme, grant number 58894. The APC was funded by the National Key R&D Program of China, grant number 2017YFB0504001.

Data Availability Statement

Publicly available datasets were analyzed in this study. These data can be found at: https://cds.climate.copernicus.eu (1 March 2022) and https://tccon-wiki.caltech.edu (5 March 2022).

Acknowledgments

We thank the Shanghai Institute of Optics and Fine Mechanics for developing the IPDA LIDAR system. We acknowledge the Shanghai Academy of Spaceflight Technology for providing the initial LiDAR data. We thank the team of ERA5 for allowing us to use the meteorological data. We thank the team of TCCON for making TCCON data available for this work.

Conflicts of Interest

The authors declare no conflict of interest.

References

  1. Canadell, J.G.; Monteiro, P.M.; Costa, M.H.; Da Cunha, L.C.; Cox, P.M.; Alexey, V.; Henson, S.; Ishii, M.; Jaccard, S.; Koven, C. Global carbon and other biogeochemical cycles and feedbacks. In Climate Change 2021: The Physical Science Basis. Contribution of Working Group I to the Sixth Assessment Report of the Intergovernmental Panel on Climate Change; United Nations Environment Programme: Nairobi, Kenya, 2021. [Google Scholar]
  2. Ciais, P.; Sabine, C.; Bala, G.; Bopp, L.; Brovkin, V.; Canadell, J.; Chhabra, A.; DeFries, R.; Galloway, J.; Heimann, M. Carbon and other biogeochemical cycles. In Climate Change 2013: The Physical Science Basis. Contribution of Working Group I to the Fifth Assessment Report of the Intergovernmental Panel on Climate Change; Cambridge University Press: Cambridge, UK, 2014; pp. 465–570. [Google Scholar]
  3. Khalil, M. Non-CO2 greenhouse gases in the atmosphere. Annu. Rev. Environ. Resour. 1999, 24, 645. [Google Scholar] [CrossRef]
  4. Zhao, C.; Andrews, A.E.; Bianco, L.; Eluszkiewicz, J.; Hirsch, A.; MacDonald, C.; Nehrkorn, T.; Fischer, M.L. Atmospheric inverse estimates of methane emissions from Central California. J. Geophys. Res. Atmos. 2009, 114, D16302. [Google Scholar] [CrossRef]
  5. Montzka, S.A.; Dlugokencky, E.J.; Butler, J.H. Non-CO2 greenhouse gases and climate change. Nature 2011, 476, 43–50. [Google Scholar] [CrossRef]
  6. Jeong, S.; Zhao, C.; Andrews, A.E.; Bianco, L.; Wilczak, J.M.; Fischer, M.L. Seasonal variation of CH4 emissions from central California. J. Geophys. Res. Atmos. 2012, 117, D11306. [Google Scholar] [CrossRef]
  7. Jeong, S.; Zhao, C.; Andrews, A.E.; Dlugokencky, E.J.; Sweeney, C.; Bianco, L.; Wilczak, J.M.; Fischer, M.L. Seasonal variations in N2O emissions from central California. Geophys. Res. Lett. 2012, 39, L16805. [Google Scholar] [CrossRef]
  8. Zhang, B.; Chen, Z.-M.; Qiao, H.; Chen, B.; Hayat, T.; Alsaedi, A. China’s non-CO2 greenhouse gas emissions: Inventory and input–output analysis. Ecol. Inform. 2015, 26, 101–110. [Google Scholar] [CrossRef]
  9. Zhang, B.; Zhang, Y.; Zhao, X.; Meng, J. Non-CO2 Greenhouse Gas Emissions in China 2012: Inventory and Supply Chain Analysis. Earth’s Future 2018, 6, 103–116. [Google Scholar] [CrossRef]
  10. Trends in Atmospheric Carbon Dioxide, National Oceanic and Atmospheric Administration, Earth System Research Laboratory (NOAA/ESRL). Available online: http://www.esrl.noaa.gov/gmd/ccgg/trends/global.html (accessed on 25 October 2021).
  11. Friedlingstein, P.; O’Sullivan, M.; Jones, M.W.; Andrew, R.M.; Hauck, J.; Olsen, A.; Peters, G.P.; Peters, W.; Pongratz, J.; Sitch, S.; et al. Global Carbon Budget 2020. Earth Syst. Sci. Data 2020, 12, 3269–3340. [Google Scholar] [CrossRef]
  12. Crevoisier, C.; Chédin, A.; Matsueda, H.; Machida, T.; Armante, R.; Scott, N.A. First year of upper tropospheric integrated content of CO2 from IASI hyperspectral infrared observations. Atmos. Chem. Phys. 2009, 9, 4797–4810. [Google Scholar] [CrossRef]
  13. Schneising, O.; Buchwitz, M.; Reuter, M.; Heymann, J.; Bovensmann, H.; Burrows, J.P. Long-term analysis of carbon dioxide and methane column-averaged mole fractions retrieved from SCIAMACHY. Atmos. Chem. Phys. 2011, 11, 2863–2880. [Google Scholar] [CrossRef] [Green Version]
  14. Crevoisier, C.; Heilliette, S.; Chédin, A.; Serrar, S.; Armante, R.; Scott, N.A. Midtropospheric CO2 concentration retrieval from AIRS observations in the tropics. Geophys. Res. Lett. 2004, 31, L17106. [Google Scholar] [CrossRef]
  15. Eldering, A.; Taylor, T.E.; O’Dell, C.W.; Pavlick, R. The OCO-3 mission: Measurement objectives and expected performance based on 1 year of simulated data. Atmos. Meas. Tech. 2019, 12, 2341–2370. [Google Scholar] [CrossRef]
  16. Yang, D.; Liu, Y.; Feng, L.; Wang, J.; Yao, L.; Cai, Z.; Zhu, S.; Lu, N.; Lyu, D. The First Global Carbon Dioxide Flux Map Derived from TanSat Measurements. Adv. Atmos. Sci. 2021, 38, 1433–1443. [Google Scholar] [CrossRef]
  17. Kawa, S.R.; Abshire, J.B.; Baker, D.F.; Browell, E.V.; Crisp, D.; Crowell, S.M.; Hyon, J.J.; Jacob, J.C.; Jucks, K.W.; Lin, B. Active Sensing of CO2 Emissions over Nights, Days, and Seasons (ASCENDS): Final Report of the ASCENDS Ad Hoc Science Definition Team; NASA Technical Reports Server: Washington, DC, USA, 2018. [Google Scholar]
  18. Ingmann, P.; Bensi, P.; Durand, Y. Candidate Earth Explorer Core Missions–Reports for Assessment: A-SCOPE–Advanced Space Carbon and climate Observation of Planet Earth. ESA SP 2008, 1313. [Google Scholar]
  19. Amediek, A.; Fix, A.; Wirth, M.; Ehret, G. Development of an OPO system at 1.57 μm for integrated path DIAL measurement of atmospheric carbon dioxide. Appl. Phys. B 2008, 92, 295–302. [Google Scholar] [CrossRef]
  20. Amediek, A.; Fix, A.; Ehret, G.; Caron, J.; Durand, Y. Airborne lidar reflectance measurements at 1.57 μm in support of the A-SCOPE mission for atmospheric CO2. Atmos. Meas. Tech. 2009, 2, 755–772. [Google Scholar] [CrossRef]
  21. NRC. Earth Science and Applications from Space: National Imperatives for the Next Decade and Beyond; The National Academies Press: Washington, DC, USA, 2007. [Google Scholar]
  22. Jacob, J.; Spiers, G.D.; Menzies, R.T. Airborne Laser Absorption Spectrometer Measurements of Atmospheric CO2 Column Mole Fractions: Source and Sink Detection and Environmental Impacts on Retrievals. J. Atmos. Ocean. Technol. 2014, 31, 404–421. [Google Scholar] [CrossRef]
  23. Amediek, A.; Ehret, G.; Fix, A.; Wirth, M.; Budenbender, C.; Quatrevalet, M.; Kiemle, C.; Gerbig, C. CHARM-F-A new airborne integrated-path differential-absorption lidar for carbon dioxide and methane observations: Measurement performance and quantification of strong point source emissions. Appl. Opt. 2017, 56, 5182–5197. [Google Scholar] [CrossRef]
  24. Mao, J.; Ramanathan, A.; Abshire, J.B.; Kawa, S.R.; Riris, H.; Allan, G.R.; Rodriguez, M.; Hasselbrack, W.E.; Sun, X.; Numata, K.; et al. Measurement of atmospheric CO2 column concentrations to cloud tops with a pulsed multi-wavelength airborne lidar. Atmos. Meas. Tech. 2018, 11, 127–140. [Google Scholar] [CrossRef]
  25. Refaat, T.F.; Singh, U.N.; Yu, J.; Petros, M.; Remus, R.; Ismail, S. Double-pulse 2-μm integrated path differential absorption lidar airborne validation for atmospheric carbon dioxide measurement. Appl. Opt. 2016, 55, 4232–4246. [Google Scholar] [CrossRef]
  26. Spiers, G.D.; Menzies, R.T.; Jacob, J.; Christensen, L.E.; Phillips, M.W.; Choi, Y.; Browell, E.V. Atmospheric CO2 measurements with a 2 μm airborne laser absorption spectrometer employing coherent detection. Appl. Opt. 2011, 50, 2098–2111. [Google Scholar] [CrossRef] [PubMed]
  27. Abshire, J.B.; Ramanathan, A.K.; Riris, H.; Allan, G.R.; Sun, X.; Hasselbrack, W.E.; Mao, J.; Wu, S.; Chen, J.; Numata, K.; et al. Airborne measurements of CO2 column concentrations made with a pulsed IPDA lidar using a multiple-wavelength-locked laser and HgCdTe APD detector. Atmos. Meas. Tech. 2018, 11, 2001–2025. [Google Scholar] [CrossRef]
  28. Zhu, Y.; Yang, J.; Chen, X.; Zhu, X.; Zhang, J.; Li, S.; Sun, Y.; Hou, X.; Bi, D.; Bu, L.; et al. Airborne Validation Experiment of 1.57-μm Double-Pulse IPDA LIDAR for Atmospheric Carbon Dioxide Measurement. Remote Sens. 2020, 12, 1999. [Google Scholar] [CrossRef]
  29. Wang, Q.; Mustafa, F.; Bu, L.; Zhu, S.; Liu, J.; Chen, W. Atmospheric carbon dioxide measurement from aircraft and comparison with OCO-2 and CarbonTracker model data. Atmos. Meas. Tech. 2021, 14, 6601–6617. [Google Scholar] [CrossRef]
  30. Zhang, X.; Wang, F.; Wang, W.; Huang, F.; Chen, B.; Gao, L.; Wang, S.; Yan, H.; Ye, H.; Si, F.; et al. The development and application of satellite remote sensing for atmospheric compositions in China. Atmos. Res. 2020, 245, 105056. [Google Scholar] [CrossRef]
  31. Ehret, G.; Kiemle, C.; Wirth, M.; Amediek, A.; Fix, A.; Houweling, S. Space-borne remote sensing of CO2, CH4, and N2O by integrated path differential absorption lidar: A sensitivity analysis. Appl. Phys. B 2008, 90, 593–608. [Google Scholar] [CrossRef]
  32. Kiemle, C.; Quatrevalet, M.; Ehret, G.; Amediek, A.; Fix, A.; Wirth, M. Sensitivity studies for a space-based methane lidar mission. Atmos. Meas. Tech. 2011, 4, 2195–2211. [Google Scholar] [CrossRef]
  33. Zaccheo, T.S.; Pernini, T.; Snell, H.E.; Browell, E.V. Impact of atmospheric state uncertainties on retrieved XCO2 columns from laser differential absorption spectroscopy measurements. J. Appl. Remote Sens. 2014, 8, 083575. [Google Scholar] [CrossRef]
  34. Han, G.; Gong, W.; Lin, H.; Ma, X.; Xiang, Z. Study on Influences of Atmospheric Factors on Vertical CO2 Profile Retrieving From Ground-Based DIAL at 1.6 μm. IEEE Trans. Geosci. Remote Sens. 2015, 53, 3221–3234. [Google Scholar] [CrossRef]
  35. Zhu, Y. Research on Ground Verification Technology of Spaceborne CO2 Detection Lidar. Ph.D. Thesis, University of Chinese Academy of Sciences, Beijing, China, June 2021. [Google Scholar]
  36. Yu, J.; Petros, M.; Singh, U.N.; Refaat, T.F.; Reithmaier, K.; Remus, R.G.; Johnson, W. An Airborne 2-μm Double-Pulsed Direct-Detection Lidar Instrument for Atmospheric CO2 Column Measurements. J. Atmos. Ocean. Technol. 2017, 34, 385–400. [Google Scholar] [CrossRef]
  37. Albrecht, H.-E.; Damaschke, N.; Borys, M.; Tropea, C. Laser Doppler and Phase Doppler Measurement Techniques; Springer Science & Business Media: Berlin, Germany, 2013. [Google Scholar]
  38. Drain, L.E. The Laser Doppler Techniques; Wiley-Interscience: Chichester, UK, 1980. [Google Scholar]
  39. Ehret, G.; Bousquet, P.; Pierangelo, C.; Alpers, M.; Millet, B.; Abshire, J.; Bovensmann, H.; Burrows, J.; Chevallier, F.; Ciais, P.; et al. MERLIN: A French-German Space Lidar Mission Dedicated to Atmospheric Methane. Remote Sens. 2017, 9, 1052. [Google Scholar] [CrossRef] [Green Version]
  40. Tellier, Y.; Pierangelo, C.; Wirth, M.; Gibert, F.; Marnas, F. Averaging bias correction for the future space-borne methane IPDA lidar mission MERLIN. Atmos. Meas. Tech. 2018, 11, 5865–5884. [Google Scholar] [CrossRef] [Green Version]
Figure 1. The experimental site and track of the flight on 14 March 2019. The blue line represents the flight trajectory, with an average altitude of about 6800 m. The elevations of the ground footprints are indicated with different colors.
Remotesensing 14 04620 g001
Figure 2. Illustrations of the principle of the Doppler shift during the flight campaign.
Remotesensing 14 04620 g002
Figure 3. The DAOD measurements of CO2 from IPDA lidar on 14 March 2019. The blue and red dots are single shot measurements and the black line is the result of 1500-point averages. The gaps between observations indicate the interval of missing and unavailable measurements. The dashed vertical lines indicate the boundaries of the different surfaces.
Remotesensing 14 04620 g003
Figure 4. The integrated weighting function (IWF) results on 14 March 2019.
Remotesensing 14 04620 g004
Figure 5. The XCO2 results retrieved from IPDA measurements on 14 March 2019.
Remotesensing 14 04620 g005
Figure 6. In situ profiles for CO2 during the vertical spiral maneuvers.
Remotesensing 14 04620 g006
Figure 7. The Doppler shift of the laser pulse during the flight campaign.
Remotesensing 14 04620 g007
Figure 8. The absorption cross section of CO2 at T = 296 K and p = 1013.25 hPa.
Remotesensing 14 04620 g008
Figure 9. The comparison of the IWF results on 14 March 2019: (a) original and Doppler-shifted IWF results. The black line represents the original IWF results, the blue and green lines represent the IWF results with online and offline Doppler shifts, respectively, and the red line represents the IWF results with Doppler shifts of both wavelengths; (b) difference between the original and Doppler-shifted results. The blue and green lines represent the difference between the original, IWF results2, and IWF results1, and the red line represents the difference between the original and IWF results3.
Remotesensing 14 04620 g009
Figure 10. Comparison of the XCO2 retrievals from the IPDA measurements on 14 March 2019: (a) original and Doppler-shifted XCO2 results. The black line represents original XCO2 results, the blue and green lines represent the XCO2 results with online and offline Doppler shifts, respectively, and the red line represents the XCO2 results with Doppler shifts of both wavelengths; (b) difference in XCO2 between the original and Doppler-shifted results. The blue and green lines represent the difference between the original, XCO2 results2, and XCO2 results1, and the red line represents the difference between the original and XCO2 results3.
Remotesensing 14 04620 g010
Figure 11. The distribution of XCO2 and DAOD simulations over China on 10 April 2021: (a) XCO2 and (b) DAOD simulations of IPDA lidar over China, with colors representing different values.
Remotesensing 14 04620 g011
Figure 12. Comparison of the IWF and XCO2 results on 10 April 2021: (a-1) IWF results with Doppler shift; (a-2) IWF results without Doppler shift; (a-3) relative difference (%) in IWF between the above two IWF results; panel (b) is same as panel (a) except for XCO2.
Remotesensing 14 04620 g012
Figure 13. The comparison of the differential absorption cross sections at different temperatures and pressures: (a) differential absorption cross section without Doppler shift; (b) differential absorption cross section with Doppler shift; (c) longitudinal section of the deviations between (a) and (b) at 296 K; (d) absolute deviations of the differential absorption cross section between (a) and (b).
Remotesensing 14 04620 g013
Publisher’s Note: MDPI stays neutral with regard to jurisdictional claims in published maps and institutional affiliations.