Abstract
Monitoring the Earth’s surface from the low Earth orbit (LEO) by synthetic aperture radar (SAR) provides meaningful information about a number of human activities such as the ecosystem, agriculture, and of course security matters. During its operation in LEO orbits, spaceborne SAR, at altitudes between 200 km and 2000 km, inherently emit electromagnetic signals toward the Earth’s surface. It has been experimentally verified that it is possible to detect and intercept spaceborne SAR signals at a distance of hundreds of kilometers by a single electronic support measure (ESM) non-comms sensor, placed on the Earth’s surface. The work described in this document is a follow-up to the paper and describes the principle of a new non-cooperative passive tracking method of spaceborne SAR carriers, tracked by four ground-based passive ESM non-comms sensors. These sensors used the time difference of arrival (TDOA) method in order to determine the current spaceborne SAR position in LEO orbits. Simulations were performed to assess the impact of ESM sensor configurations on the SAR’s signal interception and positioning error. The simulation results showed that the proposed method is sufficient to detect a spaceborne SAR position in LEO.
1. Introduction
Space Situational Awareness (SSA) is a term that has become prominent not only due to an exploration of cosmic phenomena and potential collisions of orbiting space objects but also for national security issues and other human activities.
There are generally two approaches to deal with space surveillance and tracking of objects in the Earth’s orbit, which are radar and optical observations. Data provided by radar and optical systems allow observation of active and inactive satellites, discarded launch stages, and fragmented debris that orbit the Earth [1,2,3,4,5]. Ground-based radars have several advantages over ground-based optical tracking systems because they are independent of the weather and the circadian rhythms to which the optical systems are subjected. Unfortunately, radar for these purposes is among the most sophisticated and expensive sensor technologies, in terms of both acquisition and operation and, therefore, it is legitimate to consider whether some of its capabilities could be replaced by another less expensive system, such as a ground-based passive detection and tracking system.
This work builds on earlier research, investigating uncured detection and interception of spaceborne synthetic aperture radar (SAR) by a terrestrial electronic support measure (ESM) system, also known as a passive surveillance system (PSS) [6]. An ESM system is composed of ESM sensors (antenna and receiver, see Figure 1) suitably deployed on the Earth’s surface (see Figure 2) to reconnaissance the sky for targets of interest (see Figure 3). The spaceborne SAR in this case is a satellite with a SAR emitter that moves in a Low Earth Orbit (LEO) between 200 km and 2000 km of altitude [7]. The multilateration method (MLAT) is used by an ESM system in order to determine the location of the spaceborne SAR. The analysis of the state-of-the-art of SSA shows that passive monitoring of non-cooperative spaceborne SAR by ESM MLAT systems has not been addressed so far.
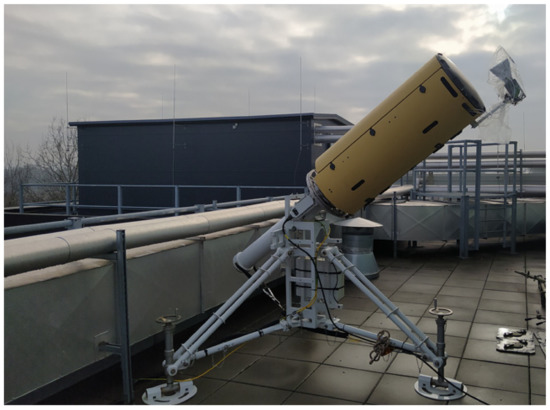
Figure 1.
ESM sensor “C” (Center) with external sector antenna IZ151 which has been repeatedly and successfully used in order to intercept a SAR emitter in LEO orbits [6].
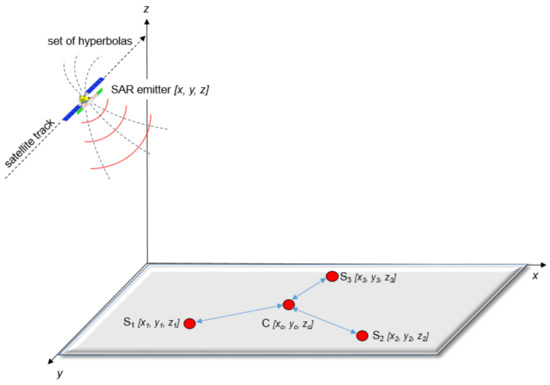
Figure 2.
General configuration of ESM MLAT system.
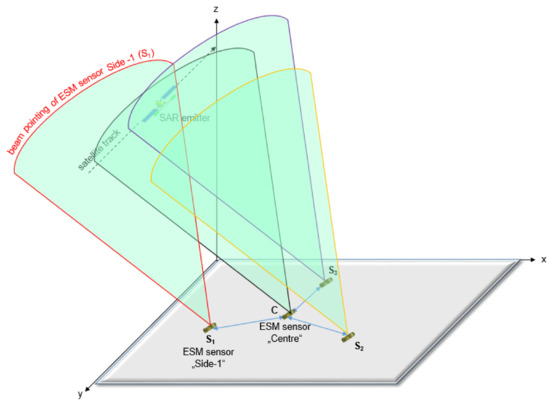
Figure 3.
Deployment of ESM MLAT system consisting of four ESM sensors which recce the sky, where the targets of interest occur. The setting of the beam pointing of individual ESM sensors is addressed in the article [6].
This paper details the use of the ESM MLAT system as a passive tracker for the surveillance of non-cooperative spaceborne SAR in LEO orbits, illustrated in Figure 3, and it is structured as follows: Section 2 describes the Multilateration Method used to determine the position of the satellite with the SAR emitter. Section 3 covers the probability of intercept (POI) of the SAR emitter by the ESM MLAT system, as well as details the positioning error analysis in Section 4. This approach offers an alternative cost-effective satellite passive tracking ground-based system that can covertly track spaceborne SAR in LEO orbits. Moreover, by using the time difference of arrival (TDOA) method is possible to track multiple SARs at the same time and identify them by signal analysis also known as signal identification fingerprinting [6]. The paper includes simulations in order to investigate the impact of ESM sensor configurations on the POI of SAR’s signal and positioning error.
2. Multilateration Method Used to Determine the Position of the Satellite with the SAR Emitter
ESM MLAT systems are widely used for the detection and localization of electromagnetic signal emitting sources (emitters), placed on moving platforms [8,9]. The principle of MLAT is to determine the hyperbolic coordinates of the emitter, based on the knowledge of the receiver’s coordinates and on the time of signal arrival (TOA) at each receiver. One ESM sensor “C” (see Figure 2) is considered a reference. The general configuration of the four position MLAT ESM system is shown in Figure 2.
This time difference of arrivals measurement between center C and side Si ESM sensor establishes an isodelay (hyperbolic) curve that passes through the (SAR) emitter location. The other two TDOA measurements produce similar hyperbolas. The intersection of the set of hyperbolas locates the SAR emitter, as shown in Figure 2.
The distance between each ESM sensor and the SAR emitter can be determined as follows [10]:
where (xi, yi, zi) represents the coordinates of the individual side ESM sensor, (xc, yc, zc) represents the coordinates of the reference ESM sensor, i is the number of the ESM sensor (ESM sensor 1 = S1; ESM sensor 2 = S2; ESM sensor 3 = S3) and (x, y, z) represents the coordinates of the SAR emitter (target).
If v is considered as the propagation speed of the electromagnetic wave in a free environment, then the TOA of the SAR emitter signal at the individual receivers (TOAi, TOAc) can be determined as [8,10]:
Then the TDOA can be expressed as:
where τic represents the TDOA between the reference sensor and the side ESM sensor. TOAc is the time of arrival at the reference ESM sensor (receiver) and TOAi is the time of arrival at the side ESM sensor (see Figure 4).
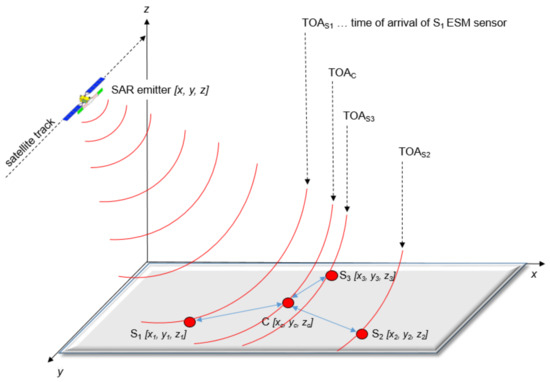
Figure 4.
ESM sensors (S1, C, S3, S2) are irradiated by the SAR emitter and measure the time of arrival of the advancing signal from the SAR emitter. In practice, sidelobes of SAR emitter can be used, see [6].
Thus, with four ESM sensors, the three-dimensional coordinates (x, y, z) of a SAR emitter can be determined.
This method is often used in practice, especially in the field of electronic warfare for ESM receivers. The experiment in [6] has already verified the possibility of detecting spaceborne SAR and thus verifying the energy conditions. However, the detection was only based on the irradiation of one ESM sensor. When determining the 3D coordinates of the SAR emitter, there is a need to irradiate simultaneously all four ESM sensors of the ESM MLAT system as shown in Figure 4. This puts demands on the suitable deployment of the ESM MLAT system.
Related to suitable deployment is also the topic of Probability Of Intercept (POI).
3. Probability of Intercept (POI) of SAR Emitter by ESM MLAT System
Since the condition to determine a 3D position of a SAR emitter by an MLAT system is to irradiate simultaneously at least four ESM sensors by the footprint of the spaceborne SAR, each sensor must fulfill the interception conditions defined by the POI. The topic of POI of a spaceborne SAR by a single ESM sensor has been already described in [6]. According to [6,11] the interception of a SAR emitter by an ESM sensor placed on the Earth’s surface is possible only if all conditions (frequency condition, time condition, spatial condition, and polarization conditions) are met simultaneously.
Therefore, the goal is to deploy the entire ESM MLAT system (i.e., all four ESM sensors) inside the radar footprint, in particular inside the swath as shown in Figure 5 [6].
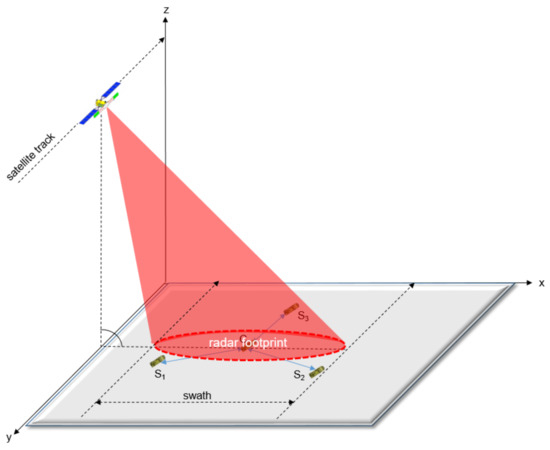
Figure 5.
General configuration of ESM MLAT system.
It is clear that the swath range (see Figure 5) and the baseline (see Figure 6) have a direct impact on the POI of the ESM MLAT system.
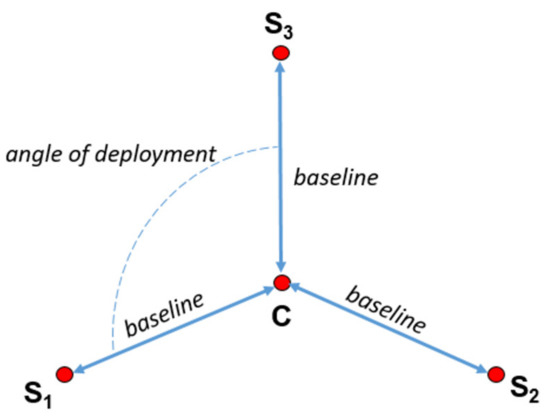
Figure 6.
General four-position MLAT system configuration.
In other words, a higher range of swath and shorter baseline cause higher POI, and high POI is one of the key requirements for any ESM system. For instance, in Sentinel-1 SAR emitter, the swath range varies from 5 km up to 410 km [12,13], in Gaofen-3 the swath ranges from 10 km to 650 km [14]. The large swath modes mean a fast beam scanning capability in elevation [14]. Therefore, a small baseline is ideal for obtaining maximum POI. However, a small baseline in the ESM MLAT system means a large positioning error of the emitter. Therefore, a compromise must be found. Analysis of positioning error for MLAT system is addressed in Section 4.
4. MLAT System Positioning Error Analysis
Determining the position of a (SAR) emitter is in fact only an estimate of its actual coordinates, because of the number of measurements necessary to determine the emitter’s position. In practice, this measurement is always affected by errors.
In MLAT systems, the error in determining the emitter coordinates is a complex problem. This error depends on the accuracy of the TOA measurement (see Section 4.1) and the reciprocal configuration of the ESM sensors and also on the SAR emitter positions (see Section 4.2).
4.1. General Description of MLAT Positioning Error
The error in determining the emitter position depends on the accuracy of the TOA measurement at the individual receivers, or on the time differences of signal arrival τic. The TOA measurement is affected by a measurement error caused by the presence of additive noise in the received signals [10]. In most cases, the additive noise can be assumed to have a normal probability density distribution. Then the determination of the emitter position can be mathematically written as:
where , … are directly measured quantities of the TOAi and the , , coordinates of each ESM sensor.
If the functions , and can be expressed analytically, then their error can be determined using partial derivatives as follows:
where , , are the errors in determining the SAR emitter coordinates and , … are the errors in measuring of , ….
However, the true errors , and can also be expressed using the true values of the outcome variables , , and their mean values , , , which are the best estimates of the true values. Then:
For simplicity, the derivation of the covariance matrix is performed only for the two coordinates and to be determined. Since the resultant quantities (signal source coordinates) and , which are functions of the same directly measured quantities, are and interdependent, i.e., errors in the directly measured quantities will be reflected in all resultant quantities simultaneously. This phenomenon can be mathematically described by covariance, where for one random variable u, the covariance is defined as the mean of the product of the centered deviations of this variable, i.e.,:
where is the symbol for calculating the mean value.
Mathematically, the covariance of a random variable represents its variance, i.e.,:
where is the dispersion (variance) of the random variable u, which characterizes how the values of u are dispersed around its mean value .
Using the Equations (14) and (15) defined above, we can proceed with the error analysis of the resulting quantities and . Equations (8)–(10) can be written economically in matrix form:
where a, b, c, and d are the respective partial derivatives.
Since the random variables and are interdependent, to determine the errors of these variables we must construct the covariance matrix , which has the following form:
where on the main diagonal are the values of the variances of the quantities and and on the minor diagonal are their mutual covariances, which express the degree of their dependence. The Equation (17) can be written in matrix form using (16) as follows:
Since the matrices of derivatives a, b, c, d are matrices of constants, the relation (18) can be modified into the following form:
The expression:
is mathematically nothing more than a matrix of covariances of directly measured quantities. Since the directly measured quantities are independent (assumption above), the covariance matrix of these quantities will contain only elements on the main diagonal (the others will be zero), which will be equal to the variances of the directly measured quantities. Then (19) will have the following form:
Using Equation (21) we obtained the required covariance matrix that describes the errors of the measured quantities, in our case the x and y coordinates of the SAR emitter signal. It should be added that the complex topic of emitter coordinates error estimation by the MLAT system is discussed in detail by Hubacek in [10]. The characteristic polynomial of the covariance matrix is an ellipse equation (in 2D) or ellipsoid equation (in 3D). This ellipsoid is called the error ellipsoid (see Figure 7).
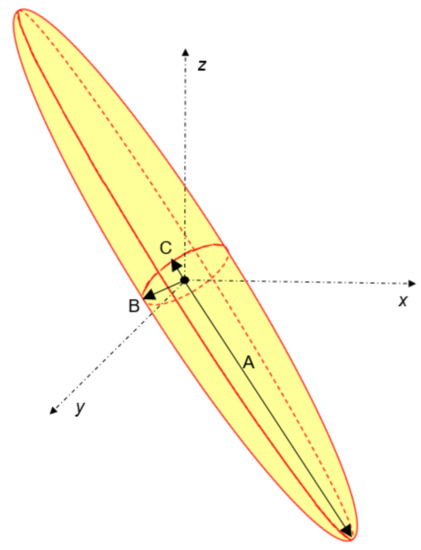
Figure 7.
Description of error ellipsoid with a high eccentricity and its semi-axis A, B, and C.
The ellipsoid parameters (the lengths of the semi-axes and their angles of rotation with respect to the origin of the coordinate system) are proportional to the eigenvalues and eigenvectors of the derived covariance matrix. Thus, if we denote the lengths of the major and minor semi-axes of the ellipse as A, B, and C (see Figure 7), and the eigenvalues of the covariance matrix as λ1, λ2, and λ3, then:
Therefore, such an error ellipsoid is a graphical accuracy expression of the MLAT method and practically expresses the determining error of the emitter position.
4.2. Effect of MLAT System Configuration on the SAR Emitter Positioning Error
The mutual configuration of the receivers and the emitter also significantly affects the SAR emitter positioning error. As shown in Figure 6, a general MLAT system receiver’s configuration can be described by the distances of the side receivers from the central receiver (baseline) and the opening of angles between adjacent baselines (angles of deployment).
The influence of this configuration is based on an analytical solution of a hyperbolic equations system described in [10]. In its solution, the values of the different signal arrival times (delays) are determined precisely by the configuration of the 4-position MLAT system and the emitter. The delay values are given uniquely in the so-called hyperbolic coordinates. However, the back-transformation of the target hyperbolic coordinates into the Cartesian coordinate system may lead to an ambiguous determination of the emitter position [15].
4.3. SAR Emitter Positioning Error Analysis
Analysis of the error in determining the SAR emitter coordinates detected by the four-position ESM MLAT system and its dependence on the distribution of the MLAT system was performed by simulation based on the following assumptions:
- -
- The known position of the SAR emitter in orbit at an altitude of 702 km above sea level and a distance from the central receiver of approximately 935 km [6],
- -
- The trajectory of the SAR emitter relative to the ESM MLAT system is shown in Figure 8,
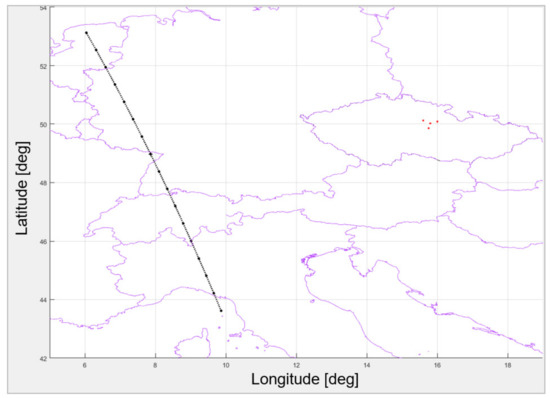 Figure 8. The location of the ESM MLAT system in the Czech Republic (four red dots) and the real trajectory (black dots) of the SAR emitter (Sentinel-1), whose coordinates were used for the error analysis. This figure shows that the baseline is much smaller than the distance from the SAR emitter.
- -
- simultaneous irradiation SAR emitter antenna pattern of all four MLAT receiving sites (see Figure 4),
- -
- TOA measurement error at the receiving sites was 10 ns (which corresponds to the current MLAT system requirements for a time measurement error in the region of 9–12 ns [16]),
- -
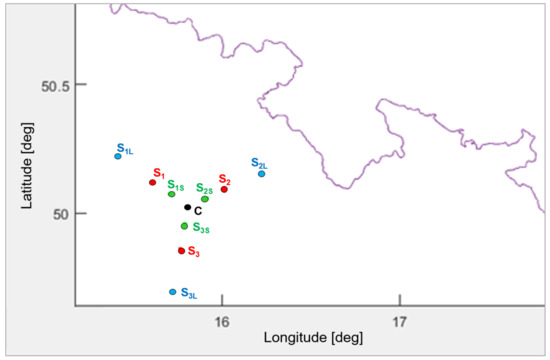 Figure 9. MLAT deployment—standard, short, and long configurations.
- -
- SAR emitter position error was expressed by the error ellipsoid of one SAR emitter position (see Figure 7).
Three different ESM MLAT system configurations were used for the positioning error analysis. The first configuration is shown in Figure 10, and can be referred to as the standard configuration.
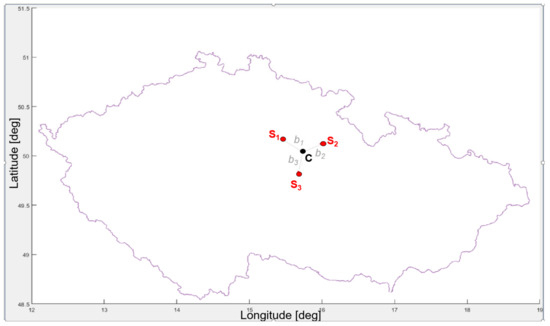
Figure 10.
ESM MLAT system deployment—standard configuration in the Czech Republic.
The other two configurations of the ESM MLAT system are shown in Figure 9. The orientation of these baselines was maintained, with a shortening (by approximately one-half) and lengthening (by approximately two times) of all baselines, see Table 1.

Table 1.
Baselines for standard, short, and long configuration.
In total, 3 deployment configurations we created—short deployment (marked in green), long deployment (marked in blue), and a standard deployment (marked in red).
A simulated calculation of the error ellipsoid was performed, for the three different ESM MLAT system baselines, and based on the above-mentioned assumptions (defining the simulation conditions and the mathematical algorithm for the error ellipsoid calculation) presented in Section 4.1. In order to provide a comprehensive geographical overview of the ESM MLAT configuration and the calculated error ellipsoid, the whole situation is shown in 3D in Figure 11 and Figure 12. The error ellipsoid appears to be a red line on this small scale in Figure 11 and Figure 12. The slope and the ratio of the lengths of the semi-axes of the ellipsoid are given by the calculation of the error ellipsoid based on the overall configuration of the ESM MLAT system and the position of the SAR emitter [17].
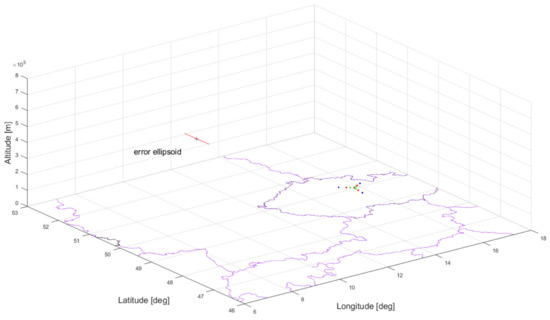
Figure 11.
To scale image of the error ellipsoid and the ESM MLAT systems deployment.
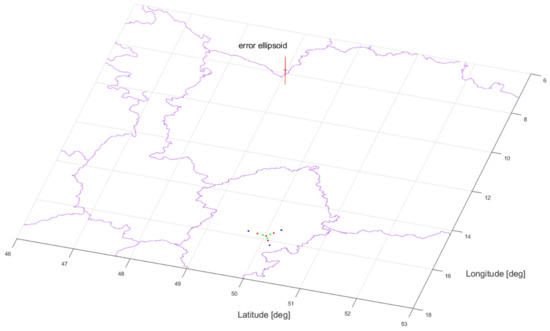
Figure 12.
To scale image of the error ellipsoid and the ESM MLAT systems deployment.
The effect of the ESM MLAT system deployment (baselines lengths) on the SAR emitter position determination error (respectively, the size of the error ellipsoid, see Figure 13) is shown in more detail in a series of the following three figures (Figure 14, Figure 15 and Figure 16).
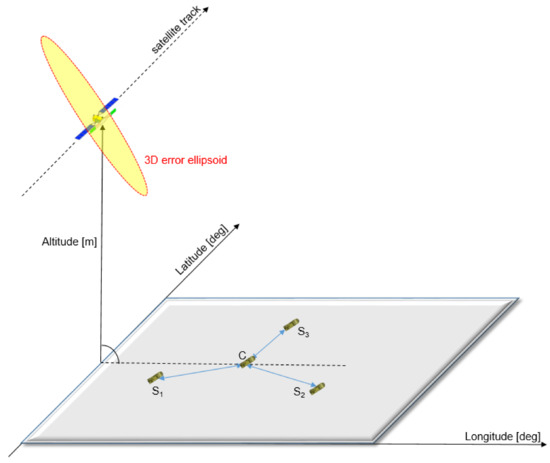
Figure 13.
Error ellipsoid to MLAT deployment 3D configuration.
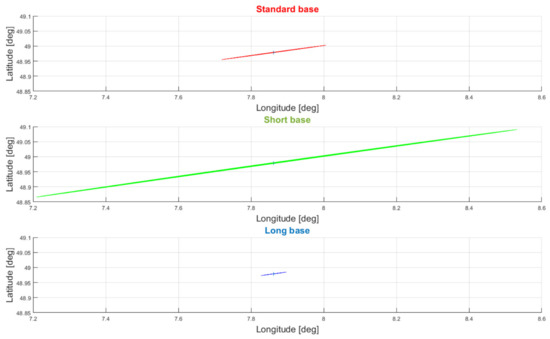
Figure 14.
Sections of error ellipsoids in longitude to latitude plane (2D).
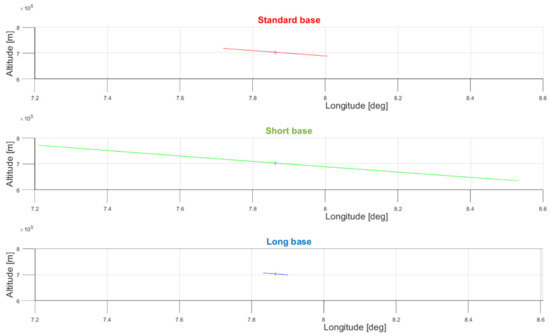
Figure 15.
Sections of error ellipsoids in longitude to altitude plane (2D).
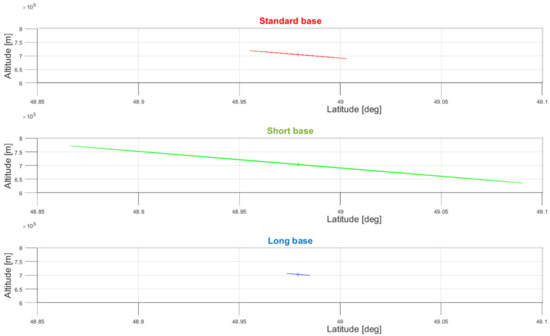
Figure 16.
Sections of error ellipsoids in latitude to altitude plane (2D).
Plotting the error ellipsoids in one common 3D plot would make the situation opaque and its evaluation even more complicated. Therefore, it is represented in three separate graphs, one for each deployment, and displayed in one plane. Using a single-plane view shows the error ellipsoid in 2D, rather than 3D, describing the error of the corresponding selected plane in two coordinates. The error ellipses are thus presented in the following planes: longitude to latitude (Figure 14), longitude to altitude (Figure 15), and latitude to altitude (Figure 16).
The effect of the ESM MLAT system deployment (baseline lengths) on the SAR emitter position detection error is evident from the error ellipse figures for all three selected planes. The error increased substantially when the base length was shortened by approximately one-half of the standard configuration. This is clear from the error ellipse semi-axes ratios for the standard configuration (red) and the long configuration (green). On the contrary, there was a significant shortening of the error ellipses semi-axes ratios in the long configuration (blue) compared to the standard configuration (red), when the baseline length of the ESM MLAT system was twice as long as the standard baseline.
From Table 2 and Figure 11, Figure 12, Figure 14, Figure 15 and Figure 16, it is clear that for all three configurations (short, standard, and long) the error ellipsoid had an extremely large eccentricity, as the semi-axis A was disproportionately larger than B and C as shown in Table 2.

Table 2.
Error ellipsoid semi-axes size for configurations short, standard, and long.
The extremely large eccentricity of the error ellipsoid for all three configurations (short, standard, large) is due to the sizes of the baselines (see Table 1). The baselines appear to be very small (from 7.48 to 37.31 km) compared to the target distance (935 km [6]). Due to the extreme eccentricity, the error ellipsoid appears to be a line segment in Figure 11, Figure 12, Figure 14, Figure 15 and Figure 16, although it really is an ellipse (ellipsoid).
The error ellipsoids have almost the same orientations/slopes in all three configurations (see Table 3). This is due to the fact that the three configurations differed only in the baseline length, with C being the same (see Figure 9) and the angle of deployment (see Figure 6) also being almost identical.

Table 3.
Error ellipsoid orientation for all 3 configurations—short, standard and long.
Therefore, it can be concluded that for all three configurations of the ESM MLAT system, the largest error is defined by the semi-axis A, and from the observer’s point of view (i.e., the location of the ESM MLAT system), this error appears to be a distance error. Specifically, for the standard configuration, this error was 77.1 km (2 × 38,565 m), for the short configuration the error was 3549 km, and for the long configuration, the error was 19 km. From these results, it can be assumed that by doubling the baseline the accuracy increases more than four times.
5. Conclusions
To sum up the results, it was possible to determine the position of a spaceborne SAR in an LEO orbit using an ESM MLAT system deployed on the ground surface (for example at an altitude of 702 km above sea level (Sentinel-1)) and to express a positioning error (Table 2). This positioning error depends on the accuracy of the TOA measurement (Section 4.1) and on the relative position of the ESM MLAT system (the ESM sensors/receivers) and the SAR emitter (Section 4.2). This positioning error was expressed by an error ellipsoid with a large eccentricity. The large eccentricity was caused by the large distance of the target compared to the relatively short and shallow baseline (Section 4.3). From the point of view of an observer who is located at the ESM MLAT system, the biggest positioning error is always a distance error, which completely corresponds to the size of semi-axis A. According to the performed derivations, the distance error was 77.1 km for the standard configuration (see Figure 6 and Table 1). However, this error can be decreased by extending the baseline. The accuracy increased more than four times when the baseline was increased only two times.
However, by extending the baseline the POI of the ESM MLAT system decreased (Section 3) which is an unacceptable approach for all ESM systems. Therefore, the baseline cannot be extended indefinitely and another way of increasing the accuracy, respectively, reducing the distance error should be sought.
It is, therefore, proposed to apply the laws of celestial mechanics to the spaceborne SAR tracking algorithm. This topic is going to be addressed in the next paper.
This approach minimizes the price for spaceborne SAR situation awareness and at the same time, it offers covert monitoring of these types of targets.
Author Contributions
Conceptualization, D.N.; methodology, J.V.; software, L.G.; validation, D.N. and J.V.; formal analysis, D.N.; investigation, D.N.; resources, D.N.; data curation, D.N.; writing—original draft preparation, D.N.; writing—review and editing, D.N.; visualization, D.N.; supervision, J.V.; project administration, D.N.; funding acquisition, D.N. All authors have read and agreed to the published version of the manuscript.
Funding
This research received no external funding.
Data Availability Statement
The data presented in this study are openly available in [6].
Conflicts of Interest
The authors declare no conflict of interest.
References
- Kennewell, J.A.; Vo, B. An overview of space situational awareness. In Proceedings of the 16th International Conference on Information Fusion, Istanbul, Turkey, 9–12 July 2013; pp. 1029–1036. [Google Scholar]
- Ionescu, L.; Rusu-Casandra, A.; Bira, C.; Tatomirescu, A.; Tramandan, I.; Scagnoli, R.; Istriteanu, D.; Popa, A.-E. Development of the Romanian Radar Sensor for Space Surveillance and Tracking Activities. Sensors 2022, 22, 3546. [Google Scholar] [CrossRef] [PubMed]
- Hennessy, B.; Rutten, M.; Young, R.; Tingay, S.; Summers, A.; Gustainis, D.; Crosse, B.; Sokolowski, M. Establishing the Capabilities of the Murchison Widefield Array as a Passive Radar for the Surveillance of Space. Remote Sens. 2022, 14, 2571. [Google Scholar] [CrossRef]
- Liu, M.; Wang, H.; Yi, H.; Xue, Y.; Wen, D.; Wang, F.; Shen, Y.; Pan, Y. Space Debris Detection and Positioning Technology Based on Multiple Star Trackers. Appl. Sci. 2022, 12, 3593. [Google Scholar] [CrossRef]
- Losacco, M.; Schirru, L. Orbit Determination of Resident Space Objects Using the P-Band Mono-Beam Receiver of the Sardinia Radio Telescope. Appl. Sci. 2019, 9, 4092. [Google Scholar] [CrossRef]
- Novák, D.; Gregor, L. Detection and Tracking of SAR Satellites by Multilateration Passive Surveillance System: 7th ESA Workshop on RF and Microwave Systems, Instruments & Sub-Systems + 5th Ka-Band Workshop. 2022. Available online: https://atpi.eventsair.com/QuickEventWebsitePortal/arsi-keo/website (accessed on 25 May 2022).
- Reggiannini, M.; Bedini, L. Multi-Sensor Satellite Data Processing for Marine Traffic Understanding. Electronics 2019, 8, 152. [Google Scholar] [CrossRef]
- Cho, T.; Lee, C.; Choi, S. Multi-Sensor Fusion with Interacting Multiple Model Filter for Improved Aircraft Position Accuracy. Sensors 2013, 13, 4122–4137. [Google Scholar] [CrossRef] [PubMed]
- Ai, L.; Pang, M.; Shan, C.; Sun, C.; Kim, Y.; Zhou, B. A Novel Joint TDOA/FDOA Passive Localization Scheme Using Interval Intersection Algorithm. Information 2021, 12, 371. [Google Scholar] [CrossRef]
- Hubáček, P. The error estimation and ambiguity of solution of 2-D time difference of arrival localization method. In Proceedings of the 2012 13th International Radar Symposium, Warsaw, Poland, 23–25 May 2012; pp. 411–418. [Google Scholar] [CrossRef]
- Hubáček, P.; Veselý, J.; Olivová, J. Radar Position Estimation by Sequential Irradiation of ESM Receivers. Sensors 2021, 21, 4430. [Google Scholar] [CrossRef] [PubMed]
- The European Space Agancy. 2021. Available online: https://dragon3.esa.int/web/sentinel/user-guides/sentinel-1-sar/acquisition-modes/extra-wide-swath (accessed on 15 February 2022).
- The European Space Agancy. 2021. Available online: https://sentinels.copernicus.eu/web/sentinel/user-guides/sentinel-1-sar/acquisition-modes/extra-wide-swath (accessed on 17 February 2022).
- Sun, J.; Yu, W.; Deng, Y. The SAR Payload Design and Performance for the GF-3 Mission. Sensors 2017, 17, 2419. [Google Scholar] [CrossRef] [PubMed] [Green Version]
- Kuptsov, V.; Badenko, V.; Ivanov, S.; Fedotov, A. Method for Remote Determination of Object Coordinates in Space Based on Exact Analytical Solution of Hyperbolic Equations. Sensors 2020, 20, 5472. [Google Scholar] [CrossRef] [PubMed]
- ERA a.s. Technical documentation—EG110A003041. The Czech Republic. 2011. Available online: https://www.era.aero/cs/o-nas/dokumentace/EG110A003041 (accessed on 10 January 2014).
- Veselý, J.; Hubáček, P.; Olivová, J. The Power Gain Difference Method Analysis. Sensors 2020, 20, 3018. [Google Scholar] [CrossRef] [PubMed]
Publisher’s Note: MDPI stays neutral with regard to jurisdictional claims in published maps and institutional affiliations. |
© 2022 by the authors. Licensee MDPI, Basel, Switzerland. This article is an open access article distributed under the terms and conditions of the Creative Commons Attribution (CC BY) license (https://creativecommons.org/licenses/by/4.0/).