Article

Spatial Quantitative Model of Human Activity Disturbance Intensity and Land Use Intensity Based on GF-6 Image, Empirical Study in Southwest Mountainous County, China

1
School of Geomatics and Urban Spatial Informatics, Beijing University of Civil Engineering and Architecture, Beijing 102616, China
2
School of Information Engineering, China University of Geosciences, Beijing 100083, China
*
Author to whom correspondence should be addressed.
Remote Sens. 2022, 14(18), 4574; https://doi.org/10.3390/rs14184574
Submission received: 12 August 2022 / Revised: 4 September 2022 / Accepted: 8 September 2022 / Published: 13 September 2022

Abstract

:
Vigorous human activities have strengthened the development and utilization of land, causing huge damage to the earth’s surface, while mining the disturbance pattern of human activities can capture the influence process and spatial interaction between human activities and land use. Therefore, in order to explore the inherent relationship between human activities and land use in mountainous counties, a spatial quantitative model of human activity disturbance intensity and land use intensity was proposed based on GF-6 image, traffic data, and socioeconomic data. The model can quantitatively evaluate the disturbance intensity of human activity and land use intensity from “production-living-ecological space”, and unfold the correlation between human activity disturbance intensity and land use intensity with Pearson correlation coefficient and bivariate spatial autocorrelation method. Our study presents several key findings: (1) the spatial difference of human activity disturbance is significant in Mianzhu City, and it has steady aggregation (Moran’s I index is 0.929), showing a decreasing trend from the southeast to the northwest area; (2) there is a strong positive correlation between the disturbance intensity of human activity and the intensity of land use with Pearson value 0.949; (3) among the eight selected factors, the proportion of construction land area plays a leading role in the disturbance intensity of human activity in Mianzhu City, while the township final account data have the least impact. The study results can provide an important reference for the quantitative identification and evaluation of human disturbances in similar cities and the coordinated development of the human–land relationship.

1. Introduction

With the rapid development of social economy and Information Communication Technology (ICT), the data about human activities have been sharply increasing in the big data era. With the common sense, the increased human activities can have an impact on the environment, society, and economy. For example, it can lead to land use and land change (LULC) and forest land area reduction. How to influence these phenomena and what are the spatial patterns have attracted a lot of attention from business and academic industries [1,2] for the western mountain area of China, which has a more fragile ecological environment and terrain elevation. That is, this area is vulnerable to various negative impacts caused by human activities [3].
The relationship between human activities and land use, ecological changes in scale, intensity, and time has been obtained through a large number of studies, which is of great significance for preventing possible ecological threats [4,5]. However, the attention has been put on the large-scale area, such as plains, oceans, and wetlands [6,7,8]. Owing to the spatial fragmentation and terrain factors, these methods cannot directly be applied in small mountain areas. Another thing to capture relationships is the land use intensity. Traditional studies focus on land use class, carbon emissions, urbanization, and land use change [9,10,11]. However, few works explore the internal relation between the disturbance intensity of human activity and land use intensity. This gap presents new opportunities for our study.
The disturbance intensity of human activities and land use has been analyzed in many studies, but they all ignored important economic factors. The human activity disturbance intensity refers to the disturbance degree of the ecological environment in a certain area affected by human activities [12]. Land use data contain rich information about human activities; therefore, it can indirectly reflect the human activity disturbance intensity on the ecosystem [13]. Among them, the method of quantitatively evaluating the intensity of human activity through land use/change data is a widely used method [14]. Based on the landscape development intensity index, Reiss et al. reflected the disturbance degree of human activity to the environment by calculating the energy of a certain land use type per unit time and unit area [15]. Cui et al. evaluated the human disturbance index of the landscape type, and systematically evaluated the dynamic change characteristics in the coastal wetlands of northern Jiangsu [16]. In order to quantitatively analyze the disturbance intensity of human activities on the Loess Plateau, Xu et al. proposed a land surface human activity intensity index. Based on the equivalent of construction land, the method assigns corresponding equivalent conversion coefficient of construction land to different land use types [17]. The above studies were carried out from the perspective of land use and landscape, without combining the local economic statistic data. Therefore, the results are not accurate enough.
When considering more factors, the weight determination method has been another crucial research issue. The weight plays an important role in evaluating disturbance and relationship. The weight of each index can be determined in a subjective or objective method. However, the more practical method is proportionally assigned, which is widely used [18]. North et al. used the karst disturbance index combined with the GIS method to measure the impact of human disturbance on the environment in the karst area [19]. Halpern et al. assessed the cumulative impact of human activities on a global scale by a multi-scale spatial model from 2008 to 2013 [20]. He et al. explored the human development index in the China bay area by integrating four human pressures (population, land use, transportation, and energy) [21]. However, these works ignored the human activities factor and related ecological factors. Thus, it is difficult to show the spatial distribution of human disturbance intensity within the administrative area.
To address the aforementioned gap on a small mountain area considering more factors, a spatial quantitative model of human activity disturbance intensity and land use intensity based on GF-6 Image was investigated, and empirical work was done in Mianzhu City, Sichuan Province, in the mountainous area of western China. The grid-based spatial units were employed in order to capture a fine-grained spatial pattern. Inspiring from the concept of “production-living-ecological space (PLES)”, eight factors including agricultural expenditure, population size, and so on were involved to evaluate the human activity disturbance intensity. The spatial correlation with land use was examined with Pearson’s correlation coefficient method and Moran’s bivariate spatial group correlation method. The main contributions of our work include: (1) a spatial evaluation model was investigated considering more factors with the concept of the PLES, which can promote the evaluation accuracy; (2) an empirical work was carried out in the southwestern mountain county in China; and (3) the importance of eight factors was validated. This work carried out a more objective and comprehensive quantitative analysis on human activity disturbance intensity and land use intensity in mountainous counties. The study results can provide reference for the rational planning and developing of land use and ecological environment protection on the county scale.

2. Materials and Methods
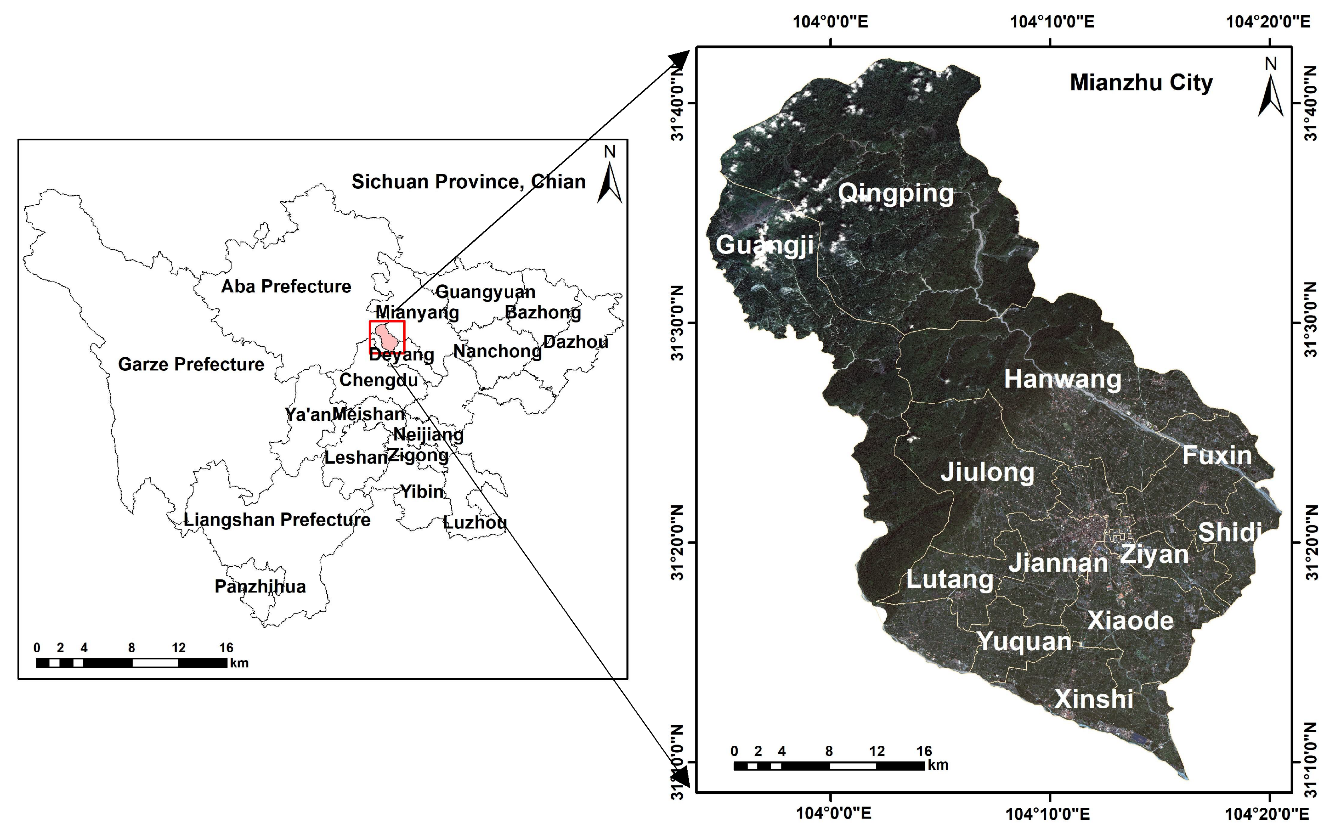
2.1. Study Area

Mianzhu City is located in Sichuan Province, southwestern China, and the northwestern part of Sichuan Basin (31°09′–31°42′N, 103°54′–104°20′E). Its location is shown in Figure 1. Mianzhu City covers an area of 1245 square kilometers and has 2 communities and 10 towns within its jurisdiction. It stretches from the northwest to the southeast, with a width of about 42 km from east to west and a length of about 61 km from north to south. The terrain is high in the northwest and low in the southeast, with a huge difference in height. The northwest is mountainous, and the southeast is a plain, which gradually slopes from northwest to southeast. The altitude ranges from 504 m to 4405 m. According to the seventh census of China, the resident population of Mianzhu was 439,958. Communities in the southeast are densely populated, and the northwest is sparser. The land use status of Mianzhu City is dominated by forest land, followed by cultivated land, and construction land accounts for less than 20%. The economy of Mianzhu City is developing continuously. In 2020, Mianzhu achieved a gross regional product (GDP) of 35.405 billion yuan, a year-on-year increase of 3.2% based on comparable prices.

2.2. Data Sources

The piece of remote sensing data used in this study was an GF-6 image acquired in August 2020. Its multispectral spatial resolution of GF-6 is 8 m. The administrative division data were obtained from the Resource and Environmental Science and Data Center of the Chinese Academy of Sciences (https://www.resdc.cn/, accessed on 23 May 2022), and its data type is vector data. The vector point data for the township administrative divisions were converted from the administrative division codes obtained from the Ministry of Civil Affairs of China (https://www.mca.gov.cn/, accessed on 25 May 2022). The number of enterprises with an annual income of greater than 2 million and the number of large supermarkets were obtained from the “China County Statistical Yearbook Township Volume”. The agricultural expenditure data, township financial income data, and population data were obtained from the official website of the Mianzhu Municipal People’s Government (https://www.mz.gov.cn/, accessed on 25 May 2022). Based on the above data, we can obtain the eight influencing factors that were used to extract human activity disturbance intensity in our study. The detailed descriptions of the data sources are displayed in Table 1.

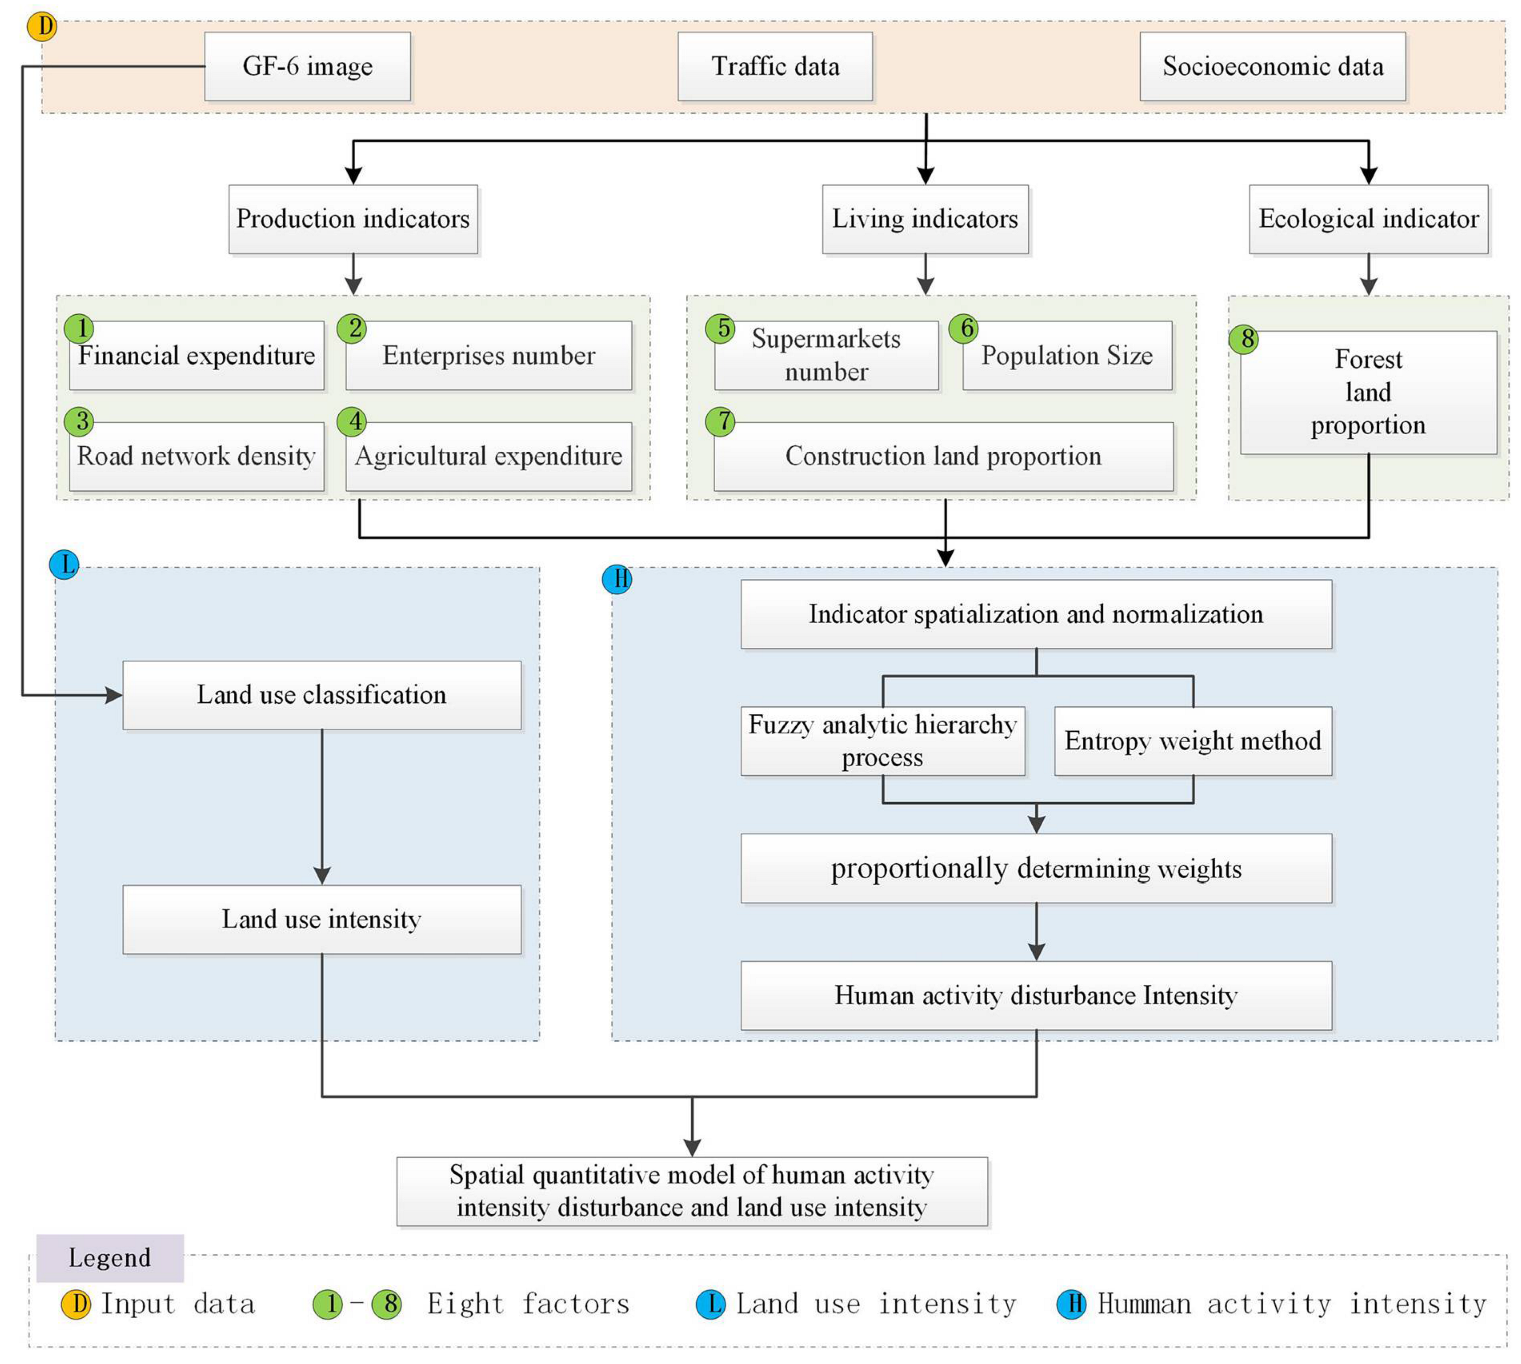
2.3. Spatial Quantitative Model of Human Activity Disturbance Intensity and Land Use Intensity

2.3.1. Framework of the Spatial Quantitative Model

The framework of spatial quantitative analysis model is shown in Figure 2. The GF-6 image, traffic data, and socioeconomic data were the input data source. A suit of spatial quantitative factors for human activity disturbance was determined based on the concept of the PLES [22]. All factors were calculated and normalized in spatial dimension in this study. Secondly, the weight of each factor is determined by combining the fuzzy analytic hierarchy process and the entropy weight method. Therefore, a quantitative evaluation model of the human activity disturbance was inferred with integrating of the PLES indicators and weights. Herein, the spatial difference of human activity disturbance intensity was also evaluated by statistics and spatial analysis methods. To capture the spatial pattern between human activities and land use, the land use intensity was evaluated with a GF-6 image. Meanwhile, their spatial interaction was also thoroughly discussed.

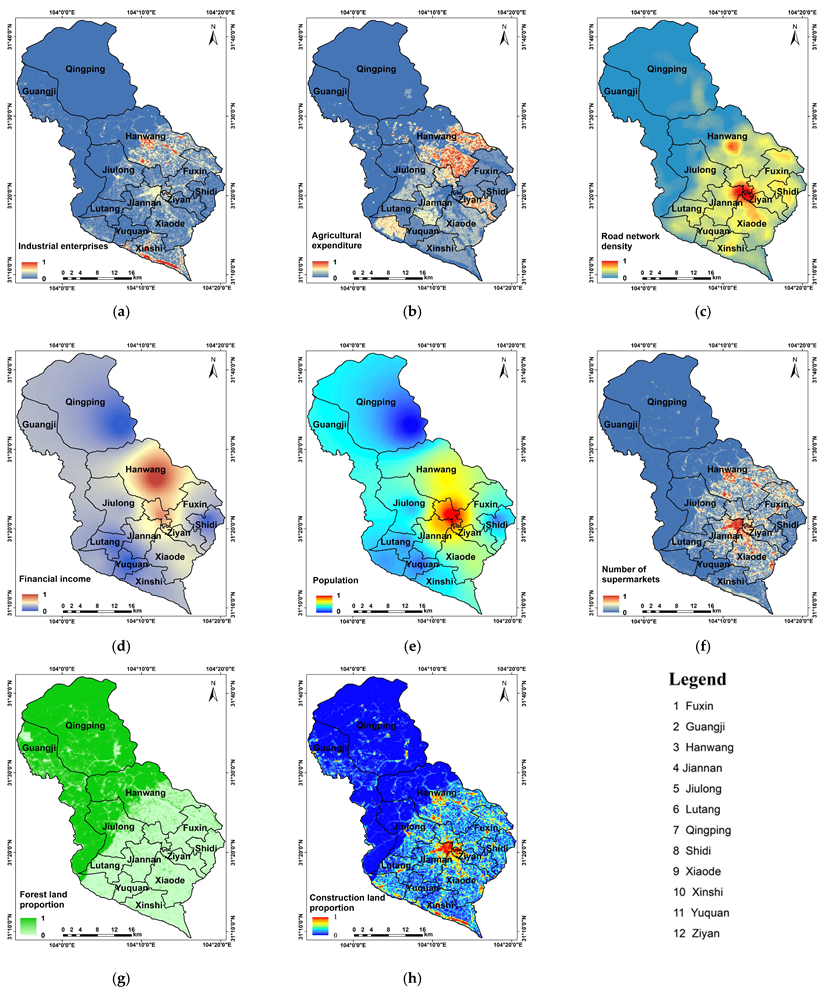
2.3.2. Human Activity Disturbance Evaluation Factors

The human activity disturbance evaluation index system includes a target layer, a criterion layer, and a factor layer. The target layer is the human activity disturbance intensity, which reflects the disturbance intensity of the human activity on the ecological environment in the study area. The criterion layer combines the idea of the PLES, including three indicators of production, living, and ecological. The factor layer consists of the sub-indices corresponding to the three indicators in the criterion layer. The production indicators at the standard level in this study were the enterprises number, agricultural expenditure, road network density, and final account expenditure; the living indicators were the population, the proportion of construction land, and the number of large supermarkets; and the ecological indicator was the proportion of forest land:
  • Production indicators;
(a)
Enterprises number
The average number of industrial enterprises, that is, the number of industrial enterprises per unit of construction land area (the annual main business income of the enterprise is 2 million yuan and above), reflects the industrial carrying strength of the construction land; and to some extent, it can reflect the disturbance intensity of human activity caused by industrial activities. Referring to the literature [23], the calculation formula is as follows:
Q j = P 1 j A 1 j
where Qj is the number of industrial enterprises in the j cell grid, P1j is the number of industrial enterprises in the township where the j cell grid is located, and A1j is the proportion of the building land area in the cell grid to the cell area.
(b)
Agricultural expenditure
Agricultural expenditure per unit area refers to the agricultural expenditure per unit area of arable land. This factor can reflect the degree of regional agricultural development, mainly reflecting the human activity disturbance intensity caused by agricultural activities. Referring to the literature [23], the calculation formula can be obtained as follows:
N j = P 2 j A 2 j
where Nj is the agricultural expenditure of the j cell grid, P2j is the agricultural expenditure of the township where the j cell grid is located, and A2j is the proportion of cultivated land in the cell grid to the cell area.
(c)
Road network density
The road network density refers to the ratio of the total mileage of the road network in a certain area to the area of the area. The road network density reflects the influence of traffic activities, and the linear density interpolation method is generally used to calculate the road network density in the study area.
(d)
Financial income
Financial income not only reflects the economic development status of the study area, but also reflects the intensity of human activities. The township final accounts data refer to the summary of the annual revenue and expenditure in the final accounts of the budget units such as township stations managed by the township finance office at the end of the year. This study uses township final accounts data to represent financial income. Generally, the inverse distance interpolation method is used to analyze the final accounts of villages and towns.
2.
Living indicators
(a)
Population size
The population size (e.g., the density and distribution) is one of the most direct factors of human activity. Generally, the population data for each township are interpolated using inverse distance to obtain the population of each spatial unit in the study area.
(b)
Proportion of construction land
The proportion of construction land can be calculated from the land use information, which can be used for subsequent analysis and research. Referring to the literature [22,23], the calculation formula is as follows:
A 1 j = S 1 j / S j
where A1j is the ratio of the area of the construction land in the j cell grid to the cell area, S1j is the area of the construction land in the j cell, and Sj is the area of the j cell.
(c)
Supermarkets number
The number of large supermarkets per unit area can represent the comprehensive development of the population and economy in the area, and thus it reflects the disturbance intensity of human activity in the area. Referring to the literature [23], the calculation formula is as follows:
M j = P 3 j A 1 j
where Mj is the number of large supermarkets in the j cell grid, P3j is the number of large supermarkets in the township where the j grid is located, and A1j is the ratio of the construction land area in the j cell grid to the cell area.
3.
Ecological indicator
The ecological factor used in this study mainly considered the proportion of forest land. The proportion of forest land can be calculated from the land use information. These data are convenient for subsequent analysis and research. Referring to the literature [22,23], the calculation formula is as follows:
A 2 j = S 2 j / S j
where A2j is the ratio of the forest land area in the j cell grid to the cell area, S2j is the area of forest land in the j cell, and Sj is the area of the j cell.
4.
Factors normalization
To solve the problem that the dimensions of the factors are different and cannot be compared, it is necessary to normalize the factors. Common methods include the fuzzy membership method, min-max method, and Z-score method [24]. In this study, the fuzzy membership method was used to normalize each factor so that each factor was distributed within the range of (0, 1). The normalization formulas for positive factors and negative factors are as follows [25,26]:
Positive factors:
x i j = v i j ( v i j ) 1 i k m i n ( v i j ) 1 i k m a x ( v i j ) 1 i k m i n
Negative factors:
  x i j = ( v i j ) 1 i k m a x v i j ( v i j ) 1 i k m a x ( v i j ) 1 i k m i n
in these equations, xij is the normalized score of the j value of the i evaluation factor, vij is the original value of the j value of the i evaluation factor, and k is the number of evaluation factors.

2.4. Evaluation of Human Activity Disturbance Intensity

2.4.1. Fuzzy Analytic Hierarchy Process

The fuzzy analytic hierarchy process (Fuzzy–AHP) is based on the traditional analytic hierarchy process, and it considers the fuzziness of people’s judgment of complex things. It can well solve the problem that its thinking consistency is difficult to guarantee [27].
The construction steps of the fuzzy analytic hierarchy process are as follows. First, a fuzzy complementary judgment matrix is established. According to the relative importance of any two indicators on the evaluation, the target is usually given on a scale of (0.1, 0.9). The expression of fuzzy complementary judgment matrix is shown in formula (8) [28]:
A = ( a i j ) n n  
Second, calculate the weight of the fuzzy complementary judgment matrix, and the formula is shown in (9) [28]:
α i = j = 1 n a i j + n 2 1 n ( n 1 )
Finally, the consistency test of the fuzzy complementary judgment matrix is carried out.

2.4.2. Entropy Weight Method

Because the fuzzy analytic hierarchy process has strong subjectivity, it is necessary to combine the fuzzy analytic hierarchy process with the entropy weight method to determine the weight of the human activity disturbance factors [29]. Various factors have different impacts on human activities, the entropy weight method can more objectively express the degree of influence of each factor by providing the weight of each factor [30]. Specifically, according to the dispersion degree of each factor dataset, the entropy weight of each factor is calculated using the information entropy, and then the entropy weight is corrected according to each factor to obtain a more objective factor weight [26].
In this study, the information entropy of each factor is calculated firstly [30]. If the evaluation system contains m items to be evaluated and the factor system contains n evaluation factors, the information entropy of the i factor is
e i = k i = 1 m p i j ln p i j
where the constant k is taken as 1/ln m, 0 ≤ e i   ≤ 1.
The difference coefficient of the i factor is
g j = 1 e , j = 1 , 2 , 3 , , n
The weight of the i factor is
β i = 1 e i i = 1 n ( 1 e i ) , i = 1 , 2 , , n

2.4.3. The Weights Determination

To determine the weights of the evaluation model of human activity disturbance intensity more reasonably, in this study, a combination of fuzzy analytic hierarchy process and entropy weight method weighting was used. Thus, both the subjective experience of experts and the objective information in the data were considered, fully reflecting the importance of the evaluation factors [29].
The combined weight of the i factor is
W h i = α i β i i = 1 n α i β i
where Whi is the subjective weight, αi is the subjective weight, and βi is the objective weight.
The final factor weights obtained using the combination weighting method are presented in Table 2.

2.4.4. Human Activity Disturbance Intensity Calculation

In this study, the data for the human activity disturbance evaluation factors were unified into 250 m grid data and were weighted and superimposed according to the weights to establish a human activity disturbance spatial quantification model for the study area (Equation (12)) [31]. The value of the human activity disturbance intensity is between (0, 1), where a value of 1 indicates the strongest action intensity, and a value of 0 indicates that the action intensity is small and can be ignored:
H j = i = 1 8 ( x i j × W h )
where Hj is the intensity of the human activity in the j cell grid, xij is the standardized value of the eight indicators, and Wh is the weight of the eight indicators.

2.5. Correlation Analysis between Human Disturbance Intensity and Land Use Intensity

Inspired from literature [32], the Pearson correlation coefficient method was also adopted to analyze the correlation between human activity disturbance intensity and land use intensity. The value of the Pearson correlation coefficient is between (−1, 1), with positive values indicating that there is a positive spatial correlation between human activity disturbance intensity and land use intensity, and negative values indicating that there is a negative spatial correlation between human activity disturbance intensity and land use intensity. The larger the value, the stronger the correlation. Its calculation formula is as follows:
R = i = 1 n ( x i x ¯ ) ( y i y ¯ ) i = 1 n ( x i x ¯ ) 2 i = 1 n ( y i y ¯ ) 2
where R is the Pearson correlation coefficient of human activity disturbance and land use intensity, n is the number of grids, x and y are the disturbance of human activity and land use intensity, xi is the x of the i cell grid, x ¯ is the average value of x; yi is the y of the i cell grid; y ¯ is average value of y, and n is number of grids.
We used spatial bivariate autocorrelation analysis to explore the spatial agglomeration between human activity disturbance intensity and land use intensity in this study. To calculate the spatial autocorrelation index of human activity disturbance intensity and land use intensity, Equation (14) was used, and the Local Moran’s I (LISA) method was used for local autocorrelation analysis [33]. The LISA agglomeration map includes four spatial distribution patterns, namely, high-high agglomeration (HH agglomeration), high-low agglomeration (HL agglomeration), low-high agglomeration (LH agglomeration), and low-low agglomeration (LL agglomeration), which represent the relationship between each cell and different correlations of surrounding units:
I = n i = 1 n j = 1 n w i j ( y i m y m ¯ ) ( y j z y z ¯ ) ( i = 1 n j = 1 n ) i = 1 n w i j ( y i m y m ¯ ) ( y j z y z ¯ )
where I is the bivariate global spatial autocorrelation index; n is the number of grids; wij is the spatial weight; y i m , y j z is the m attribute value of the i cell grid and the z attribute value of the j cell grid; y m ¯ , y z ¯ are the mean values of attributes m and z, n is number of grids.

3. Results

3.1. Human Activity Disturbance Factors Analysis

Figure 3 shows the spatial quantification results of the human activity disturbance factors in Mianzhu City. As shown in Figure 3a, the large industrial enterprises in the study area were mainly concentrated in Hanwang Town and Xinshi Town rather than in the central town of Mianzhu City. As the central urban area of Mianzhu City, the industrialization level of Jiannan Community and Ziyan Community is at a moderate level. The number of large-scale industrial enterprises in Fuxin Town, Xiaode Town, and Jiulong Town was slightly less than that in the central urban area, while the numbers of large-scale industrial enterprises on the other communities and in the other towns were relatively small. In general, the industrially developed areas in Mianzhu were concentrated in the southeast and around the city’s center.
As can be seen from Figure 3b, the agricultural activities were generally distributed in the peripheral towns around the central urban area. The intensity of the agricultural activity was low in the northwest and high in the southeast, corresponding with the spatial distribution of the cultivated land in the study area. The northwestern part of the study area was dominated by mountains and hills, with small scattered areas of cultivated land. In the southeast, the terrain was dominated by plains. Except for the downtown area, the cultivated land was concentrated and widely distributed, and the agricultural activities were intense.
As shown in Figure 3c, the road network in the study area was concentrated in the more developed southeastern area, especially in the city’s center and the areas with more developed industries, but it was relatively sparse in the northwestern area. In the other parts of the study area, the road network was more evenly distributed.
As shown in Figure 3d, Hanwang Town, Ziyan Community, and Jiannan Com-munity had the highest financial income data of the towns and townships in Mianzhu City, while the township financial income data for Lutang Town, Shidi Town, Yuquan Town, and Qingping Town were the lowest, and the other towns and townships were in the middle. This indicates that the economies of Hanwang Town, Ziyan Community, and Jiannan Community were relatively developed, and the development status was far higher than in the other towns.
According to Figure 3e, the population distribution was roughly the same as that of the township final account data. The population densities of Hanwang Town, Ziyan Community, and Jiannan Community were relatively dense, while the population densities of Lutang Town, Shidi Town, Yuquan Town, and Qingping Town were relatively sparse. Therefore, it can be seen that the population and economic development are inseparable.
As shown in Figure 3f, the number of large supermarkets in Mianzhu decreased from the central urban area to the surrounding areas and was basically greater in the southeastern part of the area. The distribution of large supermarkets is roughly the same as population and financial income, indicating a close link between the three above.
As can be seen from Figure 3g, the proportion of forestland in Mianzhu City exhibited an obvious distribution boundary, with an obvious dividing line between the northwest and southeast areas. The northwest area was mountainous and hilly, with lush vegetation and a wide distribution area. In contrast, the southeast area was plain, which was suitable for crop growth and human survival. Therefore, the forest land was sparse and small, which was seriously restricted by the terrain.
As can be seen from Figure 3h, due to the constraints of the topographical conditions, the construction land in Mianzhu City was mainly concentrated in the southwestern area, mainly on Ziyan Community and Jiannan Community, followed by Hanwang Town and Xinshi Town, where the industrial enterprises were more developed. The rest of these areas were affected by the radiation of developed areas. In the northwestern area, the distribution of the construction land was very scattered and the area was very small.

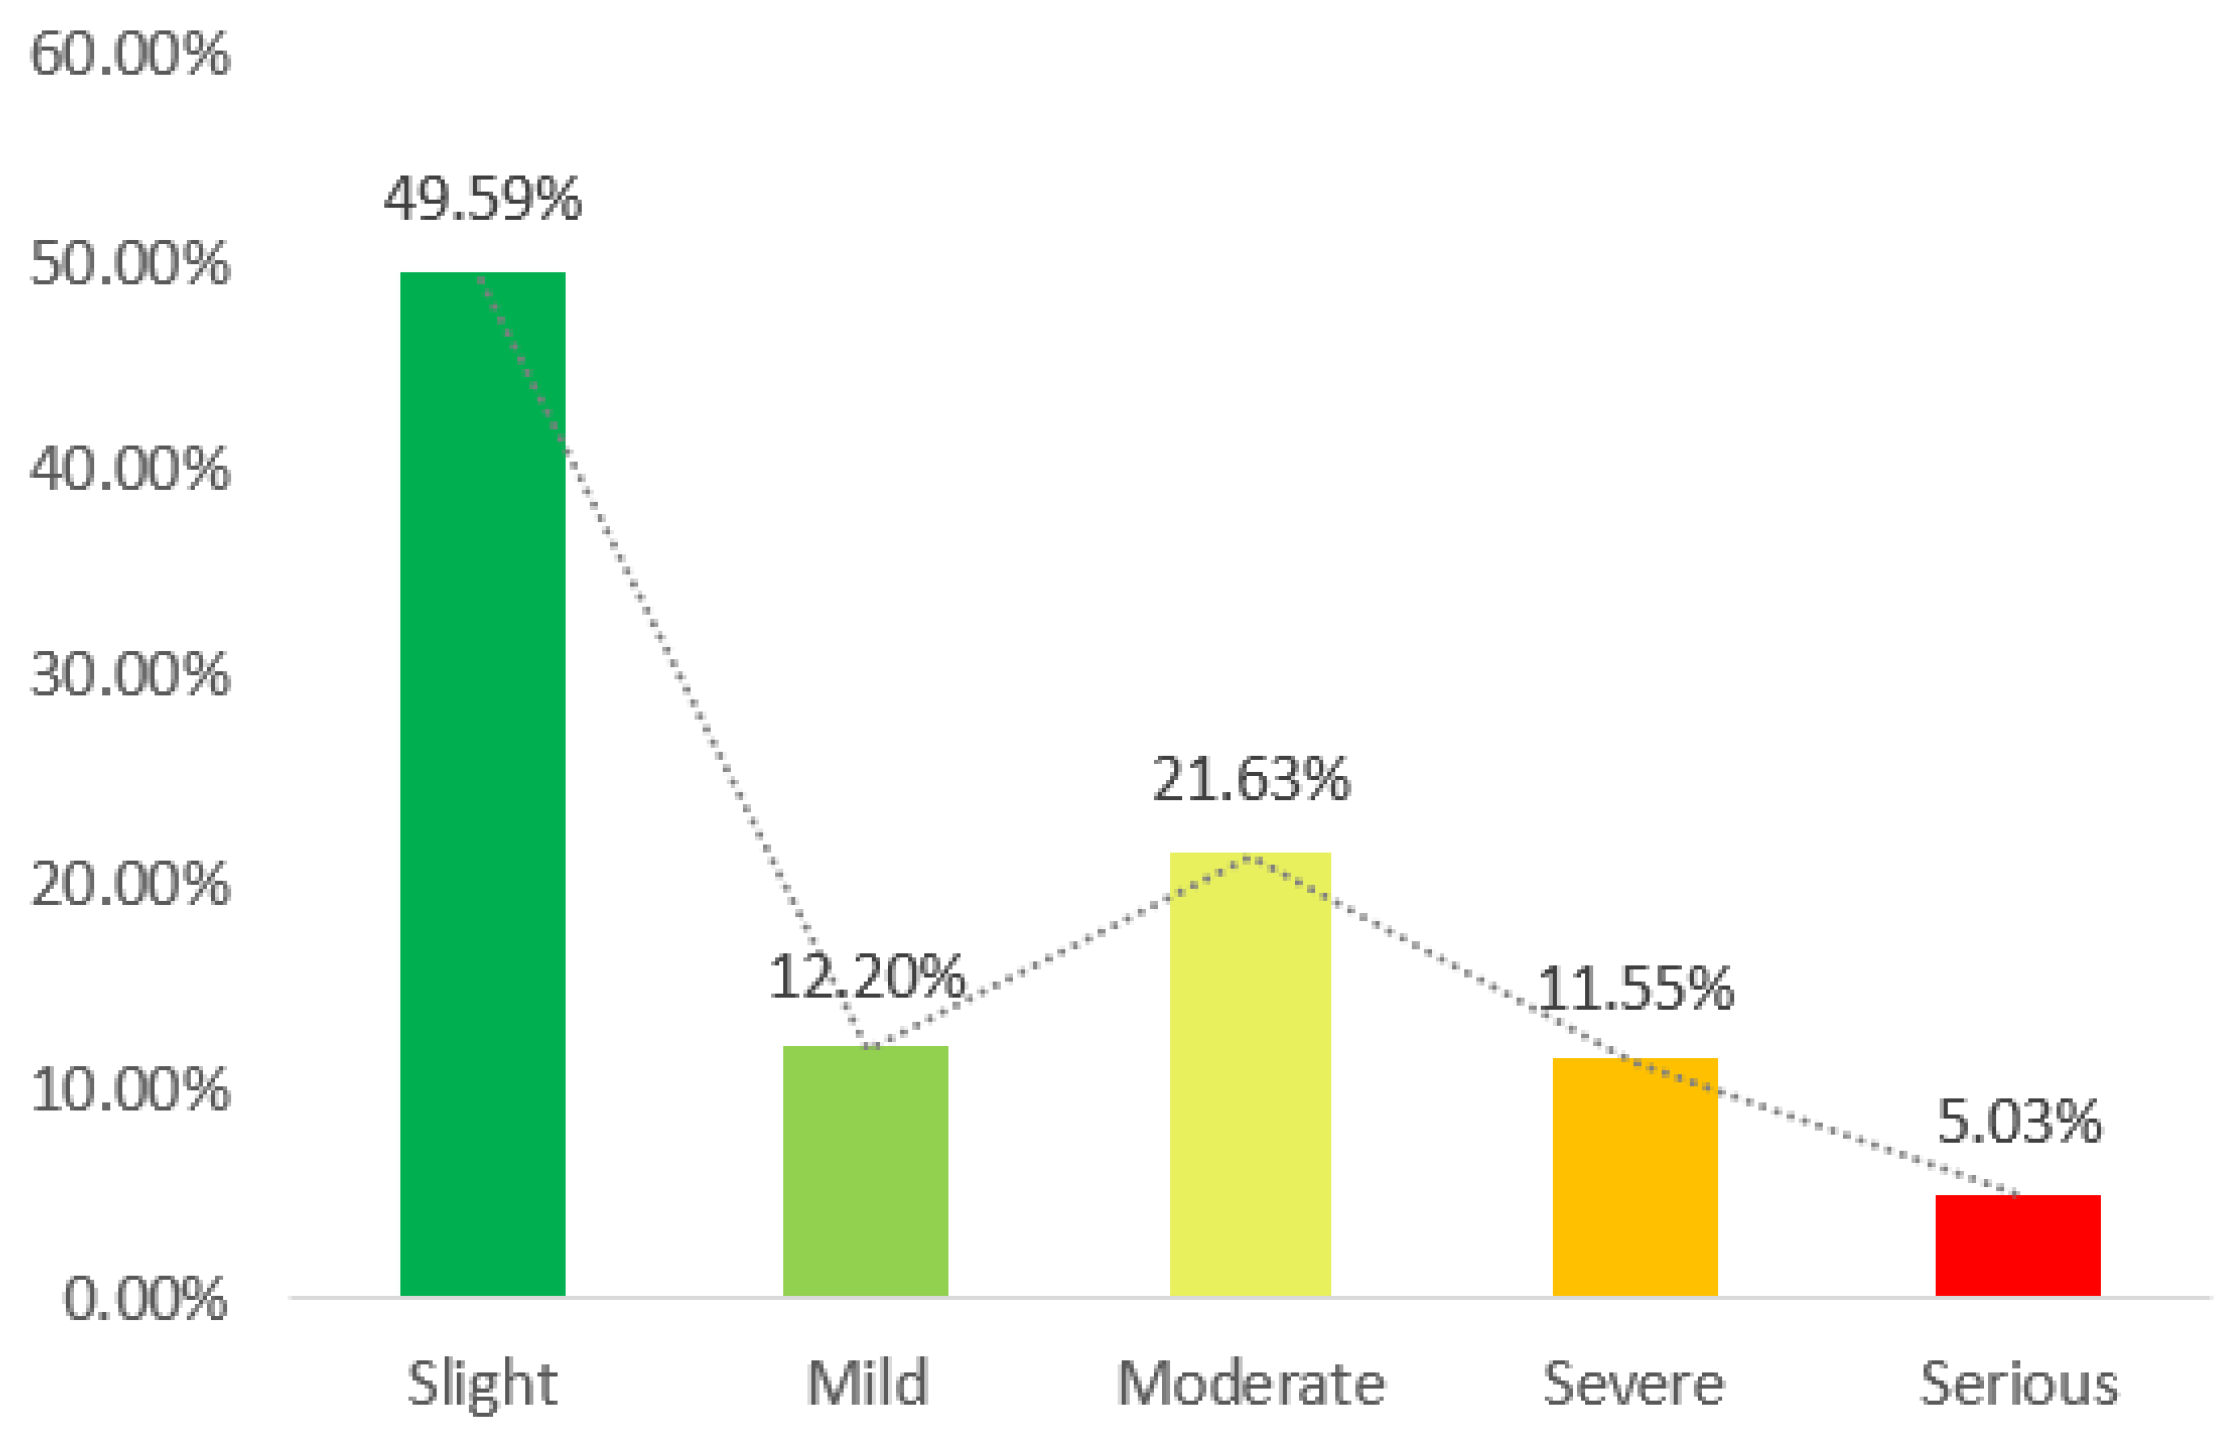
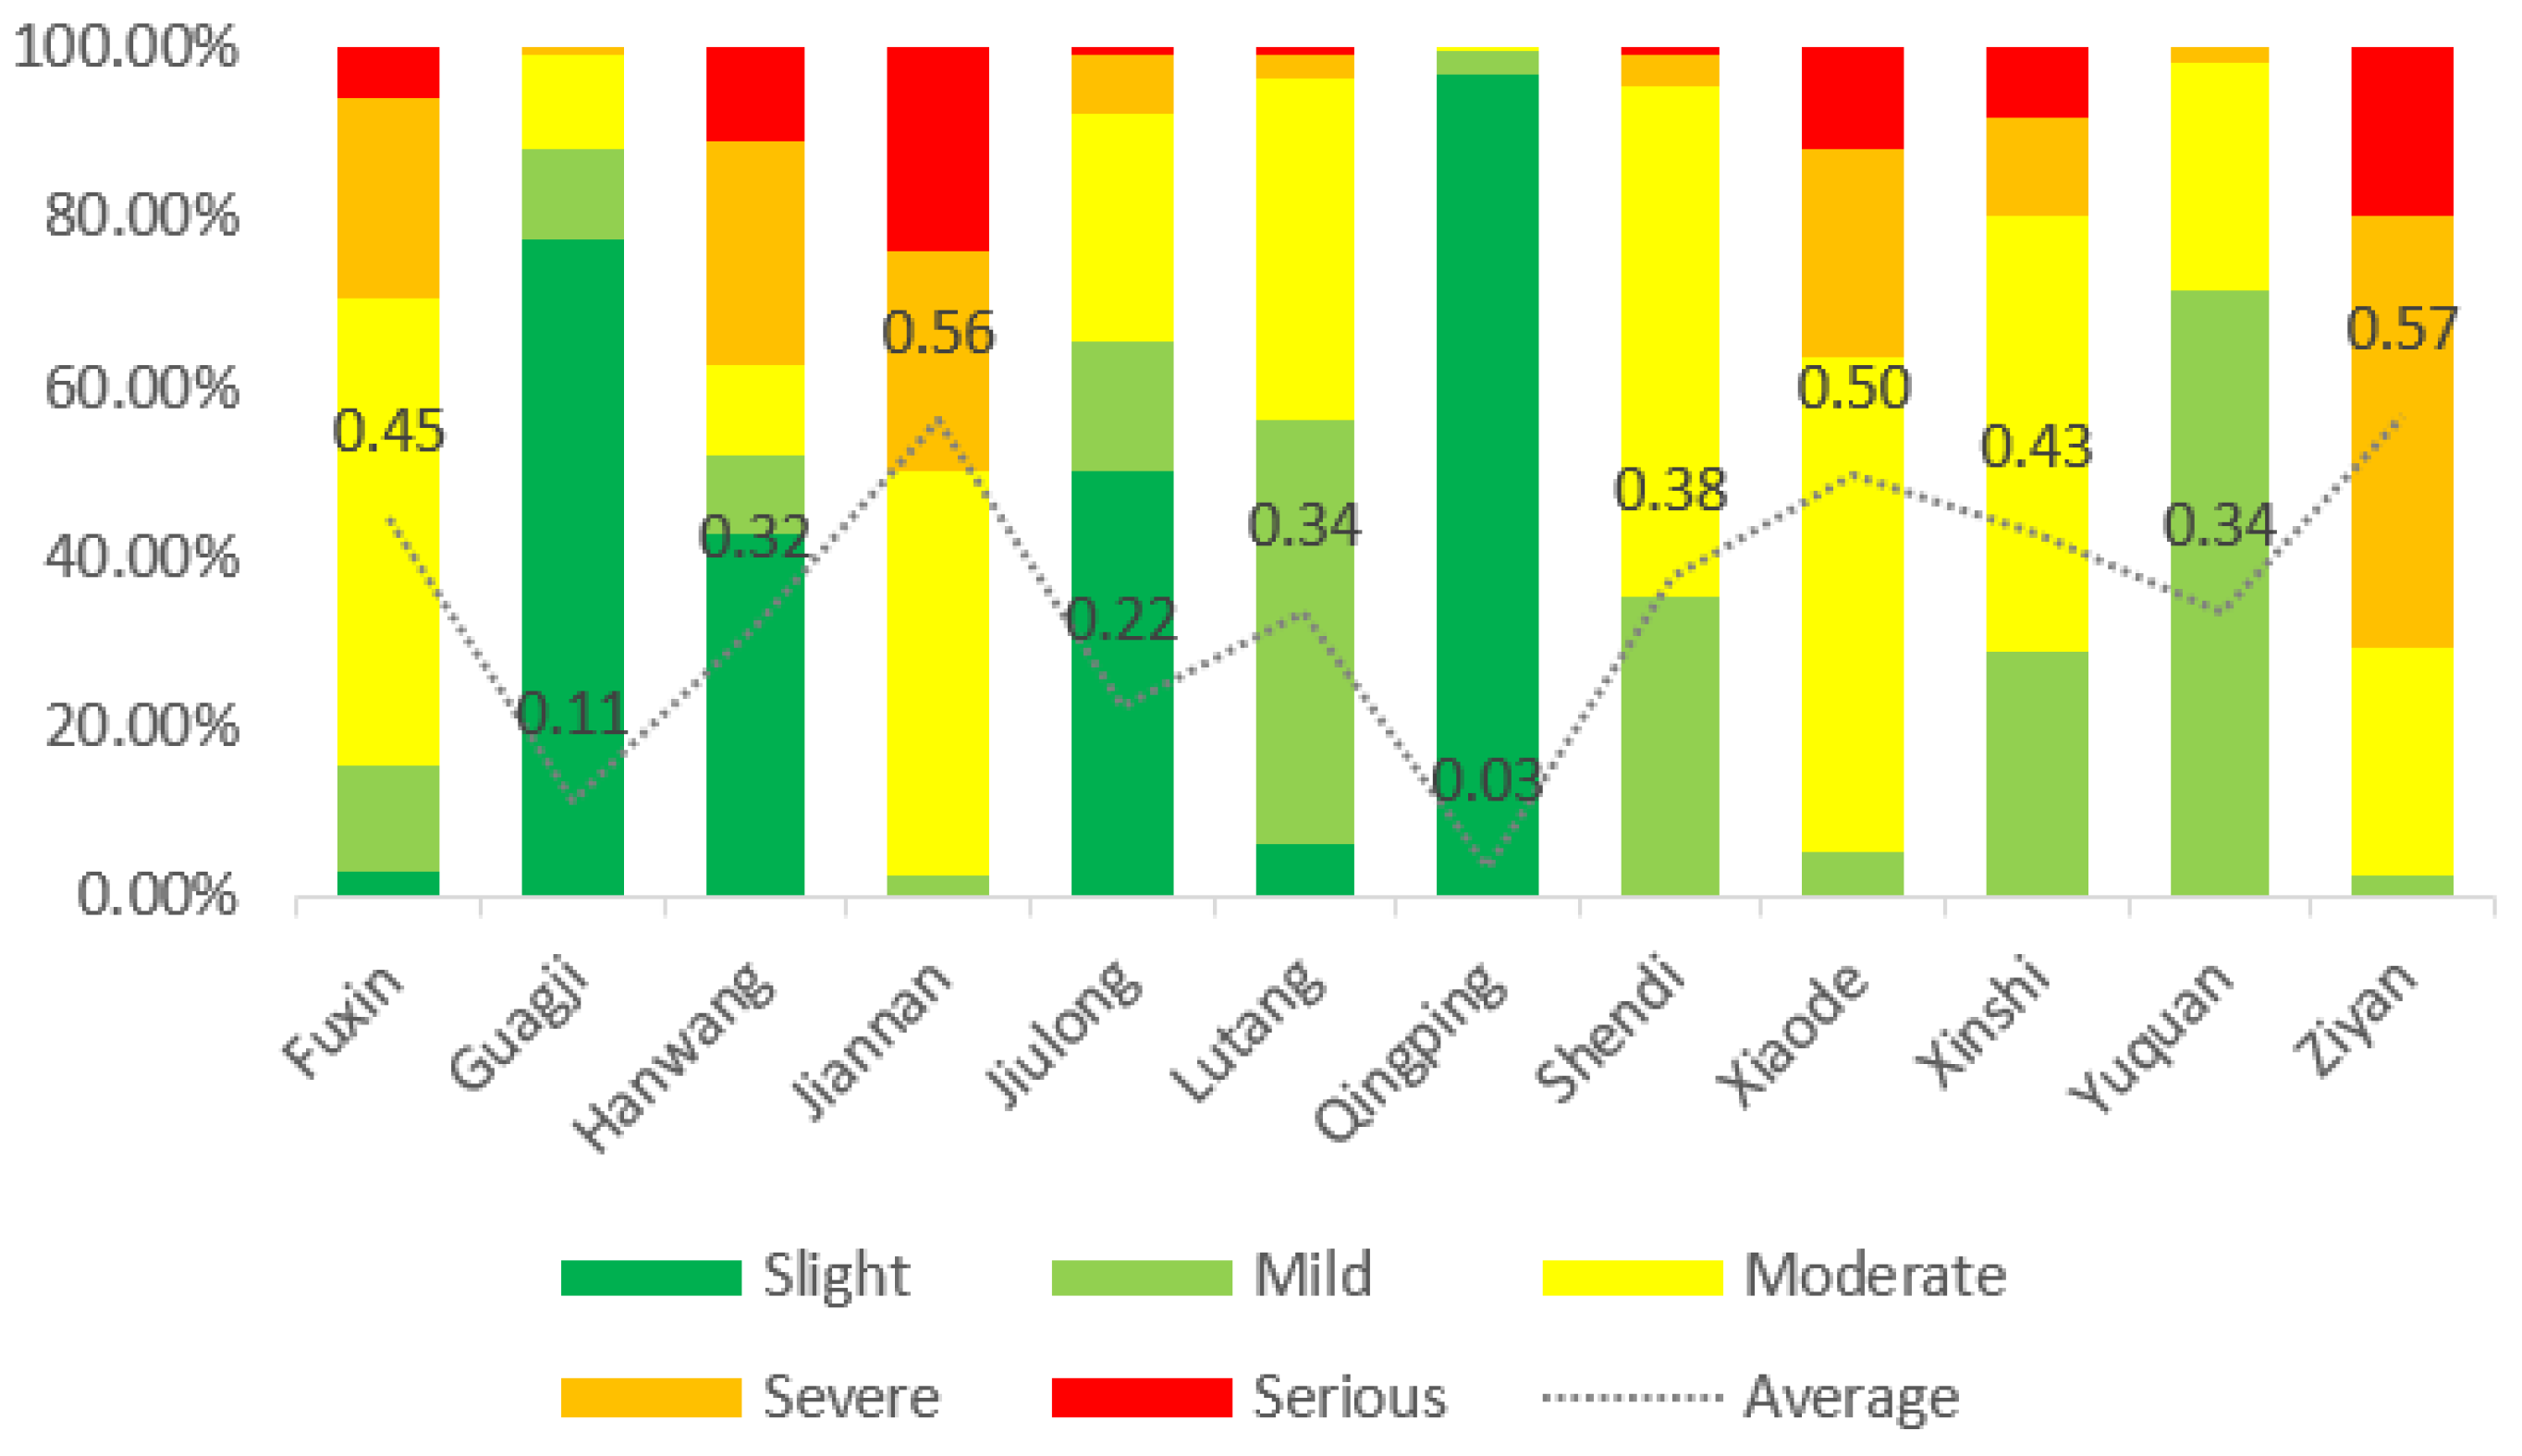
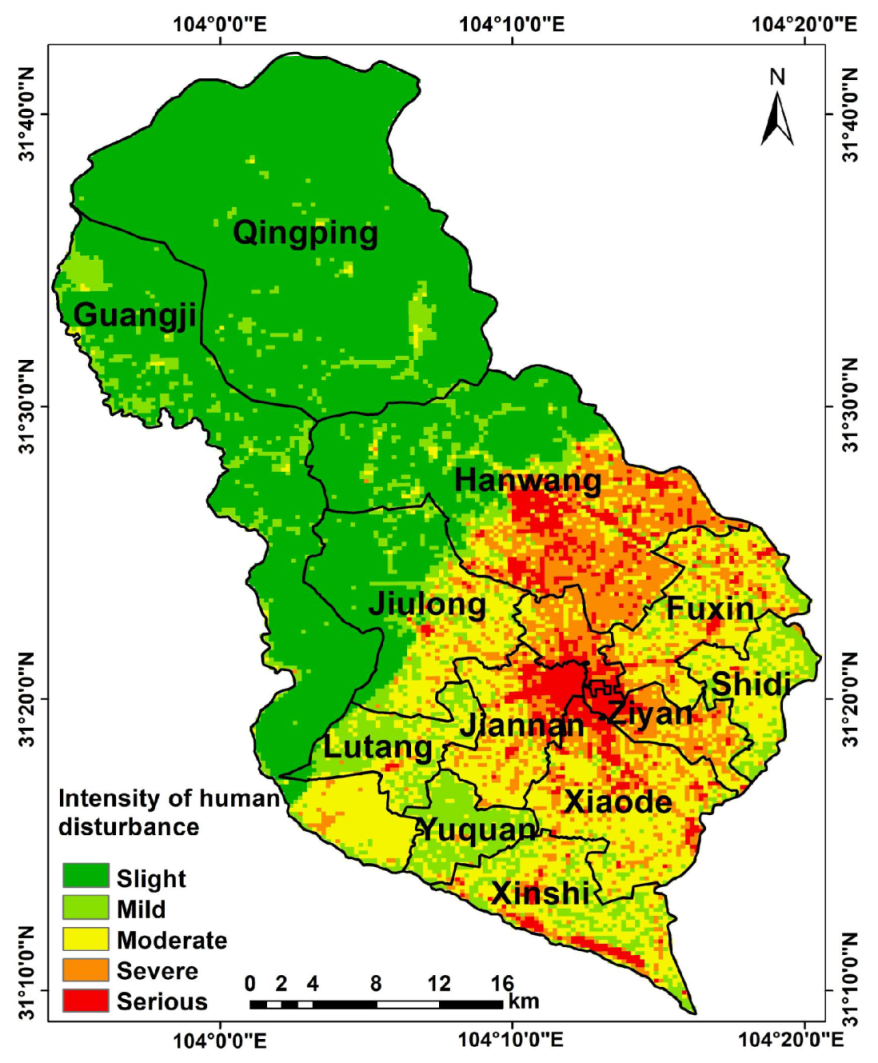
3.2. Spatial Analysis of Human Activity Disturbance Intensity

As shown in Figure 4, we weighted the human activity disturbance factors to obtain the distribution of the human activity disturbance intensity. The results were classified using the natural discontinuity method, which reduced the variation within the same class and maximized the differences between the different classes. In this study, we divided the human activity disturbance intensity into the following five levels: slight disturbance (0.00–0.13), mild disturbance (0.13–0.35), moderate disturbance (0.35–0.50), severe disturbance (0.50–0.65), and serious disturbance (0.65–1.00).
The disturbance of the human activity in Mianzhu City was mainly concentrated in the central and southern areas, and the disturbance degree of the human activity in the northern area was relatively low, exhibiting a trend of low in the northwest and high in the southeast. In general, the human activity disturbance intensity in Mianzhu City was at the middle to low levels (Figure 4). Among them, the areas with slight disturbances accounted for the largest proportion (49.59%), followed by the areas with moderate disturbance (21.63%). The mild disturbance areas and severe disturbance areas accounted for roughly the same proportion (12.20% and 11.55%, respectively). The severe disturbance areas accounted for the lowest proportion (5.03%) (Figure 5). Figure 6 shows that the Moran’s I index of human activity disturbance intensity is 0.929, which shows that it has obvious aggregation. The severely disturbed areas and seriously disturbed areas were concentrated in the central and southern areas. These areas were dominated by plains and were suitable for human survival and development. Therefore, the degree of disturbance in these areas was relatively high. The mountains and ravines in the northwest were vertical and horizontal, the forest was dense, and the population was sparse, which were not conducive to the survival of human beings. Therefore, the disturbance intensity of the human activity was relatively weak.
Judging from the distribution of the township according to the Figure 7, the human activity disturbance intensities on Ziyan Community and Jiannan Community were similar. The disturbance intensity of the human activity in Qingping Town was the lowest, with an average disturbance intensity of only 0.03, and there was no severe disturbance or serious disturbance in this area, with slight disturbance as the mainstay. The disturbance intensities of the human activity in Guangji Town, Hanwang Town, Jiulong Town, Lutang Town, and Yuquan Town were moderate to low level. The disturbance intensities of the human activity in Fuxin Town, Xiaode, Town and Shidi Town were moderate to high level. It can be seen that the development center of Mianzhu City is still in Jiannan Community and Ziyan Community, and radiating from these two areas.

3.3. The Correlation Analysis between Human Activity Disturbance Intensity and Land Use Intensity

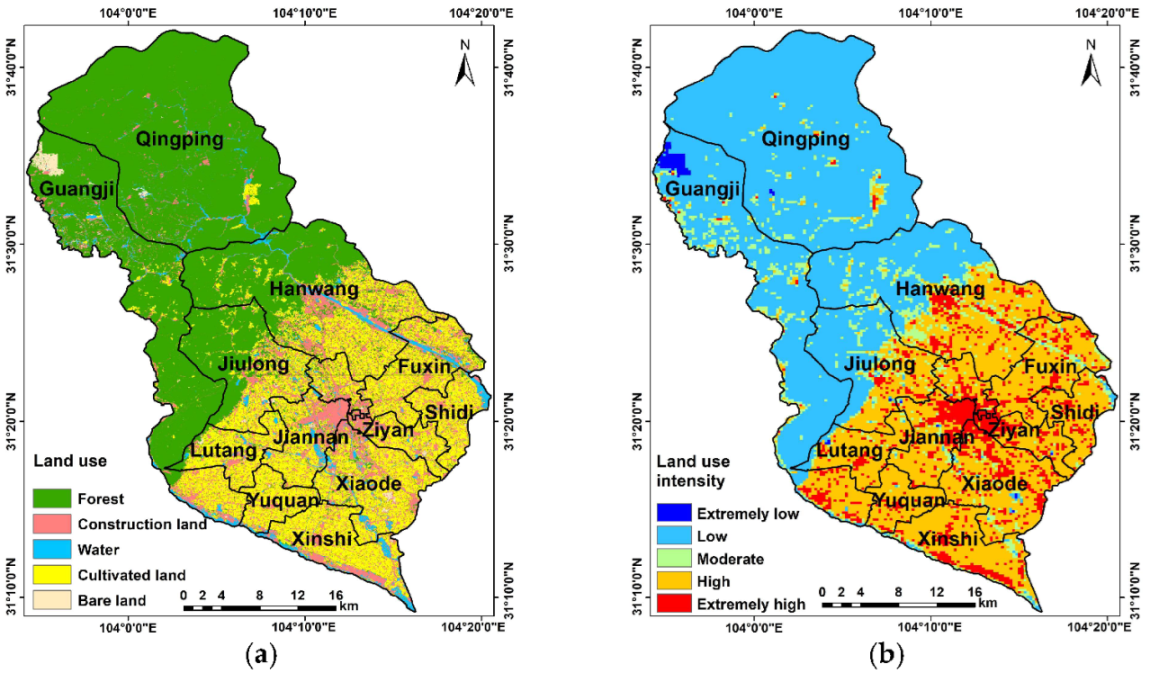
3.3.1. Land Use Intensity Analysis

Inspired by the literature [34], the formula for calculating land use intensity is as follows:
L j = 100 i = 1 n ( A i j C i )
where Li is the land use intensity of the j cell grid, Aij the area proportion of the i land use type in the j cell grid, and Ci is the grading index for land use degree.
The change of land use is an important manifestation of the land use intensity. Therefore, to calculate the land use intensity, we first need to extract land use information from the study area of Mianzhu City. The results are shown in the Figure 8a. Land use intensity was calculated by land use classification, as shown in Figure 8b. The spatial distribution of land use intensity is obviously different. The northwest area has low use intensity, and the southeast area has high use intensity. The urban center—Ziyan Community and Jiannan Community—are the areas with the highest degree of use.

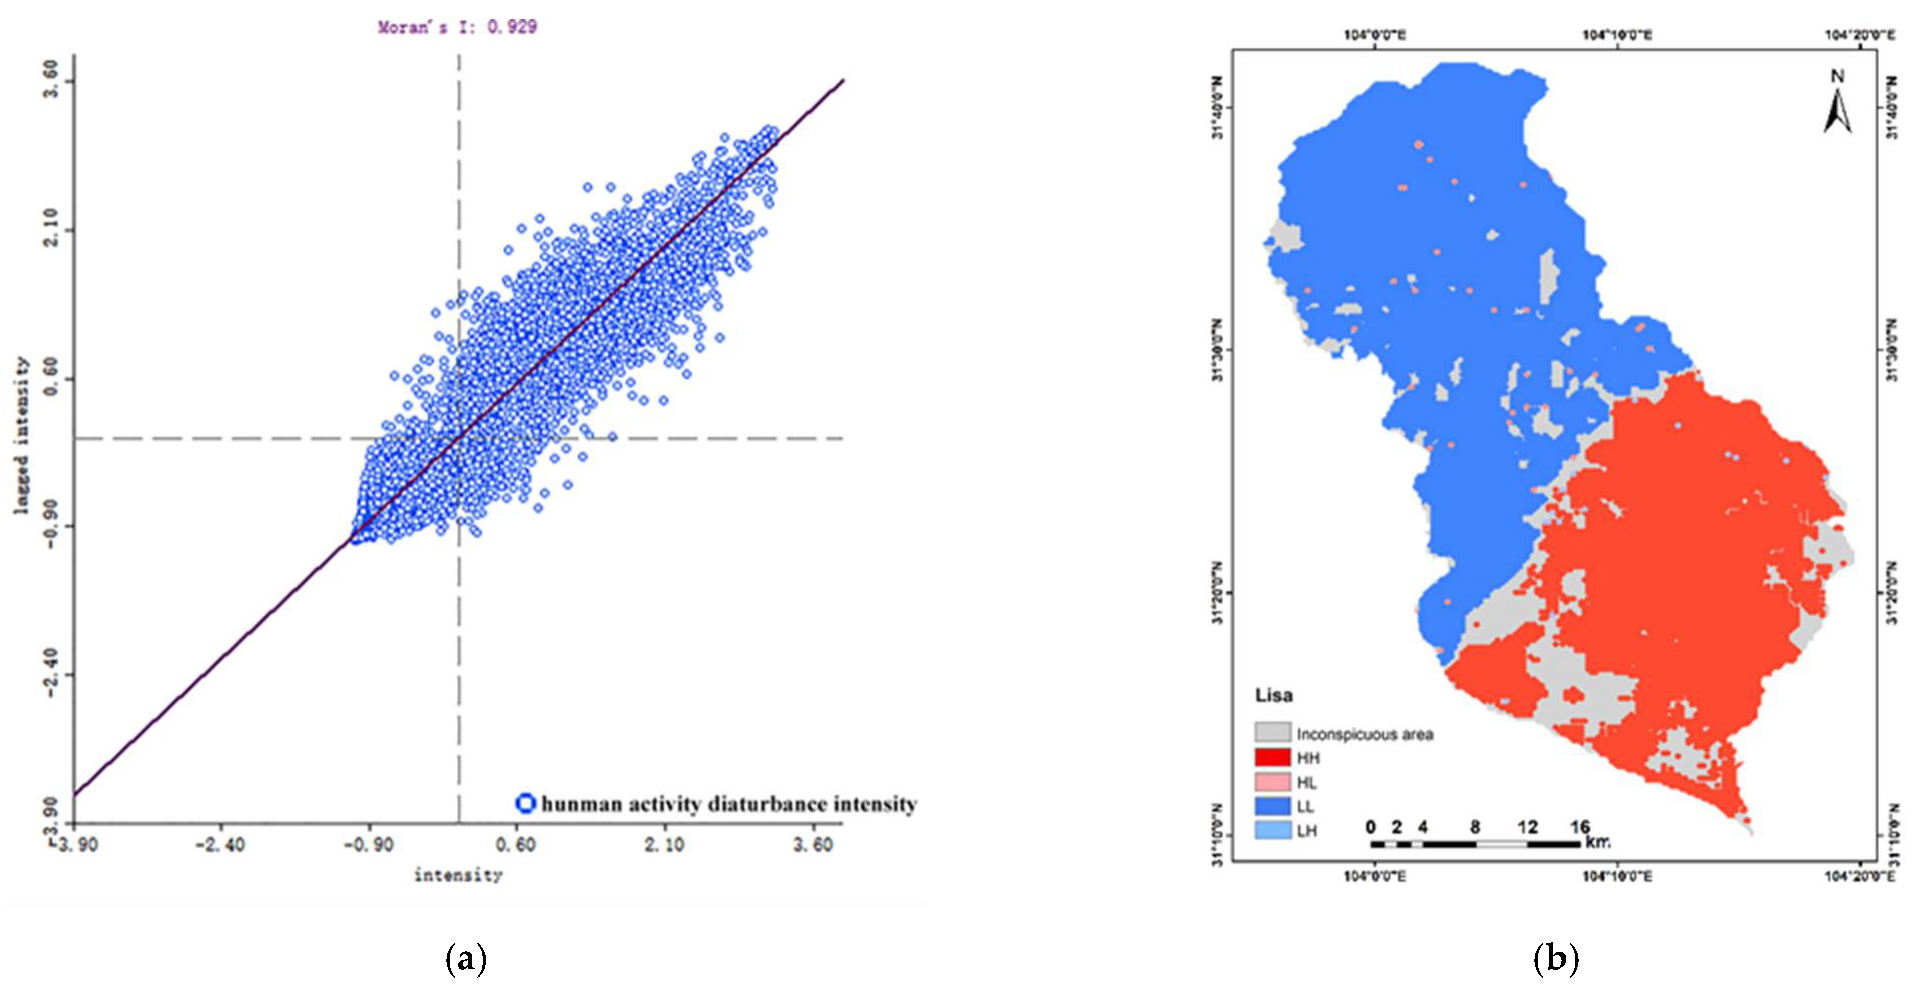
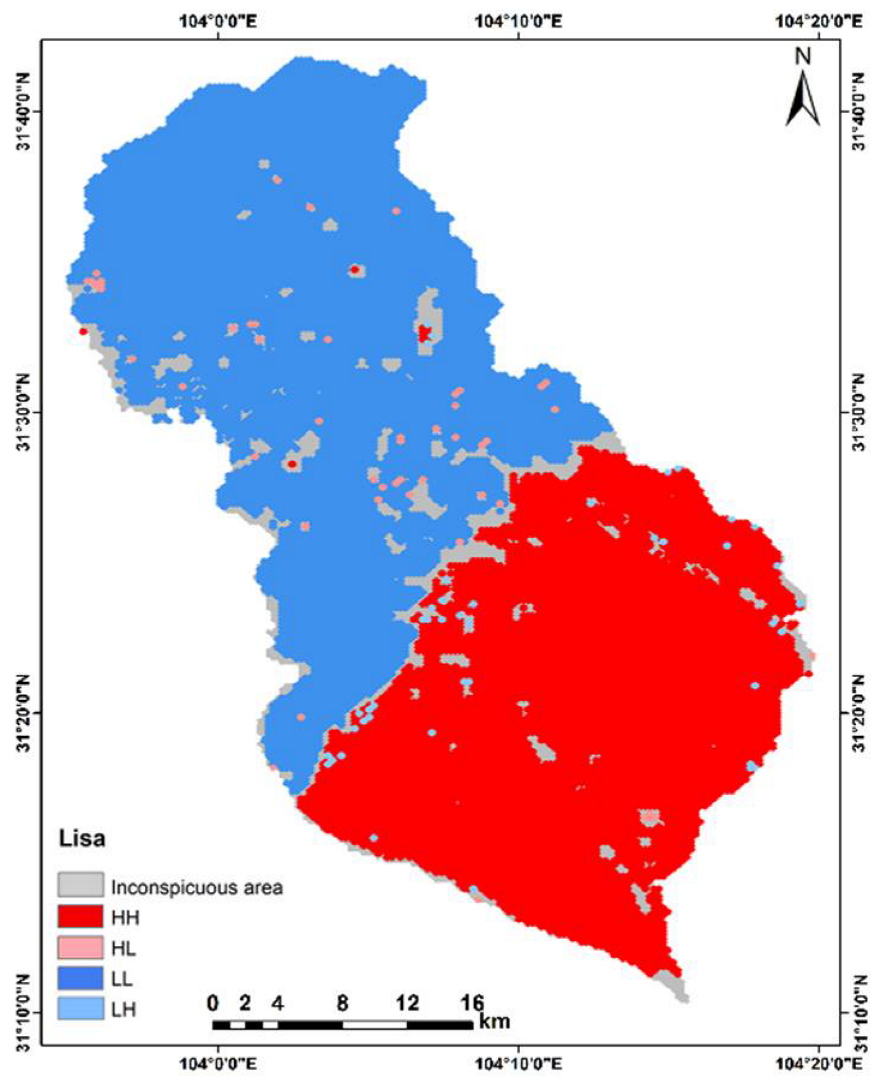
3.3.2. Spatial Autocorrelation Analysis of Human Activity Disturbance Intensity and Land Use Intensity

According to Equation (13), the Pearson correlation coefficient between human activity disturbance intensity and land use intensity is 0.949, which indicates that the spatial distribution of the human activity disturbance intensity and land use intensity in the study area has significant spatial autocorrelation.
According to Equation (14), the bivariate global spatial autocorrelation index is 0.875, which indicates that there is a strong correlation between distribution of human activity disturbance intensity and land use intensity. The local spatial autocorrelation analysis was mainly conducted using the Local Moran’s I (LISA) method, and we gained a LISA agglomeration map, as shown in Figure 9. The spatial agglomeration characteristics of human activities and land use are generally stable. The local spatial autocorrelation pattern of the disturbance intensity of the human activity and the land use intensity in Mianzhu City was dominated by HH agglomeration and LL agglomeration clusters. The HH agglomeration area accounts for 42%, mainly in the southeastern plain area. This kind of aggregation model is mainly concentrated in the southeastern plain area, the land types are mainly cultivated land and construction land, and human activities are frequent and the disturbance intensity of human activity is relatively large. The LL agglomeration area accounts for 48%, distributed in the northwestern part of the study area, where the altitude is higher, the terrain is mainly mountainous, the land type is forest land, the vegetation coverage is high, the population is sparse, and the disturbance intensity of human activity is weak. The HL aggregation and LH aggregation types accounted for 10%, and were scattered in the study area.

4. Discussion

With the advancement of a series of national policies such as the rural revitalization strategy and the construction of ecological civilization, townships, as an important social space type, are affected by natural conditions and human factors, and the intensity of human activity in townships has become increasingly intense. Especially in the towns and villages in ecologically fragile areas, in the current era of vigorous social and economic development, their economic and social development has not fundamentally achieved a comprehensive green transformation. The joint effect of natural environment and human activities has led to the increasingly prominent contradiction between social economic development and ecological environmental protection in the region. Therefore, exploring the correlation between human activity disturbance intensity and land use intensity can provide a reference for the coordinated development of human and land in mountainous areas and the sustainable ecological development.
Based on the perspective of “production-living-ecological space (PLES)”, this study quantifies the disturbance intensity of human activity, and draws a spatial quantification map of the disturbance intensity of human activity in Mianzhu City. At the same time, the spatial distribution characteristics of human disturbance intensity were discussed in depth at the county scale and township scale. In terms of spatial distribution, the disturbance intensity of human activity in Mianzhu City presents significant spatial variation differences, gradually decreasing from northwest to southeast. After analysis, we found that this change is largely influenced by local topography. The northwestern part of Mianzhu City has a higher altitude and is dominated by mountains and hills, which are difficult to develop and utilize. The southeastern region is dominated by plains with abundant water sources, where human activities gather and radiate to the surrounding areas. Ref. [35] can confirm this point of view. At the same time, according to Figure 4 and Figure 8b, it can be seen that the disturbance intensity of human activity in Mianzhu City has a strong consistency with the change of land use intensity. They all present a trend of low in the northwest and high in the southeast, which indicates that the disturbance of human activities on the surface is reflected in the development and utilization of the land. According to our analysis, this obvious spatial difference is mainly caused by two aspects, one is the northwest high southeast low terrain factors; second, the local economic development policy reasons. Because the main theme of local urban development is to strengthen the construction of ecological civilization, it is necessary to strengthen the protection of forest land in the northwest of Mianzhu City, so as to promote the harmonious development of man and nature in this area.
The spatial quantification of human activity disturbance intensity is a complex and systematic problem, which is the result of the comprehensive influence of many factors. Analyzing the intensity of human disturbance from land use or socioeconomic data alone is not comprehensive enough to accurately express the actual situation. Therefore, this study combines land use information with socioeconomic data; from the three aspects of PLES, eight impact factors were selected, including the number of enterprises, agricultural expenditure, road network density, final accounts data of townships and villages, population, proportion of construction land, number of large supermarkets, and proportion of forest land. Through the analysis of impact factors and the construction of models of human activity disturbance intensity and land use intensity, the quantitative analysis of human activity disturbance intensity in Mianzhu City was carried out (Figure 4). Among these impact factors, the proportion of forest land represents the amount of ecological land, which is a negative indicator. As ecological land, woodland can maintain a good ecological environment, and the degradation of ecological land will have adverse effects on the natural environment [36,37]. The other seven factors are positive indicators, which can represent different aspects of human activities. Thus, these seven factors can positively reflect the intensity of human activity. However, this study only selects the factor of forest land ratio as the ecological indicator, and the characterization of ecological aspects may not be comprehensive enough. In the future, we will continue to conduct in-depth research to find more and more suitable ecological factors to characterize the county ecological environment in Southwest China.

5. Conclusions

A spatial quantitative model between human activity disturbance intensity and land use intensity was proposed in this study. Eight factors for human activity disturbance were involved. The proposed model was validated in the southwest mountainous area as an empirical study in China. The highlights of our work include: (1) there are obvious differences in the disturbance intensity of human activity in Mianzhu City, the disturbance intensity of human activity in the southeastern area of Mianzhu City is strong, while the one in the northwest area is relatively weak. Meanwhile, the aggregation of various degrees of disturbance is very significant; (2) the relationship between human activity disturbance intensity and the land use intensity shows a stable positive correlation in Mianzhu City. That is, land use intensity is greater where human activity is more intense; (3) among the eight factors affecting the disturbance intensity of human activity, the proportion of construction land area plays a leading role, while the township financial income has the least impact.
Compared with the traditional quantitative methods based on land use/landscape, the method proposed in this study can more objectively and truly reflect the disturbance of human activity in the study area. However, this study only considers eight factors in spatially quantifying the disturbance intensity of human activity. In future work, we will enrich more factors to obtain more precise results.

Author Contributions

X.W., X.Z., C.J., Z.Z. and M.L.: Conceptualization, Methodology, Writing—Original draft preparation; X.W., Z.Z. and M.L.: Data curation, Visualization; X.Z. and C.J.: Supervision; X.W., C.J., X.Z. and Z.Z.: Writing—Reviewing and Editing. All authors have read and agreed to the published version of the manuscript.

Funding

This research was funded by the Major Project of High-Resolution Earth Observation System (Grant No. 07-Y30B03-9001-19/21), the Beijing Natural Science Foundation (Grant No. 8222009), the China Scholarship Council High-level Talent Training Program (2022), and Classification Development Quota Project—Postgraduate Innovative Research Project (2022) (No. PG2022104 and PG2022121).

Institutional Review Board Statement

Not applicable.

Informed Consent Statement

Not applicable.

Data Availability Statement

The administrative division data used in this article can be found at: https://www.resdc.cn/ accessed on 25 May 2022; population data, township final account data, and agricultural expenditure can be found at: https://www.mz.gov.cn/ accessed on 25 May 2022.

Acknowledgments

We would like to thank the reviewers for very constructive and detailed comments.

Conflicts of Interest

The authors declare no conflict of interest.

References

  1. Delinom, R.M.; Assegaf, A.; Abidin, H.Z.; Taniguchi, M.; Suherman, D.; Lubis, R.F.; Yulianto, E. The contribution of human activities to subsurface environment degradation in Greater Jakarta Area, Indonesia. Sci. Total Environ. 2009, 407, 3129–3141. [Google Scholar] [CrossRef]
  2. Morales, J.; Rodríguez, A.; Alberto, V.; Machado, C.; Criado, C. The impact of human activities on the natural environment of the Canary Islands (Spain) during the pre-Hispanic stage (3rd–2nd Century BC to 15th Century AD): An overview. Environ. Archaeol. 2009, 14, 27–36. [Google Scholar] [CrossRef]
  3. Fang, Y.-P.; Ying, B. Spatial distribution of mountainous regions and classifications of economic development in China. J. Mt. Sci. 2016, 13, 1120–1138. [Google Scholar] [CrossRef]
  4. Shi, P.; Li, N.; Ye, Q.; Dong, W.; Han, G.; Fang, W. Research on integrated disaster risk governance in the context of global environmental change. Int. J. Disaster Risk Sci. 2010, 1, 17–23. [Google Scholar]
  5. Ye, D.; Fu, C.; Ji, J.; Dong, W.; Lü, J.; Wen, G.; Yan, X. Orderly human activities and subsistence environment. Adv. Earth Sci. 2001, 16, 453–460. [Google Scholar]
  6. Zhang, J.; Guo, Q.; Du, C.; Wei, R. Quantifying the effect of anthropogenic activities on water quality change in the Yangtze River from 1981 to 2019. J. Clean. Prod. 2022, 363, 132415. [Google Scholar] [CrossRef]
  7. Gao, Y.; Liu, J.; Li, W.; Lei, Y.; Zou, Y.; Cui, L. Characteristics of human activity in China’s coastal zone based on multi-source spatio-temporal data. ISPRS Ann. Photogramm. Remote Sens. Spat. Inf. Sci. 2022, 3, 397–404. [Google Scholar] [CrossRef]
  8. Xie, J.; Sun, Y.; Liu, X.; Ding, Z.; Lu, M. Human Activities Introduced Degenerations of Wetlands (1975–2013) across the Sanjiang Plain North of the Wandashan Mountain, China. Land 2021, 10, 1361. [Google Scholar] [CrossRef]
  9. Zhu, L.; Xing, H.; Hou, D. Analysis of carbon emissions from land cover change during 2000 to 2020 in Shandong Province, China. Sci. Rep. 2022, 12, 8021. [Google Scholar] [CrossRef]
  10. Xu, F.; Chi, G. Spatiotemporal variations of land use intensity and its driving forces in China, 2000–2010. Reg. Environ. Chang. 2019, 19, 2583–2596. [Google Scholar] [CrossRef]
  11. Semenchuk, P.; Plutzar, C.; Kastner, T.; Matej, S.; Bidoglio, G.; Erb, K.-H.; Essl, F.; Haberl, H.; Wessely, J.; Krausmann, F.; et al. Relative effects of land conversion and land-use intensity on terrestrial vertebrate diversity. Nat. Commun. 2022, 13, 615. [Google Scholar] [CrossRef] [PubMed]
  12. Liu, S.; Liu, L.; Wu, X.; Hou, X.; Zhao, S.; Liu, G. Quantitative evaluation of human activity intensity on the regional ecological impact studies. Acta Ecol. Sin. 2018, 39, 6797–6809. [Google Scholar]
  13. Fu, T.; Zhang, L.; Chen, B.; Yan, M. Human Disturbance on the Land Surface Environment in Tropical Islands: A Remote Sensing Perspective. Remote Sens. 2022, 14, 2100. [Google Scholar] [CrossRef]
  14. Wu, T.; Zha, P.; Yu, M.; Jiang, G.; Zhang, J.; You, Q.; Xie, X. Landscape Pattern Evolution and Its Response to Human Disturbance in a Newly Metropolitan Area: A Case Study in Jin-Yi Metropolitan Area. Land 2021, 10, 767. [Google Scholar] [CrossRef]
  15. Reiss, K.C.; Brown, M.T.; Lane, C.R. Characteristic community structure of Florida’s subtropical wetlands: The Florida wetland condition index for depressional marshes, depressional forested, and flowing water forested wetlands. Wetl. Ecol. Manag. 2010, 18, 543–556. [Google Scholar] [CrossRef]
  16. Cui, L.; Li, G.; Chen, Y.; Li, L. Response of Landscape Evolution to Human Disturbances in the Coastal Wetlands in Northern Jiangsu Province, China. Remote Sens. 2021, 13, 2030. [Google Scholar] [CrossRef]
  17. Xu, X.; Xu, Y. Analysis of spatial-temporal variation of human activity intensity in Loess Plateau region. Geogr. Res. 2017, 36, 661–672. [Google Scholar]
  18. Magalhães, J.L.L.; Lopes, M.A.; de Queiroz, H.L. Development of a Flooded Forest Anthropization Index (FFAI) applied to Amazonian areas under pressure from different human activities. Ecol. Indic. 2015, 48, 440–447. [Google Scholar] [CrossRef]
  19. Kovarik, J.L.; van Beynen, P.E. Application of the Karst Disturbance Index as a raster-based model in a developing country. Appl. Geogr. 2015, 63, 396–407. [Google Scholar] [CrossRef]
  20. Halpern, B.S.; Frazier, M.; Potapenko, J.; Casey, K.; Koenig, K.; Longo, C.; Lowndes, J.S.; Rockwood, R.C.; Selig, E.R.; Selkoe, K.A.; et al. Spatial and temporal changes in cumulative human impacts on the world’s ocean. Nat. Commun. 2015, 6, 7615. [Google Scholar] [CrossRef]
  21. He, Y.; Kuang, Y.; Zhao, Y.; Ruan, Z. Spatial Correlation between Ecosystem Services and Human Disturbances: A Case Study of the Guangdong–Hong Kong–Macao Greater Bay Area, China. Remote Sens. 2021, 13, 1174. [Google Scholar] [CrossRef]
  22. Zhang, X.; Xu, Z. Functional Coupling Degree and Human Activity Intensity of Production–Living–Ecological Space in Underdeveloped Regions in China: Case Study of Guizhou Province. Land 2021, 10, 56. [Google Scholar] [CrossRef]
  23. Zhang, Y.; Zhou, Z.; Zhang, H.; Dan, Y. Quantifying the impact of human activities on water quality based on spatialization of social data: A case study of the Pingzhai Reservoir Basin. Water Supply 2020, 20, 688–699. [Google Scholar] [CrossRef]
  24. Radionovs, A.; Užga-Rebrovs, O. Fuzzy Analytical Hierarchy Process for Ecological Risk Assessment. Inf. Technol. Manag. Sci. 2016, 19, 16–22. [Google Scholar] [CrossRef] [Green Version]
  25. Wang, X.; Yang, W.; Xu, Z.; Hu, J.; Xue, Y.; Lin, P. A normal cloud model-based method for water quality assessment of springs and its application in Jinan. Sustainability 2019, 11, 2248. [Google Scholar] [CrossRef]
  26. Li, Q.; Meng, X.X.; Liu, Y.B.; Pang, L.F. Risk Assessment of floor water inrush using entropy weight and variation coefficient model. Geotech. Geol. Eng. 2019, 37, 1493–1501. [Google Scholar] [CrossRef]
  27. Upadhyay, H.; Juneja, A.; Turabieh, H.; Malik, S.; Gupta, A.; Bitsue, Z.K.; Upadhyay, C. Exploration of crucial factors involved in plants development using the fuzzy AHP Method. Math. Probl. Eng. 2022, 2022, 4279694. [Google Scholar] [CrossRef]
  28. Chen, S.; Liu, W.; Bai, Y.; Luo, X.; Li, H.; Zha, X. Evaluation of watershed soil erosion hazard using combination weight and GIS: A case study from eroded soil in Southern China. Nat. Hazards 2021, 109, 1603–1628. [Google Scholar] [CrossRef]
  29. Yu, D.; Lv, L.; Meng, F.; Gao, F.; He, J.; Zhang, L.; Li, Y. Landslide risk assessment based on combination weighting-improved TOPSIS. IOP Conf. Ser. Earth Environ. Sci. 2021, 769, 032022. [Google Scholar] [CrossRef]
  30. Sun, Y.; Liu, S.; Shi, F.; An, Y.; Li, M.; Liu, Y. Spatio-temporal variations and coupling of human activity intensity and ecosystem services based on the four-quadrant model on the Qinghai-Tibet Plateau. Sci. Total Environ. 2020, 743, 140721. [Google Scholar]
  31. Xue, Y.; Li, Z.; Li, S.; Qiu, D.; Su, M.; Xu, Z.; Zhou, B.; Tao, Y. Water inrush risk assessment for an undersea tunnel crossing a fault: An analytical model. Mar. Georesources Geotechnol. 2019, 37, 816–827. [Google Scholar] [CrossRef]
  32. Jing, C.; Dong, M.; Du, M.; Zhu, Y.; Fu, J. Fine-Grained Spatiotemporal Dynamics of Inbound Tourists Based on Geotagged Photos: A Case Study in Beijing, China. IEEE Access 2020, 8, 28735–28745. [Google Scholar] [CrossRef]
  33. Tong, S.; Zhu, Y.; Li, Z. Correlation Study between Rural Human Settlement Health Factors: A Case Study of Xiangxi, China. Comput. Intell. Neurosci. 2022, 2022, 2484850. [Google Scholar] [CrossRef] [PubMed]
  34. Chidi, C.L.; Sulzer, W.; Xiong, D.-H.; Wu, Y.-H.; Zhao, W.; Pradhan, P.K. Land use intensity dynamics in the Andhikhola watershed, middle hill of Nepal. J. Mt. Sci. 2021, 18, 1504–1520. [Google Scholar] [CrossRef]
  35. Avand, M.; Moradi, H.; Lasboyee, M.R. Using machine learning models, remote sensing, and GIS to investigate the effects of changing climates and land uses on flood probability. J. Hydrol. 2021, 595, 125663. [Google Scholar] [CrossRef]
  36. Yousefi, S.; Avand, M.; Yariyan, P.; Pourghasemi, H.R.; Keesstra, S.; Tavangar, S.; Tabibian, S. A novel GIS-based ensemble technique for rangeland downward trend mapping as an ecological indicator change. Ecol. Indic. 2020, 117, 106591. [Google Scholar] [CrossRef]
  37. Yousefi, S.; Pourghasemi, H.R.; Avand, M.; Janizadeh, S.; Tavangar, S.; Santosh, M. Assessment of land degradation using machine-learning techniques: A case of declining rangelands. Land Degrad. Dev. 2020, 32, 1452–1466. [Google Scholar] [CrossRef]
Figure 1. Location of the study area.
Remotesensing 14 04574 g001
Figure 2. Framework of a spatial quantitative model of human activity disturbance intensity and land use intensity.
Remotesensing 14 04574 g002
Figure 3. Spatial quantification of disturbance factors of human activity ((a) enterprises number; (b) agricultural expenditure; (c) road network density; (d) financial income; (e) population; (f) supermarkets number; (g) forest land proportion; (h) construction land proportion).
Remotesensing 14 04574 g003
Figure 4. Human activity disturbance intensity.
Remotesensing 14 04574 g004
Figure 5. The proportion of the area disturbed by human activity.
Remotesensing 14 04574 g005
Figure 6. Spatial autocorrelation of human activity disturbance intensity ((a) Moran scatter plot of human activity disturbance; (b) LISA clustering map).
Remotesensing 14 04574 g006
Figure 7. Distribution of townships disturbed by human activity.
Remotesensing 14 04574 g007
Figure 8. Land use information ((a) land use classification; (b) land use intensity).
Remotesensing 14 04574 g008
Figure 9. Bivariate LISA cluster map of human disturbance intensity and land use intensity.
Remotesensing 14 04574 g009
Table 1. Data sources.
DataTypeSource
GF-6raster dataNational Space Administration Earth Observation and Data Center
Administrative division datavector dataResource and Environmental Science and Data Center of the Chinese Academy of Sciences
Township administrative divisionsThe Ministry of Civil Affairs of China
The number of enterprisesstatistical data“China County Statistical Yearbook Township Volume”
The number of large supermarkets
Agricultural expenditure dataMianzhu Municipal People’s Government
Township financial income data
Population data
Table 2. The combination weights.
Supermarkets NumberConstruction Land ProportionForest Land ProportionPopulationEnterprises NumberRoad Network DensityFinancial IncomeAgricultural Expenditure
0.16230.17550.11790.05690.14690.13630.03160.1726
Publisher’s Note: MDPI stays neutral with regard to jurisdictional claims in published maps and institutional affiliations.

