Abstract
This study analyzed the characteristics of changes in O3 concentration in a plume induced by a wildfire in Andong, South Korea, from 24 to 26 April 2020, using the Community Multi-scale Air Quality (CMAQ) model. Fire INventory from National Center for Atmospheric Research (FINN) emissions data were used for the wildfire emissions. The increases in the concentrations of primary pollutants (CO, NOx, and volatile organic compounds (VOCs)) due to the wildfire peaked near the source at 09 LST and, as the plume was transported, the reduction in the supply of pollutants from wildfire, as well as chemical reactions, advection and diffusion, and deposition, caused the concentrations to continuously decrease. In contrast, O3 concentration showed a sustained increase during transport due to photochemical reactions caused by precursors (e.g., NOx, VOCs) emitted during the wildfire, peaking (1.40 ppb) at approximately 1 km at 13 LST over 60 km from the source. To analyze these results, a process analysis was conducted. Integrated process rate (IPR) analysis results showed that the production rate of O3 and loss rates of NOx and VOCs peaked at 09 LST due to the photochemical reactions of NOx and VOCs emitted due to wildfire. Then, as the plume was transported, the loss rates of NOx and VOCs that contributed to O3 production continued to decrease at 11 LST. The O3 production rate also decreased at 11 LST but increased at 13 LST due to increasing solar radiation. This indicates that the O3 concentration is complexly determined by O3 precursors and solar radiation. Additionally, IRR analysis revealed that NO and NO2 emitted during wildfire and solar radiation contributed to the production and loss processes of O3; the production reactions of O3 were predominant, and O3 was accumulated and transported in the plume, leading to the peak O3 concentration at 13 LST.
1. Introduction
Biomass burning occurs in various forms, such as wildfires, agriculture residue burning, and trash burning [,]. It emits pollutants such as carbon monoxide (CO), nitrogen oxide (NOx), and volatile organic compounds (VOCs), thus changing the chemical characteristics of the surrounding atmosphere [,]. In particular, many wildfires are occurring globally [], and NOx and VOCs emitted by wildfires contribute to O3 production through photochemical reactions []. Large amounts of O3 produced in the troposphere can degrade air quality and cause chronic respiratory and cardiovascular diseases, leading to increased morbidity and mortality [].
Numerous studies have analyzed O3 concentrations in the atmosphere induced by wildfires [,,]. According to Dreessen et al. [], wildfire plumes that occurred in Saskatchewan, Canada, in 2015 were transported to the Middle Atlantic of the United States over 3000 km away from the wildfire source and led to increased concentrations of CO, NOx, and O3 in Maryland on the eastern Atlantic coast of the United States. Additionally, according to Jeon et al. [], wildfire plumes that occurred in Colorado in the United States in the summer of 2012 were transported to the North Atlantic, increasing the O3 concentration in the upper troposphere by up to 145 ppb due to the chemical reactions of O3 precursors emitted by the wildfires. As such, wildfires emit various pollutants into the atmosphere, of which O3 precursors, such as NOx and VOCs, can lead to increase O3 concentrations through chemical reactions during long-range transport.
Meanwhile, 4740 wildfires occurred in South Korea from 2011–2020, causing approximately 1120 ha of forest loss annually []. However, despite the frequent occurrence of wildfires, the influence of wildfires in South Korea on local air quality has rarely been reported in previous studies. Furthermore, more than 70% of the territory in South Korea is mountainous [], and it is difficult to predict changes in air quality induced by wildfire due to this complex mountainous terrain. Therefore, high-resolution wildfire emission data in South Korea are needed. There are various wildfire emission inventories around the world; particularly, the Fire INventory from NCAR (FINN) [,], Global Fire Emissions Database (GFED) [], and Global Fire Assimilation System (GFAS) [] provide wildfire emissions on a global scale. These emission inventories provide daily emission estimates based on satellite-observed data, so they are widely used for input data when conducting modeling to predict changes in ambient air quality during wildfires. Among them, FINN provides high-resolution daily emission estimates at a horizontal resolution of ~1 km2, making it sufficiently applicable for evaluating the impact of wildfires in South Korea, which has complex topographical features.
Accordingly, this study analyzes the impact of a wildfire in South Korea on atmospheric O3 concentrations using FINN emission data. Using Community Multi-scale Air Quality (CMAQ), a 3D photochemical transport model [], we conduct numerical simulation experiments with and without wildfire emissions, compare the results of each simulation, and examine changes in the concentration of pollutants induced by wildfire emissions.
This study is outlined as follows. The data and methods are described in Section 2. Next, Section 3 shows the validation of meteorological and air quality numerical simulations and the simulation results of the effects of wildfires on pollutant concentrations in the atmosphere. Particularly, to intensively analyze the transport characteristics of O3 induced by wildfires, we compare and analyze the chemical production and loss processes of O3 during the transport of wildfire plumes with primary pollutants and quantitatively analyze the characteristics of O3 concentrations changes due to wildfires in South Korea. Lastly, Section 4 presents conclusions. The main objective of this study is to analyze O3 concentration change characteristics, a secondary pollutant, compared to primary pollutants, when a wildfire occurs in South Korea with complex mountainous terrain.
2. Data and Methods
2.1. Model Configuration and Input Data
To analyze the characteristics of changes in O3 concentration induced by wildfire, the CMAQ (v5.0.2), a 3D photochemical transport model, was used to simulate wildfire occurring in Andong, Gyeongsangbuk-do, South Korea. As the modeling domain, the East Asian region, including China, was set to D01 (9 km, 207 187 grids) to consider the long-range transport of pollutants, and the region including Andong, where the wildfire occurred, was set to D02 (3 km, 123 132 grids) (Figure 1). The vertical layer was composed of 34 layers from the surface to 50 hPa for detailed analysis of concentration changes in pollutants emitted by the wildfire. For anthropogenic emissions of CMAQ modeling, we used a mosaic Asian anthropogenic emission inventory (MIX) 2010 [], which contains emissions data for the Asia region, and the Clean Air Policy Support System (CAPSS) 2017 [], a national emission inventory of South Korea. To consider biogenic VOCs, natural emissions were produced using the Model of Emissions of Gases and Aerosols from Nature (MEGAN, v2.1) []. Finally, FINN v1.5 [,] was used for the wildfire emissions, and CB05tucl and AERO6 were applied for the chemical mechanisms of the gas and aerosol phase, respectively.
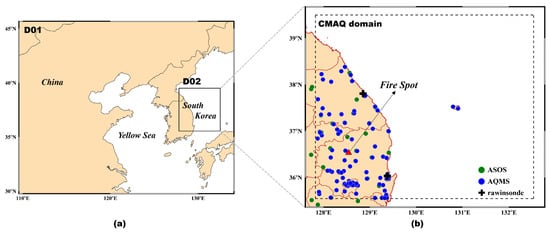
Figure 1.
(a) Domain of CMAQ including East Asia (D01) and Andong, Gyeongsangbuk-do, South Korea (D02). (b) Distribution of wildfire sources (red triangles), automated synoptic observing systems (ASOS; green circles), air quality monitoring systems (AQMS; blue circles), and rawinsonde (black plus) located in D02.
To generate the meteorological input data of CMAQ, we conducted Weather Research and Forecasting (WRF, v3.8.1) [] simulation, and Meteorology-Chemistry Interface Processor (MCIP) was used to convert the WRF simulation results into meteorological input data for CMAQ. For WRF simulation, we used European Center for Medium-range Weather Forecasts (ECMWF) ERA5 reanalysis data with a horizontal resolution of 0.25 0.25 at 6-h intervals for the initial and boundary input data. The numerical simulations were carried out from 09 LST on 10 April 2020 to 09 LST on 3 May 2020, considering the wildfire occurrence and transport period. The detailed options used for the WRF and CMAQ simulations are shown in Tables S1 and S2.
2.2. Input Data of Wildfire Emissions
According to the 2020 Forest Fire Annual Report [], a wildfire in Andong occurred from 15:39 on 24 April 2020 to 14:30 on 26 April 2020, and, due to strong winds of up to 18.8 ms−1, 1944 ha of forest in the surrounding area was burned, causing property damage of KRW 106,295 million. To apply the pollutants emitted from the Andong wildfire in CMAQ modeling, this study used FINN v1.5, a wildfire emissions inventory provided by the National Center for Atmospheric Research (NCAR). FINN provides reprocessed daily emission estimates at a horizontal resolution of ~1km2 based on observations by Moderate Resolution Imaging Spectroradiometer sensors aboard Terra and Aqua, polar-orbiting satellites of the National Aeronautics and Space Administration. It is widely used for the emission input data of chemical transport models [,]. FINN emissions are calculated as a function of the fraction of burned biomass and emission factors based on a bottom-up method; they include trace gases and aerosols emitted from wildfires and agricultural burning but do not include emissions from biofuel combustion and trash burning. Andong wildfires were revealed four times during two days (24 and 25 April) in FINN data; the total emissions of gaseous pollutants from the wildfires are shown in Table 1.

Table 1.
Total emissions of gaseous pollutants from Andong wildfire in FINN emission data (unit of pollutants: mole/day).
Chemical speciation of the FINN emissions is classified according to the Model for Ozone and Related chemical Tracers (v4) mechanism []. However, as this mechanism is not provided in CMAQ, it is difficult to use in this study in the form of raw data. Therefore, according to the research method of Choi et al. [], we mapped the chemical speciation of the FINN emission data to the chemical mechanism applied in this study (CB05tucl-AERO6) to use it as input data in CMAQ.
2.3. Vertical Distribution of Wildfire Emissions
In general, pollutants emitted from wildfires are transported to the upper layers by updrafts; the plume heights generally vary from 0.2 to 5 km because of several complicated factors, including land-cover type, season, and atmospheric stability [,]. Particularly, as the plumes of large wildfires can reach the stratosphere [], the vertical distribution of wildfire emissions can significantly influence air quality numerical simulations. Accordingly, we distributed the reprocessed FINN emissions for our purposes to various altitudes and assessed the accuracy of the simulation results according to the vertical distribution of the wildfire emissions. First, we conducted a default emission experiment (BASE) without wildfire emissions and then compared the results to those from experiments including wildfire emissions. Next, for the vertical distribution methods of wildfire emissions, to evenly distribute emissions from the surface to a specific model layer, we applied the distribution method (1) from the 0th layer to the 5th layer (approximately 0.75 km, FINN_5ly) and (2) from the 0th layer to the 10th layer (approximately 2.5 km, FINN_10ly), respectively. Additionally, referring to a previous study [] showing that the vertical distribution of plume was similar to observations when wildfire emissions were distributed within the planetary boundary layer (PBL) altitude, (3) we evenly distributed FINN emissions within the PBL altitude (FINN_pbl). Here, the PBL altitude was calculated by the meteorological simulation. As such, the FINN emissions were reflected in CMAQ modeling while varying the vertical distribution methods, and the information on the average vertical profile of emissions of each method and the PBL altitude used in the FINN_pbl method is demonstrated in Figure S1. Additionally, each simulation result was compared with the observation and the BASE experiment to assess their accuracy.
2.4. Process Analysis
Since the concentration of O3, a secondary pollutant, is mainly determined by the chemical reactions of its precursors (NOx, VOCs, etc.) in the atmosphere [], a detailed analysis of the production and loss processes of O3 is necessary. Therefore, we employed process analysis (PA) [], a diagnostic module provided in CMAQ. PA consists of the integrated process rate (IPR) and the integrated reaction rate (IRR). IPR provides the contributions of the individual physical and chemical processes (e.g., transport, emission, dry deposition, cloud, chemistry, and aerosol processes) of simulated pollutant concentrations [,], and IRR provides the contributions of all chemical reactions of a given pollutant [,]. For this study, we used IPR to analyze the contribution of chemical reactions to O3 concentration changes and IRR to analyze the contribution of all chemical reactions to the production and loss processes of O3.
2.5. Statistical Parameters
To evaluate the accuracy of the meteorological and air quality simulation results, we used surface observation data from 37 sites of automated synoptic observing systems (ASOS) and 95 sites of air quality monitoring systems (AQMS) in D02, as shown in Figure 1b. The period was from 00 LST on 20 April 2020 to 23 LST on 30 April 2020, which includes the period of the Andong wildfire (24–26 April 2020). To evaluate the WRF numerical simulation results, temperature and wind speed data, which significantly influence the production and loss processes of O3 [], were used from all ASOS sites. Additionally, to evaluate the BASE case of the CMAQ numerical simulation results, CO, the most emitted from the Andong wildfire (Table 1), and O3, the material to be studied, were used from all AQMS sites. For the evaluation, we used root mean squared error (RMSE), mean bias error (MBE), and index of agreement (IOA), which are statistical parameters widely used in meteorological and air quality model evaluation [,,,]. The RMSE and MBE indicate the quantitative error between the model and the observation, and the IOA describes the error and the concordance of the variability as well. The specific formula for each parameter is defined as follows:
where is the number of total data, is the simulated value, is the observed value, and is the mean of the observation.
3. Results and Discussion
3.1. Evaluation of Numerical Simulation Results
Figure 2 shows the scatter plots comparing the simulated results with the observations and the statistical parameters mentioned above. As a result of the WRF simulation evaluation, the RMSE of temperature and wind speed were 2.64 °C and 2.93 ms−1, and MBE was −1.35 °C and 2.01 ms−1, indicating that the model slightly underestimated temperature and overestimated wind speed compared to the observations. However, the IOA of temperature and wind speed were 0.92 and 0.67, respectively, demonstrating that the model appropriately simulated their temporal variation. According to the CMAQ simulation (BASE case) evaluation, the RMSE of CO and O3 were 48.40 ppb and 12.55 ppb, respectively, and MBE was –16.02 ppb and –6.36 ppb. Although the model tended to underestimate both compared to the observations, IOA was high at 0.84 and 0.74, showing that CMAQ accurately simulated the variability of pollutants on the ground. Additionally, the spatial distribution of the CMAQ-simulated CO and O3 concentrations indicated a high agreement with corresponding observations (Figure S2).
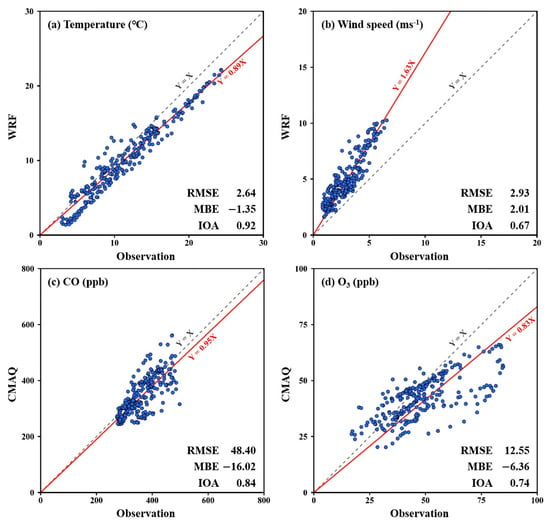
Figure 2.
Comparison of WRF and CMAQ numerical simulation results with observations of (a) temperature, (b) wind speed, (c) CO, and (d) O3 in D02 from 20 to 30 April 2020.
Additionally, when wildfires occur, plumes are transported to the upper layers by updrafts [,], where the transported pollutants are affected by temperature and wind [,]. Therefore, it is necessary to validate the meteorological variables of the upper layers. To this end, the vertical distribution (1000–50 hPa altitude) of temperature, wind speed, and wind components (U, V) of WRF was verified using rawinsonde data at the two points shown in Figure 1. As shown in Figure S1, the IOA for each variable ranged from 0.83 to 0.93, indicating a very high agreement between the WRF numerical simulation results and the rawinsonde observations. These verification results demonstrate that the numerical simulation results of the ground and upper layers used in this study were sufficiently reliable to use in the analysis.
3.2. Differences in Numerical Simulation Results According to the Vertical Distribution Method of Wildfire Emissions
As shown in Figure 3, the Andong wildfire plume captured by the Himawari-8 satellite at 18 LST on 24 April 2020 moved from the source of the wildfire to the eastern sea and passed through five AQMS sites (AD, YD_1, YD_2, YY, CS) during movement. To analyze the influence of the wildfire plume on changes in the concentration of air pollutants on the ground, this study examined the pollutant concentrations observed at four of the above sites, excluding YD_2 due to missing data. We selected CO as a representative substance to objectively identify the influence of wildfire. This is because CO is the most emitted substance from the Andong wildfire and relatively less reactive than other substances [], implying lower chances of chemical changes during the transport of the plume. In other words, it is possible to clearly grasp the direct impact of wildfires on air quality. To analyze this, we calculated the difference in simulation results between the BASE experiment and the experiments adding the Andong wildfire emissions (FINN_5ly, FINN_10ly, FINN_pbl) (Figure 4).
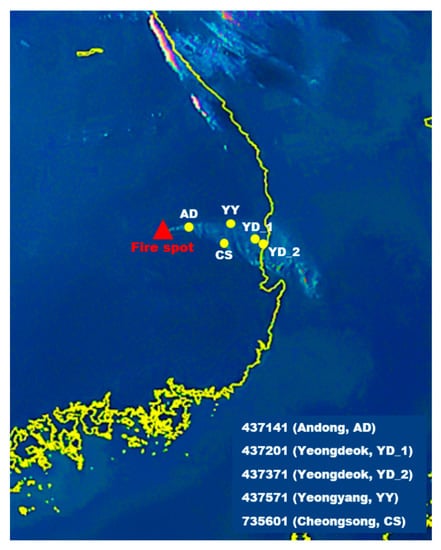
Figure 3.
Andong wildfire plume observed by the Himawari-8 satellite. The yellow circles are the AQMS sites located in the moving direction of the plume.
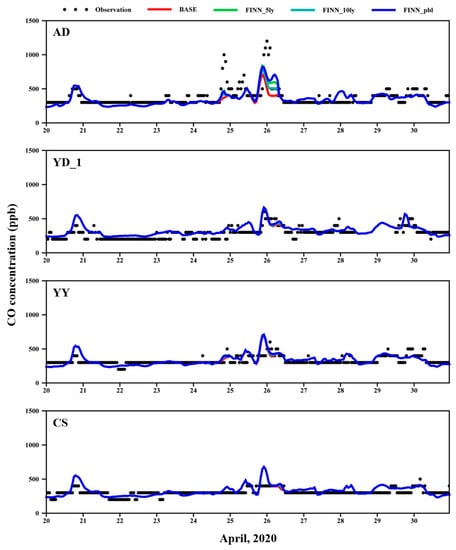
Figure 4.
Comparison of observed CO concentrations at AQMS sites in Figure 3 (AD, YD_1, YY, CS) and results of CMAQ numerical simulations (BASE, FINN_5ly, FINN_10ly, FINN_pbl) from 20 to 30 April 2020 (site YD_2 has missing data).
As shown in Figure 4, at site AD, the results of the BASE experiment and FINN_5ly, FINN_10ly, and FINN_pbl experiments differed with the addition of the FINN emissions. The difference was most prominent in the FINN_pbl experiment, and at sites YD_1, YY, and CS, there was no large difference between the experiments. These results signify that the impact of wildfires on ground air quality can be simulated differently according to the vertical distribution method of wildfire emissions and the transport characteristics of the plumes. During the wildfire period, the CO concentration at site AD was observed up to 1200 ppb (Figure 4a), and the CO concentrations in each experiment were simulated up to 708.98 ppb (BASE), 839.15 ppb (FINN_5ly), 777.97 ppb (FINN_10ly), and 820.16 ppb (FINN_pbl). Since the Andong wildfire emissions were not considered in the BASE experiment, the maximum CO concentration observed at site AD could not be simulated. However, in the FINN_5ly, FINN_10ly, and FINN_pbl experiments, the CO concentration increased with the addition of the Andong wildfire emissions. FINN_5ly, in which emissions were distributed to a relatively low altitude, showed the highest CO concentration, followed by FINN_pbl and FINN_10ly. Statistical verifications were carried out for each experiment to quantitatively compare the consistency between each experiment’s CO simulation results with the observations. As in Section 3.1, RMSE, MBE, and IOA were used as statistical indicators. According to the statistical verification (Table 2), the BASE experiment, in which wildfire emissions were not added, showed the lowest numerical simulation accuracy, while FINN_pbl showed the smallest RMSE and MBE of 106.55 ppb and −23.60 ppb, respectively, and an IOA of 0.78, indicating that it best simulated the temporal variations of the observations. It is notable that, although the maximum CO concentration occurred in FINN_5ly, the statistical verification results showed the highest accuracy in FINN_pbl. These findings indicate that although the ground CO concentration may increase as the distribution of wildfire emissions at altitudes close to the ground increases, accurate numerical simulation is difficult with this vertical distribution method because it may not consider complex conditions, such as vertical mixing and plume height. In contrast, when wildfire emissions are distributed within the PBL elevation, the pollutants in the plume may be well distributed due to the vertical mixing of pollutants [], thus enabling more accurate numerical simulation. In the FINN_pbl experiment, however, the maximum CO concentration observed at site AD was not perfectly simulated, which is attributed to errors in temperature, wind speed, PBL altitude, and FINN. The findings showed that the FINN_pbl experiment yielded the most statistically significant results according to the experiment on vertical distribution methods of wildfire emissions and best reproduced the temporal variations of the observations. Therefore, this study analyzed the impact of the Andong wildfire emissions using the results of the BASE and FINN_pbl experiments.

Table 2.
Statistical verification between observed CO concentrations and results of CMAQ numerical simulations (BASE, FINN_5ly, FINN_10ly, FINN_pbl) at point AD from 20 to 30 April 2020.
3.3. Changes in Pollutant Concentrations Due to Wildfire Emissions
In the previous section, we confirmed that the FINN_pbl experiment simulates the Andong wildfire most similarly to the observations. Therefore, to analyze changes in pollutant concentrations induced by the wildfire, we calculated the difference between the FINN_pbl and BASE experiments (i.e., FINN_pbl minus BASE), also analyzing the vertical distributions of primary pollutants (CO, NOx, VOCs) emitted by the Andong wildfire and, secondary pollutant (O3) that the primary pollutants can produce. Figure 5 shows the difference in results for each experiment (FINN_pbl—BASE) on 25 April 2020, when the wildfire was largest. The values are averages from 09 LST to 17 LST, when O3 production by photochemical reactions was active []. The blue circle symbol on the figure denotes the central location of the wildfire plume at 2 h intervals from 09 LST.
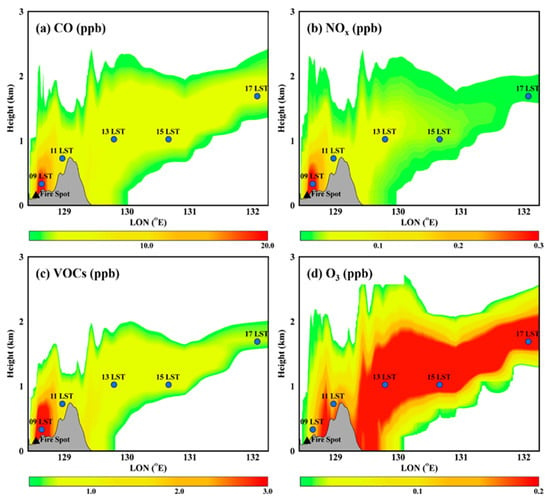
Figure 5.
Vertical distribution of changes in concentration of primary pollutants ((a) CO, (b) NOx, (c) VOCs) and (d) O3 due to Andong wildfire (FINN_pbl—BASE). The concentration change values are the averages from 09 to 17 LST on 25 April 2020. The blue circle denotes the central location of the wildfire plume.
The concentration changes of the primary pollutants (CO, NOx, and VOCs) were highest at 09 LST near the source of the wildfire (104.51 ppb, 1.76 ppb, 22.39 ppb, respectively), and as time passed, they gradually decreased as the plume was transported in the upward-right direction. On the other hand, the concentration changes of O3, the secondary pollutant, were in contrast to those of the primary pollutants; the maximum concentration did not occur near the source of the wildfire (09 LST) but at a height of approximately 1 km (13 LST) (1.40 ppb). For further analysis, the horizontal distribution of the changes in concentration of each pollutant was compared (Figure 6). Here, the changes in pollutant concentration were calculated by averaging from the ground to the top of the wildfire plume (about 2 km) during the analysis period. The distribution of O3 concentration changes due to the wildfire (Figure 6d) was different from the primary pollutants, as in Figure 5, and it showed a wide distribution to the northeast sea. The concentration changes of the primary pollutants were greatest near the wildfire source, whereas O3 peaked at a location more than 60 km northeast of the wildfire source. This difference likely occurred because, unlike the primary pollutants, the O3, a secondary pollutant, was chemically produced as the wildfire plume was transported. To analyze these findings, it is necessary to quantitatively compare the changes in concentration of each pollutant over time, the details of which are discussed in Section 3.4 and Section 3.5.
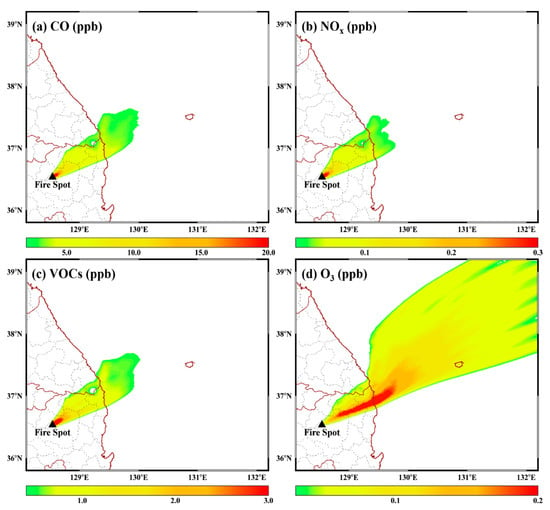
Figure 6.
Horizontal distribution of changes in concentration of primary pollutants ((a) CO, (b) NOx, (c) VOCs) and (d) O3 due to Andong wildfire (FINN_pbl—BASE). The concentration change values are the averages from the ground surface to the top of the plume from 09 to 17 LST on 25 April 2020.
3.4. Analysis of Changes in O3 Concentration in Wildfire Plume
To analyze the chemical change processes that occur in the wildfire plume during transport, we identified the concentration changes of the primary pollutants (CO, NOx, VOCs) and O3 by the Andong wildfire emissions at a center location of the plume (Figure 5) for each hour during the analysis period. As shown in Figure 7, the concentrations of CO, NOx, and VOCs showed daily maximums of 104.51 ppb, 1.76 ppb, and 22.39 ppb at 09 LST, respectively, and tended to decrease over time as the plume was transported. This is because as the plume moved away from the source of the wildfire, the supply of pollutants from the wildfire burning decreased, and the reduction in concentration was added by chemical reactions, advection and diffusion, and deposition processes. In contrast, the concentration changes of O3 in the plume showed a daily minimum of 0.36 ppb at 09 LST and, as the plume moved away from the wildfire source, peaked at 1.40 ppb at 13 LST. As mentioned earlier, this trend of changes in O3 concentration indicates that a series of chemical reactions are involved in O3 production within the wildfire plume, so further analysis of the production and loss processes of O3 in the plume is required.
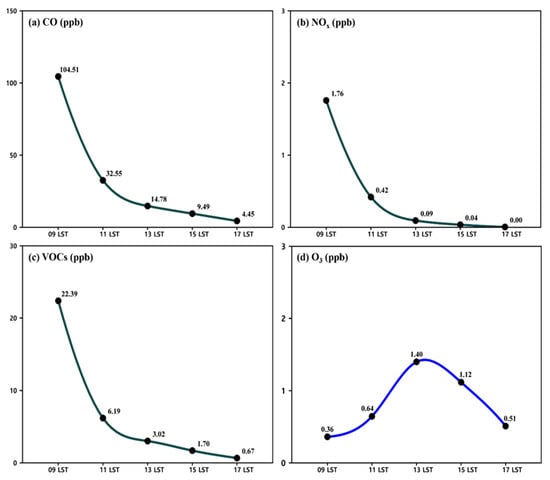
Figure 7.
Changes in concentration of primary pollutants ((a) CO, (b) NOx, (c) VOCs, and (d) O3) at the central locations in the wildfire plume (Figure 5) during the analysis period (FINN_pbl – BASE).
We employed IPR to quantitatively analyze the production and loss processes of O3 in the wildfire plume. In the atmosphere, O3 concentrations are known to be determined by the photochemical reactions of precursors, solar radiation, and transport [,]. Accordingly, to accurately understand the change characteristics of O3 concentration in the wildfire plume, we calculated (1) the production rate of O3, (2) the loss rates of NOx and VOCs (major precursors of O3) caused by chemical reactions, and (3) the amount of solar radiation reaching the surface at the center of the plume for each hour (Figure 5), and used them in the analysis. As discussed previously, at 09 LST, NOx (1.76 ppb) and VOCs (22.39 ppb) emitted by the wildfire burning near the source produced O3 (0.36 ppb) through photochemical reactions (Figure 7). At this time, the production rate of O3 showed a daily maximum (+0.81 ppb/h), and on the contrary, the loss rates of NOx and VOCs, which were involved in the production of O3, showed a daily maximum (−0.17 ppb/h and −0.31 ppb/h, respectively) (Figure 8). This is because, at 09 LST, the wildfire plume was nearest to the source and had the largest amount of NOx and VOCs that could be involved in O3 production. At 11 LST, the wildfire plume was transported downwind from the source; in this process, NOx and VOCs in the plume continuously produced O3 through chemical reactions, causing the O3 concentration to increase to 0.64 ppb and the NOx and VOCs concentrations to decrease to 0.42 and 6.19 ppb, respectively. It is remarkable that although the O3 production rate at 11 LST (+0.34 ppb/h) had reduced from 09 LST (+0.81 ppb/h), the O3 concentration increased. This result is interpreted that although the O3 production rate decreased as NOx and VOCs gradually depleted while the wildfire plume was transported, the O3 produced by chemical reactions continuously accumulated during transport and caused the O3 concentration in the plume to increase. At 13 LST, the O3 concentration reached a daily peak of 1.40 ppb, which is attributed to the continuous production and accumulation of O3 during transport. Interestingly, the O3 production rate (+0.44 ppb/h) at 13 LST was higher than that at 11 LST (+0.34 ppb/h) despite the decrease in NOx and VOCs concentrations. This is attributed to the difference in solar radiation, which plays an important role in photochemical reactions. As shown in Figure 8, solar radiation gradually increased after 09 LST, reaching a peak at 13 LST. The increased solar radiation accelerated the O3 production by photochemical reactions, which led to a higher O3 production rate at 13 than at 11 LST despite the decrease in NOx and VOC concentrations. However, according to the above analysis, the O3 production rate at 11 LST (+0.34 ppb/h) was lower than that at 09 LST (+0.81 ppb/h) despite the relatively higher solar radiation (Figure 8). This seems to be because, at 11 LST, the decrease in the O3 production rate due to the decrease in NOx and VOC concentrations was greater than the increase in the O3 production rate due to the increase in solar radiation. These findings show that the chemical production of O3 during the transport process of wildfire plumes is complexly determined by the concentrations of the precursors (NOx and VOCs) and solar radiation. After 15 LST, NOx and VOC concentrations continued to decrease as the wildfire plume was transported, and solar radiation gradually decreased the closer to sunset; thus, O3 production by chemical reactions gradually approached zero. As a result, the O3 concentration in the plume also continuously decreased.
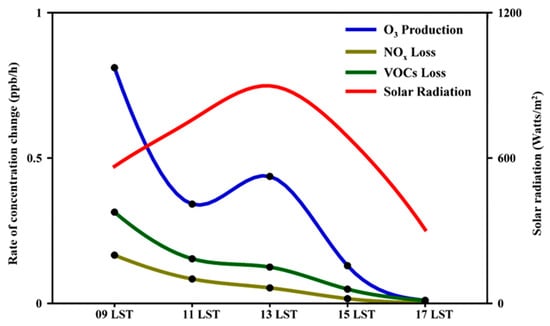
Figure 8.
Changes in O3, NOx, and VOC concentrations by chemical reactions and solar radiation during the analysis period (FINN_pbl—BASE).
3.5. Analysis of Contribution to O3 Production and Loss in Wildfire Plume by Chemical Equations
The IPR analysis results found that the influence of the concentration of precursors (NOx and VOCs) and solar radiation on O3 concentration in the plume varied with time. In this regard, IRR was used to further analyze which chemical reactions contributed to the production and loss processes of O3 in each hour. For the chemical equations used in the IRR analysis, we selected the major production (R1) and loss reactions (R2–R4) of O3 from among the chemical mechanisms (CB05tucl) used in the CMAQ numerical simulation of this study. Each specific chemical equation is as follows:
O + O2 + M = O3 + M
O3 + NO = NO2
O3 + NO2 = NO3
O3 = O
Table 3 shows the contribution of each chemical reaction to the production and loss processes of O3 in the plume calculated through IRR analysis, and Figure 9 describes the percentage of each reaction. In the R1 reaction, the oxygen atoms photodissociated from NO2 (NO2 + hv → NO + O) [] combine with oxygen molecules in the atmosphere to form O3. At 09 LST, NO2 emitted during wildfire burning near the source was involved in the R1 reaction, and O3 production peaked at 35.33 ppb/h. Then, as the plume was transported from the source, the concentration of NO2 continuously involved in the chemical reaction decreased, and O3 production by the R1 reaction decreased at 11 LST (8.57 ppb/h), 13 LST (4.47 ppb/h), 15 LST (0.13 ppb/h), and 17 LST (0.01 ppb/h).

Table 3.
Contribution of chemical reactions to the production and loss of O3 during the analysis period (unit: ppb/h).
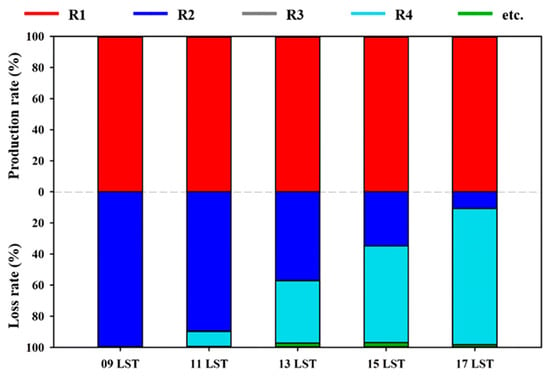
Figure 9.
Percentage contribution of chemical reactions to the production and loss of O3 during the analysis period.
Next, we analyzed the R2–R4 reactions contributing to the O3 loss process. In the R2 reaction, NO was involved in the titration effect of O3 (NO+O3 → NO2+O2) []; due to NO being emitted near the source from wildfire burning, O3 loss by the R2 reaction peaked at 09 LST (−34.55 ppb/h). Then, similarly to the R1 reaction, as the plume was transported, the concentration of NO decreased, and O3 loss by the R2 reaction also rapidly decreased. The contribution of the R3 reaction was less than 1%, while that of the R4 reaction displayed different trends from the previous reactions. The R4 reaction is an O3 photodissociation reaction due to solar radiation []; it increased from 09 LST, peaked at 13 LST (−1.62 ppb/h), and then decreased with solar radiation.
Using the IPR and IRR of PA, each chemical reaction’s contribution to the production and loss processes of O3 in the plume was analyzed. We confirmed that NO and NO2 emitted during wildfire burning and strong solar radiation during the day contributed to the production and loss of O3. O3 production reactions were more active due to oxygen atoms photodissociated from a large amount of NO2 emitted from the Andong wildfire (Table 1); the produced O3 was accumulated and transported in the plume, and the O3 concentration peaked at 13 LST (1.40 ppb). Our results differ greatly from those of previous studies. Dreessen et al. [] reported that O3 in the Maryland region increased up to 14 ppb, and Jeon et al. [] reported that O3 in the plume increased up to 112 ppb. These differences in the changes in O3 concentration likely occurred because the area lost by wildfires analyzed in the previous studies exceeded 30,000 ha, which is much greater than the Andong wildfire (1944 ha). However, the O3 production and loss mechanisms in the plume analyzed in this study were similar to those of Jeon et al. []. This implies that while the amount of change in O3 concentration may vary with wildfire size, the mechanisms of change in concentration during transport do not greatly differ.
4. Conclusions
This study used the photochemical transport model CMAQ to analyze the characteristics of changes in O3 concentration in a plume caused by a wildfire in South Korea. The concentrations of primary pollutants (CO, NOx, and VOCs) induced by wildfire decreased as the plume was transported from the source of the wildfire, whereas the O3 concentration increased due to production by photochemical reactions and transport. It is noteworthy here that the production of O3 was reduced at 11 LST (+0.34 ppb/h) by a decrease in the concentration of precursors (NOx, VOCs) but increased at 13 LST (+0.44 ppb/h) due to strong solar radiation. These results show that the O3 concentration in the wildfire plume is complexly determined by the concentration of the precursors and the amount of solar radiation. Accordingly, this suggests that complicated conditions should be considered to analyze the characteristics of O3 concentration changes in wildfire plumes.
This study is based on a relatively small wildfire in South Korea, and it is difficult to generalize from these results due to South Korea’s complex topography. However, while the amount of change in the O3 concentration varies with wildfire size and topography, we revealed the mechanisms of change in O3 concentrations during transport, which are relatively constant between wildfires. Therefore, further studies are needed on various wildfire cases through numerical simulation using accurate input data and vertical distribution methods. In addition, since the uncertainty of the model may affect the analysis results, a comparative study of various model results is also needed. Through these studies, it would be possible to objectively grasp the transport characteristics and changes in O3 concentration due to wildfires.
Supplementary Materials
The following supporting information can be downloaded at: https://www.mdpi.com/article/10.3390/rs14184549/s1, Table S1: Configuration and detailed options for WRF numerical simulation; Table S2: Configuration and input data for CMAQ numerical simulation; Figure S1. (a) The average vertical profile of emis-sions for each method, and (b) the time variation of the PBL altitude used in the FINN_pbl method during the period of wildfire; Figure S2. Spatial distribution of observation and CMAQ numerical simulation results of CO and O3 concentrations in D02. The values are averaged from April 20 to 30, 2020; Figure S3: Comparison of observed meteorological variables ((a) tempera-ture, (b) wind speed, (c) U-component, (d) V-component) by rawinsonde and results of WRF numerical simulations from 20 to 30 April 2020.
Author Contributions
Conceptualization, D.K. and W.J.; Investigation and Writing—original draft, D.K and J.P.; Formal analysis and Methodology, W.J.; Writing—review and editing, W.J., J.P., J.M., H.C. and H.-Y.J.; Visualization, J.M.; Funding acquisition, C.-H.K. and H.-J.L. All authors have read and agreed to the published version of the manuscript.
Funding
This research was supported by Basic Science Research Program through the National Research Foundation of Korea (NRF) funded by the Ministry of Education (No. 2020R1A6A1A03044834). This research was also supported by the National Research Foundation Korea (NRF) grant funded by the Korean government (MSIT) (No. 2022R1A2C1008132).
Data Availability Statement
FINN data are available from https://www.acom.ucar.edu/Data/fire/ (accessed on 8 September 2022). The ground-based temperature and wind speed observational data were downloaded from the Korea Meteorological Administration data website (https://data.kma.go.kr/cmmn/main.do) (accessed on 8 September 2022). The ground-based CO and O3 concentration data were downloaded from the Korea Environment Corporation AirKorea website (https://www.airkorea.or.kr/web) (accessed on 8 September 2022).
Acknowledgments
We are grateful to the National Center for Atmospheric Research for providing FINN data.
Conflicts of Interest
The authors declare no conflict of interest.
References
- Jena, C.; Ghude, S.D.; Pfister, G.; Chate, D.; Kumar, R.; Beig, G.; Surendran, D.E.; Fadnavis, S.; Lal, D. Influence of springtime biomass burning in South Asia on regional ozone (O3): A model based case study. Atmos. Environ. 2015, 100, 37–47. [Google Scholar] [CrossRef]
- Souri, A.H.; Choi, Y.; Jeon, W.; Kochanski, A.K.; Diao, L.; Mandel, J.; Bhave, P.V.; Pan, S. Quantifying the impact of biomass burning emissions on major inorganic aerosols and their precursors in the US. J. Geophys. Res.-Atoms. 2017, 122, 12020–12041. [Google Scholar] [CrossRef]
- Saxena, M.; Sharma, S.K.; Tomar, N.; Ghayas, H.; Sen, A.; Garhwal, R.S.; Gupta, N.C.; Mandal, T.K. Residential biomass burning emissions over northwestern Himalayan region of India: Chemical characterization and budget estimation. Aerosol. Air Qual. Res. 2016, 16, 504–518. [Google Scholar] [CrossRef]
- Chan, K. Biomass burning sources and their contributions to the local air quality in Hong Kong. Sci. Total Environ. 2017, 596, 212–221. [Google Scholar] [CrossRef]
- Zhou, S.; Collier, S.; Jaffe, D.A.; Briggs, N.L.; Hee, J.; Sedlacek, A.J., III; Kleinman, L.; Onasch, T.B.; Zhang, Q. Regional influence of wildfires on aerosol chemistry in the western US and insights into atmospheric aging of biomass burning organic aerosol. Atmos. Chem. Phys. 2017, 17, 2477–2493. [Google Scholar] [CrossRef]
- Alvarado, M.; Lonsdale, C.; Yokelson, R.; Akagi, S.K.; Coe, H.; Craven, J.; Fischer, E.; McMeeking, G.; Seinfeld, J.; Soni, T. Investigating the links between ozone and organic aerosol chemistry in a biomass burning plume from a prescribed fire in California chaparral. Atmos. Chem. Phys. 2015, 15, 6667–6688. [Google Scholar] [CrossRef]
- Wang, Y.; Wild, O.; Chen, X.; Wu, Q.; Gao, M.; Chen, H.; Qi, Y.; Wang, Z. Health impacts of long-term ozone exposure in China over 2013–2017. Environ. Int. 2020, 144, 106030. [Google Scholar] [CrossRef]
- Roy, A.; Choi, Y.; Souri, A.H.; Jeon, W.; Diao, L.; Pan, S.; Westenbarger, D. Effects of biomass burning emissions on air quality over the continental USA: A three-year comprehensive evaluation accounting for sensitivities due to boundary conditions and plume rise height. In Environmental Contaminants: Measurement, Modelling and Control; Gupta, T., Agarwal, A.K., Agarwal, R.A., Labhsetwar, N.K., Eds.; Springer: Singapore, 2018; pp. 245–278. [Google Scholar] [CrossRef]
- Ballesteros-González, K.; Sullivan, A.P.; Morales-Betancourt, R. Estimating the air quality and health impacts of biomass burning in northern South America using a chemical transport model. Sci. Total Environ. 2020, 739, 139755. [Google Scholar] [CrossRef]
- Xu, L.; Crounse, J.D.; Vasquez, K.T.; Allen, H.; Wennberg, P.O.; Bourgeois, I.; Brown, S.S.; Campuzano-Jost, P.; Coggon, M.M.; Crawford, J.H.; et al. Ozone chemistry in western US wildfire plumes. Sci. Adv. 2021, 7, 3648. [Google Scholar] [CrossRef]
- Dreessen, J.; Sullivan, J.; Delgado, R. Observations and impacts of transported Canadian wildfire smoke on ozone and aerosol air quality in the Maryland region on June 9–12, 2015. J. Air Waste Manag. Assoc. 2016, 66, 842–862. [Google Scholar] [CrossRef]
- Jeon, W.; Choi, Y.; Souri, A.H.; Roy, A.; Diao, L.; Pan, S.; Lee, H.W.; Lee, S.-H. Identification of chemical fingerprints in long-range transport of burning induced upper tropospheric ozone from Colorado to the North Atlantic Ocean. Sci. Total Environ. 2018, 613, 820–828. [Google Scholar] [CrossRef] [PubMed]
- Korea Forest Service. 2020 Forest Fire Annual Report. Available online: https://www.forest.go.kr/kfsweb/cop/bbs/selectBoardArticle.do?nttId=3156244&bbsId=BBSMSTR_1008&mn=NKFS_06_09_05 (accessed on 8 September 2022).
- Song, B.; Park, K. Temperature trend analysis associated with land-cover changes using time-series data (1980–2019) from 38 weather stations in South Korea. Sustain. Cities Soc. 2021, 65, 102615. [Google Scholar] [CrossRef]
- Wiedinmyer, C.; Akagi, S.; Yokelson, R.J.; Emmons, L.; Al-Saadi, J.; Orlando, J.; Soja, A. The Fire INventory from NCAR (FINN): A high resolution global model to estimate the emissions from open burning. Geosci. Model Dev. 2011, 4, 625–641. [Google Scholar] [CrossRef]
- Vongruang, P.; Wongwises, P.; Pimonsree, S. Assessment of fire emission inventories for simulating particulate matter in Upper Southeast Asia using WRF-CMAQ. Atmos. Pollut. Res. 2017, 8, 921–929. [Google Scholar] [CrossRef]
- Giglio, L.; Randerson, J.T.; van der Werf, G.R. Analysis of daily, monthly, and annual burned area using the fourth-generation global fire emissions database (GFED4). J. Geophys. Res. Biogeosci. 2013, 118, 317–328. [Google Scholar] [CrossRef]
- Kaiser, J.W.; Heil, A.; Andreae, M.O.; Benedetti, A.; Chubarova, N.; Jones, L.; Morcrette, J.-J.; Razinger, M.; Schultz, M.G.; Suttie, M.; et al. Biomass burning emissions estimated with a global fire assimilation system based on observed fire radiative power. Biogeosciences 2012, 9, 527–554. [Google Scholar] [CrossRef]
- Byun, D.; Schere, K.L. Review of the governing equations, computational algorithms, and other components of the Models-3 Community Multiscale Air Quality (CMAQ) modeling system. Appl. Mech. Rev. 2006, 59, 51–77. [Google Scholar] [CrossRef]
- Li, M.; Zhang, Q.; Kurokawa, J.-i.; Woo, J.; He, K.; Lu, Z.; Ohara, T.; Song, Y.; Streets, D.; Carmichael, G. MIX: A mosaic Asian anthropogenic emission inventory for the MICS-Asia and the HTAP projects. Atmos. Chem. Phys. 2015, 15, 34813–34869. [Google Scholar] [CrossRef]
- National Institute of Environmental Research (NIER). 2017 National Air Pollutant Emissions. Available online: https://www.air.go.kr/jbmd/sub90_detail.do?tabPage=1&detailKey=61025P06&inputSchTxt=&typeSchOption=titleNm&menuId=POT027 (accessed on 8 September 2022).
- Guenther, A.; Jiang, X.; Heald, C.L.; Sakulyanontvittaya, T.; Duhl, T.; Emmons, L.; Wang, X. The Model of Emissions of Gases and Aerosols from Nature version 2.1 (MEGAN2. 1): An extended and updated framework for modeling biogenic emissions. Geosci. Model Dev. 2012, 5, 1471–1492. [Google Scholar] [CrossRef] [Green Version]
- Skamarock, W.C.; Klemp, J.B.; Dudhia, J.; Gill, D.O.; Barker, D.M.; Duda, M.G.; Huang, X.; Wang, W.; Powers, J.G. A Description of the Advanced Research WRF Version 3, NCAR Technical Note NCAR/TN-475+STR; NCAR: Boulder, CO, USA, 2008; p. 125. [Google Scholar]
- Uranishi, K.; Ikemori, F.; Shimadera, H.; Kondo, A.; Sugata, S. Impact of field biomass burning on local pollution and long-range transport of PM2.5 in Northeast Asia. Environ. Pollut. 2019, 244, 414–422. [Google Scholar] [CrossRef]
- Xu, R.; Tie, X.; Li, G.; Zhao, S.; Cao, J.; Feng, T.; Long, X. Effect of biomass burning on black carbon (BC) in South Asia and Tibetan Plateau: The analysis of WRF-Chem modeling. Sci. Total Environ. 2018, 645, 901–912. [Google Scholar] [CrossRef] [PubMed]
- Emmons, L.K.; Walters, S.; Hess, P.G.; Lamarque, J.-F.; Pfister, G.G.; Fillmore, D.; Granier, C.; Guenther, A.; Kinnison, D.; Laepple, T. Description and evaluation of the Model for Ozone and Related chemical Tracers, version 4 (MOZART-4). Geosci. Model Dev. 2010, 3, 43–67. [Google Scholar] [CrossRef]
- Choi, Y.; Jeon, W.; Roy, A.; Souri, A.H.; Diao, L.; Pan, S.; Eslami, E. CMAQ Modeling Archive for Exceptional Events Analyses. Available online: https://www.tceq.texas.gov/airquality/airmod/project/pj_report_pm.html (accessed on 8 September 2022).
- Val Martin, M.; Logan, J.; Kahn, R.; Leung, F.-Y.; Nelson, D.; Diner, D. Smoke injection heights from fires in North America: Analysis of 5 years of satellite observations. Atmos. Chem. Phys. 2010, 10, 1491–1510. [Google Scholar] [CrossRef]
- Field, R.D.; Luo, M.; Fromm, M.; Voulgarakis, A.; Mangeon, S.; Worden, J. Simulating the Black Saturday 2009 smoke plume with an interactive composition-climate model: Sensitivity to emissions amount, timing, and injection height. J. Geophys. Res.-Atmos. 2016, 121, 4296–4316. [Google Scholar] [CrossRef] [PubMed]
- Mallia, D.V.; Kochanski, A.K.; Urbanski, S.P.; Lin, J.C. Optimizing smoke and plume rise modeling approaches at local scales. Atmosphere 2018, 9, 166. [Google Scholar] [CrossRef]
- Gipson, G.L. Process analysis. In Science Algorithms of the EPA Models-3 Community Multiscale Air Quality (CMAQ) Modeling System; Byun, D.W., Ching, J.K.S., Eds.; Environmental Protection Agency: Washington, DC, USA, 2016; pp. 16.1–16.37. [Google Scholar]
- Bae, M.; Kim, H.C.; Kim, B.-U.; Kim, S. Development and application of the backward-tracking model analyzer to track physical and chemical processes of air parcels during the transport. J. Korean Soc. Atmos. Environ. 2017, 33, 217–232. [Google Scholar] [CrossRef]
- Jeon, W.; Park, J.; Choi, Y.; Mun, J.; Kim, D.; Kim, C.-H.; Lee, H.-J.; Bak, J.; Jo, H.-Y. The mechanism of the formation of high sulfate concentrations over the Yellow Sea during the KORUS-AQ period: The effect of transport/atmospheric chemistry and ocean emissions. Atmos. Res. 2021, 261, 105756. [Google Scholar] [CrossRef]
- Kitayama, K.; Morino, Y.; Yamaji, K.; Chatani, S. Uncertainties in O3 concentrations simulated by CMAQ over Japan using four chemical mechanisms. Atmos. Environ. 2019, 198, 448–462. [Google Scholar] [CrossRef]
- Park, J.; Jeon, W.; Mun, J.; Kim, D. A Quantitative Analysis of the Effect of Ocean Emissions on the Simulated Ozone Concentration in South Korea. J. Environ. Sci. Int. 2021, 30, 413–424. [Google Scholar] [CrossRef]
- Li, K.; Chen, L.; Ying, F.; White, S.J.; Jang, C.; Wu, X.; Gao, X.; Hong, S.; Shen, J.; Azzi, M. Meteorological and chemical impacts on ozone formation: A case study in Hangzhou, China. Atmos. Res. 2017, 196, 40–52. [Google Scholar] [CrossRef]
- Hurley, P.J.; Blockley, A.; Rayner, K. Verification of a prognostic meteorological and air pollution model for year-long predictions in the Kwinana industrial region of Western Australia. Atmos. Environ. 2001, 35, 1871–1880. [Google Scholar] [CrossRef]
- Kim, C.H.; Lee, S.H.; Jang, M.; Chun, S.N.; Kang, S.J.; Ko, K.K.; Lee, J.J.; Lee, H.J. A Study on statistical parameters for the evaluation of regional air quality modeling results—Focused on fine dust modeling. J. Environ. Impact Assess. 2020, 29, 272–285. [Google Scholar] [CrossRef]
- Chuang, M.-T.; Fu, J.S.; Lee, C.-T.; Lin, N.-H.; Gao, Y.; Wang, S.-H.; Sheu, G.-R.; Hsiao, T.-C.; Wang, J.-L.; Yen, M.-C. The simulation of long-range transport of biomass burning plume and short-range transport of anthropogenic pollutants to a mountain observatory in East Asia during the 7-SEAS/2010 Dongsha Experiment. Aerosol. Air Qual. Res. 2016, 16, 2933–2949. [Google Scholar] [CrossRef]
- Dong, X.; Fu, J.S.; Huang, K.; Lin, N.-H.; Wang, S.-H.; Yang, C.-E. Analysis of the co-existence of long-range transport biomass burning and dust in the subtropical West Pacific Region. Sci. Rep. 2018, 8, 8962. [Google Scholar] [CrossRef]
- Toh, Y.Y.; Lim, S.F.; Von Glasow, R. The influence of meteorological factors and biomass burning on surface ozone concentrations at Tanah Rata, Malaysia. Atmos. Environ. 2013, 70, 435–446. [Google Scholar] [CrossRef]
- Mateos, A.C.; Amarillo, A.C.; Tavera Busso, I.; Carreras, H.A. Influence of meteorological variables and forest fires events on air quality in an urban area (Córdoba, Argentina). Arch. Environ. Contam. Toxicol. 2019, 77, 171–179. [Google Scholar] [CrossRef] [PubMed]
- Jaffe, L.S. Ambient carbon monoxide and its fate in the atmosphere. J. Air Pollut. Control Assoc. 1968, 18, 534–540. [Google Scholar] [CrossRef] [PubMed]
- Jeon, W.-B.; Lee, S.-H.; Lee, H.-W.; Kim, H.-G. Process analysis of the impact of atmospheric recirculation on consecutive high-O3 episodes over the Seoul Metropolitan Area in the Korean Peninsula. Atmos. Environ. 2012, 63, 213–222. [Google Scholar] [CrossRef]
- Sillman, S. The relation between ozone, NOx and hydrocarbons in urban and polluted rural environments. Atmos. Environ. 1999, 33, 1821–1845. [Google Scholar] [CrossRef]
- Gao, W.; Tie, X.; Xu, J.; Huang, R.; Mao, X.; Zhou, G.; Chang, L. Long-term trend of O3 in a mega City (Shanghai), China: Characteristics, causes, and interactions with precursors. Sci. Total Environ. 2017, 603, 425–433. [Google Scholar] [CrossRef]
- Parrish, D.; Murphy, P.; Albritton, D.; Fehsenfeld, F. The measurement of the photodissociation rate of NO2 in the atmosphere. Atmos. Environ. (1967) 1983, 17, 1365–1379. [Google Scholar] [CrossRef]
- Jiménez, P.; Parra, R.; Gasso, S.; Baldasano, J.M. Modeling the ozone weekend effect in very complex terrains: A case study in the Northeastern Iberian Peninsula. Atmos. Environ. 2005, 39, 429–444. [Google Scholar] [CrossRef]
- Michelsen, H.; Salawitch, R.; Wennberg, P.; Anderson, J. Production of O (¹D) from photolysis of O3. Geophys. Res. Lett. 1994, 21, 2227–2230. [Google Scholar] [CrossRef]
Publisher’s Note: MDPI stays neutral with regard to jurisdictional claims in published maps and institutional affiliations. |
© 2022 by the authors. Licensee MDPI, Basel, Switzerland. This article is an open access article distributed under the terms and conditions of the Creative Commons Attribution (CC BY) license (https://creativecommons.org/licenses/by/4.0/).