Abstract
Fine particulate matter (PM) significantly affects visibility, a sensitive indicator of air pollution. Despite a continuous decrease in the PM concentrations in South Korea, the public generally believes that PM air pollution has worsened over the past years. To explain this disparity, we analyzed the characteristics of recent visibility changes using observations of visibility and PM component data observed in Seoul, South Korea, from 2012 to 2018. A significant negative correlation (R = −0.96) existed between visibility and concentrations of PM, with an aerodynamic diameter ≤ 2.5 μm (PM2.5); a high PM2.5 concentration was the most important contributor to poor visibility. Annual mean PM2.5 concentrations in Seoul decreased by −5.1% yr−1 during 2012–2018, whereas annual mean visibility improved by 2.1% yr−1. We found that a lower improvement in visibility was associated with changes in the PM component. Among the PM components affecting poor visibility, contributions of ammonium nitrate (NH4NO3) significantly increased during 2012–2018 (from 48% in 2012 to 59% in 2018). Increases in NO3− aerosol concentrations were owing to SOx emission reduction and the resulting decreases in SO42− aerosol concentrations, which led to an increase in NH3 available for additional NH4NO3 production in the atmosphere. Despite decreased PM concentrations in Seoul, the change of PM components has compromised visibility improvement; thus, NO3− concentrations need to be reduced.
1. Introduction
In 2013, the World Health Organization (WHO) declared particulate matter (PM) as a first-class carcinogen. In the past, PM was known to cause respiratory or eye diseases; however, recently, it has been a significant cause of myocardial infarction, pneumonia, and bronchitis [1,2]. In South Korea, high PM concentrations have been one of the most serious public concerns [3,4,5,6]. Consequently, PM forecasting and warning systems were implemented in early 2014 in South Korea. Since March 2018, the government has issued stringent PM air quality standards in South Korea (i.e., daily mean PM2.5 should be less than 35 µg m−3). Strict PM2.5 regulation has resulted in frequent warnings, which has also contributed to raising public awareness of the issues associated with PM. In particular, public awareness of air quality degradation is closely related to the poor visibility caused by large amounts of PM in the atmosphere [7,8,9].
Visibility degradation refers to decreased visible distance due to light scattering and absorption by particles or gases in the atmosphere [10,11,12,13]. Therefore, a visibility change is significantly related to factors including solar radiation, clouds, precipitation, and atmospheric chemical concentration and compositions (including gases and particles) [14,15,16,17]. In recent years, due to the strengthening of emission-reduction policies, concentrations of PM with an aerodynamic diameter ≤ 10 µm (PM10) and PM2.5 in South Korea have continuously decreased over the past years and, as a result, visibility has also improved [18,19,20,21]. Nevertheless, anxiety regarding air pollution continues to persist, indicating that the improvement in visibility may not be as apparent as the degree of the change in PM concentrations.
Several studies were conducted in South Korea on the long-term trends, spatial and temporal characteristics, and degradation factors related to visibility changes to understand the effects of PM’s chemical and optical properties on visibility degradation [22,23,24]. They mainly relied on visibility observations with a traditional method, which measured a maximum distance with the naked eye and was naturally prone to considerable uncertainty. As the visibility measured by maximum visible distances increases, the associated uncertainty of the observation significantly increases because the naked eye is insensitive to changes in visibility over long distances [25].
Since 2017, visibility has been measured based on the light intensity changes, using the transmitter to overcome the problem mentioned above [25,26,27]. However, the traditional eye and recent instrument-measurement methods show large discrepancies in visibility observations, depending on the environmental conditions [25]. Such discrepancies limit the analysis of continuous visibility trends in South Korea. This study used PM components and a light-extinction-coefficient equation to reconstruct visibility data, which were consistent with visibility observations from the two methods. We use this reconstructed dataset to analyze the visibility trends from 2012 to 2018 and to investigate the cause of the recent gap between visibility and PM2.5 concentration changes in South Korea. Moreover, these reconstructed visibility datasets not only suggest how to utilize both eye and instrumental observations in the long-term analysis of visibility, but also suggest directions for changes in the chemical environment in South Korea.
2. Materials and Methods
2.1. Observations
Our analysis used observations of meteorological variables, PM10, PM2.5, and PM2.5 chemical components, and NO2 concentrations in Seoul, South Korea (Table 1). Meteorological observations were conducted by the Korea Meteorological Administration (KMA; https://www.kma.go.kr/eng/ (accessed on 13 October 2022)) during 2012–2018, including observations of hourly precipitation and relative humidity (RH), which were measured by the Automated Synoptic Observing System (ASOS). Visibility observations with the naked eye were conducted every hour during the daytime and every 3 h at nighttime (1800–0300 LST). Eye observation is determined based on the clarity and color of the target after recognizing the distance to the surrounding buildings or terrain in advance. As of 1 January 2017, the KMA changed the visibility observation method from eye observation to instrument observation and measured visibility every hour. The instrument observation was produced by PWD22 (Vaisala Inc., Vantaa, Finland) and VPF-730 (Biral Ltd., Portishead, UK) and, basically, the observation techniques of the two instruments are similar. Hourly PM10 and PM2.5 concentrations, PM2.5 chemical components (SO42−, NO3−, NH4+, Ca2+, Fe2+, organic carbon (OC), and elemental carbon (EC)), and NO2 were observed by the National Institute of Environmental Research (NIER; https://nier.go.kr/NIER/eng/index.do (accessed on 13 October 2022)). The PM2.5 and PM10 concentrations were measured with BAM 1020 (MetOne Ins., Grants Pass, OR, USA) using the β-ray absorption method, and the concentrations of ions, carbon, and metal components in PM2.5 were measured with MARGA (Monitor for Aerosols and Gases in Ambient Air, Applikon Analytical, NED), Semi-continuous OCEC analyzer (Sunset Lab., Portland, OR, USA), and Xact-620 (XRF, Cooper Co., San Ramon, CA, USA), respectively. Although the NIER data were quality-controlled, the sum of PM2.5 components was 19% lower than the PM2.5 concentration due to unidentified substances, such as ions, crustal elements, and trace metals, as shown in previous studies [28,29,30]. However, the sum of PM2.5 components and PM2.5 showed a high correlation coefficient (R = 0.96), which improves the reliability of the PM2.5 component data we used. We also used domestic SOx, NOx, and NH3 emissions for 2012–2018 from the National Air Emission Inventory and Research Center (https://www.air.go.kr/eng/main.do (accessed on 13 October 2022)).

Table 1.
Aerosol, gas, weather, and emission data used in this study.
2.2. Visibility Data Reconstruction
Visibility observations may differ depending on the measurement methods. In particular, extreme meteorological conditions (e.g., cloud, precipitation, or fog) significantly affect visual observation [9,31,32], which creates a discrepancy from instrument observations [25,33]. Therefore, it is crucial to calibrate visibility observations by removing spurious signals. Precipitation is a typical meteorological phenomenon that causes poor visibility [15]. For example, in Seoul, the annual mean visibility when precipitation occurred during 2012–2018 was 5.0 km lower than that on a clear day. Another cause of visibility deterioration is yellow dust events [34,35,36], which decreases annual mean visibility by 0.05 km in Seoul compared to those with no yellow dust. The small effect of yellow dust on annual mean visibility compared to precipitation is because relatively large soil particles have low scattering efficiency and occur in fewer cases. Fog (i.e., visibility < 1 km and RH ~100%) is another crucial factor for poor visibility. Excluding fog may remove some polluted PM days together, but in a very humid environment, the scattering cross section of hygroscopic particles is more than five times higher than that of dry particles [37]. This can be a degradation factor in visibility analysis. Although these natural factors play essential roles in visibility changes, they were not the main focus of this study. Therefore, we excluded visibility observations in the presence of extreme meteorological conditions such as precipitation, fog, and yellow dust for the analysis described below to investigate the effects of PM and its composition on visibility changes.
According to the two methods, there is a systematic difference between the visibility data sets, which is a significant limitation for continuous visibility analysis. We use empirical equations that reflect light extinction by gases and aerosols to create a consistent visibility dataset. Table 2 shows the light extinction equations used in the visibility calculations developed by Interagency Monitoring of Protected Visual Environments (IMPROVE) and NIER [38,39,40], based on the observed PM component and NO2 concentrations and the ambient RH. Visibility calculation using the light-extinction coefficient was performed in previous studies [41,42,43]. IMPROVE_1994 is the light-extinction coefficient equation initially proposed by IMPROVE, based on U.S. observation data. The light-extinction coefficient is calculated by dividing the major aerosol components that cause reduced visibility, such as ammonium sulfate (NHSO), ammonium nitrate (NHNO), organic carbon (OMC), elemental carbon (EC), fine-mode soil particles (FS), and coarse-mode particles (CM; PM10–PM2.5). In addition, as water vapor in the atmosphere is absorbed by deliquescent particles, the water growth function (f(RH)) is considered. While IMPROVE_1994 applied f(RH) uniformly, regardless of particle size, IMPROVE_2007 minimized the error about f(RH) by subdividing it into fS(RH) and fL(RH) according to particle size. NIER calculated the light-extinction coefficient for each aerosol component determined through multivariate linear regression analysis based on data observed in South Korea.
Table 2.
Light-extinction coefficient equations of IMPROVE and NIER.
We first calculated hourly light extinctions in Seoul for 2017–2018, using equations in Table 2 with PM component-concentrations and humidity data. We then used the following Koschmieder formula to convert light extinctions (Mm−1) into reconstructed visibility (km) [44].
We evaluate the reconstructed visibility by comparing it with the instrument visibility for the same period. The correlation coefficients (R) between the instrument visibility and the reconstructed visibility using IMPROVE_1994, IMPROVE_2007, and NIER equations, were 0.26, 0.21, and 0.82, respectively. The reconstructed visibility based on the NIER equation shows the best agreement with the observation and is used for our analysis below. However, the NIER equation limits the maximum visibility up to 25.5 km, beyond which the maximum visibility observed with the naked eye was available. In particular, good visibility (>20 km) observed with the naked eye accounts for approximately 30% of the total hourly visibility observations. As mentioned above, to analyze poor visibility, which is closely related to air quality degradation, we excluded good visibility data (>17 km) from our analysis, which was not the main focus of the study. After filtering as described above, the correlation coefficient between the reconstructed visibility and instrument observation increased to 0.86. Then, the hourly reconstructed visibility data were averaged annually and used for analysis. Note that we examined all visibility data without limiting distance; however, there was no significant difference in our conclusions.
3. Results and Discussion
3.1. Annual Visibility Trend
The change in PM2.5 concentrations was an important factor in the visibility change in Seoul. Figure 1 shows the annual mean surface PM2.5 concentration and the reconstructed visibility (hereafter visibility) during 2012–2018. The PM2.5 concentration shows a clear decreasing trend, influenced not only by the emission-reduction policy in South Korea, but also by the recent clear decreasing trend of PM2.5 concentration in China [45,46,47]. Changes in PM2.5 concentration in China are known to significantly impact air quality in South Korea through long-range transport [6,48]. The annual mean visibility showed the opposite trend to the PM2.5 concentrations (R = −0.96). Interestingly, the range of change between the two differs: the annual mean PM2.5 concentrations decreased by −5.1% yr−1 during 2012–2018, while the annual mean visibility increased by only 2.1% yr−1. To understand why the increase in visibility was less than the decrease in the PM2.5 concentration, we additionally analyzed the concentrations of PM2.5 components (SO42−, NO3−, NH4+, OC, and EC). Figure 2 shows the annual mean variations of PM2.5 and PM2.5 component concentrations. Except for OC, the concentrations of PM2.5 components exhibited a decreasing trend similar to that of PM2.5 during 2012–2018.
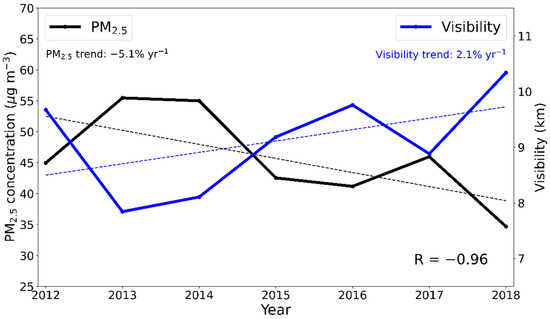
Figure 1.
Annual mean visibility (blue line) and surface concentrations of PM2.5 (black line) in Seoul, South Korea, during 2012–2018.
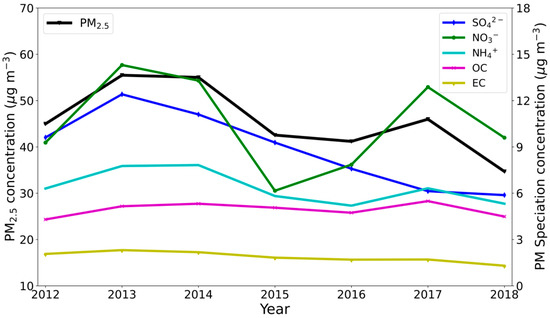
Figure 2.
Annual mean concentrations of PM2.5, SO42−, NO3−, NH4+, OC, and EC concentrations in Seoul, South Korea, during 2012–2018.
Table 3 shows the annual trends for PM2.5 and the components during 2012–2018. First, the decreasing trend of SO42− was −1.0 µg m−3 yr−1, which made the highest contribution to the decreasing trend of PM2.5, which was −2.3 µg m−3 yr−1. NO3− and NH4+ also contributed, but were statistically insignificant (p-value > 0.10). Previous studies have suggested the importance of carbonaceous aerosols (OC and EC) on visibility changes [13,41,49,50], but in Seoul, from 2012 to 2018, their contributions to PM2.5 concentrations were relatively low compared to secondary inorganic aerosols (see Figure 2). The changes of OC and BC concentrations were small (Table 3), and their trends were statistically insignificant, especially for OC. Except for the OC (for which the trend was weak), the annual variability of PM2.5 components showed a high correlation coefficient of >0.73 with that of PM2.5. In particular, NH4+ had the highest correlation coefficient of 0.96 with PM2.5. In addition, PM2.5 components showed a high negative correlation with visibility (−0.72 or higher), indicating that the annual change in aerosol concentration played an important role in visibility change.
Table 3.
Annual trends of concentrations of PM2.5, SO42−, NO3−, NH4+, OC, and EC concentrations in Seoul, South Korea, during 2012–2018, and correlation coefficients (R) between each variable and visibility trends.
3.2. Poor Visibility Analysis
For the general public, poor visibility is considered an indicator of air quality degradation; therefore, it is necessary to assess the recent changes in poor visibility. In particular, the annual mean visibility in Seoul has been improving in recent years (see Figure 1); however, since the public is sensitive to poor visibility, an increase in poor visibility can be perceived by the public as air quality degradation. Here, we analyzed the frequency of poor visibility in Seoul during 2012–2018.
The definition of poor visibility is arbitrary. For example, Fu et al. [51] and Sun et al. [52] used low visibility (<5 km) as poor visibility, while Luo et al. [53] used a much smaller distance (<3 km). Poor visibility is defined as the lowest 20th percentile of daily visibility in Seoul for 2012–2018, which are values lower than 6.1 km. Using this criterion, annual and diurnal (rush hour) frequencies of poor visibility were calculated. Note that to analyze the sensitivity of our results to the poor visibility criterion, we changed the poor visibility criterion to the lowest 5th (<3.6 km) and 10th (<4.7 km) percentile values, but there was no significant difference in our conclusions.
3.2.1. Annual Poor Visibility
Despite the decreasing trend of the annual mean PM2.5 concentration observed in Seoul during the analysis period, public concern regarding air pollution is most likely due to the public perception that air pollution has been worsening from poor visibility. Therefore, to investigate the trend of poor visibility, we examined the proportion of poor visibility in the total hourly visibility data. Figure 3 shows the annual mean poor visibility proportion in Seoul during 2012–2018. As mentioned above, we applied the criterion of poor visibility to cases <6.1 km. Since 2013, the poor visibility proportion has decreased, which is consistent with the increase in annual mean visibility in Seoul (Figure 1). The correlation coefficient between the poor visibility proportion and annual mean visibility was −0.94, which shows that poor visibility has played an important role in the annual mean visibility. In particular, the trend of poor visibility since 2013 was −3.3% points (p) yr−1, implying that the proportion of poor visibility has been rapidly decreasing in recent years.
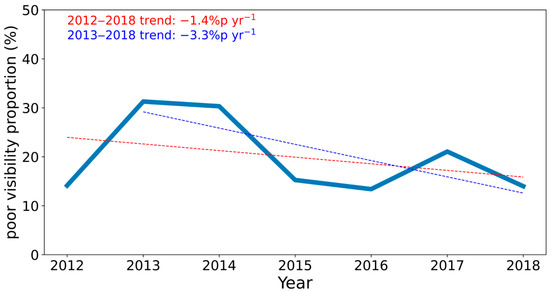
Figure 3.
Annual mean poor visibility proportion in Seoul, South Korea, during 2012–2018. Note that the trends of 2012–2018 (red dotted line) and 2013–2018 (blue dotted line) are separated. Note that %p stands for % points.
3.2.2. Poor Visibility in Rush Hour
When people are actively engaged in outdoor activities during commuting hours, they may be exposed to PM more than during other times due to traffic congestion in metropolitan cities such as Seoul. Therefore, we indirectly examined the changes in concerns of people caused by high concentrations of PM through poor visibility changes during rush hour periods. Figure 4 shows the poor visibility during two rush hour periods (morning rush hour: 0700–0900 LST; and evening rush hour: 1700–1900 LST). The 7–year mean poor visibility proportion in Seoul was 7.8%p higher in the morning rush hour (24.2%) than in the evening rush hour (16.4%); this was generally due to the lower planetary boundary layer and higher RH in the morning rush hour than in the evening rush hour [54,55]. As mentioned above, we set the criterion of poor visibility as the lowest 20th percentile value of hourly visibility data. Therefore, the high poor visibility proportion during the morning rush hour means that the morning rush hour significantly contributed to the change in the poor visibility proportion in Seoul. In recent years, poor visibility has decreased in both morning and evening rush hours; however, the change has been more significant in the morning rush hour (−1.8%p yr−1) than in the evening rush hour (−1.4%p yr−1).
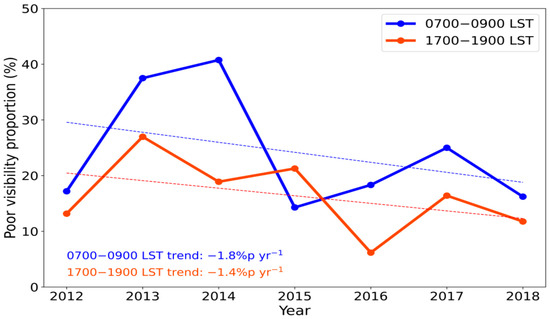
Figure 4.
Annual mean poor visibility proportion during the morning (0700–0900 LST; blue solid line) and evening (1700–1900 LST; red solid line) rush hour periods in Seoul, South Korea, during 2012–2018. Note that the trends of the morning (blue dotted line) and evening (red dotted line) are separated and %p stands for % points.
3.3. Factors Affecting Poor Visibility
To better understand the change in poor visibility, we additionally analyzed the change in concentrations of PM2.5 components during poor visibility conditions. Figure 5 shows the annual mean variations of PM2.5 and the concentrations of the components during poor visibility. When all cases of observed visibility <17 km were considered, the NO3− concentration in Seoul showed the same negative trend as PM2.5 (see Figure 2). However, when only considering the poor visibility of <6.1 km, the NO3− concentration showed a different trend, unlike the negative trend of the PM2.5 concentration. In particular, since 2015, the NO3− concentration has shown a steadily increasing trend, which is opposite to that of PM2.5 with a steadily decreasing trend.
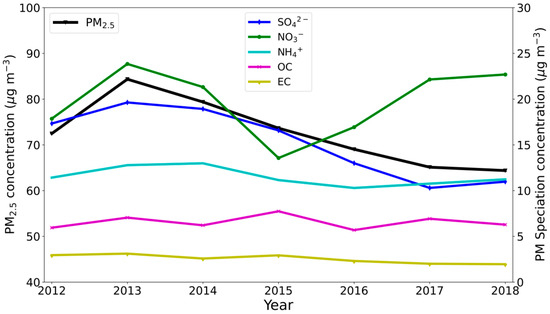
Figure 5.
Annual mean concentrations of PM2.5, SO42−, NO3−, NH4+, OC, and EC in Seoul, South Korea, during poor visibility from 2012 to 2018.
Table 4 shows the annual trends in PM2.5 and its components from 2012 to 2018 during poor visibility conditions. The decreasing trend of SO42− was −1.6 µg m−3 yr−1, contributing the most to the decreasing trend of PM2.5 of −2.6 µg m−3 yr−1 and was statistically significant. In addition, SO42− (R = 0.95) and NH4+ (R = 0.83) showed high correlation coefficients with PM2.5, indicating that they were major components in the variability of the PM2.5 concentration under poor visibility conditions. However, during poor visibility conditions, the correlations with visibility were higher with NO3− (R = −0.60) and NH4+ (R = −0.77) than with SO42− (R = −0.38), even with the low statistical significance of the annual concentration trend (p-value > 0.10). In other words, this result shows that although SO42− made a higher contribution than NO3− to the trend in the PM2.5 concentration, the contribution of the NO3− concentration had a stronger influence on the poor visibility trend. It also shows that NH4NO3 played a major role in visibility changes; this is described in more detail in Section 3.4. The correlation between carbonaceous aerosols (OC and EC) and visibility was relatively insignificant (R = −0.03 and R = 0.01, respectively), highlighting the importance of secondary inorganic aerosols (SO42−, NO3−, and NH4+) for poor visibility conditions. The mean cation to anion equivalent ratio observed in Seoul from 2012 to 2018 is 1.01, which indicates that the inorganic salts were fully neutralized in the forms of (NH4)2SO4 and NH4NO3.
Table 4.
Annual trends of concentrations of PM2.5, SO42−, NO3−, NH4+, OC, and EC in Seoul, South Korea, from 2012 to 2018 during poor visibility conditions, and correlation coefficients (R) between each variable and visibility trends.
The optical properties of aerosols are sensitively affected by the composition and size of hygroscopic particles, which are closely controlled by atmospheric humidity [37]. From 2012 to 2018, RH showed an increasing trend under poor visibility conditions (0.8% yr−1). An increase in RH may have contributed to suppressing the improvement in visibility, as higher RH and a more humid environment are more favorable for the hygroscopic growth of particles and subsequent decrease in visibility. However, the change in RH and visibility showed a weak correlation (R = 0.28), and the trend of RH also showed low statistical significance (p-value > 0.10).
3.4. Variations of SO42− and NO3− Concentrations
3.4.1. Budget Changes of Light-Extinction Coefficient
We derive the reconstructed visibility data by calculating the light-extinction coefficient based on the PM components (Table 2). Here, we analyze the light-extinction coefficient for each PM component to examine the cause of the recent improvement in visibility in Seoul that is lower than the improvement in PM2.5 concentrations. Figure 6 shows the annual trend of the light-extinction coefficient for PM components from 2012 to 2018 during poor visibility conditions. Since visibility has an inverse correlation with the extinction coefficient (Equation (1)), a decrease in the light-extinction coefficient means an improvement in visibility. According to the trend of light-extinction coefficient under poor visibility conditions, (NH4)2SO4 significantly contributed to the improvement of visibility (−13.6 Mm−1 yr−1), but as the concentration of NO3− increased, NH4NO3 contributed to the deterioration of visibility (9.4 Mm−1 yr−1). In poor visibility conditions, both PM2.5 and visibility are improved due to a significant decrease in SO42− concentration, but an increase in NO3− concentration suppresses the visibility improvement. Furthermore, NH4NO3 has higher mass extinction efficiency (light-extinction coefficient per unit mass) than (NH4)2SO4, resulting in larger visibility degradation with the same mass concentration (see Table 2).
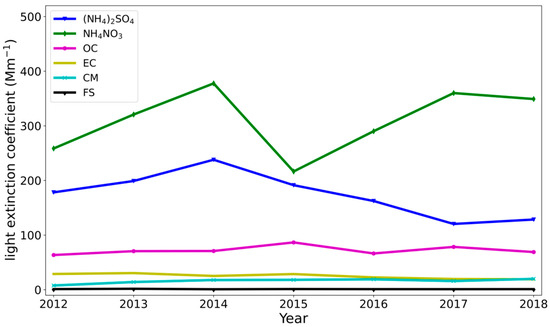
Figure 6.
Annual mean light-extinction coefficient (M m−1) of (NH4)2SO4, NH4NO3, OC, and EC, CM, and FS in Seoul, South Korea, during poor visibility from 2012 to 2018. Note that CM = PM10 − PM2.5, and FS = 1.40[Ca] + 1.43[Fe].
We quantitatively analyzed the effects of PM component changes on visibility. Figure 7 shows the proportion of the light-extinction coefficient for 2 years (i.e., 2012 and 2018), representing the relative influence of each PM2.5 component on reduced visibility. NH4NO3 contributed the most to poor visibility among the PM components, followed by (NH4)2SO4, OC, and EC. In recent years, visibility has improved, and the poor visibility proportion has decreased (see Figure 1 and Figure 3). However, the effect of NH4NO3 on poor visibility has been increasing. In 2012, the proportion of NH4NO3 contributing to poor visibility was 48%; however, this increased to 59% in 2018. In contrast, (NH4)2SO4 decreased from 33% to 22% over the same period. The reason for this was the decrease in SOx emissions, and the excess NH3 due to the decrease in the (NH4)2SO4 concentration contributed to the increase in the NH4NO3 concentration (Figure 5).
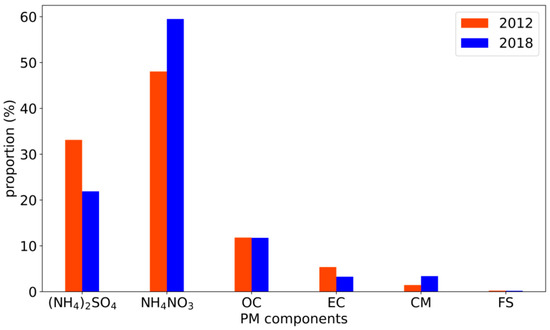
Figure 7.
Proportion of light-extinction coefficient budget for (NH4)2SO4, NH4NO3, OC, EC, PM10 − PM2.5 (CM), and 1.40[Ca] + 1.43[Fe] (FS) in Seoul, South Korea, during poor visibility in 2012 and 2018.
3.4.2. Effects of Changes in SOx and NOx Emissions on Visibility
To analyze the changes in SO42− and NO3− concentrations in Seoul over two years, 2012 and 2018, we examined the changes in emissions of the precursor, such as SOx and NOx, which significantly contribute to the concentrations of both species. Although SO42− and NO3− are secondary aerosols produced by complex reactions of thermodynamic equilibrium in the atmosphere [56], different trends in their precursor emissions are critical factors in determining the respective aerosol concentrations. Here, in comparing emissions, we considered the Seoul Metropolitan area, including Seoul, Incheon, and Gyeonggi-do, which may affect the generation of secondary aerosols in Seoul.
In 2018, the SO42− concentration had decreased by 36.7% compared to 2012, while the NO3− concentration had increased by 27.0% (Table 5). The distinct difference in the concentration change between the two components was highly correlated with the change in SOx and NOx emissions. During the two periods, SOx emissions decreased by 39.8%, similar to the 36.7% decrease in the SO42− concentration. In general, SO42− and NO3− exist in the forms of (NH4)2SO4 and NH4NO3 in the atmosphere [57]. (NH4)2SO4 has a stoichiometric ratio of SO42− and NH4+ of 1:2, and NH4NO3 is composed of NO3− and NH4+ at a ratio of 1:1. Theoretically, the NO3− molar concentration can be doubled by the reduced SO42− molar concentration. Moreover, NO3− is optically 47% more effective than SO42− in reducing visibility (see Table 2). Due to the decreased SO42− concentration, all the available NH3 contributed to the increase in the NO3− concentration. Therefore, the NO3− concentration increase was due to the decrease in SOx emissions, and in addition to the 17.6% increase in NOx emission in 2018 compared to 2012, the 3.4% increase in NH3 emission also contributed to the increase in NO3− concentration. As such, different changes between PM components have played an important role in recent visibility changes. That is, in 2018 compared to 2012, although the increase in the NO3− concentration was smaller than the decrease in the SO42− concentration, the change in the light-extinction coefficient during the same period showed that the increase in NH4NO3 was larger than the decrease in (NH4)2SO4 (Table 6). This result means that the increase in NH4NO3 concentration is an important contribution to the recent slowness in visibility improvement in Seoul despite the decrease in PM2.5 concentration.
Table 5.
Changes (%) in SO42−, NO3−, and NH4+ concentrations and their precursor emissions in 2012 and 2018.
Table 6.
Changes in (NH4)2SO4 and NH4NO3 concentrations (µg m−3) and light-extinction coefficients (Mm−1) in 2012 and 2018.
Moreover, the increase in NOx emissions in the Seoul metropolitan area (which is in an NH3-rich condition) [58,59,60] will play an important role, not only in suppressing the decrease in PM2.5 concentration, but also in increasing the NO3− proportion in the PM2.5 component. Therefore, detailed emission-reduction policies are required to reduce the PM2.5 concentration and improve visibility.
Local sources of precursor emissions strongly influence the generation of secondary inorganic aerosols. In addition, long-range transport from China is also an important part of secondary inorganic aerosols because the Korean Peninsula is located downstream of China, the largest source of pollution in East Asia [48]. Although the concentration trend of secondary inorganic aerosols in Seoul is closely related to changes in emissions in the Seoul metropolitan area, as seen above, it is not easy to evaluate the effects of emissions more accurately only with observational information. Therefore, a sensitivity experiment using a three-dimensional atmospheric chemical-transport model is required, but it is far from the scope of this study.
4. Conclusions
In recent years, the annual mean PM2.5 concentration in Seoul has been decreasing; however, people tend to perceive that the air quality is deteriorating. We investigated the cause of the discrepancy by focusing on the changes in visibility that are closely related to air quality degradation and especially evaluated the effects of changes in the PM2.5 components on poor visibility. Contrary to concerns, the annual mean PM2.5 concentration and visibility steadily improved during 2012–2018 in Seoul, which shows that PM2.5 plays an important role in improving visibility. However, while the PM2.5 concentrations decreased by −5.1% yr−1 from 2012–2018, visibility only increased by 2.1% yr−1.
To understand why the increase in visibility was less than the decrease in the PM2.5 concentrations, we investigated the trend of poor visibility, which is the lowest 20% value for hourly visibility. The trend of the poor visibility proportion in Seoul is −1.4%p yr−1, which has been steadily improving in recent years. In particular, the decrease in poor visibility during the morning rush hour (−1.8%p yr−1) was noticeable compared to that in the evening rush hour (−1.4%p yr−1). Next, we calculated the light-extinction coefficient for each PM2.5 component to determine the importance of each component that contributed to poor visibility. We found that NH4NO3 contributed the most to poor visibility and that its impact gradually increased (i.e., from 48% in 2012 to 59% in 2018).
In contrast, the contribution of (NH4)2SO4 decreased from 33% to 22% over the same period. In other words, the importance of NO3− has been increasing in Seoul recently, in terms of both the PM2.5 concentration and poor visibility; however, the influence of SO42− has been decreasing. This is evident in changes in the emissions of SOx, i.e., a precursor of SO42−. During the two periods (2012 and 2018), the SOx emissions in the Seoul Metropolitan area decreased by 39.8%, which is consistent with the decrease in the SO42− concentration during the same period. Moreover, the decrease in the SO42− concentration contributed significantly to the increase in the NO3− concentration and the available NH3 concentration, which is noteworthy in terms of the recent changes in air quality in Seoul.
A decrease in the SO42− concentration with a reduction of SOx emissions is favorable to the reduction of PM2.5 concentrations. However, in the Seoul Metropolitan area, which is in an NH3-rich condition, the available NH3 contributed significantly to the NH4NO3 concentration by increasing the NOx emission. In addition, NO3− can be generated as a double of SO42− reduction, and optically, NO3− is 47% more effective than SO42− in reducing visibility. Therefore, as the PM component recently shifted from SO42− to NO3−, the visibility improvement in Seoul appeared slower than the decrease in PM2.5 concentrations. Reducing both NOx and NH3 emissions is required to improve PM2.5 and poor visibility in Seoul. To achieve this, it is necessary to comprehensively understand the chemical reaction involved in each component and implement effective emission-reduction policies.
Visibility and PM2.5 concentrations have recently been improving in Seoul. Nevertheless, another cause of public concern regarding air quality may be increased public interest in air quality degradation. As the WHO designated PM as a class 1 carcinogen, public concerns regarding health have been increasing. Furthermore, PM forecasts can be easily accessed through mass media, such as television or the internet, which has increased public interest and concern regarding air quality.
Author Contributions
Conceptualization, J.I.J., J.S. and R.J.P.; methodology, J.I.J. and J.S.; software, J.I.J. and J.S.; validation, J.I.J. and J.S.; formal analysis, J.S.; investigation, J.S.; writing—original draft preparation, J.I.J.; writing—review and editing, J.I.J., J.S. and R.J.P.; visualization, J.I.J. and J.S.; All authors have read and agreed to the published version of the manuscript.
Funding
This work was supported by the National Research Foundation of Korea (NRF) grant, funded by the Korea government (MSIT) (NRF-2018R1A5A1024958), and by the FRIEND (Fine Particle Research Initiative in East Asia Considering National Differences) Project through the National Research Foundation of Korea (NRF), funded by the Ministry of Science and ICT (2020M3G1A1114617).
Data Availability Statement
Not applicable.
Acknowledgments
We thank the anonymous reviewers for their constructive and meaningful comments.
Conflicts of Interest
The authors declare no conflict of interest.
References
- Breysse, P.N.; Diette, G.B.; Matsui, E.C.; Butz, A.M.; Hansel, N.N.; McCormack, M.C. Indoor air pollution and asthma in children. Proc. Am. Thorac. Soc. 2010, 7, 102–106. [Google Scholar] [CrossRef] [PubMed]
- Raaschou-Nielsen, O.; Andersen, Z.J.; Beelen, R.; Samoli, E.; Stafoggia, M.; Weinmayr, G.; Hoffmann, B.; Fischer, P.; Nieuwenhuijsen, M.J.; Brunekreef, B.; et al. Air pollution and lung cancer incidence in 17 European cohorts: Prospective analyses from the European Study of Cohorts for Air Pollution Effects (ESCAPE). Lancet Oncol. 2013, 14, 813–822. [Google Scholar] [CrossRef]
- Ahmed, E.; Kim, K.H.; Shon, Z.H.; Song, S.K. Long-term trend of airborne particulate matter in Seoul, Korea from 2004 to 2013. Atmos. Environ. 2015, 101, 125–133. [Google Scholar] [CrossRef]
- Kim, Y.P.; Lee, G. Trend of air quality in Seoul: Policy and science. Aerosol Air Qual. Res. 2018, 18, 2141–2156. [Google Scholar] [CrossRef]
- Jo, E.J.; Lee, W.S.; Jo, H.Y.; Kim, C.H.; Eom, J.S.; Mok, J.H.; Kim, M.H.; Lee, K.; Kim, K.U.; Lee, M.K.; et al. Effects of particulate matter on respiratory disease and the impact of meteorological factors in Busan, Korea. Respir. Med. 2017, 124, 79–87. [Google Scholar] [CrossRef] [PubMed]
- Kim, H.-K.; Song, C.-K.; Han, K.M.; Eo, Y.D.; Song, C.H.; Park, R.; Hong, S.-C.; Kim, S.-K.; Woo, J.-H. Impact of biogenic emissions on early summer ozone and fine particulate matter exposure in the Seoul Metropolitan Area of Korea. Air Qual. Atmos. Health 2018, 11, 1021–1035. [Google Scholar] [CrossRef]
- Gao, J.; Woodward, A.; Vardoulakis, S.; Kovats, S.; Wilkinson, P.; Li, L.; Xu, L.; Li, J.; Yang, J.; Li, J.; et al. Haze, public health and mitigation measures in China: A review of the current evidence for further policy response. Sci. Total Environ. 2017, 578, 148–157. [Google Scholar] [CrossRef]
- Hyslop, N.P. Impaired visibility: The air pollution people see. Atmos. Environ. 2009, 43, 182–195. [Google Scholar] [CrossRef]
- Chang, D.; Song, Y.; Liu, B. Visibility trends in six megacities in China 1973–2007. Atmos. Res. 2009, 94, 161–167. [Google Scholar] [CrossRef]
- See, S.W.; Balasubramanian, R.; Wang, W. A study of the physical, chemical, and optical properties of ambient aerosol particles in Southeast Asia during hazy and nonhazy days. J. Geophys. Res. Atmos. 2006, 111, D10S08. [Google Scholar] [CrossRef]
- Kim, Y.J.; Kim, K.W.; Kim, S.D.; Lee, B.K.; Han, J.S. Fine particulate matter characteristics and its impact on visibility impairment at two urban sites in Korea: Seoul and Incheon. Atmos. Environ. 2006, 40, 593–605. [Google Scholar] [CrossRef]
- Cao, J.J.; Wang, Q.Y.; Chow, J.C.; Watson, J.G.; Tie, X.X.; Shen, Z.X.; Wang, P.; An, Z.S. Impacts of aerosol compositions on visibility impairment in Xi’an, China. Atmos. Environ. 2012, 59, 559–566. [Google Scholar] [CrossRef]
- Xiao, S.; Wang, Q.Y.; Cao, J.J.; Huang, R.J.; Chen, W.D.; Han, Y.M.; Xu, H.M.; Liu, S.X.; Zhou, Y.Q.; Wang, P.; et al. Long-term trends in visibility and impacts of aerosol composition on visibility impairment in Baoji, China. Atmos. Res. 2014, 149, 88–95. [Google Scholar] [CrossRef]
- Deng, H.; Tan, H.; Li, F.; Cai, M.; Chan, P.W.; Xu, H.; Huang, X.; Wu, D. Impact of relative humidity on visibility degradation during a haze event: A case study. Sci. Total Environ. 2016, 569–570, 1149–1158. [Google Scholar] [CrossRef]
- Horvath, H. Atmospheric light absorption-A review. Atmos. Environ. Part A Gen. Top. 1993, 27, 293–317. [Google Scholar] [CrossRef]
- Zhang, Q.; Quan, J.; Tie, X.; Li, X.; Liu, Q.; Gao, Y.; Zhao, D. Effects of meteorology and secondary particle formation on visibility during heavy haze events in Beijing, China. Sci. Total Environ. 2015, 502, 578–584. [Google Scholar] [CrossRef]
- Chow, J.C.; Watson, J.G.; Fujita, E.M.; Lu, Z.; Lawson, D.R.; Ashbaugh, L.L. Temporal and spatial variations of PM2.5 and PM10 aerosol in the Southern California air quality study. Atmos. Environ. 1994, 28, 2061–2080. [Google Scholar] [CrossRef]
- Kim, Y.; Yi, S.M.; Heo, J. Fifteen-year trends in carbon species and PM2.5 in Seoul, South Korea (2003–2017). Chemosphere 2020, 261, 127750. [Google Scholar] [CrossRef]
- Bae, M.; Kim, B.U.; Kim, H.C.; Kim, J.; Kim, S. Role of emissions and meteorology in the recent PM2.5 changes in China and South Korea from 2015 to 2018. Environ. Pollut. 2021, 270, 116233. [Google Scholar] [CrossRef]
- Cho, J.H.; Kim, H.S.; Chung, Y.S. Spatio-temporal changes of PM10 trends in South Korea caused by East Asian atmospheric variability. Air Qual. Atmos. Health 2021, 14, 1001–1016. [Google Scholar] [CrossRef]
- Joo, S.; Dehkhoda, N.; Shin, J.; Park, M.E.; Sim, J.; Noh, Y. A Study on the Long-Term Variations in Mass Extinction Efficiency Using Visibility Data in South Korea. Remote Sens. 2022, 14, 1592. [Google Scholar] [CrossRef]
- Lee, J.Y.; Jo, W.K.; Chun, H.H. Long-term trends in visibility and its relationship with mortality, air-quality index, and meteorological factors in selected areas of Korea. Aerosol Air Qual. Res. 2015, 15, 673–681. [Google Scholar] [CrossRef]
- Kim, K.W. Optical Properties of Size-Resolved Aerosol Chemistry and Visibility Variation Observed in the Urban Site of Seoul, Korea. Aerosol Air Qual. Res. 2015, 15, 271–283. [Google Scholar] [CrossRef]
- Kim, M.; Lee, K.; Lee, Y.H. Visibility Data Assimilation and Prediction Using an Observation Network in South Korea. Pure Appl. Geophys. 2020, 177, 1125–1141. [Google Scholar] [CrossRef]
- Kim, K.W. The comparison of visibility measurement between image-based visual range, human eye-based visual range, and meteorological optical range. Atmos. Environ. 2018, 190, 74–86. [Google Scholar] [CrossRef]
- Yu, Z.; Wang, J.; Liu, X.; He, L.; Cai, X.; Ruan, S. A new video-camera-based visiometer system. Atmos. Sci. Lett. 2019, 20, e925. [Google Scholar] [CrossRef]
- Tang, F.; Ma, S.; Yang, L.; Du, C.; Tang, Y. A new visibility measurement system based on a black target and a comparative trial with visibility instruments. Atmos. Environ. 2016, 143, 229–236. [Google Scholar] [CrossRef]
- Choi, J.; Park, R.J.; Lee, H.M.; Lee, S.; Jo, D.S.; Jeong, J.I.; Henze, D.K.; Woo, J.H.; Ban, S.J.; Lee, M.D.; et al. Impacts of local vs. trans-boundary emissions from different sectors on PM2.5 exposure in South Korea during the KORUS-AQ campaign. Atmos. Environ. 2019, 203, 196–205. [Google Scholar] [CrossRef]
- Bae, C.; Kim, B.-U.; Kim, H.C.; Yoo, C.; Kim, S. Long-Range Transport Influence on Key Chemical Components of PM2.5 in the Seoul Metropolitan Area, South Korea, during the Years 2012–2016. Atmosphere 2020, 11, 48. [Google Scholar] [CrossRef]
- Park, S.S.; Jung, S.A.; Gong, B.J.; Cho, S.Y.; Lee, S.J. Characteristics of PM2.5 haze episodes revealed by highly time-resolved measurements at an air pollution monitoring supersite in Korea. Aerosol Air Qual. Res. 2013, 13, 957–976. [Google Scholar] [CrossRef]
- Gao, L.; Jia, G.; Zhang, R.; Che, H.; Fu, C.; Wang, T.; Zhang, M.; Jiang, H.; Yan, P. Visual range trends in the Yangtze River Delta Region of China, 1981–2005. J. Air Waste Manag. Assoc. 2011, 61, 843–849. [Google Scholar] [CrossRef] [PubMed]
- Chen, X.; Li, X.; Yuan, X.; Zeng, G.; Liang, J.; Li, X.; Xu, W.; Luo, Y.; Chen, G. Effects of human activities and climate change on the reduction of visibility in Beijing over the past 36 years. Environ. Int. 2018, 116, 92–100. [Google Scholar] [CrossRef] [PubMed]
- Tai, H.; Zhuang, Z.; Sun, D. Development and accuracy of a multipoint method for measuring visibility. Appl. Opt. 2017, 56, 7952–7959. [Google Scholar] [CrossRef] [PubMed]
- Mahowald, N.M.; Ballantine, J.A.; Feddema, J.; Ramankutty, N. Global trends in visibility: Implications for dust sources. Atmos. Chem. Phys. 2007, 7, 3309–3339. [Google Scholar] [CrossRef]
- Baddock, M.C.; Strong, C.L.; Leys, J.F.; Heidenreich, S.K.; Tews, E.K.; McTainsh, G.H. A visibility and total suspended dust relationship. Atmos. Environ. 2014, 89, 329–336. [Google Scholar] [CrossRef]
- Ozer, P.; Laghdaf, M.B.O.M.; Lemine, S.O.M.; Gassani, J. Estimation of air quality degradation due to Saharan dust at Nouakchott, Mauritania, from horizontal visibility data. Water Air Soil Pollut. 2007, 178, 79–87. [Google Scholar] [CrossRef]
- Malm, W.C.; Day, D.E. Estimates of aerosol species scattering characteristics as a function of relative humidity. Atmos. Environ. 2001, 35, 2845–2860. [Google Scholar] [CrossRef]
- Malm, W.C.; Sisler, J.F.; Huffman, D.; Eldred, R.A.; Cahill, T.A. Spatial and seasonal trends in particle concentration and optical extinction in the United States. J. Geophys. Res. 1994, 99, 1347–1370. [Google Scholar] [CrossRef]
- Pitchford, M.; Malm, W.; Schichtel, B.; Kumar, N.; Lowenthal, D.; Hand, J. Revised algorithm for estimating light extinction from IMPROVE particle speciation data. J. Air Waste Manag. Assoc. 2007, 57, 1326–1336. [Google Scholar] [CrossRef]
- NIER. Study on the Management Plan of Metropolitan Air Quality; National Institute of Environmental Research: Incheon, Korea, 2006. (In Korean) [Google Scholar]
- Li, Y.; Huang, H.X.H.; Griffith, S.M.; Wu, C.; Lau, A.K.H.; Yu, J.Z. Quantifying the relationship between visibility degradation and PM2.5 constituents at a suburban site in Hong Kong: Differentiating contributions from hydrophilic and hydrophobic organic compounds. Sci. Total. Environ. 2017, 575, 1571–1581. [Google Scholar] [CrossRef]
- Qu, W.J.; Wang, J.; Zhang, X.Y.; Wang, D.; Sheng, L.F. Influence of relative humidity on aerosol composition: Impacts on light extinction and visibility impairment at two sites in coastal area of China. Atmos. Res. 2015, 153, 500–511. [Google Scholar] [CrossRef]
- Park, S.M.; Song, I.H.; Park, J.S.; Oh, J.; Moon, K.J.; Shin, H.J.; Ahn, J.Y.; Lee, M.D.; Kim, J.; Lee, G. Variation of PM2.5 chemical compositions and their contributions to light extinction in Seoul. Aerosol Air Qual. Res. 2018, 18, 2220–2229. [Google Scholar] [CrossRef]
- Koschmieder, H. Theorie der horizontalen Sichtweite. Beitr. Phys. Freien Atm. 1924, 12, 33–55. [Google Scholar]
- Wang, Y.; Gao, W.; Wang, S.; Song, T.; Gong, Z.; Ji, D.; Wang, L.; Liu, Z.; Tang, G.; Huo, Y.; et al. Contrasting trends of PM2.5 and surface-ozone concentrations in China from 2013 to 2017. Natl. Sci. Rev. 2020, 7, 1331–1339. [Google Scholar] [CrossRef]
- Zhao, S.; Yin, D.; Yu, Y.; Kang, S.; Qin, D.; Dong, L. PM2.5 and O3 pollution during 2015–2019 over 367 Chinese cities: Spatiotemporal variations, meteorological and topographical impacts. Environ. Pollut. 2020, 264, 114694. [Google Scholar] [CrossRef] [PubMed]
- Xiao, Q.; Zheng, Y.; Geng, G.; Chen, C.; Huang, X.; Che, H.; Zhang, X.; He, K.; Zhang, Q. Separating emission and meteorological contributions to long-term PM2.5 trends over eastern China during 2000–2018. Atmos. Chem. Phys. 2021, 21, 9475–9496. [Google Scholar] [CrossRef]
- Kumar, N.; Park, R.J.; Jeong, J.I.; Woo, J.H.; Kim, Y.; Johnson, J.; Yarwood, G.; Kang, S.; Chun, S.; Knipping, E. Contributions of international sources to PM2.5 in South Korea. Atmos. Environ. 2021, 261, 118542. [Google Scholar] [CrossRef]
- Zou, J.; Liu, Z.; Hu, B.; Huang, X.; Wen, T.; Ji, D.; Liu, J.; Yang, Y.; Yao, Q.; Wang, Y. Aerosol chemical compositions in the North China Plain and the impact on the visibility in Beijing and Tianjin. Atmos. Res. 2018, 201, 235–246. [Google Scholar] [CrossRef]
- Dumka, U.C.; Tiwari, S.; Kaskaoutis, D.G.; Hopke, P.K.; Singh, J.; Srivastava, A.K.; Bisht, D.S.; Attri, S.D.; Tyagi, S.; Misra, A.; et al. Assessment of PM 2.5 chemical compositions in Delhi: Primary vs secondary emissions and contribution to light extinction coefficient and visibility degradation. J. Atmos. Chem. 2016, 74, 423–450. [Google Scholar] [CrossRef]
- Fu, C.; Wu, J.; Gao, Y.; Zhao, D.; Han, Z. Consecutive extreme visibility events in China during 1960–2009. Atmos. Environ. 2013, 68, 1–7. [Google Scholar] [CrossRef]
- Sun, X.; Zhao, T.; Liu, D.; Gong, S.; Xu, J.; Ma, X. Quantifying the influences of PM2.5 and relative humidity on change of atmospheric visibility over recent winters in an urban area of East China. Atmosphere 2020, 11, 461. [Google Scholar] [CrossRef]
- Luo, C.H.; Wen, C.Y.; Yuan, C.S.; Liaw, J.J.; Lo, C.C.; Chiu, S.H. Investigation of urban atmospheric visibility by high-frequency extraction: Model development and field test. Atmos. Environ. 2005, 39, 2545–2552. [Google Scholar] [CrossRef]
- Oak, Y.J.; Park, R.J.; Schroeder, J.R.; Crawford, J.H.; Blake, D.R.; Weinheimer, A.J.; Woo, J.H.; Kim, S.W.; Yeo, H.; Fried, A.; et al. Evaluation of simulated O3 production efficiency during the KORUS-AQ campaign: Implications for anthropogenic NOx emissions in Korea. Elementa 2019, 7, 56. [Google Scholar] [CrossRef]
- Ryu, Y.H.; Baik, J.J.; Kwak, K.H.; Kim, S.; Moon, N. Impacts of urban land-surface forcing on ozone air quality in the Seoul metropolitan area. Atmos. Chem. Phys. 2013, 13, 2177–2194. [Google Scholar] [CrossRef]
- Fountoukis, C.; Nenes, A. ISORROPIAII: A computationally efficient thermodynamic equilibrium model for K+-Ca2+-Mg2+-NH4 +-Na+-SO4 2−-NO3−-Cl−-H2O aerosols. Atmos. Chem. Phys. 2007, 7, 4639–4659. [Google Scholar] [CrossRef]
- Seinfeld, J.H.; Pandis, S.N. Atmospheric Chemistry and Physics: From Air Pollution to Climate Change; John Wiley & Sons: Hoboken, NJ, USA, 2016. [Google Scholar]
- Lim, Y.B.; Seo, J.; Kim, J.Y.; Kim, Y.P.; Jin, H.C. Local formation of sulfates contributes to the urban haze with regional transport origin. Environ. Res. Lett. 2020, 15, 084034. [Google Scholar] [CrossRef]
- Seo, J.; Lim, Y.B.; Youn, D.; Kim, J.Y.; Jin, H.C. Synergistic enhancement of urban haze by nitrate uptake into transported hygroscopic particles in the Asian continental outflow. Atmos. Chem. Phys. 2020, 20, 7575–7594. [Google Scholar] [CrossRef]
- Kim, E.; Kim, B.U.; Kim, H.C.; Kim, S. Direct and cross impacts of upwind emission control on downwind PM2.5 under various NH3 conditions in Northeast Asia. Environ. Pollut. 2021, 268, 115794. [Google Scholar] [CrossRef]


Publisher’s Note: MDPI stays neutral with regard to jurisdictional claims in published maps and institutional affiliations. |
© 2022 by the authors. Licensee MDPI, Basel, Switzerland. This article is an open access article distributed under the terms and conditions of the Creative Commons Attribution (CC BY) license (https://creativecommons.org/licenses/by/4.0/).