Technical Note

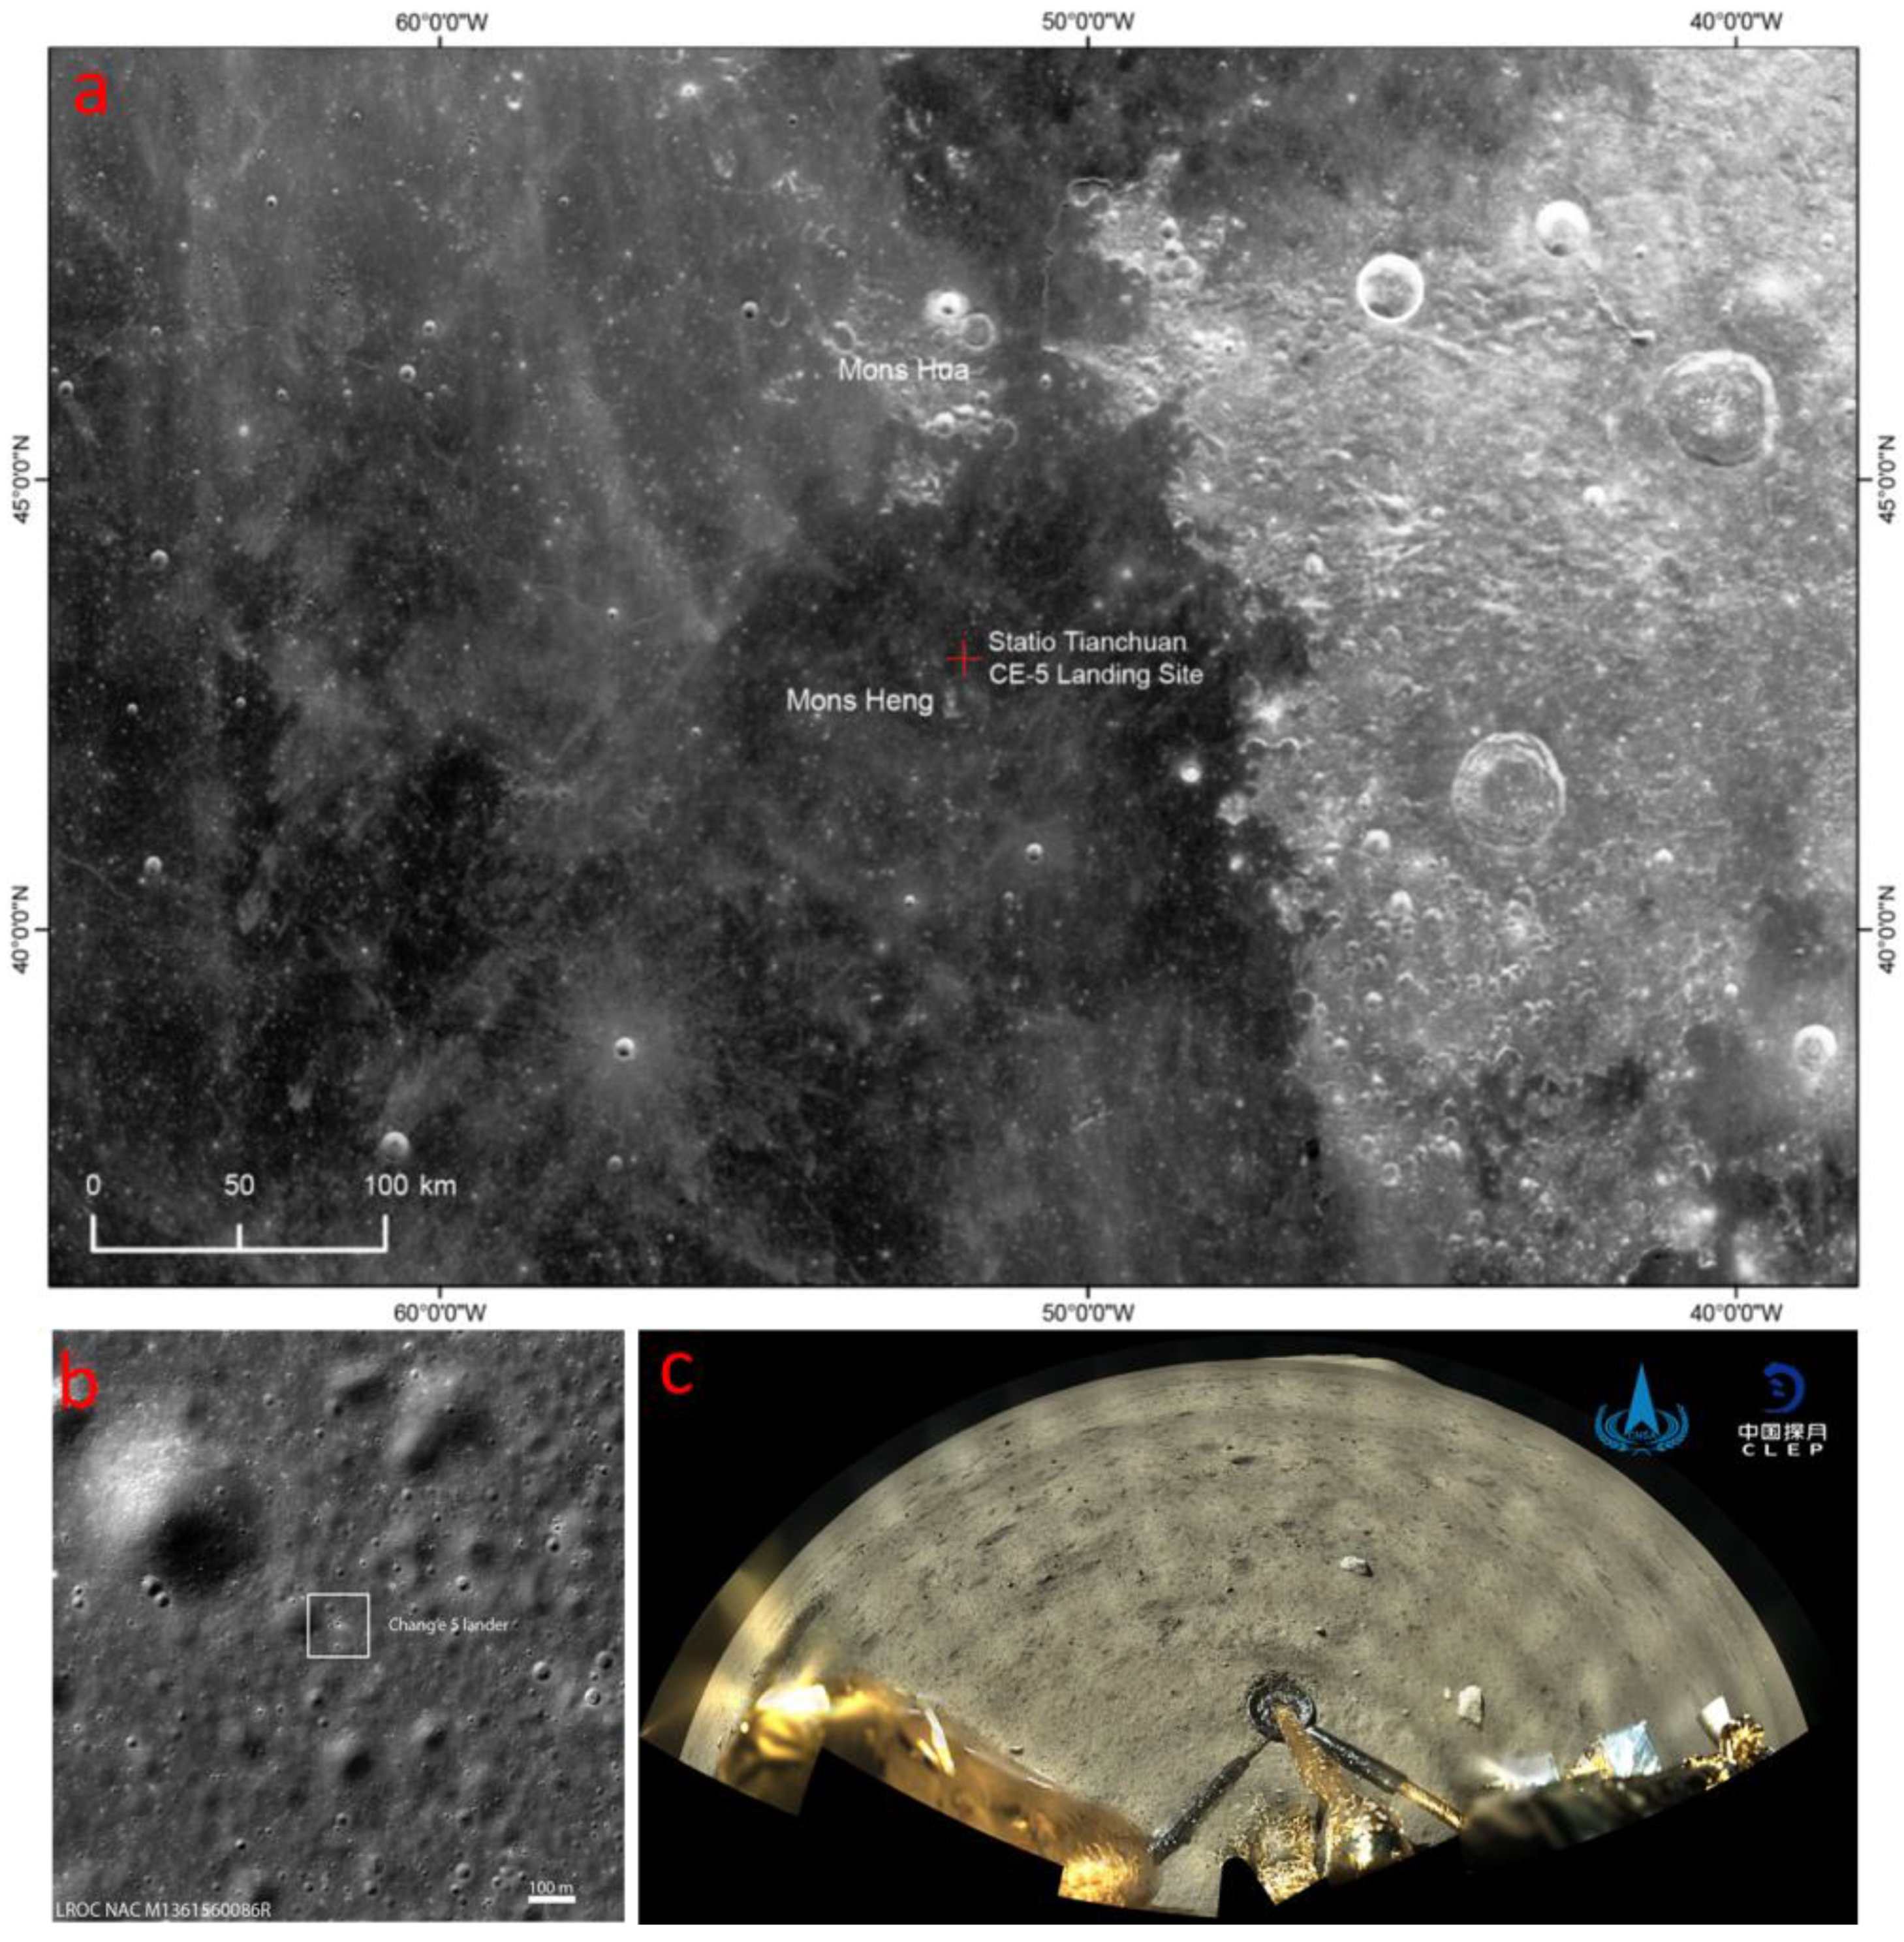
The Lunar Regolith Structure and Electromagnetic Properties of Chang’E-5 Landing Site

1
Key Laboratory of Electromagnetic Radiation and Sensing Technology, Aerospace Information Research Institute, Chinese Academy of Sciences, Beijing 100190, China
2
GBA Research Institute, Aerospace Information Research Institute, Chinese Academy of Sciences, Guangzhou 510503, China
3
Key Laboratory of Lunar and Deep Space Exploration, National Astronomical Observatories, Chinese Academy of Sciences, Beijing 100101, China
*
Author to whom correspondence should be addressed.
Remote Sens. 2022, 14(18), 4539; https://doi.org/10.3390/rs14184539
Submission received: 29 July 2022 / Revised: 8 September 2022 / Accepted: 9 September 2022 / Published: 11 September 2022

Abstract

:
On 1 December 2020, China’s Chang’E-5 (CE-5) probe successfully landed in the northeastern Oceanus Procellarum. This work mainly presents the results of Lunar Regolith Penetrating Radar (LRPR) equipped on the CE-5 Lander. The lunar regolith structure of the landing site from the surface to 3-m depth is unveiled by LRPR, which found that abundant rock fragments are distributed in uniform lunar regolith. The imaging result proved that the drilling and sampling process was prevented by big rocks at about 100 cm depth. On the basis of the response of lunar soil to electromagnetic (EM) wave, the EM properties of the landing site estimate that the relative dielectric constant and the loss tangent are 2.520 ± 0.186 and 0.0133 ± 0.0020, respectively.

1. Introduction

Since the 1960s, humans had probed the moon. A series of probes such as Pioneer, Prowler, Surveyor, and Apollo were launched in the 1960s and 1970s [1]. Since the 1990s, a new round of exploration was started again with missions, such as Clementine [2], Lunar Reconnaissance Orbiter (LRO) [3], Lunar Crater Observation and Sensing Satellite (LCROSS) [4], as well as the probes of China’s Chang’E series [5,6,7]. Among them, Luna16, Luna20, Luna24, Apollo11, Apollo14-17, and Chang’E-5 (CE-5) are sample return missions [8].
CE-5 is a sample return mission in China’s lunar exploration strategy of Orbit-Land-Sample return. On 1 December 2020, CE-5 mission successfully landed in the northeastern Oceanus Procellarum at 43.06°N, 51.92°W [9] (see Figure 1), and returned 1731 g of lunar soil [10,11]. Qian et al. (2021) indicated that the regolith in the site is ~4–7 m thick [12]. Yue et al. (2019) estimated the lunar regolith depth to ranges from 0.74 m to 18.00 m, with a mean of 7.15 m [13]. Sato et al. (2017) considered TiO2 abundance of 5–8 wt. % and FeO abundance of 16.5–17.5 wt. % for local basalt [14]. These studies are based on lunar orbiting satellites or ground-based radars, the relative errors are large, and do not achieve in situ detection for more accurate results.
Compared to other sample return detectors, CE-5 is equipped with Lunar Regolith Penetrating Radar (LRPR) that can conduct a perspective inspection of the exploration area before drilling and sampling, so as to discover the potential hazards in the drilling and sampling process in advance and propose corresponding countermeasures as soon as possible [15,16]. LRPR is the first ground penetrating array radar applied in the field of lunar exploration, and successfully gained the microwave characteristic data of the CE-5 landing site. The sounding results of LRPR can also be used to evaluate the EM characteristics of the landing area [15,17,18,19,20], estimate the content of mineral resources in the lunar regolith, and provide effective information for the development of lunar morphology and lunar geology [21].
This paper depicts the equipment and measurement process of LRPR, analyzes the sounding results in detail, and draws conclusions. It is organized as follows: the second section introduces LRPR equipment and its working process; the third part describes the method of data processing; the fourth section analyzes and discusses the results; the fifth section presents conclusions.

2. LRPR Equipment and Data Acquisition
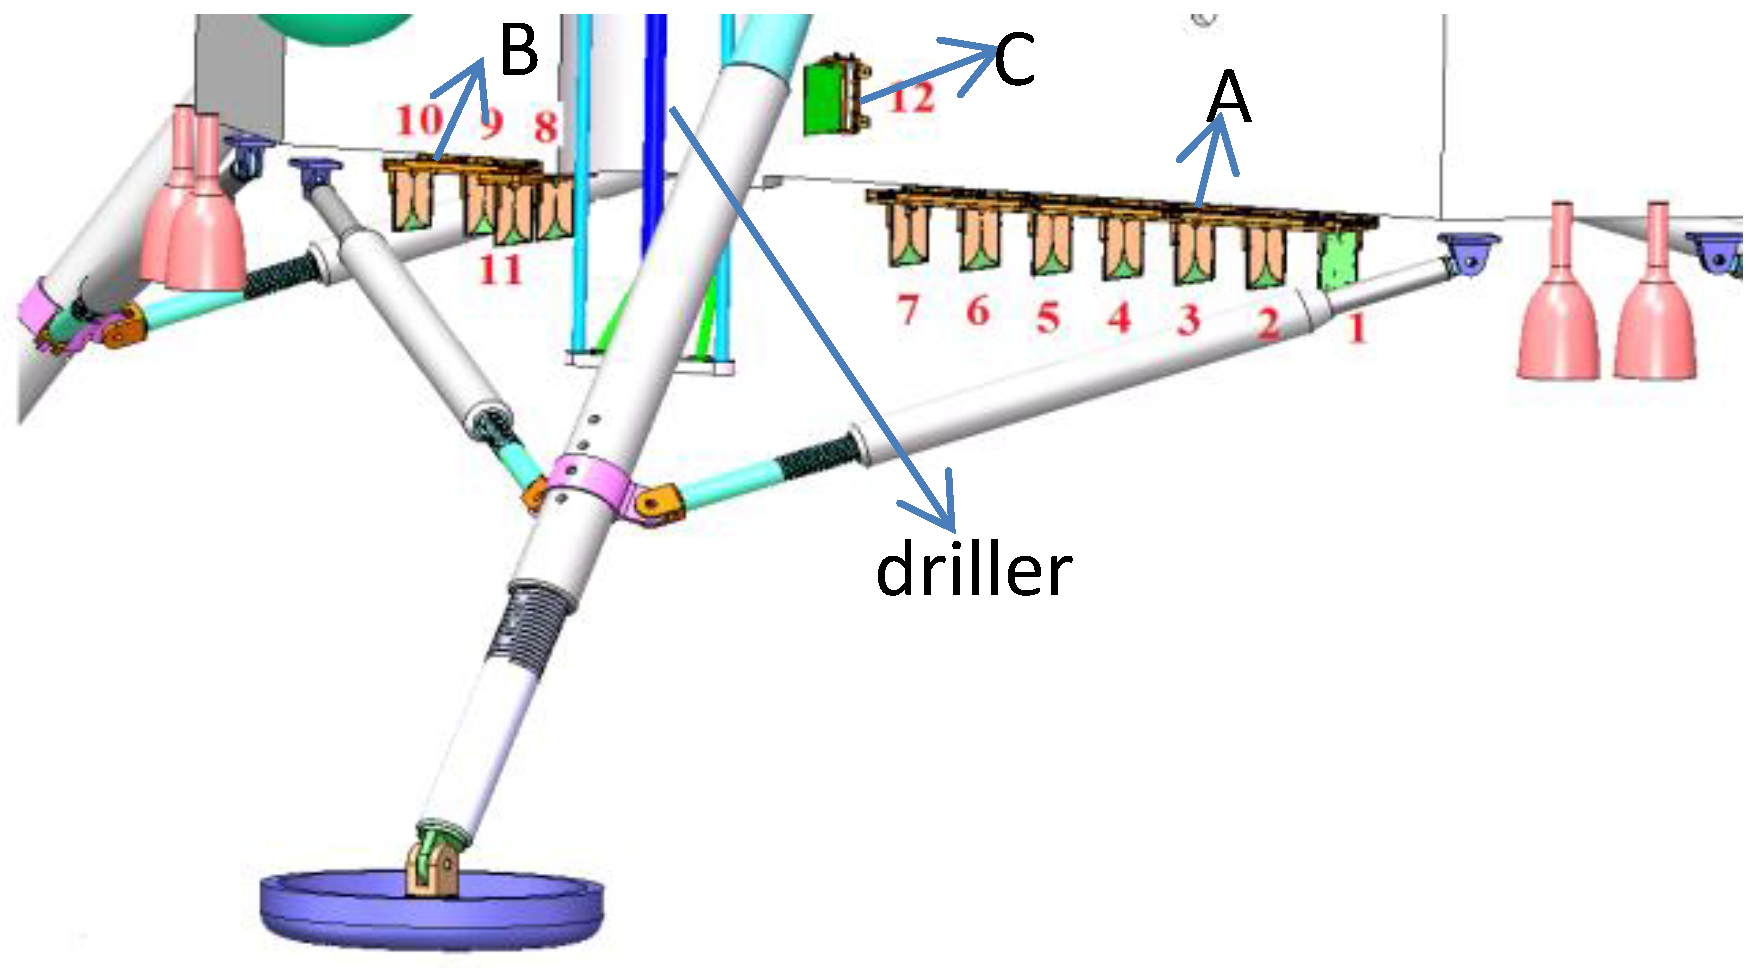
2.1. Equipment

LRPR employs 12 Vivaldi antennas which are divided into 3 groups: A, B, and C. The installation is around the drilling and sampling system, and the layout of the antennas is shown in Figure 2. Because the Lander cannot move, LRPR could only detect in situ, and employs array antennas. When an antenna transmits, the other 11 antennas receive. When all the antennas are used as transmitting antennas, a detection operation is completed. Therefore, there are 12 × 11 = 132 channels in total. LRPR is carrier-free and air-coupled ground-penetrating radar about 90 cm off the ground and the bandwidth is 1–3 GHz [22,23]. The working parameters are shown in Table 1.

2.2. Work Process

As can be shown in Figure 2, the signal emitted by the antenna would be coupled/reflected many times between the antennas and the Lander; these clutters would seriously interfere with the echo of the underground target, and affect the final detection effect. To eliminate the influences of the clutters, LRPR collected the background signals without the reflection from the underground targets when the CE-5 Lander flew around lunar orbit. After successfully landing, LRPR conducted a probe, and then performed rapid imaging in real time before drilling and sampling. The result was used to guide the drilling and sampling process. The drilling and sampling process is shown in Figure 3. The outer diameter of the drill pipe was 3.3 cm and the inner diameter was 1.5 cm. After the drilling and sampling was completed, the sample was encapsulated and sent to the Ascender, and the drill pipe remained in the lunar soil. Three post-drill probes were subsequently carried out by LRPR. Due to the existence of drill pipe, the EM properties estimation and migration imaging result would be interfered. Therefore, in this paper, only the pre-drill detection is processed, analyzed, and discussed.

3. Processing Methods

The processing methods mainly include the following five steps: (1) preprocessing the raw data; (2) calculating the height of the antenna off the ground; (3) obtaining the EM wave velocity of the detection area; (4) carrying out migration imaging to obtain the fine structure of lunar regolith of the drilling and sampling area; (5) estimating the EM properties and material composition by analyzing the imaging results and preprocessed signals.

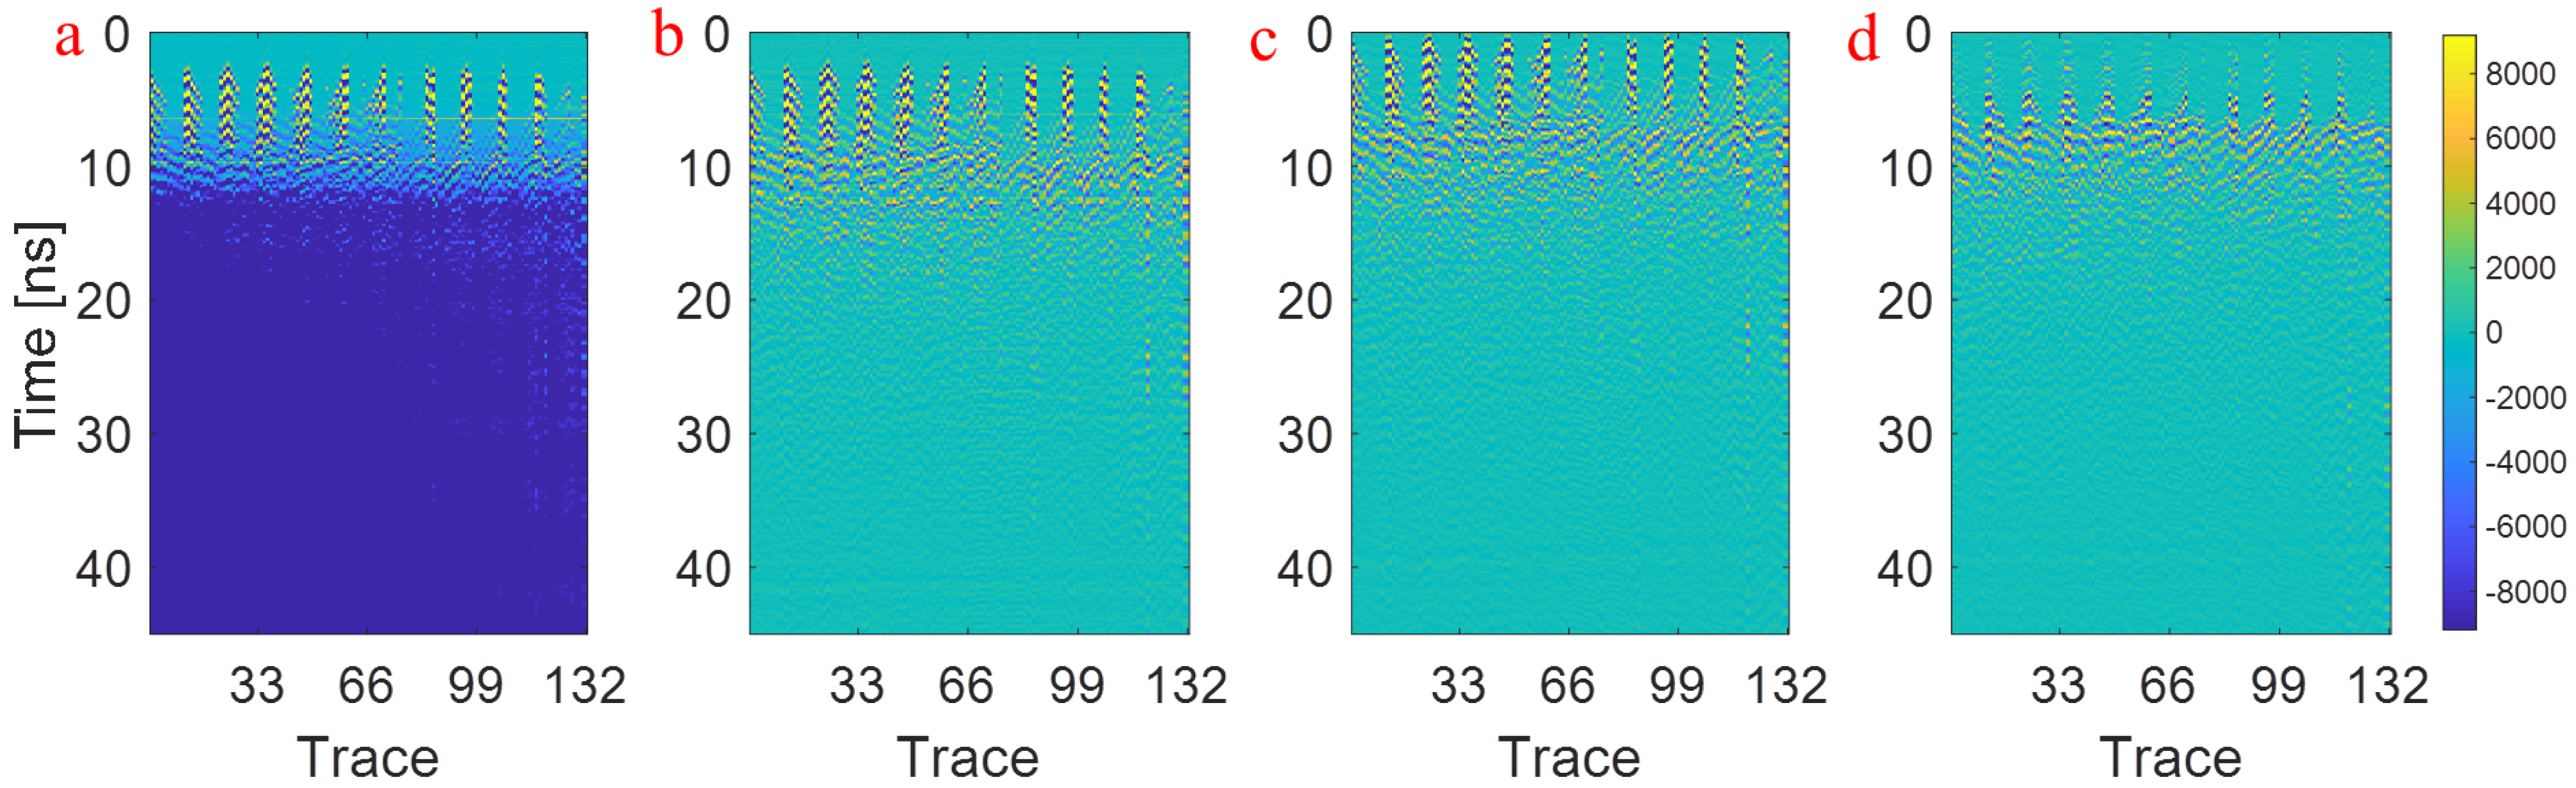
3.1. Data Preprocessing

Preprocessing involves removing the DC component, correcting the time delay of each channel, and removing the background clutter interference.
(a)
Remove DC
In order to remove the DC component and retain the in-band frequency component as much as possible, the band-pass filtering is adopted (see Equation (1)). The result is shown in Figure 4b.
H ( f ) = { 0 , f < f 1 0.5 0.5 * cos ( f f 1 f 2 f 1 ) * π , f 1 f f 2 1 , f 2 < f 3 0.5 + 0.5 * cos ( f 4 f f 4 f 3 ) * π , f 1 f f 2 0 , f > f 4
where f 1 = 100 MH z , f 2 = 300 MH z , f 3 = 4 GH z , f 4 = 5 GH z ;
(b)
Correct channel delay
LRPR employs only one transmitter and one receiver, and different channels can be switched by the switch matrix, which results in different delay of different channels [23]. Adopting channel delay correction, the delay difference could be eliminated, and the zero position of the signal can be corrected to the phase center of the transmitting antenna. The result of delay correction is shown in Figure 4c.
(c)
Remove background clutter
The signal emitted by the antenna will be coupled/reflected many times between the antennas and the Lander, and these clutters will seriously interfere with the echo signal of the underground target, affecting the final detection effect. The background signals collected in the lunar orbit were used to remove interference clutter from the detection signals, and the specific processing method can be found in [24]. The process of removing interference clutter is shown in Figure 4d.

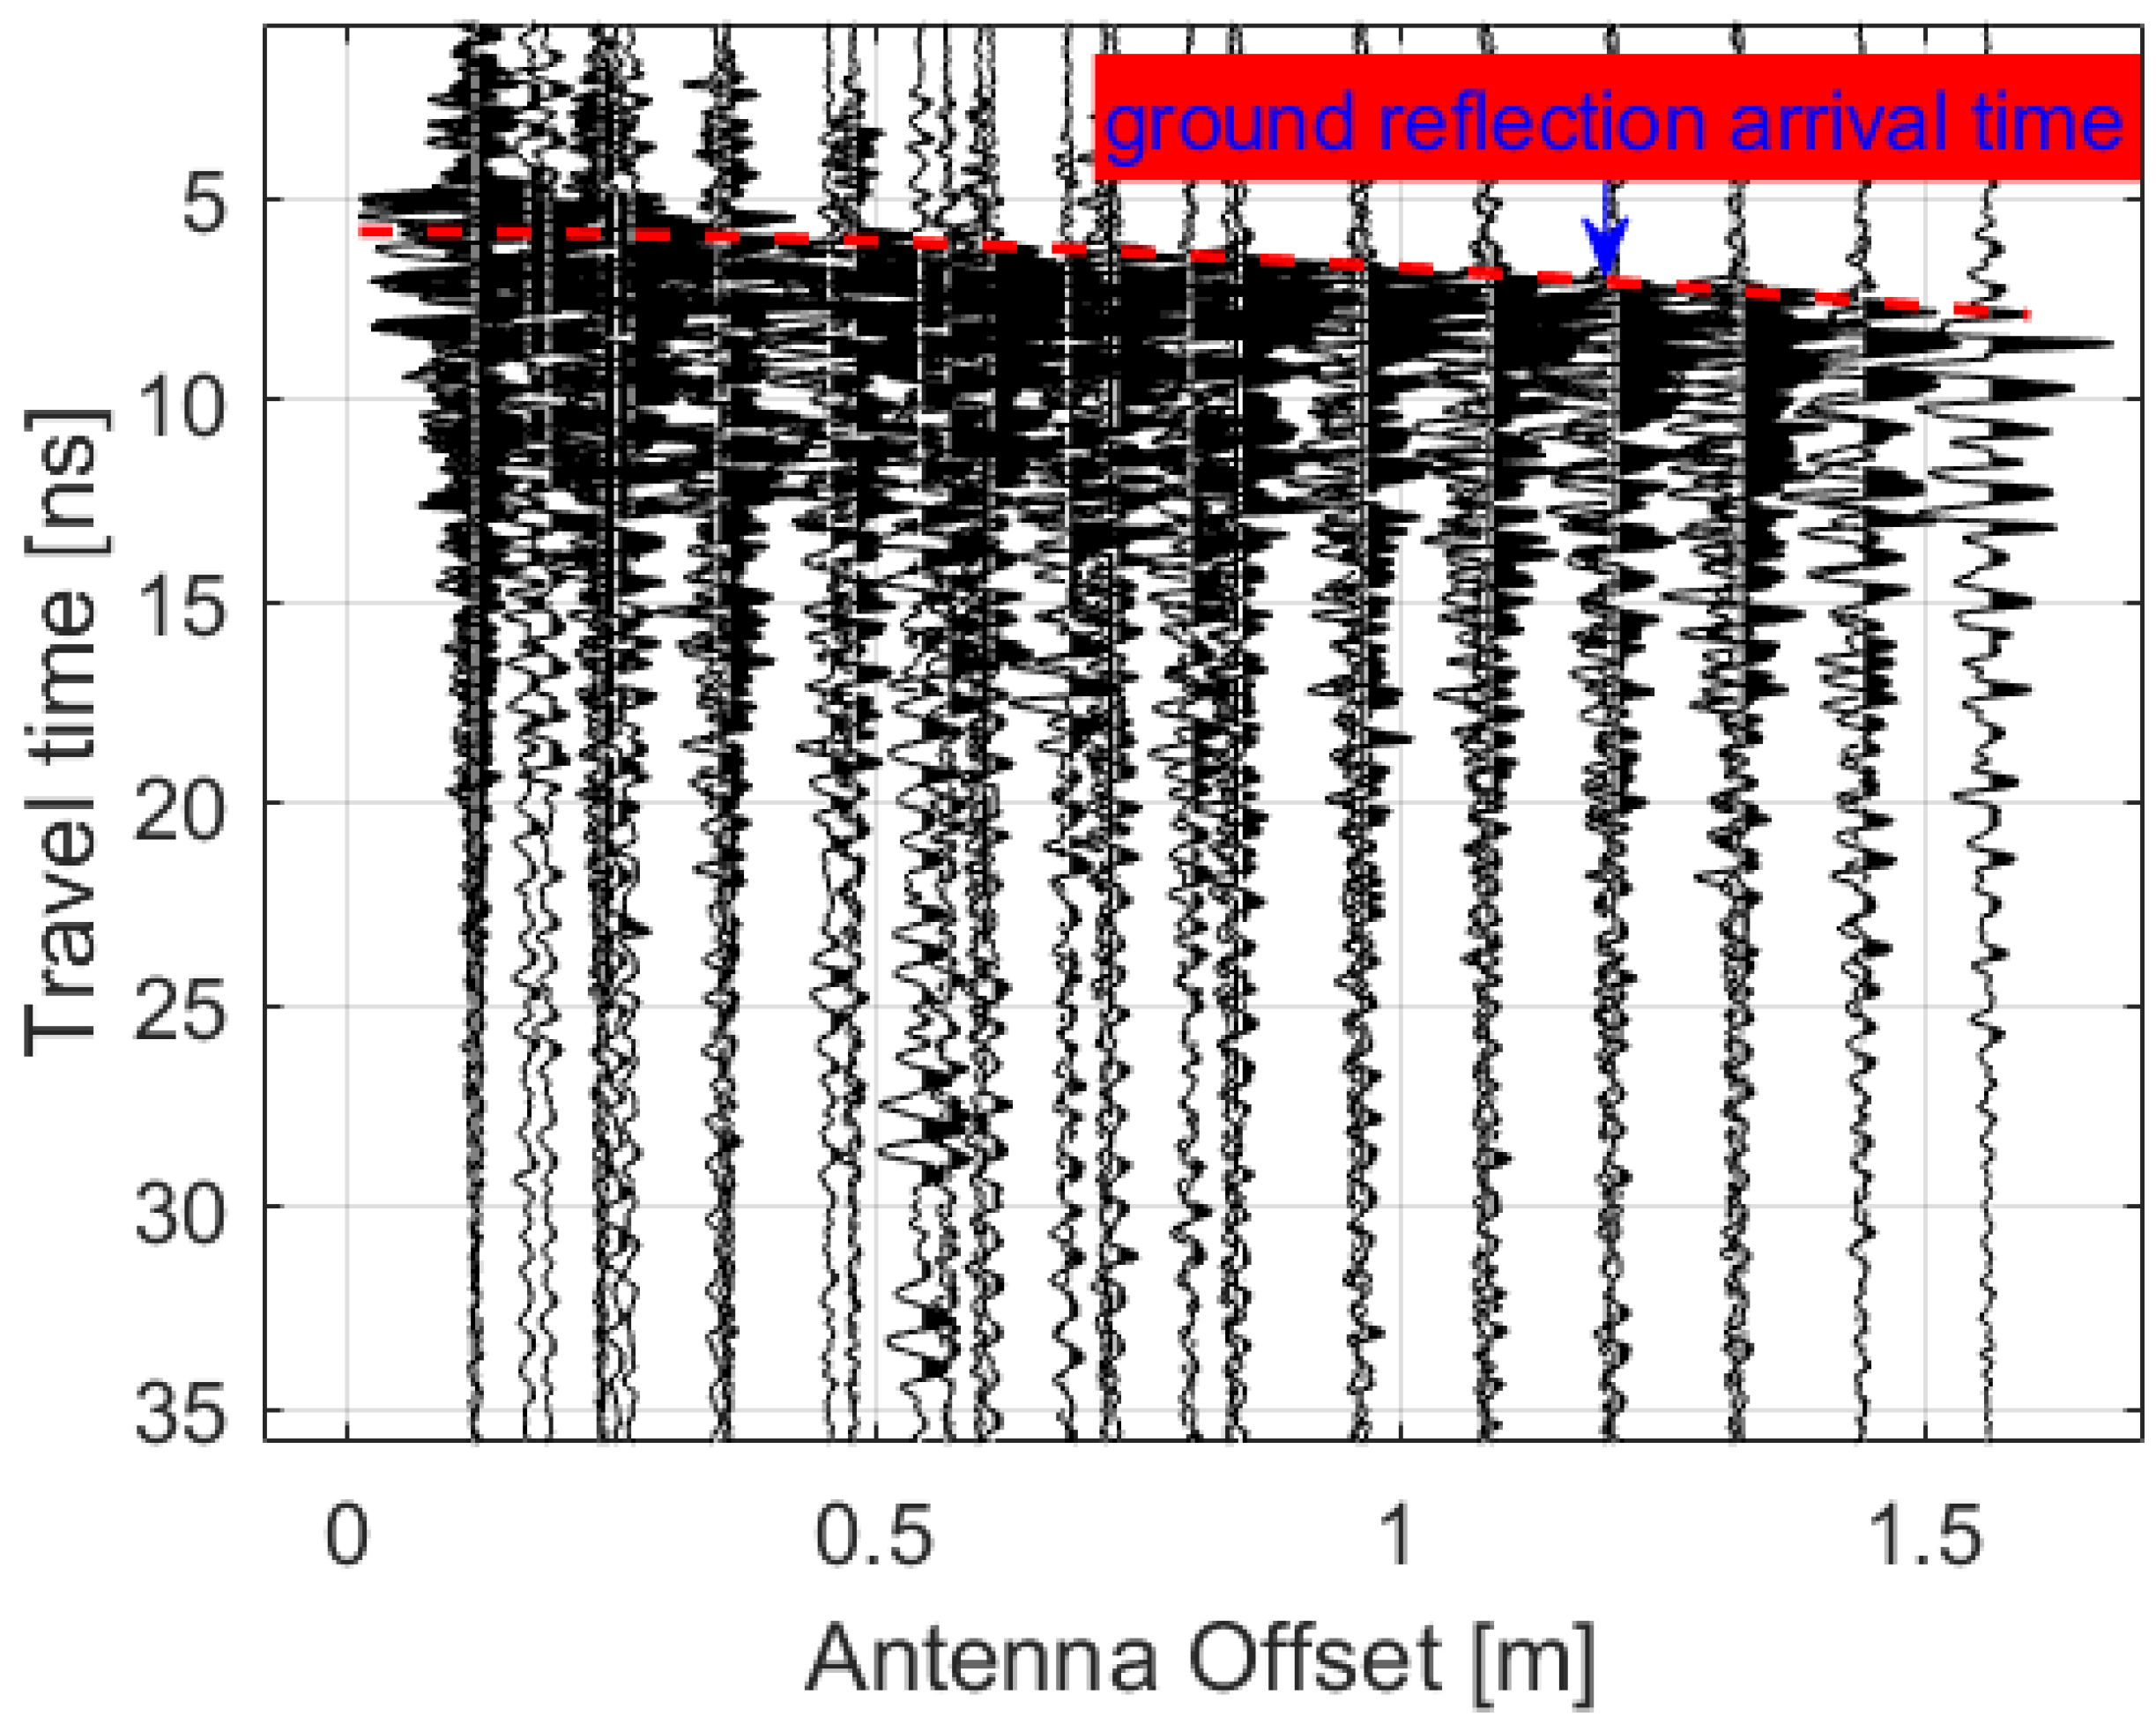
3.2. Height Calculation

Because LRPR is air-coupled ground-penetrating radar, the height of the antenna must be considered in order to accurately image the detection area. The landing gear system of the Lander is an elastic structure. After landing, under the influence of lunar gravity, the height from the ground to the antennas will also change, so the height of the antenna needs to be re-estimated. The following formula is adopted.
4 h 2 + x 2 c = t
where h is the height, x is offset, and c is the velocity of EM in vacuum. According to the Equation (2) and the multi-offset dataset that has been preprocessed, the height could be identified as 0.877 m, which is shown in Figure 5.

3.3. EM Properties Estimation

The EM properties of material are given by the complex permittivity. The propagation velocity of EM wave in lunar soil can be obtained by using the real part of the permittivity, the relative dielectric constant. Meanwhile, the bulk density and the composition of the lunar regolith can be estimated according to the relative dielectric constant that could be obtained by the reflection coefficient method [15,25,26]. The specific formula is as follows:
ε r = ( A m + A A m A ) 2
where A m is the amplitude of incident wave, which is measured by LRPR prototype installed on the Lander prototype and a metal plate large enough according to the same scene on the lunar surface probe. This method is widely applied in for lunar surface relative dielectric constant derivation [15,26]. A is the lunar surface reflection echo.
According to the relative dielectric constant that has been obtained, the bulk density of the lunar soil can be estimated by Equation (4) [8].
ε r = 1.919 ρ
where ρ is the bulk density of the lunar regolith in g/cm3.
The imaginary part of the permittivity characterizes the loss of EM wave in the medium, and the time domain attenuation method is exploited to evaluate the attenuation characteristics of the medium [18,27]. According to the radar Equation (5):
P R P T = G t G r σ t λ 2 e 4 α r 64 π 3 r 4
where G t and G r is the directional gain of the antennas in the direction of transmitting and receiving, σ t is the scattering cross section of the target, r is the distance between antenna and target, λ is the wavelength of radar wavelet in free space, P T is the transmitted power, P R is the received power, and α is the attenuation coefficient of the medium.
According to Equation (5), the energy loss from transmitting antenna to the receiving antenna mainly contains three parts: the geometric diffusion of EM wave, the attenuation of medium, and the scattering of target. The attenuation of medium can be obtained, when the geometric diffusion of EM wave and the scattering of target are removed from the total energy loss. The geometrical diffusion of EM wave is easy to obtain, but the scattering of target body is relatively difficult. The radar cross section (RCS) of the target is divided into smooth plane, rough plane, and discrete spherical target [18,27,28].
(a)
RCS for smooth surface, P R P T 1 r 2 ;
(b)
RCS for the rough surface, P R P T 1 r 3 ;
(c)
RCS for discrete spherical objects, P R P T 1 r 4 .
We take the square root of all the adjacent antennas signals of LRPR as the mean energy signal, and remove the energy loss caused by geometric diffusion. Then, the attenuation coefficient of the media can be evaluated by fitting the energy attenuation of the radar time–depth function by using the above three modes. Utilizing Equation (6), the loss tangent of medium can be estimated [18,27].
tan δ = α 9.1 × 10 8 ε r f
where ε r is the relative dielectric constant of the medium, and f is the central frequency of the EM wave in the medium.
In addition, the content of FeO + TiO2 in the detection site could be estimated by Equation (7), the loss tangent and lunar soil density [8].
tan δ = 10 0.038 ( F e O + T i O 2 ) % + 0.312 ρ 3.26

3.4. Migration Imaging

The multi-offset pre-stack diffraction depth imaging method is employed for LRPR. Compared with ordinary time migration, the pre-stack depth migration is more accurate for the position of the reflected target and stratification [15,24,29]. The equation is as follows:
o ( x , z ) = j = 1 132 b ( j , t s j + t r j )
where o ( x , z ) is the result of the migration image, ( x , z ) is the area for imaging b ( j , t s j + t r j ) is the dataset of LRPR, t s j is the travelling time of channel j from transmitting antenna to ( x , z ) , t r j is the travelling time of channel j from ( x , z ) to receiving antenna, and 132 is the number of traces.
According to Figure 6:
t s = R a , s c + R g , s v g
t r = R a , r c + R g , r v g
where c and vg are the EM wave speed in vacuum and the lunar regolith.

4. Results and Discussion

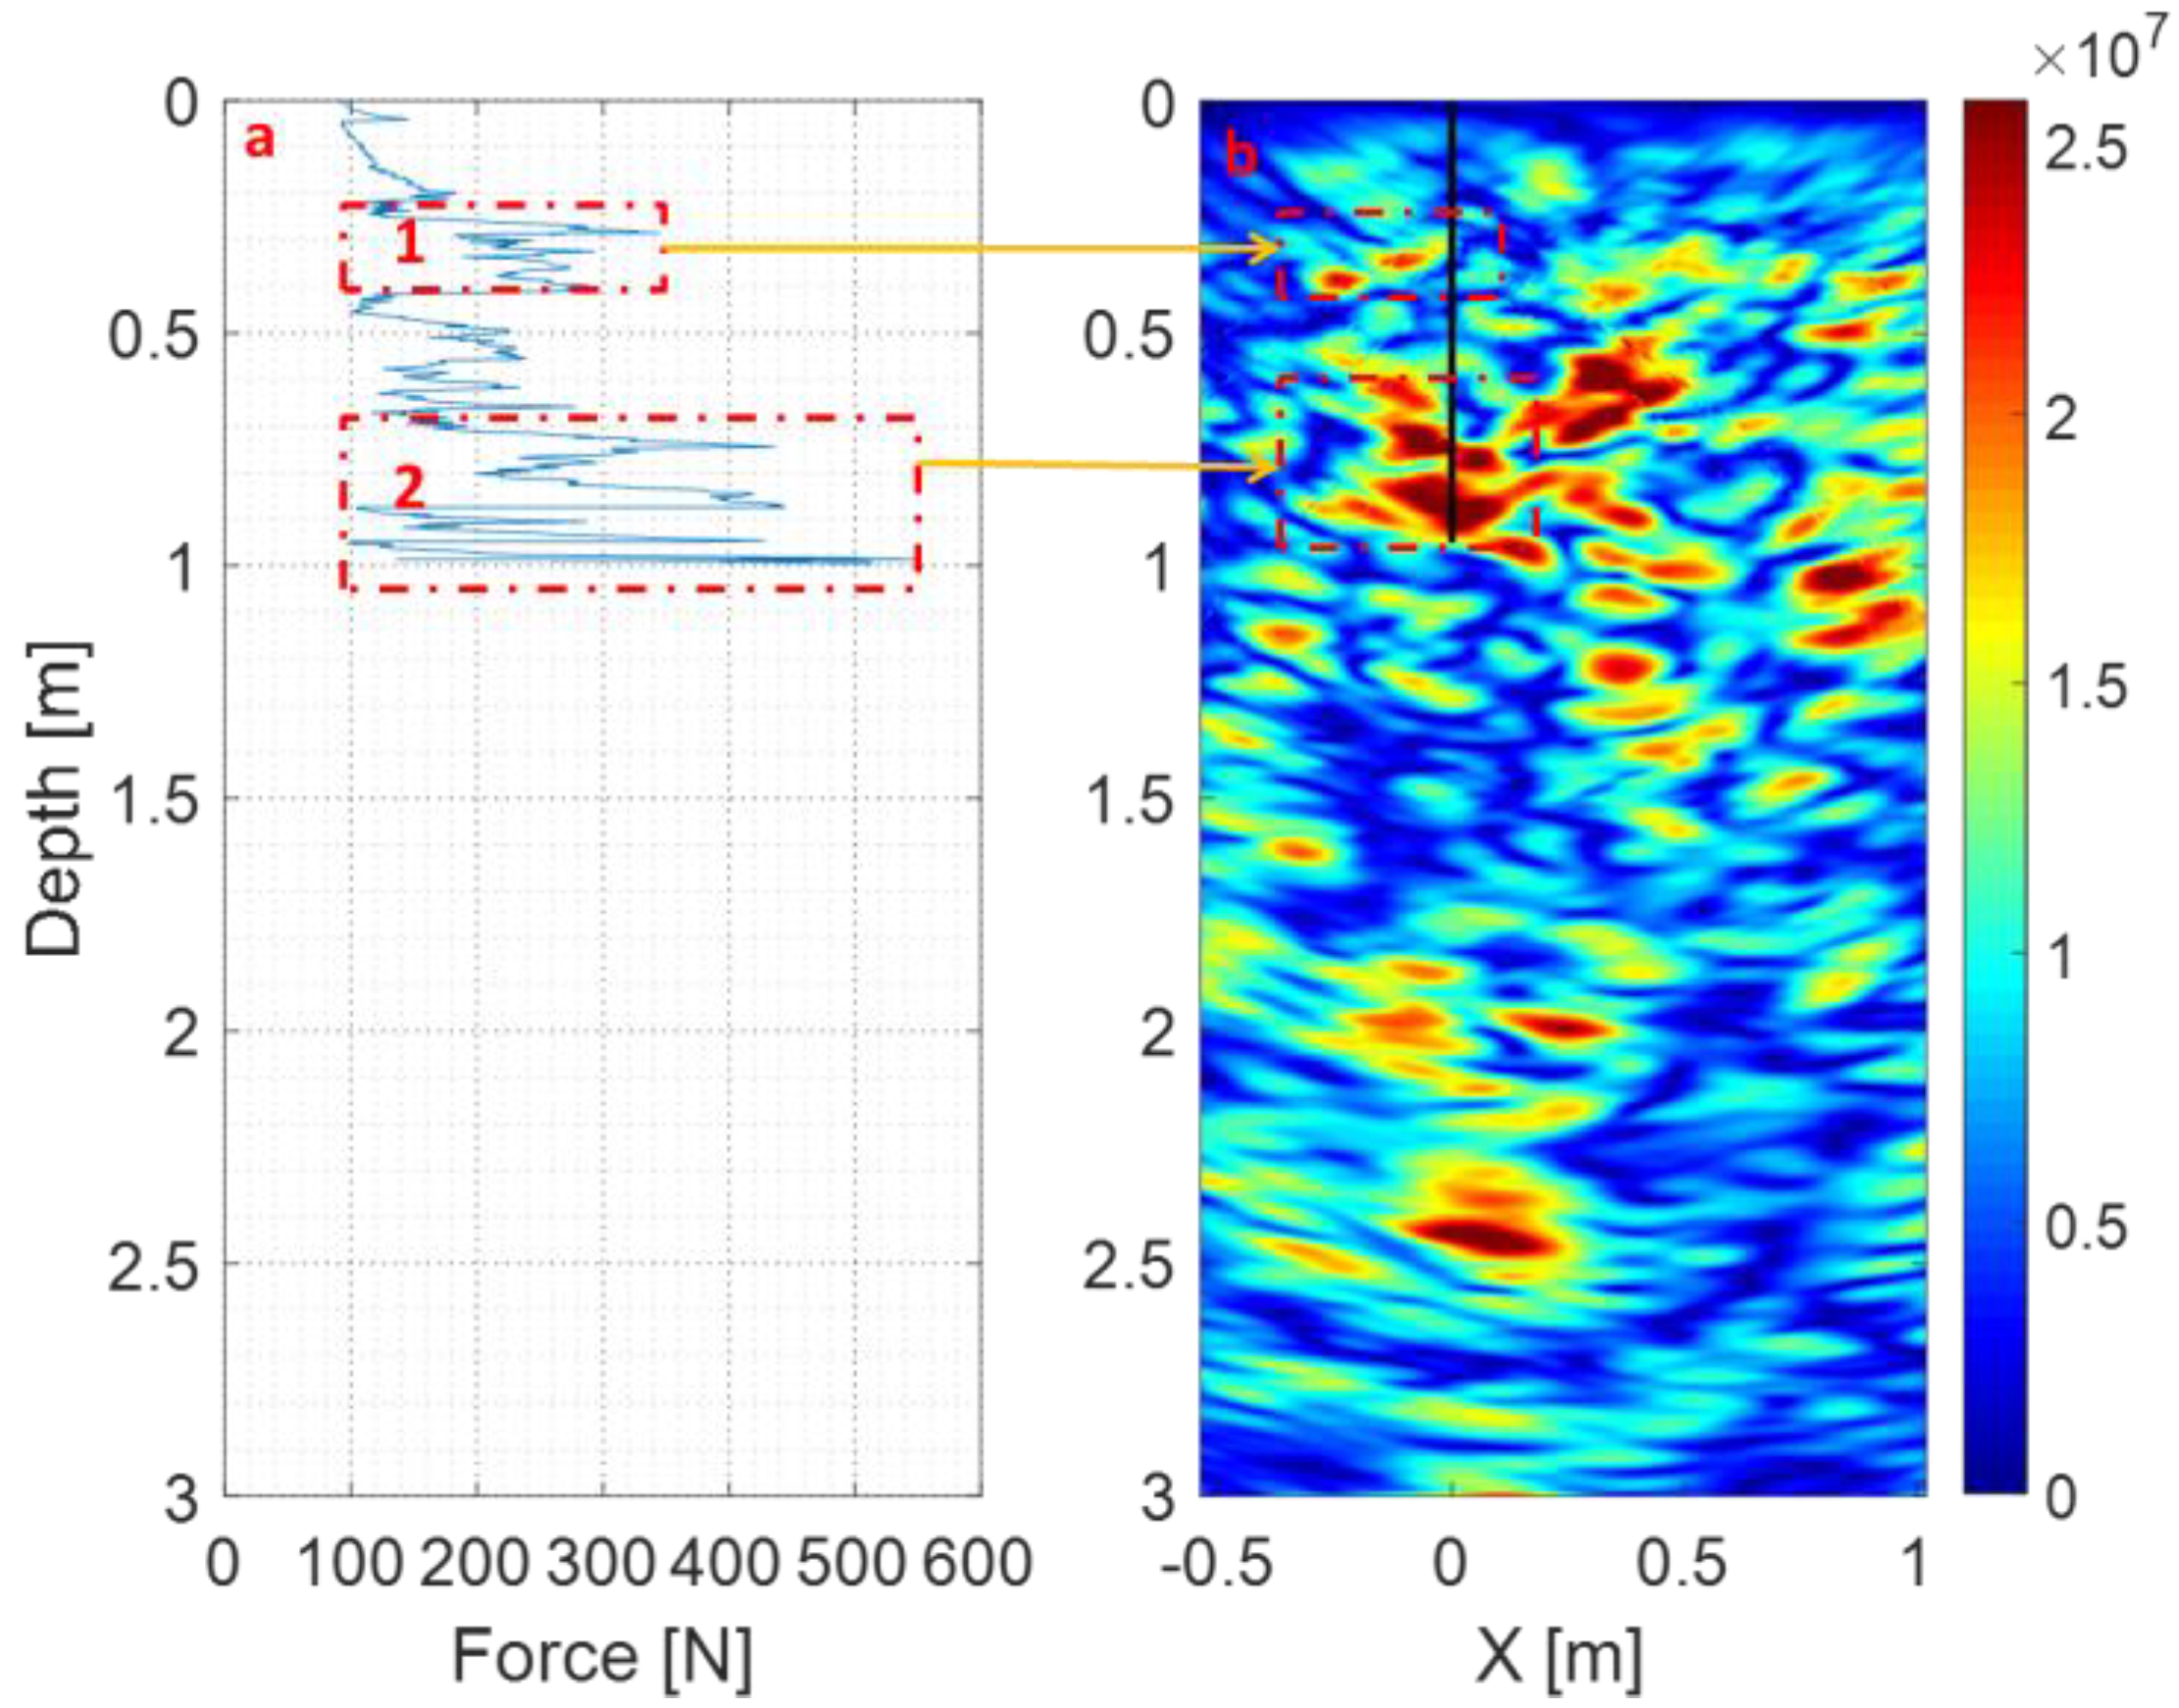
4.1. The Imaging Results and Shallow Lunar Regolith Structure

After LRPR completed the detection of the drilling and sampling area, the real-time rapid imaging was carried out. The imaging effect could intuitively map the stratigraphic structure, identify potential hazards in the process of drilling and sampling, and guide the process of drilling and sampling [30].
When the imaging had been completed, the drilling and sampling mechanism began to sample, and monitored the bit pressure of the drill pipe in the real time. The bit pressure could indirectly reflect the stratigraphic structure. The results of the image and the bit pressure could be mutually verified. Figure 7a shows the variable curve of the bit pressure with depth, and Figure 7b is the imaging result of LRPR.
As can be seen in Figure 7b, the shallow layer of about 0.30 m is uniform lunar soil, and the bit pressure of the drill pipe should be relatively small. At 0.30 m, there is a thin layer of lunar rock, and the thickness is about 0.10 m. Under this lunar rock, it is loose lunar soil, and the bit pressure should be small. Between about 0.70 m and 1 m, it is hard texture lunar rock region, where is layering phenomenon. In this region the bit pressure should be fluctuant, which poses a greater risk to the sampling work.
As can be shown in Figure 7a, the bit pressure from the lunar surface to 0.28 m depth was very small, and it should be a uniform, less dense, and loose lunar soil. The bit pressure between 0.28 m and 0.40 m suddenly sharply increased, up to 345 N, indicating that a dense lunar rock with a thickness of about 0.12 m was encountered. Between 0.40m and 0.75 m, the bit pressure became smaller, so it should be lower density and loose texture of the lunar regolith. At 0.75 m, the bit pressure sharply increased again, indicating that it encountered hard rock fragment. After 0.75 m, the drilling force decreased again. At 85 cm, the drilling force became larger again, intermittently until about 1 m, indicating that there was a larger rock zone, and multiple stratification phenomena. See the dotted box 2 in Figure 7a [31].
Comparing Figure 7a,b, it can be found that the bit pressure monitoring curve of the drill pipe is completely consistent with the detection results of LRPR. According to the results of the comparison, it can be judged that before drilling and sampling, microwave imaging for the underground structure of the drilling site in advance is such a necessary method to predict the hazards that may be encountered in the drilling process. Meanwhile, the imaging results also show that the subsurface of the landing site contains a large number of rocks, and the thickness of the lunar regolith is beyond 3 m. Limited by the time window, LRPR could not detect deeper subsurface structure.

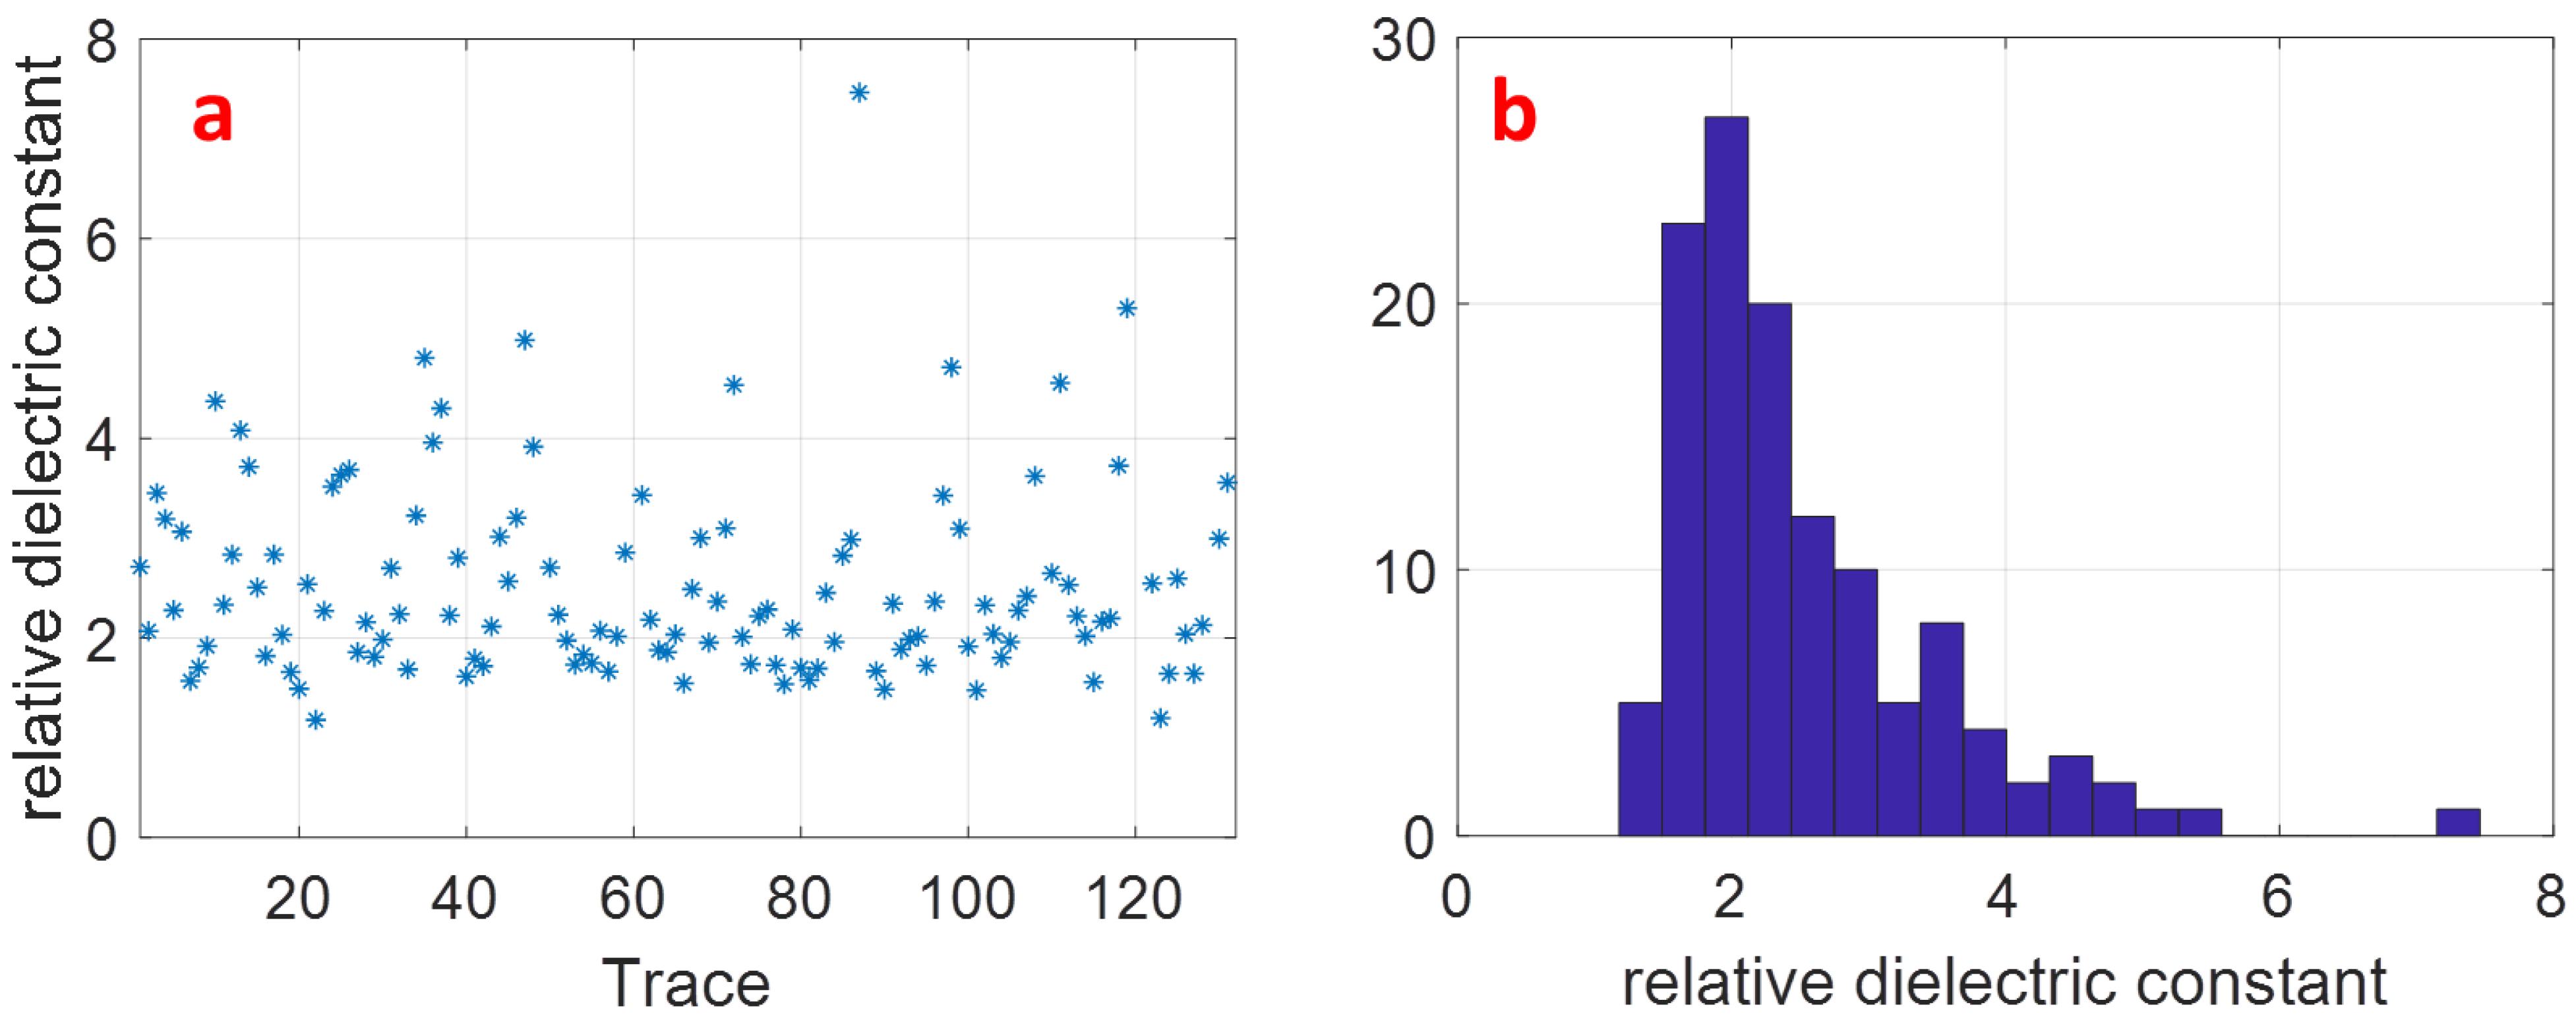
4.2. The Relative Dielectric Constant

The relative dielectric constant of CE-5 landing site was obtained by using the reflection coefficient method [19,24], as shown in Figure 8. There were 132 channels in total, and 132 values were exploited to estimate the relative dielectric constant. The distribution of lunar rocks had a large influence on estimating the relative dielectric constant; some of the larger differences should be due to the rocks. The imaging result revealed that the subsurface of the site contained a lot of rocks. When estimating the dielectric constant, the influence of rocks could not be ignored, and the average value was more indicative of the impact of the rocks, so we drilled the average value of 2.520 and a standard deviation of 0.186 as the dielectric constant of this region [24]. Meanwhile, the imaging result was consistent with the monitoring curve of the drill pipe, and the average value of 2.520 was reasonable.
The flatness of the surface and the distribution of lunar rocks have influence on estimating the relative dielectric constant by using the reflection coefficient method. The more rocks there are, the greater the relative dielectric constant. Comparing with the topography and geomorphology of CE-3, CE-4, and CE-5 landing sites, the distribution of surface lunar rocks and the relative relationship of dielectric constants of the three sites could be roughly judged [19].
Based on Figure 1c and Figure 9, it can be seen that the surface of the CE-4 landing site is flattest, with few rocks and widespread lunar regolith. The surface of the CE-3 landing site is the most rugged, with a large number of rocks. The surface smoothness of the CE-5 landing zone is moderate, and the lunar rock distribution is moderate. Therefore, the relative dielectric constant of the CE-5 landing region should be the middle one in the three sites. According to the known literature, the relative dielectric constant of the surface lunar regolith of the CE-3 landing site is about 2.89 [17,25,32], and that of the CE-4 landing area is 2.35 ± 0.20 [19,33]. In this paper, the relative dielectric constant of the CE-5 landing region is estimated to be 2.520 ± 0.224, which is consistent with the inference.
According to the estimated dielectric constant and Equation (4), the surface lunar regolith bulk density of the CE-5 landing area is about 1.418 ± 0.186 g/cm3, which is accordant with that of Luna and Apollo lunar samples [8,34,35].

4.3. Attenuation Characteristics of Lunar Regolith

The attenuation characteristics of the lunar regolith mainly depend on the proportion of FeO+TiO2 content in the lunar regolith, while the bulk density of lunar regolith has little effect on it [8]. The attenuation coefficient of the lunar regolith is estimated by using the time domain attenuation method introduced above for the sounding signal of two adjacent antennas [18,27]. In addition, on the basis of Equation (6), the loss tangent is a function of the frequency, so the frequency analysis is performed on the selected signals, as shown in Figure 10. The center frequency 873.6 MHz is chosen as the frequency to derive the loss tangent. The estimation results are shown in Figure 11.
On the basis of the imaging result in Figure 7b, the RCS of the subsurface medium should be the rough surface. Therefore, the R 3 fitting result is adopted as the medium attenuation in the CE-5 landing site, and the loss tangent is about 0.0133 ± 0.0020 at 873.6 MHz. Using the loss tangent and the bulk density of lunar soil [8], it can be deduced that the content of FeO + TiO2 in lunar soil is 24.76 ± 1.85 wt. %, which is consistent with the returned sample results measured in the laboratory (loss tangent = 0.014 ± 0.002, FeO+TiO2 content = 24.70 ± 3.9 wt. %) [10,21].
Compared with the lunar regolith attenuation characteristics of CE-3, CE-4, and CE-5 landing sites, the loss tangent of CE-5 is similar to CE-3 (0.014 ± 0.002) [32], and greater than that of the CE-4 landing site [6,19].

5. Conclusions

LRPR is a payload of CE-5 mission, and is a multi-offset array radar consisting of 12 Vivaldi antennas. It can only probe in situ to provide information support to drilling and sampling mechanism, and obtain the lunar regolith structure of the landing site. This paper introduces, in detail, the results of the scientific detection of LRPR, and the following conclusions can be drawn:
  • For the first time, the hyperfine structure of shallow lunar regolith is obtained with a depth of 3 m, and the lunar regolith thickness of the CE-5 landing site is beyond 3 m.
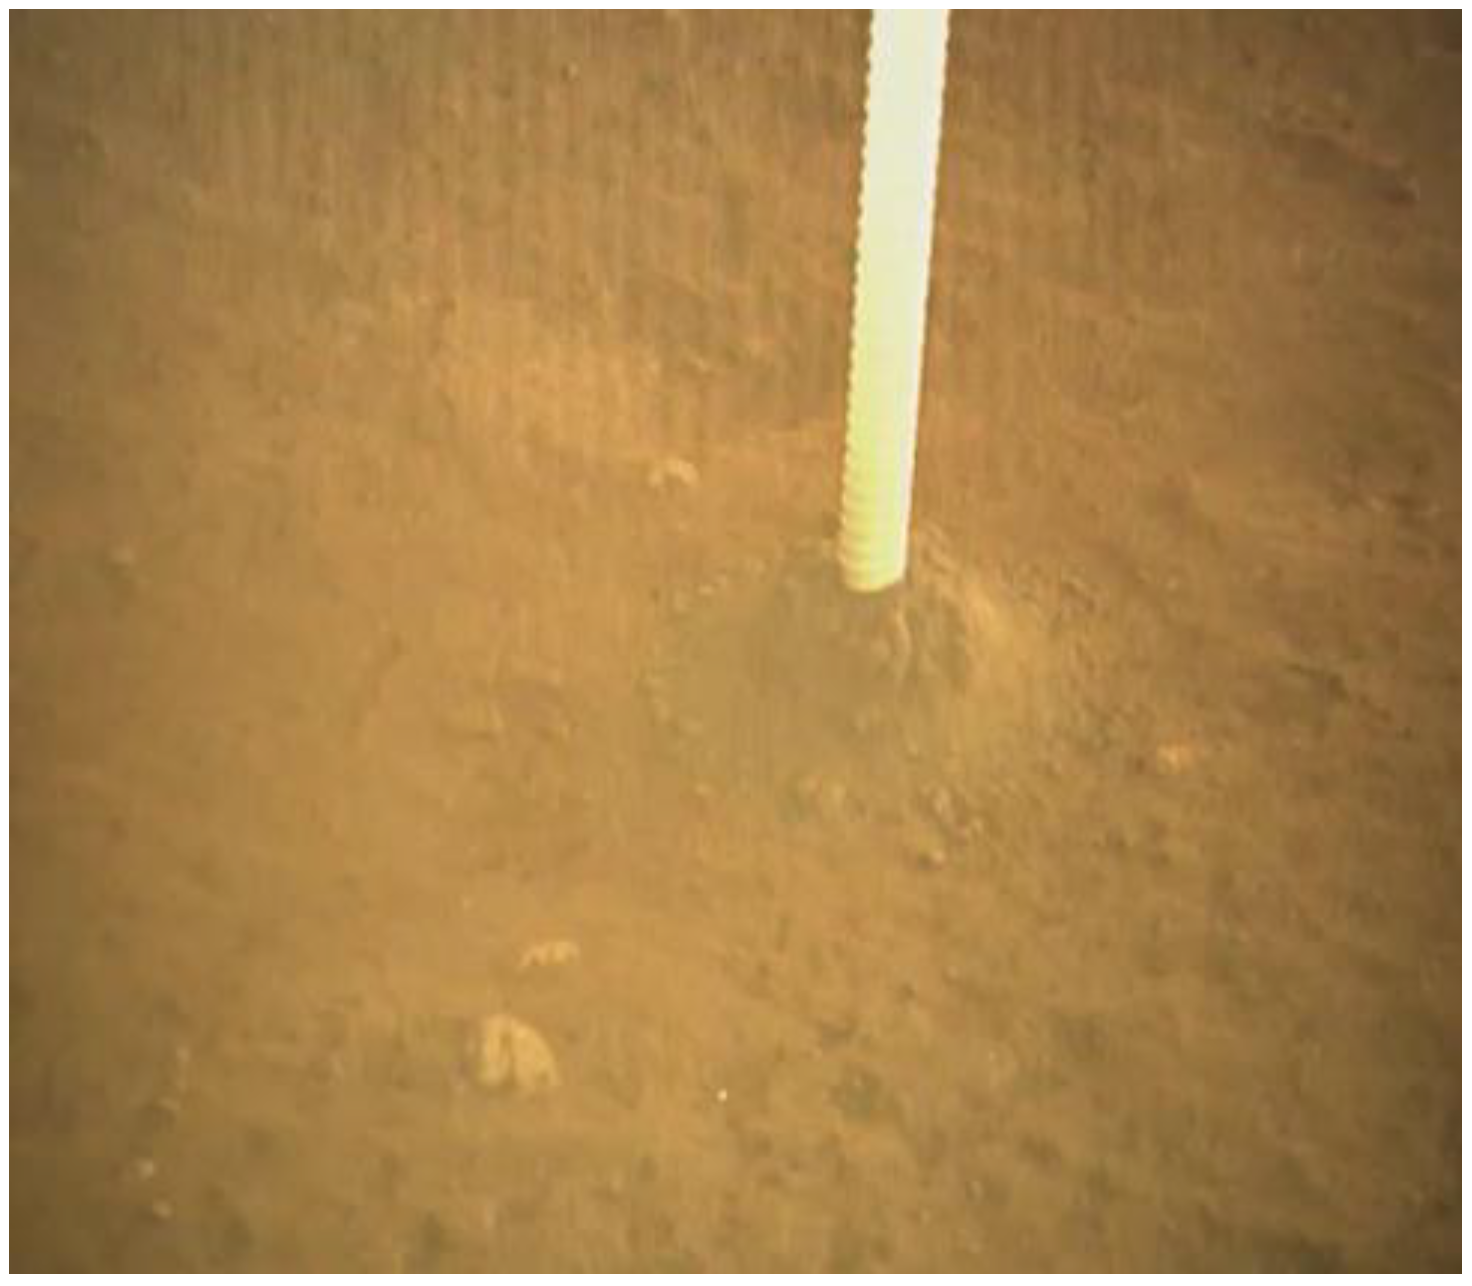
  • Ground penetrating radar should be used to detect the drill sampling area in advance, which can effectively prevent the potential hazards in the process of drilling and sampling.
  • The relative dielectric constant of the surface lunar regolith of the CE-5 landing area is 2.520 ± 0.186, which is slightly higher than the CE-4 landing site of 2.35 ± 0.20 and slightly lower than the CE-3 landing site of 2.89, consistent with the size and distribution of exposed lunar rocks in the landing site. The bulk density of the surface lunar regolith of the CE-5 landing site is about 1.418 ± 0.186 g/cm3.
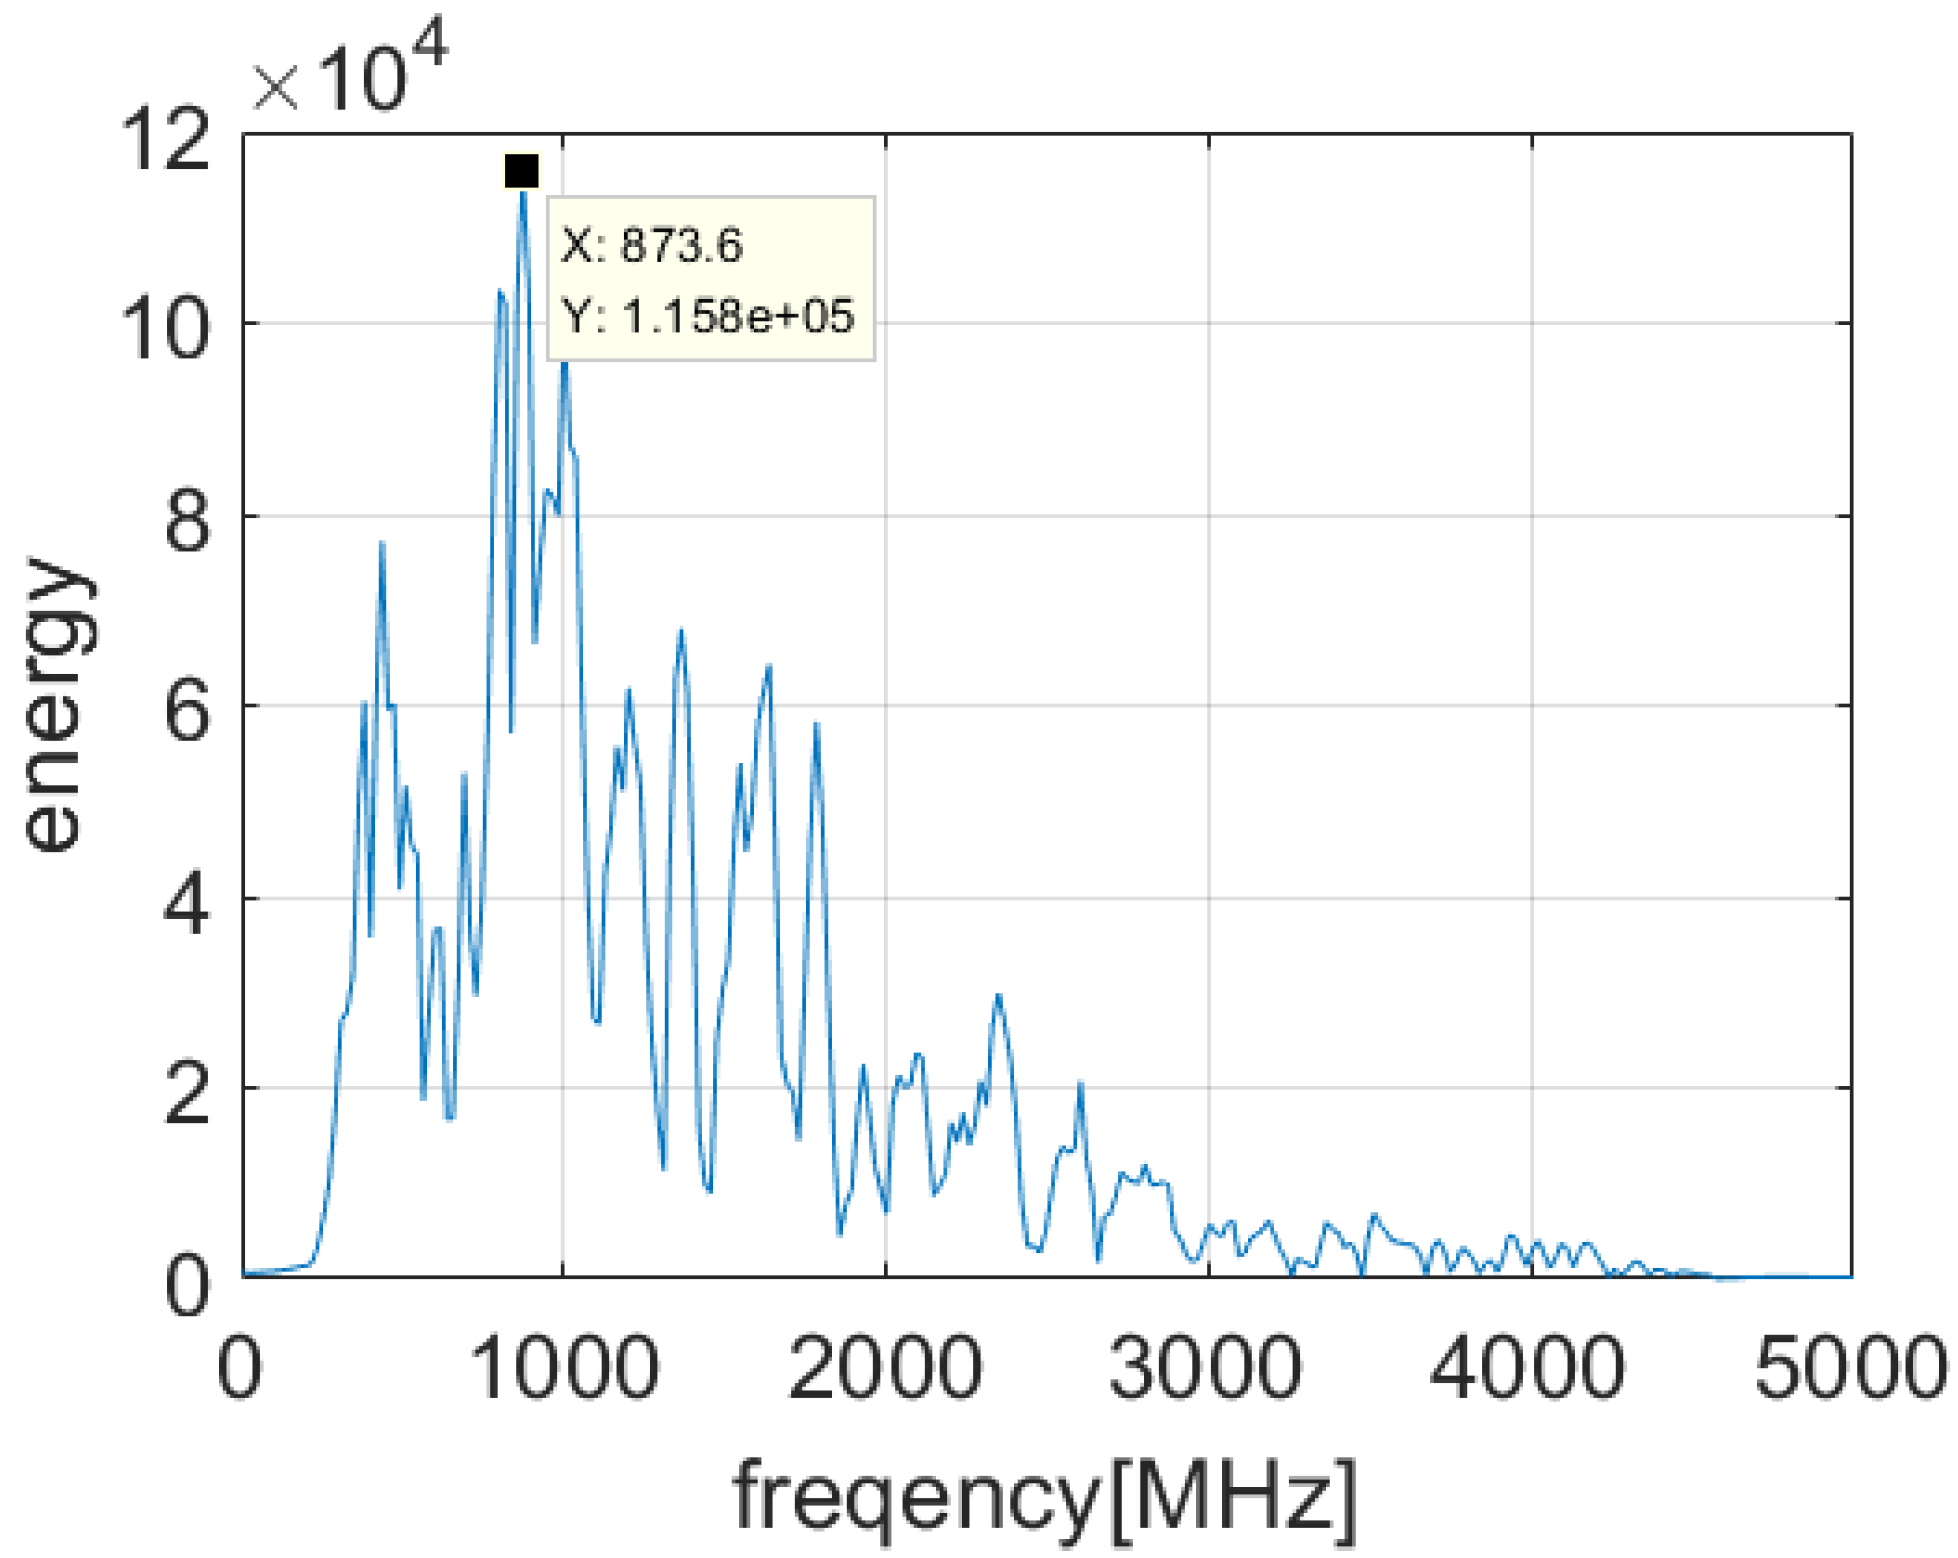
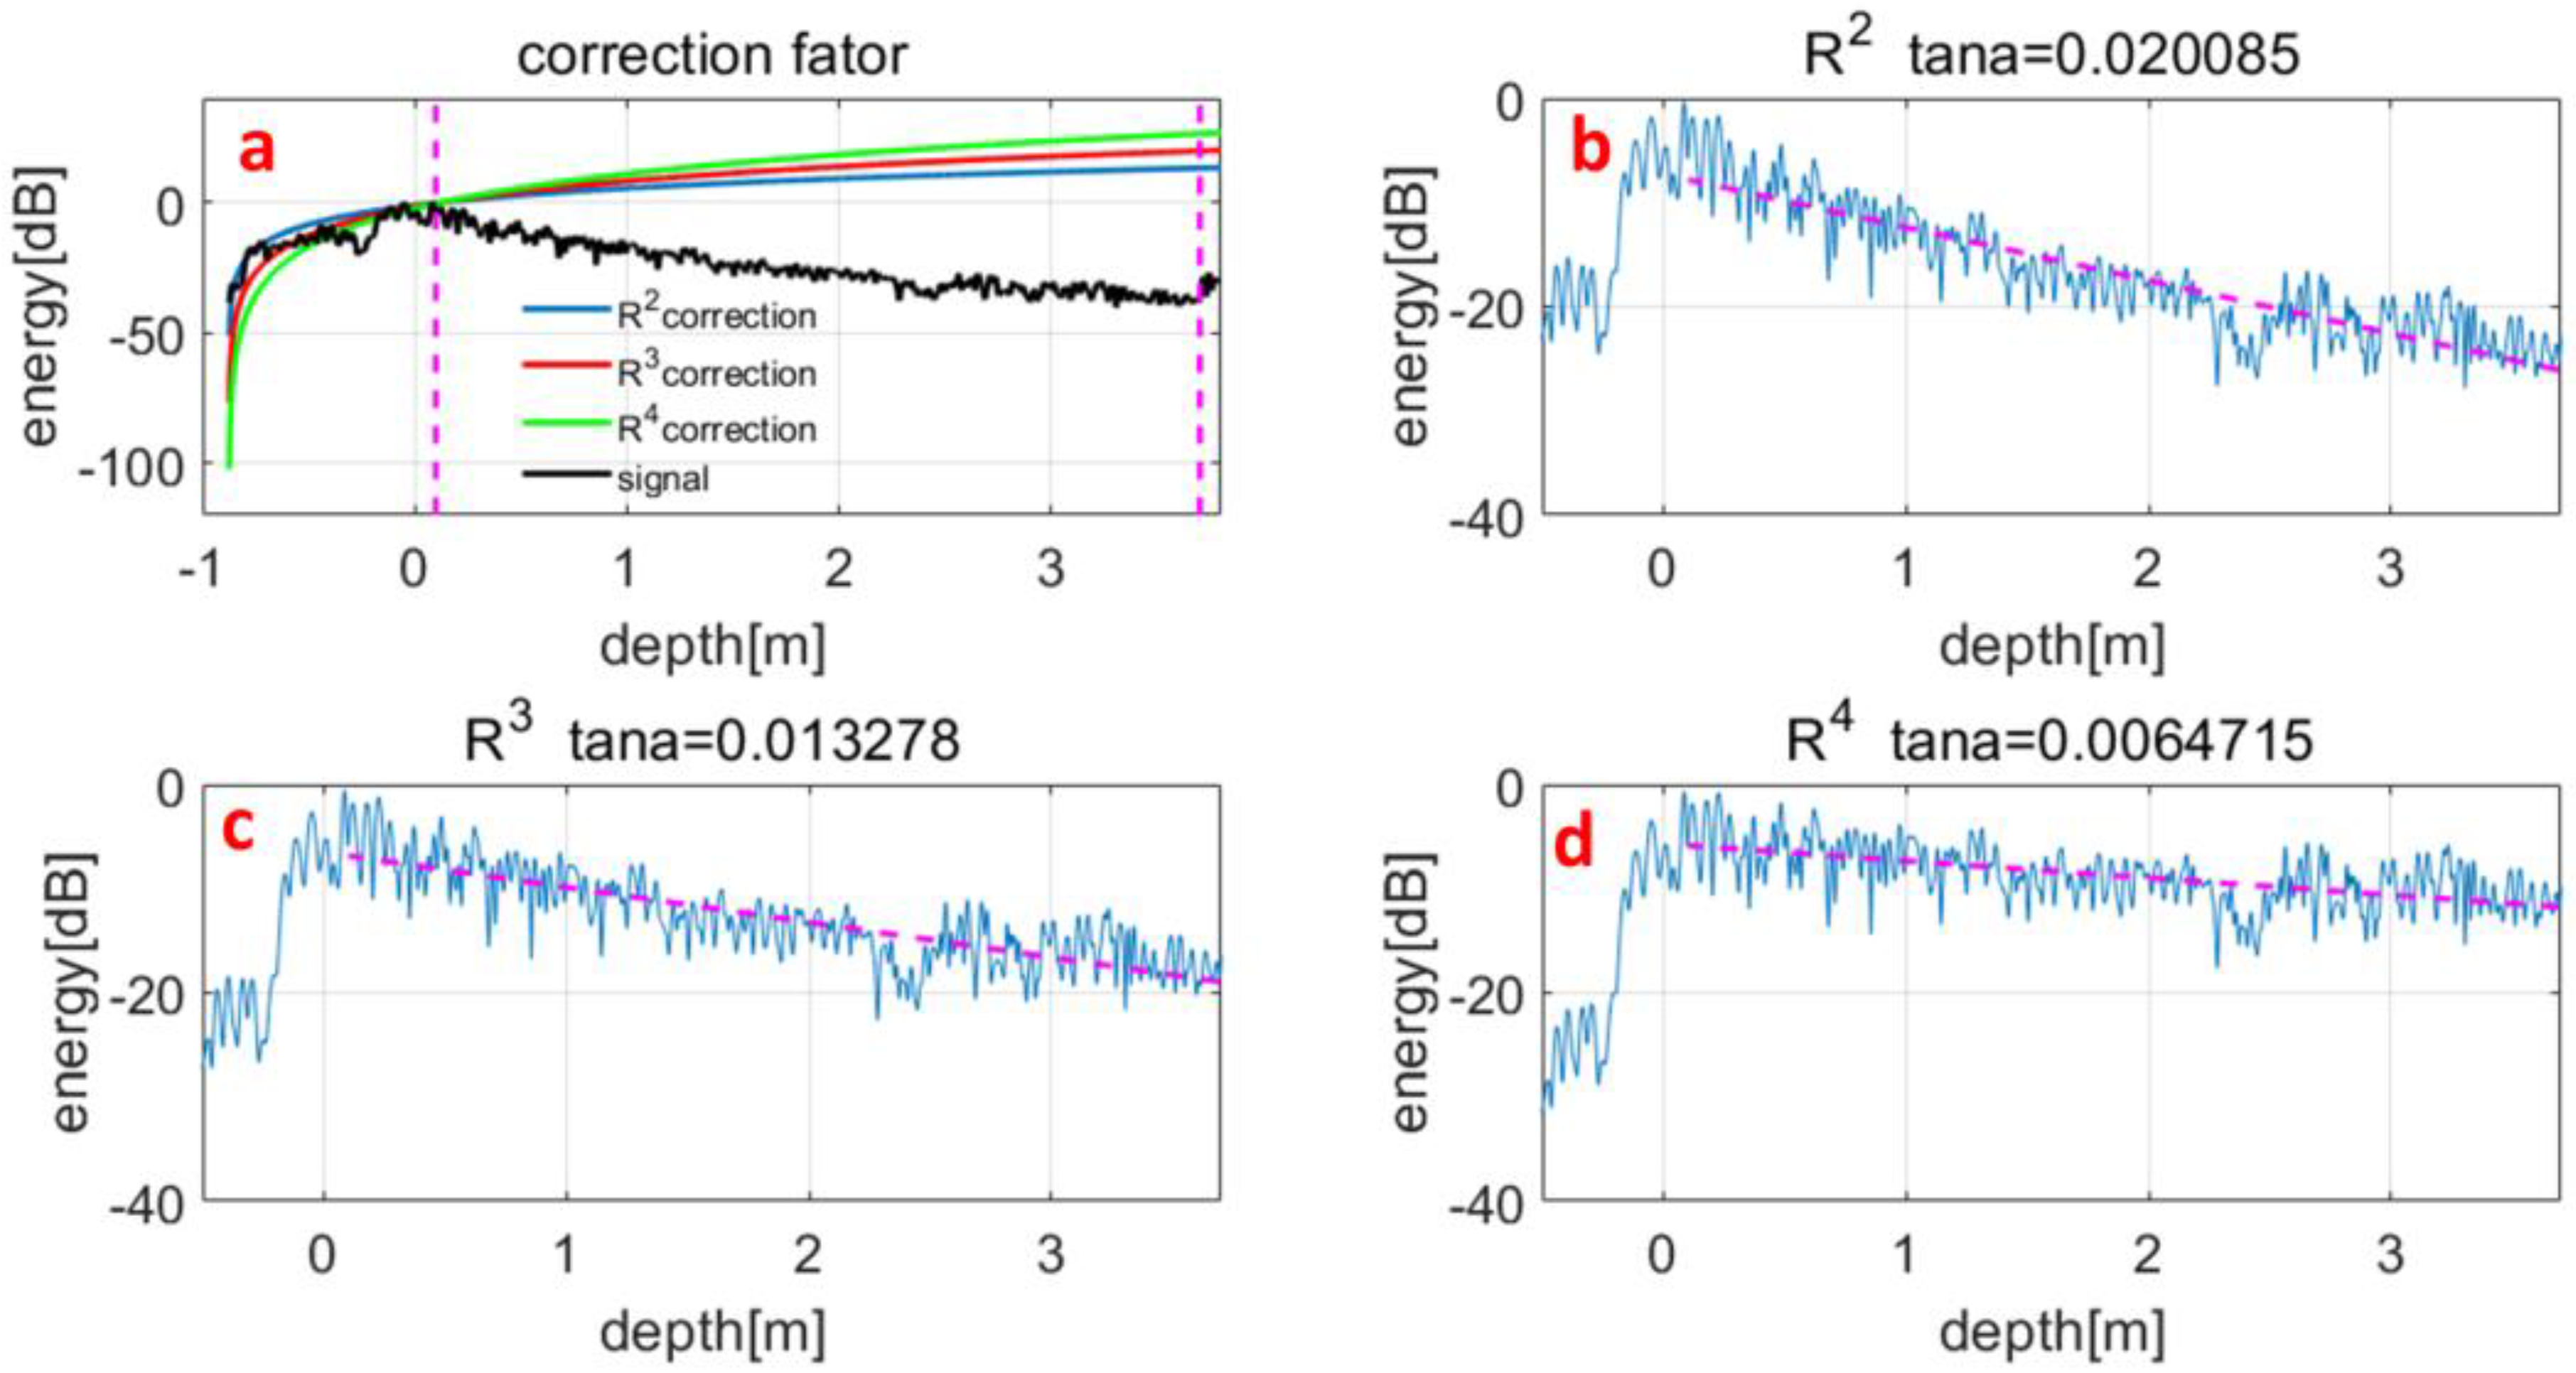
  • The loss tangent is about 0.0133 ± 0.0020 of the CE-5 landing site when the center frequency is 873.6 MHz. The attenuation is similar to that of the CE-3 landing site, which is greater than that of the CE-4 landing site. The FeO+TiO2 content of the CE-5 landing site is about 24.76 ± 1.85 wt. %.

Author Contributions

Conceptualization, Y.L. and B.Z.; methodology, Y.L.; validation, S.S., W.L., S.L. and C.T.; data curation, S.D.; writing—original draft preparation, Y.L.; writing—review and editing, Y.S.; supervision, B.Z.; project administration, G.F.; funding acquisition, Y.S. and Y.L. All authors have read and agreed to the published version of the manuscript.

Funding

This work was supported in part by the CE-5 Mission of the Chinese Lunar Exploration Program (CLEP); in part by the Key Research Program CAS, under Grant number ZDBS-SSW-JSC007.

Institutional Review Board Statement

Not applicable.

Informed Consent Statement

Not applicable.

Data Availability Statement

The Chang’E-5 Lunar Regolith-Penetrating Radar data, displayed in figures in the paper can be downloaded from https://www.clep.org.cn/ (accessed on 29 July 2022). The IDs of the CE-5 data used in this paper are: CE5-L_GRAS_LRPR-A_SCI_N_20201130092304_20201130094032_0001_A.01; CE5-L_GRAS_LRPR-A_SCI_N_20201201171559_20201201173326_0001_A.01.

Acknowledgments

We would like to thank the relevant personnel who participated in the development of CE-5 LRPR, and the Ground Research and Application System team members for their contribution to data receiving and release.

Conflicts of Interest

The authors declare no conflict of interest.

References

  1. Ming, D. Lunar sourcebook. A User’s Guide to the Moon; Cambridge University Press: Cambridge, UK, 1992; Volume 16. [Google Scholar] [CrossRef]
  2. Nozette, S.; Rustan, P.; Pleasance, L.P.; Kordas, J.F.; Lewis, I.T.; Park, H.S.; Priest, R.E.; Horan, D.M.; Regeon, P.; Lichtenberg, C.L.; et al. The Clementine Mission to the Moon: Scientific Overview. Science 1994, 266, 1835–1839. [Google Scholar] [CrossRef] [PubMed]
  3. Chin, G.; Brylow, S.; Foote, M.; Garvin, J.; Kasper, J.; Keller, J.; Litvak, M.; Mitrofanov, I.; Paige, D.; Raney, K.; et al. Lunar Reconnaissance Orbiter Overview: The Instrument Suite and Mission. Space Sci. Rev. 2007, 129, 391–419. [Google Scholar] [CrossRef]
  4. Colaprete, A.; Schultz, P.; Goldstein, D.; Summy, D.; Bart, G.D.; Asphaug, E.; Korycansky, D.; Landis, D.; Sollitt, L.; Heldmann, J.; et al. Detection of Water in the LCROSS Ejecta Plume. Science 2010, 330, 463–468. [Google Scholar] [CrossRef] [PubMed]
  5. Ziyuan, O. Science Results of Chang’e-1 Lunar Orbiter and Mission Goals of Chang’e-2, Spacecraft Engineering. 2010. Available online: https://en.cnki.com.cn/Article_en/CJFDTOTAL-HTGC201005003.htm (accessed on 28 July 2022).
  6. Li, C.; Su, Y.; Pettinelli, E.; Xing, S.; Ding, C.; Liu, J.; Ren, X.; Lauro, S.E.; Soldovieri, F.; Zeng, X.; et al. The Moon’s farside shallow subsurface structure unveiled by Chang’E-4 Lunar Penetrating Radar. Sci. Adv. 2020, 6, eaay6898. [Google Scholar] [CrossRef]
  7. Xiao, L.; Zhu, P.; Fang, G.; Xiao, Z.; Zou, Y.; Zhao, J.; Zhao, N.; Yuan, Y.; Qiao, L.; Zhang, X.; et al. A young multilayered terrane of the northern Mare Imbrium revealed by Chang’E-3 mission. Science 2015, 347, 1226–1229. [Google Scholar] [CrossRef] [PubMed]
  8. Carrier, W.D., III; Olhoeft, G.R.; Mendell, W. Physical Properties of the Lunar Surface. In Lunar Sourcebook; Heiken, G.H., Vaniman, D.T., French, B.M., Eds.; Cambridge University Press: Cambridge, UK, 1991; pp. 522–530. [Google Scholar]
  9. Wang, J.; Zhang, Y.; Di, K.; Chen, M.; Duan, J.; Kong, J.; Xie, J.; Liu, Z.; Wan, W.; Rong, Z.; et al. Localization of the Chang’e-5 Lander Using Radio-Tracking and Image-Based Methods. Remote Sens. 2021, 13, 590. [Google Scholar] [CrossRef]
  10. Li, C.; Hu, H.; Yang, M.-F.; Pei, Z.-Y.; Zhou, Q.; Ren, X.; Liu, B.; Liu, D.; Zeng, X.; Zhang, G.; et al. Characteristics of the lunar samples returned by the Chang’E-5 mission. Natl. Sci. Rev. 2022, 9, nwab188. [Google Scholar] [CrossRef] [PubMed]
  11. He, Q.; Li, Y.; Baziotis, I.; Qian, Y.; Xiao, L.; Wang, Z.; Zhang, W.; Luo, B.; Neal, C.R.; Day, J.M.; et al. Detailed petrogenesis of the unsampled Oceanus Procellarum: The case of the Chang’e-5 mare basalts. Icarus 2022, 383, 115082. [Google Scholar] [CrossRef]
  12. Qian, Y.; Xiao, L.; Wang, Q.; Head, J.W.; Yang, R.; Kang, Y.; van der Bogert, C.H.; Hiesinger, H.; Lai, X.; Wang, G.; et al. China’s Chang’e-5 landing site: Geology, stratigraphy, and provenance of materials. Earth Planet. Sci. Lett. 2021, 561, 116855. [Google Scholar] [CrossRef]
  13. Yue, Z.; Di, K.; Liu, Z.; Michael, G.; Jia, M.; Xin, X.; Liu, B.; Peng, M.; Liu, J. Lunar regolith thickness deduced from concentric craters in the CE-5 landing area. Icarus 2019, 329, 46–54. [Google Scholar] [CrossRef]
  14. Sato, H.; Robinson, M.S.; Lawrence, S.J.; Denevi, B.W.; Hapke, B.; Jolliff, B.L.; Hiesinger, H. Lunar mare TiO 2 abundances estimated from UV/Vis reflectance. Icarus 2017, 296, 216–238. [Google Scholar] [CrossRef]
  15. Li, Y.; Lu, W.; Fang, G.; Zhou, B.; Shen, S. Performance verification of Lunar Regolith Penetrating Array Radar of Chang’E-5 mission. Adv. Space Res. 2019, 63, 2267–2278. [Google Scholar] [CrossRef]
  16. Xiao, Y.; Su, Y.; Dai, S.; Feng, J.; Xing, S.; Ding, C.; Li, C. Ground experiments of Chang’e-5 lunar regolith penetrating radar. Adv. Space Res. 2019, 63, 3404–3419. [Google Scholar] [CrossRef]
  17. Feng, J.; Su, Y.; Ding, C.; Xing, S.; Dai, S.; Zou, Y. Dielectric properties estimation of the lunar regolith at CE-3 landing site using lunar penetrating radar data. Icarus 2017, 284, 424–430. [Google Scholar] [CrossRef]
  18. Lai, J.; Xu, Y.; Zhang, X.; Xiao, L.; Yan, Q.; Meng, X.; Zhou, B.; Dong, Z.; Zhao, D. Comparison of Dielectric Properties and Structure of Lunar Regolith at Chang’e-3 and Chang’e-4 Landing Sites Revealed by Ground-Penetrating Radar. Geophys. Res. Lett. 2019, 46, 12783–12793. [Google Scholar] [CrossRef]
  19. Dong, Z.; Fang, G.; Zhou, B.; Zhao, D.; Gao, Y.; Ji, Y. Properties of Lunar Regolith on the Moon’s Farside Unveiled by Chang’E-4 Lunar Penetrating Radar. J. Geophys. Res. Planets 2021, 126, e2020JE006564. [Google Scholar] [CrossRef]
  20. Zhang, L.; Xu, Y.; Bugiolacchi, R.; Hu, B.; Liu, C.; Lai, J.; Zeng, Z.; Huo, Z. Rock abundance and evolution of the shallow stratum on Chang’e-4 landing site unveiled by lunar penetrating radar data. Earth Planet. Sci. Lett. 2021, 564, 116912. [Google Scholar] [CrossRef]
  21. Su, Y.; Wang, R.; Deng, X.; Zhang, Z.; Zhou, J.; Xiao, Z.; Ding, C.; Li, Y.; Dai, S.; Ren, X.; et al. Hyperfine Structure of Regolith Unveiled by Chang’E-5 Lunar Regolith Penetrating Radar. IEEE Trans. Geosci. Remote Sens. 2022, 60, 1–14. [Google Scholar] [CrossRef]
  22. Lu, W.; Li, Y.; Ji, Y.; Tang, C.; Zhou, B.; Fang, G. Ultra-Wideband MIMO Array for Penetrating Lunar Regolith Structures on the Chang’e-5 Lander. Electronics 2021, 10, 8. [Google Scholar] [CrossRef]
  23. Shen, S.; Zhou, B.; Li, Y.; Lu, W.; Liu, Q.; Tang, C.; Fang, G.; Wang, L. The Design of Payload Lunar Regolith Penetrating Radar on Chang’E-5 Lander. IEEE Aerosp. Electron. Syst. Mag. 2021, 36, 4–16. [Google Scholar] [CrossRef]
  24. Li, Y.; Lu, W.; Fang, G.; Shen, S. The Imaging Method and Verification Experiment of Chang’E-5 Lunar Regolith Penetrating Array Radar. IEEE Geosci. Remote Sens. Lett. 2018, 15, 1006–1010. [Google Scholar] [CrossRef]
  25. Dong, Z.; Fang, G.; Ji, Y.; Gao, Y.; Wu, C.; Zhang, X. Parameters and structure of lunar regolith in Chang’E-3 landing area from lunar penetrating radar (LPR) data. Icarus 2017, 282, 40–46. [Google Scholar] [CrossRef]
  26. Dorizon, S.; Ciarletti, V.; Plettemeier, D.; Benedix, W. Performance validation of the ExoMars 2018 WISDOM GPR in ice caves, Austria. Planet. Space Sci. 2016, 120, 1–14. [Google Scholar] [CrossRef]
  27. Grimm, R.E.; Heggy, E.; Clifford, S.; Dinwiddie, C.; McGinnis, R.; Farrell, D. Absorption and scattering in ground-penetrating radar: Analysis of the Bishop Tuff. J. Geophys. Res. Earth Surf. 2006, 111, 1–15. [Google Scholar] [CrossRef]
  28. Noon, D.A.; Stickley, G.F.; Longstaff, D. A frequency-independent characterisation of GPR penetration and resolution performance. J. Appl. Geophys. 1998, 40, 127–137. [Google Scholar] [CrossRef]
  29. Feng, J.; Su, Y.; Li, C.; Dai, S.; Xing, S.; Xiao, Y. An imaging method for Chang’e−5 Lunar Regolith Penetrating Radar. Planet. Space Sci. 2019, 167, 9–16. [Google Scholar] [CrossRef]
  30. Feng, J.; Siegler, M.A.; White, M.N. Shallow Regolith Structure and Obstructions Detected by Lunar Regolith Penetrating Radar at Chang ’ E-5 Drilling Site. Remote Sens. 2022, 14, 3378. [Google Scholar] [CrossRef]
  31. Zheng, Y.; Yang, M.; Deng, X.; Jin, S.; Peng, J.; Su, Y.; Gu, Z.; Chen, L.; Pang, Y.; Zhang, N. Analysis of Chang’e-5 lunar core drilling process. Chin. J. Aeronaut. 2022. [Google Scholar] [CrossRef]
  32. Ding, C.; Xiao, Z.; Su, Y.; Zhao, J.; Cui, J. Compositional variations along the route of Chang’e-3 Yutu rover revealed by the lunar penetrating radar. Prog. Earth Planet. Sci. 2020, 7, 1–11. [Google Scholar] [CrossRef]
  33. Feng, J.; Siegler, M.A.; White, M.N. Dielectric properties and stratigraphy of regolith in the lunar South Pole-Aitken basin: Observations from the Lunar Penetrating Radar. Astron. Astrophys. 2022, 661, A47. [Google Scholar] [CrossRef]
  34. Olhoeft, G.; Strangway, D. Dielectric properties of the first 100 meters of the Moon. Earth Planet. Sci. Lett. 1975, 24, 394–404. [Google Scholar] [CrossRef]
  35. Hickson, D.; Boivin, A.; Daly, M.G.; Ghent, R.; Nolan, M.C.; Tait, K.; Cunje, A.; Tsai, C.A. Near surface bulk density estimates of NEAs from radar observations and permittivity measurements of powdered geologic material. Icarus 2018, 306, 16–24. [Google Scholar] [CrossRef]
Figure 1. The landing area of CE-5. (a) The geologic context (the red cross is the location of CE-5 Lander) obtained by CE-2 Digital Orthophoto Map (DOM). (b) The landing site image obtained by the CE-5 lander camera (the white frame is CE-5 Lander). (c) The topography taken by the CE-5 panoramic camera.
Remotesensing 14 04539 g001
Figure 2. The layout of LRPR antennas. The interval between adjacent antennas is 0.12 m, and the width of the synthetic aperture is 1.56 m.
Remotesensing 14 04539 g002
Figure 3. The scene of drilling taken by the monitor camera installed at the bottom of the Lander.
Remotesensing 14 04539 g003
Figure 4. The preprocessing results. (a) The raw data. (b) Remove the DC component by band-pass filter. (c) Channel delay correction. (d) The result of eliminating the clutters interference.
Remotesensing 14 04539 g004
Figure 5. Calculate the antennas height. The dataset is the preprocessed data. The horizontal axis is the antenna offset, whereas the vertical axis is the two-way travel time. The red dotted line is the ground reflection arrival time obtained by Equation (2).
Remotesensing 14 04539 g005
Figure 6. The schematic of pre-stack depth migration.
Remotesensing 14 04539 g006
Figure 7. The detection result of LRPR. (a) The variable curve of the bit pressure with depth. Dotted boxes 1 and 2 represent the two areas with relatively higher bit pressure. (b) The imaging result which is applied data preprocessing, migration, exponential compensation gain, and to take the envelope of the image. The solid black line represents the drill pipe. Comparing (a) and (b), both results are exactly consistent.
Remotesensing 14 04539 g007
Figure 8. The estimation of the relative constant. (a) The relative dielectric constants of 132 channels, which the ‘*’ donate the estimated values. (b) The distribution of 132 values. The average value is 2.520, which is employed as the relative dielectric constant of the surface lunar regolith.
Remotesensing 14 04539 g008
Figure 9. (a) This is the topography and geomorphology of CE-3 landing site. (b) This is the topography and geomorphology of CE-4 landing site.
Remotesensing 14 04539 g009
Figure 10. The frequency spectrum of the selected signals. The center frequency 873.6 MHz is used to estimate the loss tangent.
Remotesensing 14 04539 g010
Figure 11. Lunar regolith attenuation characteristics derived from LRPR. The relative dielectric constant 2.520 is utilized for time–depth conversion. R denotes the depth. Tana is the loss tangent. (a) The interval of pink dotted line is the interval selected to evaluate the attenuation characteristics of the lunar regolith. (bd) The pink lines are the linear fitting results of the power attenuation with depth, and the attenuation coefficient of the lunar regolith can be derived from the slope of the fitting line.
Remotesensing 14 04539 g011
Table 1. Main Parameters of LRPR.
ParametersPerformance Index
bandwidth1~3 GHz
Sample interval18.315 ps
Center frequency2 GHz
Duration time54.945 ns
Penetration depth≥2 m
Range resolution<5 cm
Channel number132
Publisher’s Note: MDPI stays neutral with regard to jurisdictional claims in published maps and institutional affiliations.

