Article

RACDNet: Resolution- and Alignment-Aware Change Detection Network for Optical Remote Sensing Imagery

School of Remote Sensing & Geomatics Engineering, Nanjing University of Information Science and Technology, Nanjing 210044, China
*
Author to whom correspondence should be addressed.
Remote Sens. 2022, 14(18), 4527; https://doi.org/10.3390/rs14184527
Submission received: 1 August 2022 / Revised: 18 August 2022 / Accepted: 8 September 2022 / Published: 10 September 2022

Abstract

:
Change detection (CD) methods work on the basis of co-registered multi-temporal images with equivalent resolutions. Due to the limitation of sensor imaging conditions and revisit period, it is difficult to acquire the desired images, especially in emergency situations. In addition, accurate multi-temporal images co-registration is largely limited by vast object changes and matching algorithms. To this end, a resolution- and alignment-aware change detection network (RACDNet) is proposed for multi-resolution optical remote-sensing imagery CD. In the first stage, to generate high-quality bi-temporal images, a light-weighted super-resolution network is proposed by fully considering the construction difficulty of different regions, which facilitates to detailed information recovery. Adversarial loss and perceptual loss are further adopted to improve the visual quality. In the second stage, deformable convolution units are embedded in a novel Siamese–UNet architecture for bi-temporal deep features alignment; thus, robust difference features can be generated for change information extraction. We further use an atrous convolution module to enlarge the receptive field, and an attention module to bridge the semantic gap between the encoder and decoder. To verify the effectiveness of our RACDNet, a novel multi-resolution change detection dataset (MRCDD) is created by using Google Earth. The quantitative and qualitative experimental results demonstrate that our RACDNet is capable of enhancing the details of the reconstructed images significantly, and the performance of CD surpasses other state-of-the-art methods by a large margin.

1. Introduction

With the development of sensor technologies, huge amounts of remote-sensing (RS) images with varied resolutions, spectral characteristics, and modalities are easily available, which has opened up the era of RS big data. Thus, it is crucial to develop skills and techniques to excavate useful knowledge from the increasingly accumulated data. Change detection (CD) is the process of identifying Earth surface changes by using co-registered images acquired in the same area but different dates. Due to the advantages of large coverage areas and short revisit period, RS change detection techniques have been widely used in the areas of land mapping, urban planing, resource investigation, disaster monitoring, and environment assessment [1,2,3,4,5].
In the past few decades, a large amount of research has been conducted on CD [6,7,8], which basically evolves with the development of machine learning and pattern recognition, and falls into two categories: traditional change detection (TCD) and deep learning change detection (DLCD). In the former case, feature engineering and pattern classification techniques are mostly investigated to extract change information, and the workflow mainly consists of (1) difference image generation, (2) threshold segmentation or classification, and (3) change map generation. The analysis unit can be independent pixels or spatially continuous super-pixels (i.e., image objects). Pixel-based TCD are mainly designed for middle- and low-resolution RS images, where ground objects can be delineated by a single pixel. In this case, it is possible to generate change map by directly comparing pixel spectral or textural values. In addition, feature engineering can be introduced to generate more discriminative features through principal component analysis (PCA) [9], multivariate alteration detection (MAD) [10], or slow feature analysis (SFA) [11]. However, “salt and pepper” noise easily arises as pixels are treated independently without considering spatial context. To overcome the limitation, neighbouring windows [12] or Markov random fields [13,14] are further employed to include spatial prior constraints. On the contrary, object-based TCD aims to address CD issues in high-resolution RS images, where intra-class heterogeneity increase and inter-class heterogeneity decrease significantly. In this case, image objects, which are usually generated by segmentation algorithms, are more meaningful to delineate ground objects. Change map can be thus generated by comparing object features [15] or class categories [16,17]. Note that spatial context can be included naturally within image objects, and rich object features (such as shape, geometry, topology, etc.) can be extracted for comprehensive change analysis. However, it is difficult to determine a proper scale for high-resolution RS images with complex scenes. Taking the limitations of pixel-based CD (PBCD) and object-based CD (OBCD) into account, it is naturally to design CD techniques by combining their advantages. For example, in [18], a novel unsupervised algorithm-level fusion scheme is proposed to improve the accuracy of PBCD using spatial context information. In addition, 3D change detection is becoming increasingly popular due to the usage of height information through stereo images [19] or Light Detection and Ranging (LiDAR) points [20].
Recently, due to the availability of big data and powerful computational resources (especially GPUs), deep learning has achieved tremendous success in the areas of computer vision and image understanding, which also leads to many breakthroughs in RS community [21,22,23]. The advantages of deep learning can be mainly summarized into two aspects: (1) strong feature representation ability, hierarchical features can be learned automatically by training deep neural network (DNN), which makes it unnecessary to design hand-craft features using complex feature engineering; and (2) powerful non-linear modeling ability, DNN is capable of fitting arbitrarily complex functions, which far outperforms traditional classifiers such as decision tree, support vector machine (SVM), and random forest. As a result, deep learning has dominated the contemporary CD methods. In the early stage, deep features are used to replace hand-craft features, difference image (DI) can be thus generated for change analysis. Note that deep features can be extracted directly from pre-trained DNN models or specially designed models which are trained from scratch. For example, Hou et al. [24] proposed to extract deep features using pretrained VGG16 network, low-rank decomposition was then applied on the difference images to generate saliency change maps. Zhang et al. [25] proposed a deep belief network (DBN) to learn deep features directly from raw images, polar domain transformation and fuzzy clustering method were then used to generate change map. In [26,27], Siamese–CNN architectures were employed to learn robust features through contrastive loss or triplet loss. However, DIs have to be generated before change analysis, which inevitably leads to error accumulation effect. To address the limitations, numerous end-to-end CD networks are proposed, where change map can be learned directly from bi-temporal images. The network input can be pixel patches or image clips. In the former case, small convolution neural network (CNN) with fully connected (FC) layer is usually adopted, and the change type of the center pixel is determined by the corresponding patch classification result, which is mainly used for small datasets. Rodrigo et al. [28] first proposed two CNN architectures for end-to-end CD, which are trained from scratch using 15 × 15 patches. In [29], 2D affinity matrix is constructed for end-to-end hyperspectral image CD. However, it is difficult to define a proper patch size, and the pixel patches contain massive redundant information, which easily leads to over-fitting effect and huge computational consumption. To overcome the drawbacks, fully convolutional network (FCN)-based CD methods are proposed by dealing with image clips directly, where the change type of each pixel can be determined all at once through network inference. Due to its efficiency and effectiveness, plenty of FCN architectures are introduced to improve end-to-end CD performance, such as SegNet [30,31], UNet [32,33,34,35,36,37], UNet++ [38,39,40,41,42,43], UNet3+ [44], DeepLab [45,46], HRNet [47,48,49], etc. Note that in FCN-based CD, bi-temporal images can be stacked as a novel image with double bands or fed into two independent branches (i.e., Siamese architecture) before network training.
It is worth noting that, attention mechanism, which aims to focus on saliency areas based on human visual system, has been widely used in FCN-based CD architectures [39,50,51,52]. In general, two types of attention units are mostly employed, namely channel attention (CA) and spatial attention (SA). The former aims to assign different weights to different feature channels based on their importance, while the latter aims to force the network to focus on the areas of interest. To exploit spatial–temporal dependency, Chen et al. [53] proposed a self-attention mechanism to generate more discriminative features. Multi-scale sub-regions are further generated to capture spatial–temporal dependencies for different objects at various scales. In a similar way, Shi et al. [54] proposed a convolutional block attention module (CBAM), which consists of both CA and SA modules. A metric learning module is then used to generate change map. In [55], to enhance high-frequency information of buildings, a spatial-wise attention and high-frequency enhancement module is introduced to better detect the edges of changed buildings. Similarly, Xiang et al. [44] proposed a multi-receptive field position enhancement module (MRPEM) based on coordinate attention, leading to enhanced local relationship and long-distance dependency of features. Fang et al. [43] proposed SNUNet-CD, where an ensemble channel attention module (ECAM) is employed for mitigating the semantic gap in deep supervision. In a similar work, EUNet-CD [41] is proposed by repeatly adopting SA and CA units to refine the multi-scale features. In [56], a novel deeply supervised attention-guided network named DSANet is proposed by introducing SA-guided cross-layer addition and skip-connection module.
Different from CNN architectures with limited receptive fields, transformer architectures, which are composed of self-attention units and feed-forward network, are capable of capturing global information and modeling long-range dependencies. In the past few years, it has demonstrated significant advantages over CNN counterparts in the areas of both natural language processing and image understanding. Due to its excellent global modeling ability, transformer architectures are also drawing increasing attention in CD areas. Based on the intuition that high-level concepts of changes could be represented by semantic tokens, Chen et al. [57] proposed a bitemporal image transformer (BIT) to model spatial–temporal contexts, where a transformer-based encoder is used to learn high-level semantic tokens, and a transformer-based decoder is further adopted to refine original deep features by using the context-rich tokens. To overcome the limitation of single-scale tokens, Ke et al. [58] proposed a hybrid transformer for RS image CD by establishing heterogeneous semantic tokens, which fully models the representation attentions at hybrid scales. A hybrid difference transformer decoder is further introduced to strengthen multi-scale global dependencies of high-level features. To aggregate rich context information effectively for CD, Liu et al. [59] proposed a multi-scale context aggregation network (MSCANet), where transformer-based encoder and decoder are adopted for refining feature maps from each scale. In [60], a multi-scale swin transformer is introduced to refine multi-scale features, thus generating more discriminative features for CD. Note that in the above-mentioned methods, CNN-based backbones are used for feature extraction, while transformers are only used for modeling global long-range dependencies. In [61], a pure transformer-based architecture termed ChangeFormer is first proposed for CD, which unifies hierarchically structured transformer-based encoder and multi-layer perception (MLP)-based decoder in a Siamese network architecture. In this way, multi-scale long-range dependencies can be efficiently modeled for accurate CD. Zhang et al. [62] also proposed a pure transformer network named SwinUNet for RS images CD, where swin-transformer blocks are adopted to serve as the basic units for all the encoder, decoder and fusion modules.
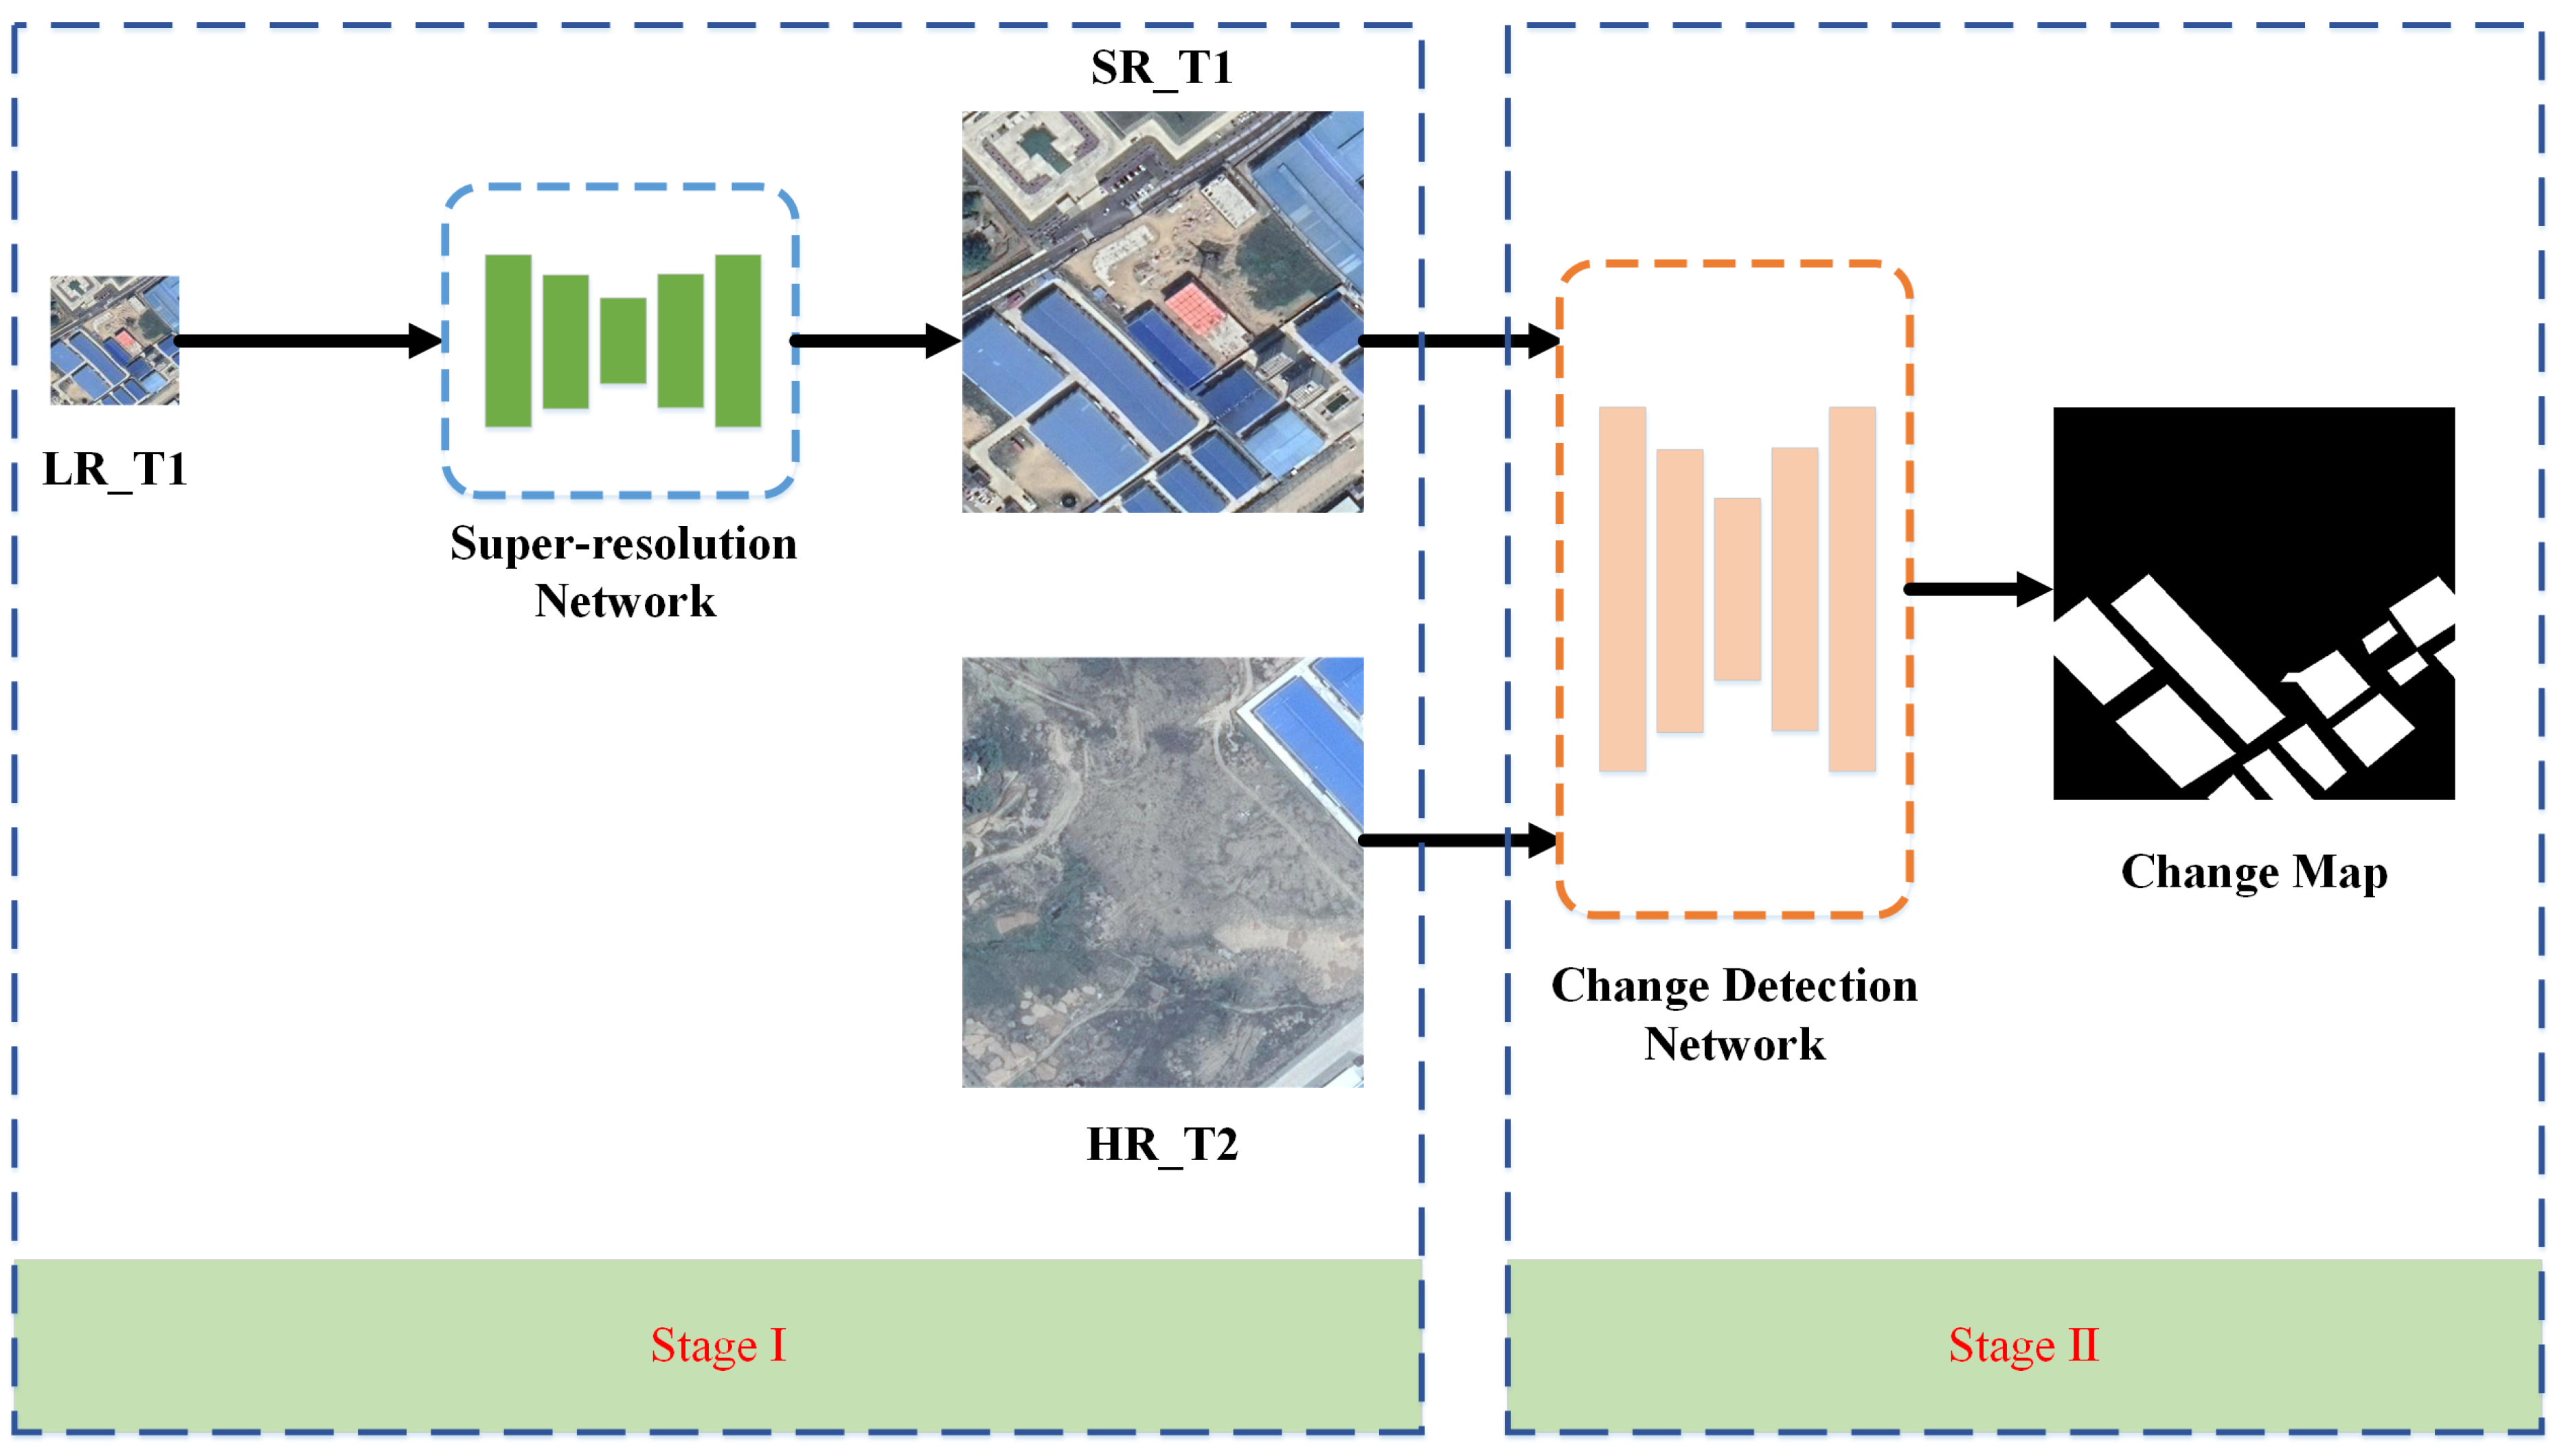
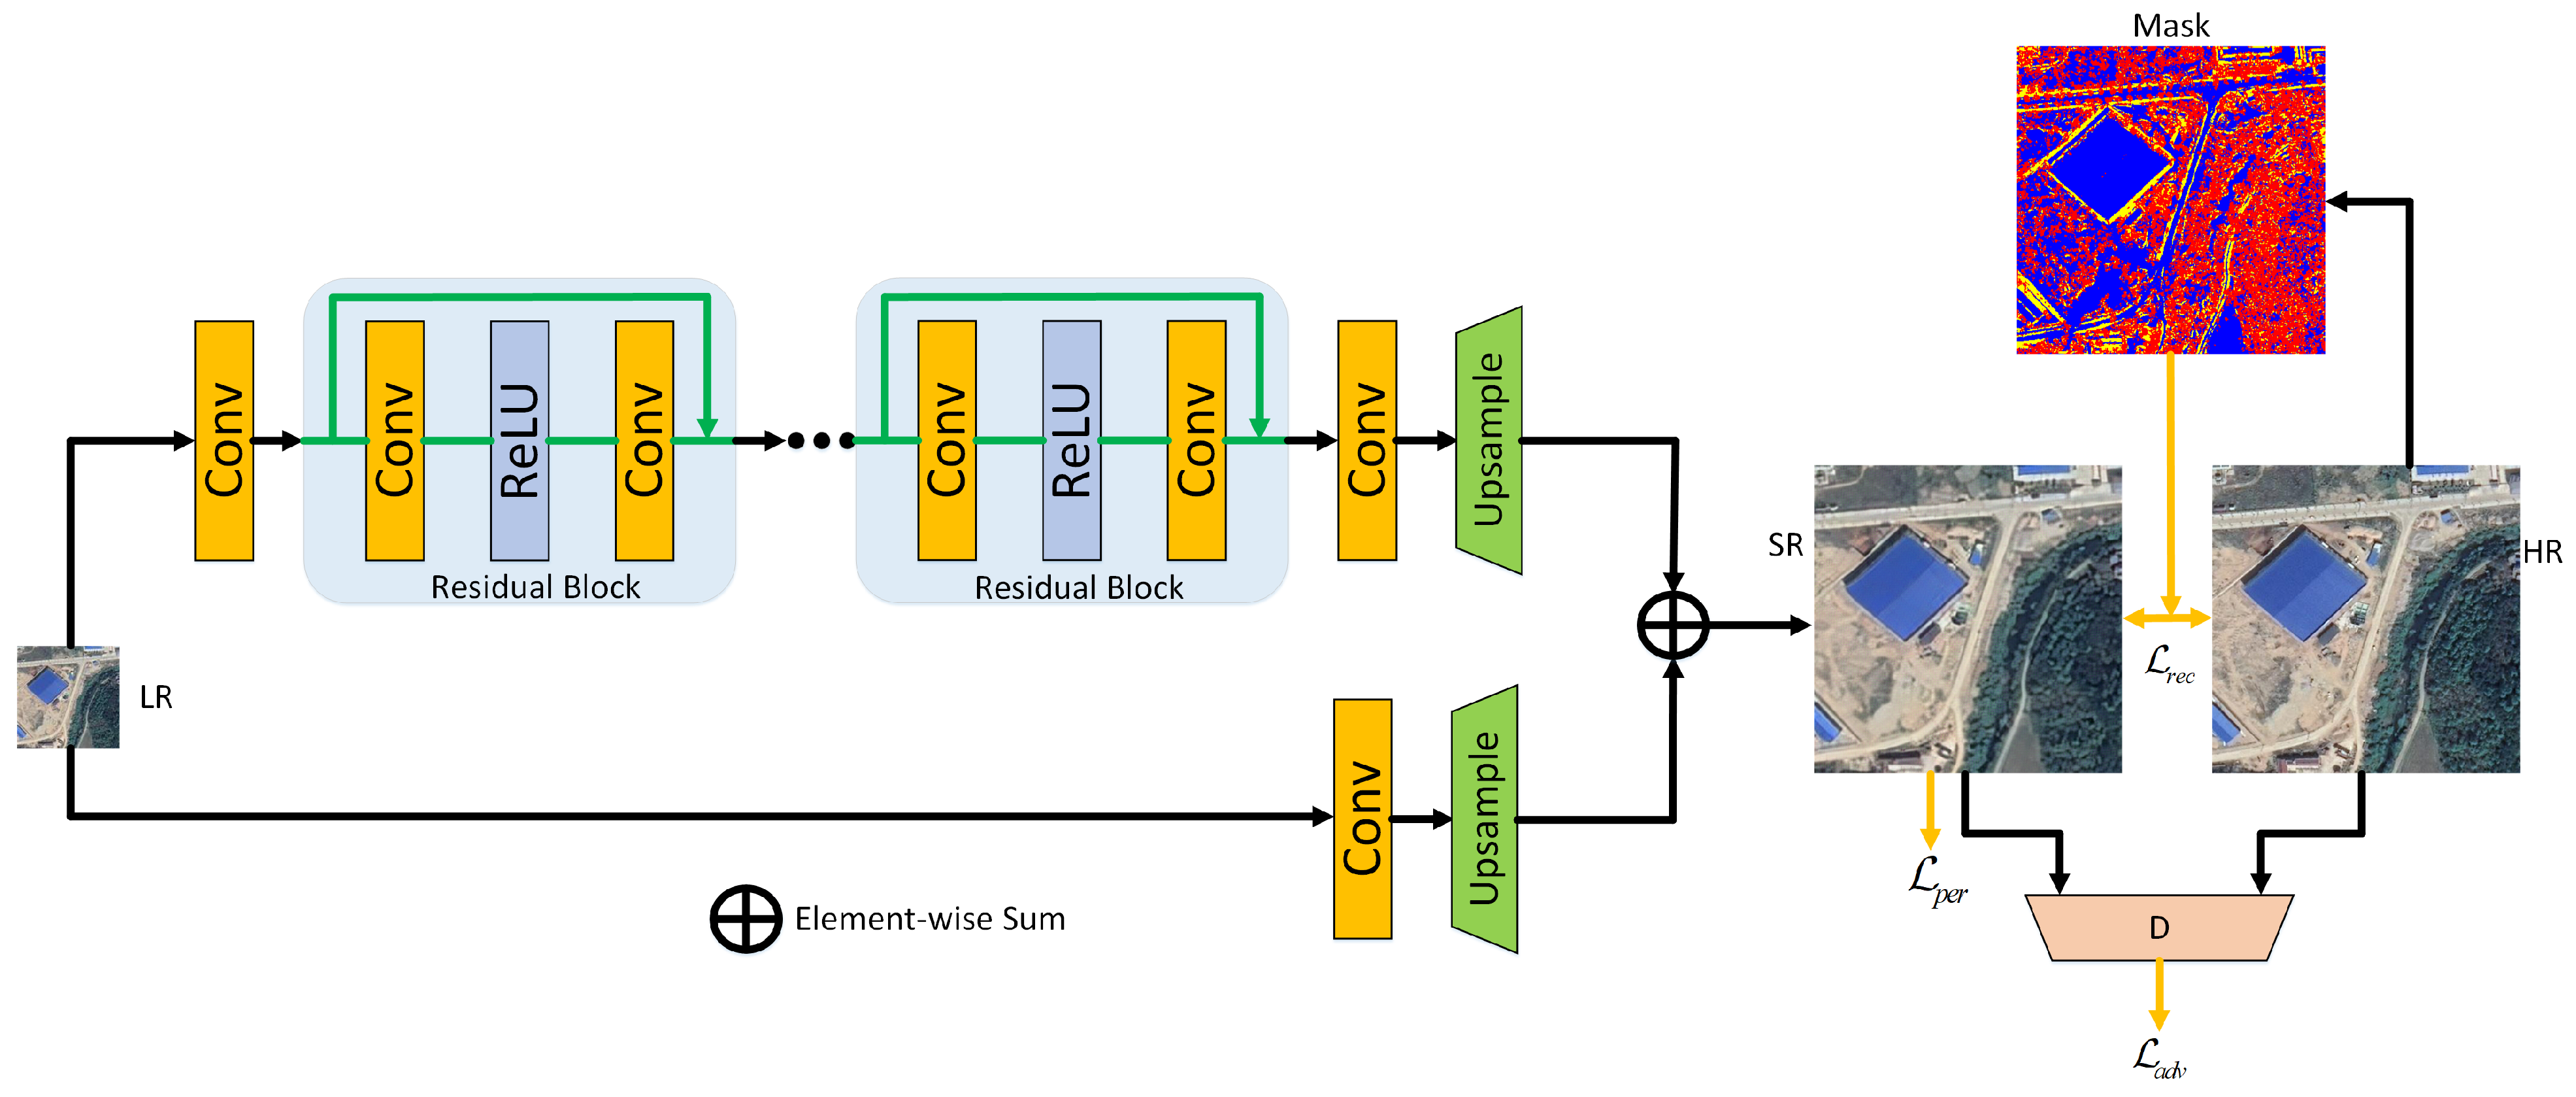
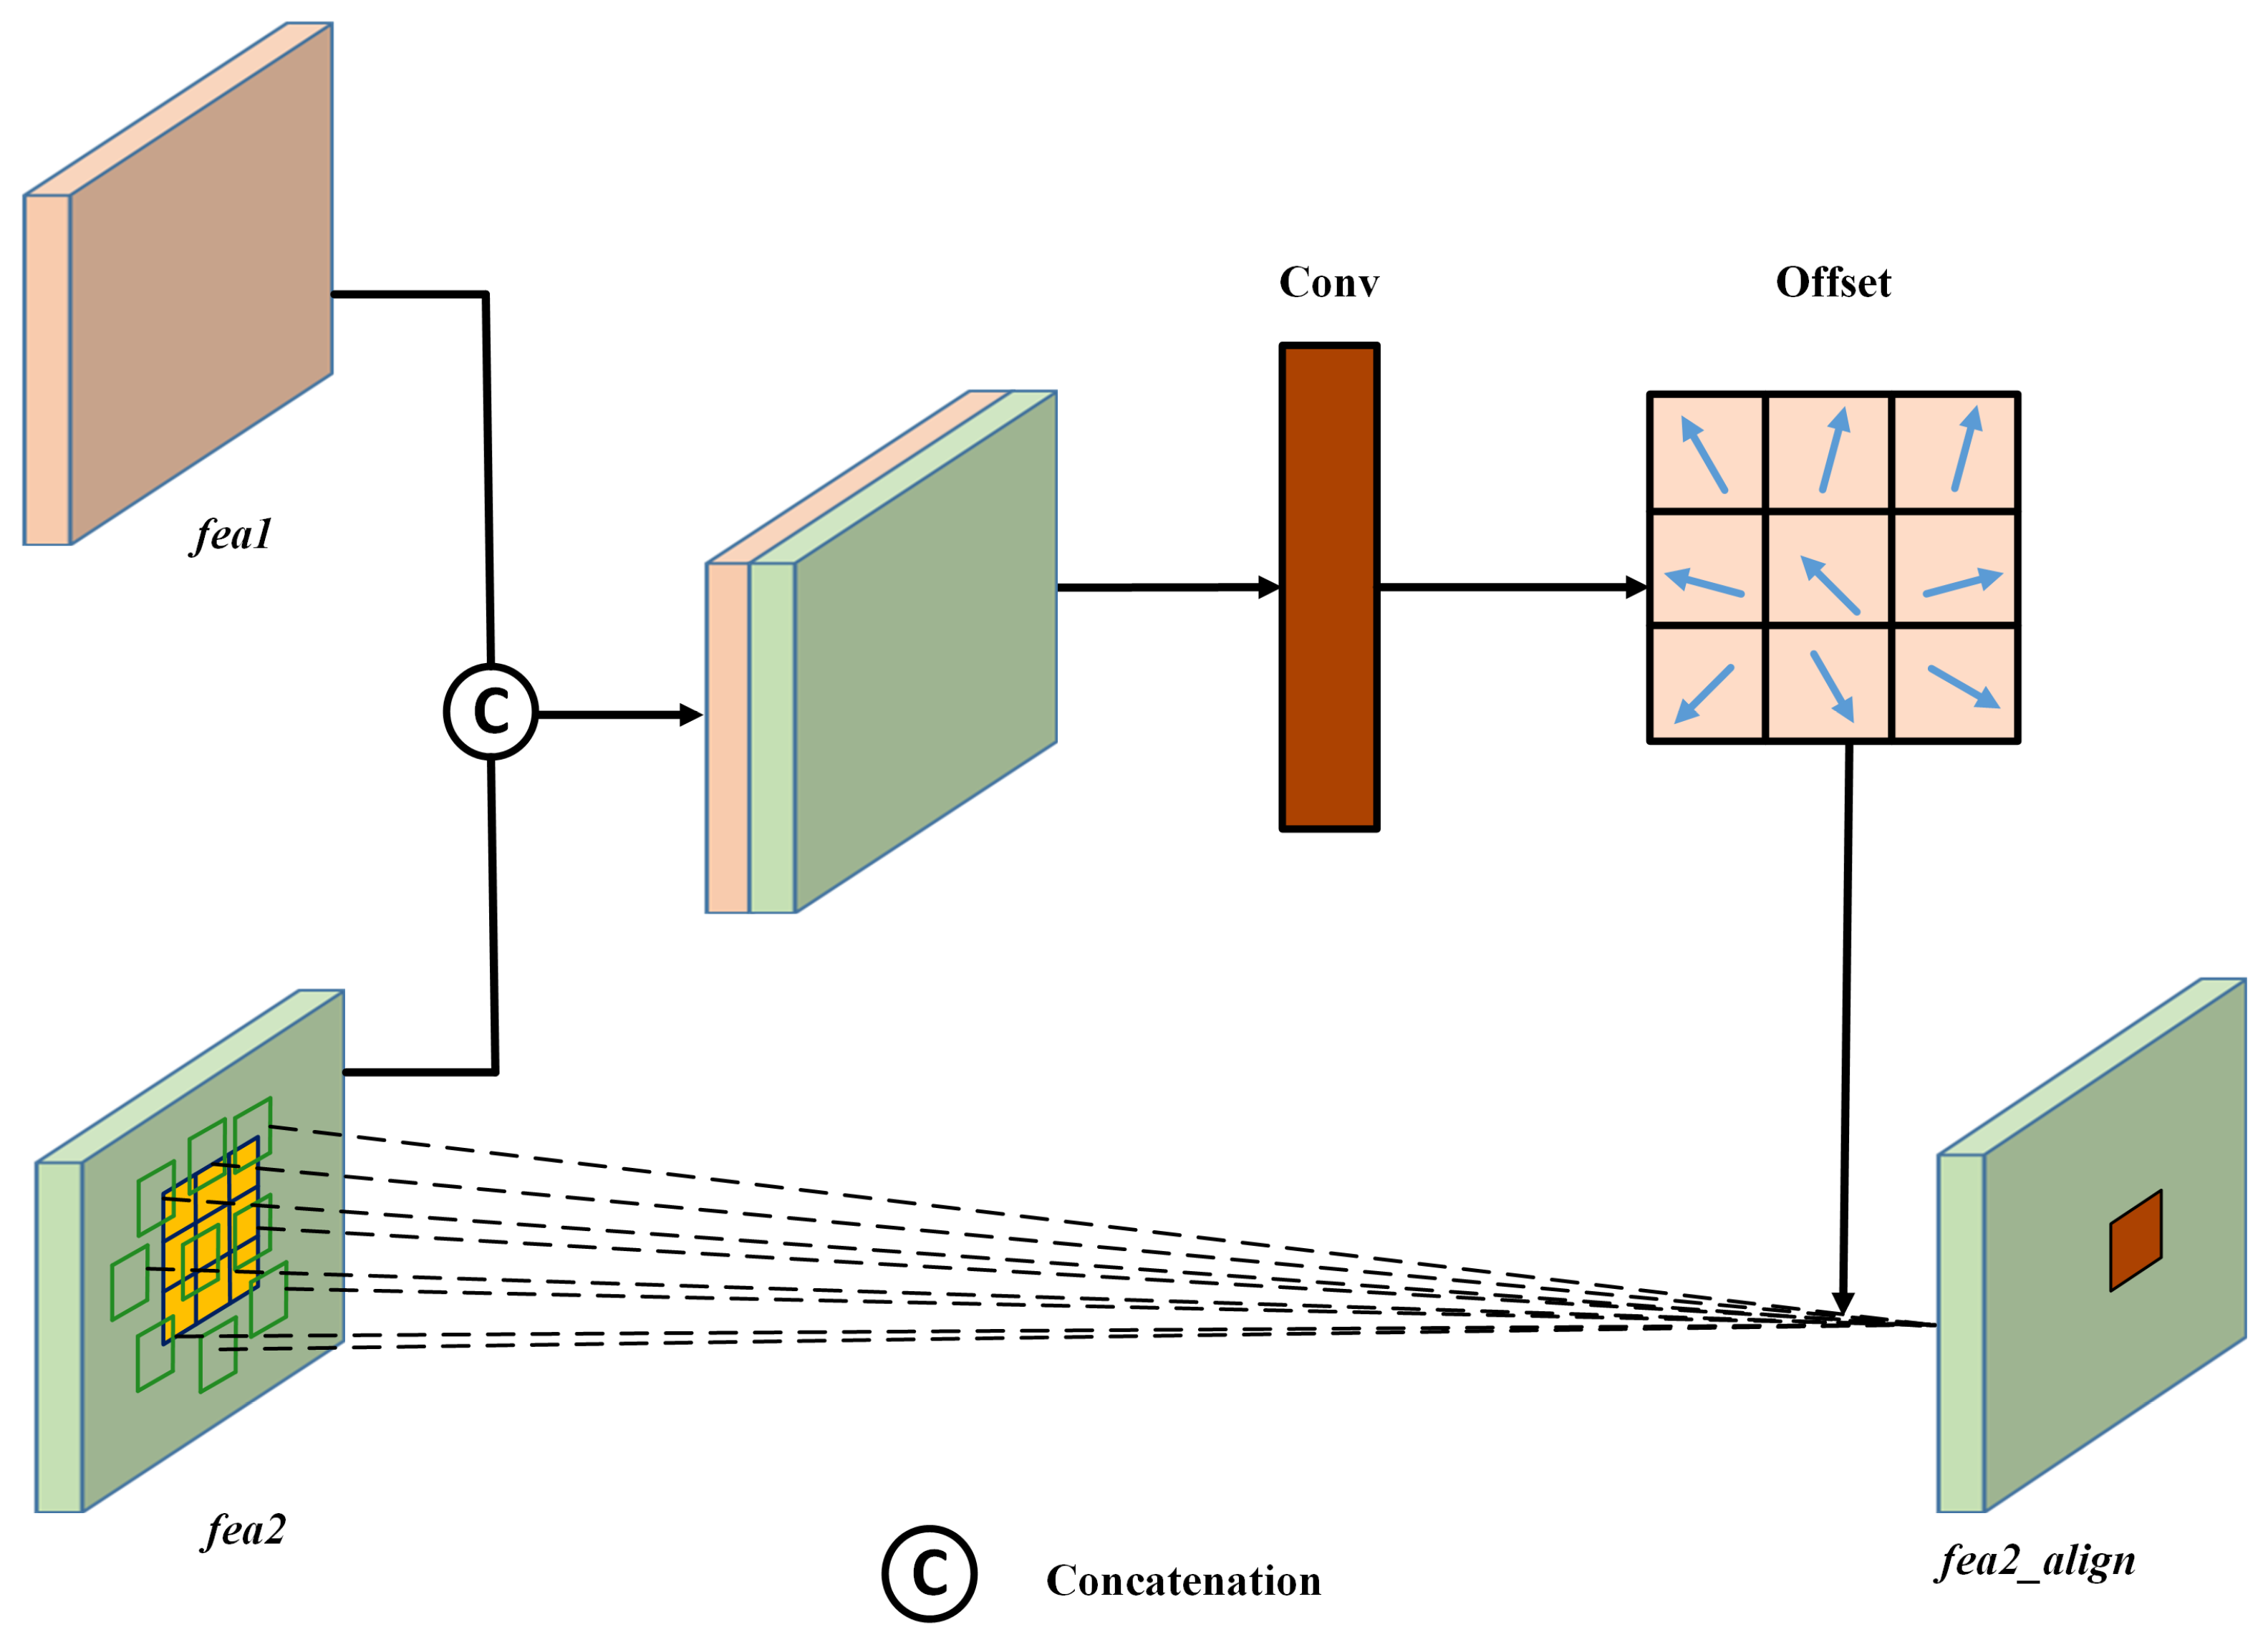
Despite the tremendous success of the above-mentioned DLCD methods, they heavily rely on co-registered bi-temporal images with equivalent resolutions. However, in real-world scenes, such images are difficult to acquire due to the limitation of imaging conditions and revisit period. Meanwhile, accurate co-registration between bi-temporal is especially challenging due to widespread object changes, leading to inevitable co-registration errors. To address the issues, a novel resolution- and alignment-aware change detection network (RACDNet) is proposed. First, a light-weighted super-resolution network based on WDSR is proposed. To better recover high-frequency detailed information, gradient weight is calculated and assigned to different regions, thus forcing the network to concentrate on difficult reconstruction areas. To mitigate over-smooth effect, adversarial loss and perceptual loss are further introduced to improve visual perceptual quality of the reconstructed images. Then, a novel Siamese–UNet is proposed for effective CD, which follows the classic encoder-decoder architecture. To align bi-temporal deep features, deformable convolution unit (DCU) is used by warping the feature maps with the learned offsets. At the end of the encoder, atrous convolution unit (ACU) is adopted to enlarge the receptive field. To bridge the semantic gap between encoder and decoder, an effective attention unit (AU) is embedded. To sum up, our contributions are three-fold:
(1)
A novel super-resolution network is proposed, which is simple yet effective in recovering high-frequency details in RS imagery.
(2)
An alignment-aware CD network is proposed, where bi-temporal deep features can be aligned explicitly by using DCUs, ACU and attention mechanism are further introduced to improve CD performance.
(3)
We, for the first time, create a novel multi-resolution change detection dataset (MRCDD), which is beneficial for future multi-resolution CD research. Extensive experiments and analysis are conducted on the MRCDD to demonstrate the effectiveness of our proposed method. The code and dataset will be open to public via https://github.com/daifeng2016/Multi-resolution-Change-Detection (accessed on 31 July 2022).
The rest of the article is organized as follows. Section 2 describes the preliminary work. The proposed RACDNet is illustrated in detail in Section 3. Experiments and results of the proposed method are presented and analyzed in Section 4. Section 5 presents the discussions of the proposed method. Finally, Section 6 draws the conclusions of this paper.

2. Preliminaries

2.1. Super-Resolution Reconstruction

Super-resolution (SR) reconstruction is capable of restoring high-frequency details by using redundant and complementary information in low-resolution (LR) images, thus generating high-resolution (HR) images that do not rely on hardware. Due to the effectiveness of reconstructing HR images in a low-cost way, it is widely used in RS areas, such as target recognition, scene classification, land cover mapping and change detection [63,64]. At present, the SR methods can be categorized into three types: interpolation-based SR, reconstruction-based SR [65] and learning-based SR [66,67]. Among them, interpolation-based SR works on the assumption that gray values of pixels are continuous in image space, which easily leads to blurred and jagged results due to ignoring image features. Reconstruction-based SR heavily rely on accurate registration, which often fails to work on SR task with large amplification factor. On the contrary, learning-based SR is capable of learning the mapping relationship directly by using a large amount of high- and low-resolution image pairs. With the rapid development of deep learning theories, deep learning-based methods have pushed SR to a new level, which outperform other SR methods by a large margin. Dong et al. [68] first proposed a small CNN named SRCNN for SR task, which is simple yet effective than most traditional methods. However, SRCNN with limited receptive field struggles to establish a global mapping relationship. To overcome the limitations, Kim et al. [69] proposed a very deep SR network (VDSR), which enlarges the receptive field by using a deep network, residual blocks are also introduced to facilitate network convergence and enhance high-frequency feature representation. Furthermore, Lim et al. [70] proposed an enhanced deep super resolution (EDSR) network, where batch normalization layer is removed and residual scaling strategy is included to increase the network training stability and improve SR performance. Yu et al. [71] proposed a WDSR network by using wide feature maps to reduce information loss. Weight normalization and pixel-shuffle strategy are further introduced to improve SR performance. However, only reconstruction loss is considered, which easily leads to over-smooth effect. To address the issues, generative adversarial network (GAN) is further introduced to improve visual perceptual quality of the SR result [72]. However, the scene of high-resolution RS image is complex, how to effectively restore structural information such as edges remains to be studied. Closely related to our work, Liu et al. [73] first proposed SRCDNet for CD of bitemporal images with different resolutions. However, the LR images are generated by simple bicubic down-sampling via HR counterparts, which struggles to generalize to real-world scenarios due to ignoring of the degradation process in RS images.

2.2. Remote Sensing Image Registration

Remote sensing image registration (RSIR) is the process of integrating different images into a unified spatial coordinate system, namely constructing the correspondence between images at pixel level. It is a preliminary step for many RS tasks such as image fusion, image stitching, and change detection. Given a pair reference image and target image, a straight and effective way of RSIR is to select certain ground control points (GCPs) with proper distribution, transformation parameters can then be calculated to warp the target image. However, GCPs are quite difficult to acquire, which are confidential to common users. On the contrary, feature points such as SIFT, SURF [74] can be extracted fast by using only input images, which are robust to illumination, rotation, scale and geometric distortion. Therefore, feature extraction and matching methods are widely used for RSIR. In the past few decades, numerous features descriptors and matching strategies have been developed [75,76,77,78]. The workflow basically follows feature extraction, correspondence construction, transformation parameters calculation and warping, which is especially trival for down-stream applications. In the context of DLCD, small mis-registration errors exist widely in the available datasets, which inevitably influence bi-temporal image change analysis. However, it is costly and time-consuming to register the CD dataset through traditional workflow, which consists of thousands of image pairs. Rather than aligning raw image pairs at image-level, we propose to align deep features directly by using deformable convolution units, which can be easily embedded into the CD network.

3. Proposed RACDNet

3.1. Network Overview

The overview of the proposed RACDNet is presented in Figure 1, which is a simple two-stage network. In the first stage, low-resolution input L R _ T 1 is super-resolved by using the proposed enhanced WDSR network (EWDSR), thus generating its high-resolution counterpart S R _ T 1 . To facilitate high-frequency details recovery, different weights are assigned into different areas based on gradient information, thus forcing the network to focus on important structures reconstruction. Adversarial loss and perceptual loss are further introduced to improve visual perception quality of the SR result. Then, in the second stage, based on the high-quality bi-temporal image pairs ( S R _ T 1 and H R _ T 2 ), an alignment-aware encoder-decoder architecture is proposed for effective change information extraction. To mitigate the influence of mis-registration errors, deformable convolution units (DCUs) are used to align bi-temporal deep features effectively. Atrous convolution units are further introduced to enlarge the receptive fields, while attention units are used for bridging the semantic gap between the encoder and decoder. In particular, the two-stage network can be trained in an end-to-end manner. However, it is difficult to optimize the whole network with complex architectures and many different losses, which may easily fail to converge. On the contrary, it is more beneficial to optimize SR network and CD network sequentially in a two-stage manner. Note that, compared with direct co-registration for raw images using ground control points or tie points, our proposed DCUs are capable of aligning bi-temporal deep features explicitly, which is much more efficient without considering raw image characteristics.

3.2. Enhanced WDSR Network

In terms of super-resolution reconstruction, flat areas with poor texture information are easy to reconstruct, while texture-rich regions (i.e., structures, edges) are difficult to recover. However, pixels are treated equally in traditional SR network, which neglects the reconstruction difficulty of different regions, leading to poor details recovery and inefficient computational consumption. To this end, we proposed an enhanced WDSR (EWDSR) network, where a novel reconstruction loss is adopted by assigning small weights to flat areas while large weights to texture-rich regions. In such a way, the network is enforced to focus on the high-frequency information for reconstruction, leading to improved structural information recovery. As shown in Figure 2, for the low-resolution input L R , it first goes through two independent branches for learning different reconstruction information. The upper branch, i.e., the main branch, aims to learn the high-frequency details by using several residual blocks and an up-sampling module. Differently, the lower-branch, i.e., the auxiliary branch, aims to learn the low-frequency information though only a convolution layer and up-sampling layer. Finally, the results from the two branches are combined to generate the final super-resolved result. The process can be defined as:
S R = U p ( C o n v ( L R ) ) + U p ( R e s C o n v n ( C o n v ( L R ) ) )
where U p ( . ) denotes the up-sampling layer, C o n v ( . ) denotes the convolution layer, R e s C o n v n denotes residual blocks with n residual convolution units. Note that pixel shuffle strategy is adopted as the up-sampling layer to improve the up-sampling performance.
To effectively divide the reconstructed image into different regions of gradient information, the classic Harris corner detection method is used. Let us assume λ 1 and λ 2 be two eigenvalues of the M matrix in the Harris algorithm, the mask of flat areas, corners areas, and edge areas can be simply defined based on the two eigenvalues:
m a s k = e d g e i f λ 1 λ 2 o r λ 2 λ 1 c o r n e r i f λ 1 > T a n d λ 2 > T f l a t e l s e
where T denotes the corresponding threshold. Based on the mask, different weights can be set manually to calculate a weighted reconstruction loss L r e c . However, over-smooth effect easily arises when relying only on the reconstruction loss. To overcome the drawbacks, a discriminator D is introduced to enforce the feature distribution consistency between the reconstructed images and their ground truth, thus improving SR performance by adversarial training. Perceptual loss L p e r is further included by reducing deep features discrepancy between SR results and ground truth, which aims to enhance the visual perceptual quality. The detailed definition of the three losses ( L r e c , L a d v , L p e r ) will be presented in the Section 3.4. Note that, to facilitate adversarial training, PatchGAN [79] is adopted as the discriminator for exploiting the local information of images. As shown in Figure 3, the PatchGAN discriminator consists of successive convolution layers (Conv), batch normalization layers (BN), and leaky-ReLU layers. In particular, the stride of the final convolution layer is 1, while the others are 2 for down-sampling.

3.3. Alignment-Aware CD Network

Based on the generated high-quality bitemporal images, a novel alignment-aware CD network is proposed for accurate change information extraction, as shown in Figure 4. It is a simple encoder-decoder-based network with Siamese architecture. The encoder consists of successive residual convolution (ResConv) units and pooling layers. The architecture of the ResConv unit is presented in Figure 5. At encoding stage, two periods of images are fed into two separate branches with shared weights for multi-scale deep features extraction. At the end of the encoder, a light-weighted multi-scale atrous convolution unit (ACU) is used to enlarge the receptive field. Assuming D i ( i = 1 , 2 , 4 ) denote atrous convolution layers with dilation rates i, F e be the output feature maps of the encoder, the output of the ACU can be defined as:
F o = F e + F e D 1 + F e D 1 D 2 + F e D 1 D 2 D 4
where F o denotes the output feature maps of ACU, ⊗ denotes the convolution operation.
During decoding stage, difference feature maps are generated to embed change information explicitly. However, due to the influence of misregistration errors, direct difference operation will inevitably leads to uncertain difference maps. In particular, deformable convolution (DC) [80] is capable of aligning two feature maps by using the learned offsets. For an input pixel x ( 0 , 0 ) with a 3 × 3 neighbour R i , j i { 1 , 0 , 1 } , j { 1 , 0 , 1 } , its deformable convolution ouput can be defined as:
D C ( x ( 0 , 0 ) ) = i , j k ( i , j ) x ( i + Δ i , j + Δ j )
where k ( i , j ) is the learned weights at location ( i , j ) , Δ i and Δ j are the horizontal and vertical offsets, respectively.
Therefore, to address the issues, deformable convolution units (DCUs) are adopted to align the bitemporal deep features before difference maps generation. As presented in Figure 6, two periods of the deep features ( f e a 1 and f e a 2 ) are first fused to generate the offset field using a convolutional layer, then a deformable convolution layer is employed to align f e a 2 by using the learned offsets. It can be defined as:
f e a 2 _ a l i g n = D C ( f e a 2 , C o n v ( [ f e a 1 , f e a 2 ] ) )
where D C ( . ) denotes the deformable convolution operation, [ . ] denotes the concatenation operation.
In addition, low-level feature maps in the encoder contain few semantic cues but rich detailed information. On the contrary, high-level feature maps in the decoder include rich semantic cues but few detailed information. It is naturally to combine the advantages of the two types of features through skip connection. To mitigate the semantic gap between the encoder and decoder, an attention unit (AU) is adopted to re-calibrate the low-level features with learned attention maps, as presented in Figure 7. Assuming F h R C h × H × W denotes the high-level feature map with C h channels and size of H × W , and F l R C l × H × W denotes the low-level feature map with C l channels and size of H × W , respectively. Based on F h , both average pooling and max-pooling are used to obtain multiple attention cues. A 1 × 1 convolution layer is subsequently used to learn channel correlations and weight distributions. Then, a sigmoid layer is employed to generate the attention map W h R C × 1 × 1 . For the low-level feature map F l , it is refined by first going through a convolution layer and then multiplying with the attention map, which can be defined as:
W h = σ [ C o n v ( A v g P o o l ( F h ) ) + C o n v ( M a x P o o l ( F h ) ) ]
F o u t = W h C o n v ( F l )
where σ denotes the sigmoid layer, ⊙ denotes the element-wise multiplication operation.

3.4. Loss Functions

3.4.1. Super-Resolution Loss

The super-resolution loss consists of three types of losses, namely weighted reconstruction loss, adversarial loss and perceptual loss. Assuming M i ( i = 1 , 2 , 3 ) denote the masks of flat areas, edge areas and corner areas, ω i ( i = 1 , 2 , 3 ) denote the corresponding weights, the weighted reconstruction loss can be defined as:
L r e c = 1 3 i = 1 3 ω i M i ( I S R ) M i ( I H R ) 1
Note that, through the simple loss L r e c , the reconstruction difficulty of different areas will be fully considered to improve high-frequency information recovery.
To overcome the over-smooth effect, adversarial loss and perceptual loss are further included. In particular, adversarial loss is imposed by enforcing the feature distribution consistency between super-resolved image and its ground truth:
L D = log ( D ( I H R ) ) log ( 1 D ( G ( I L R ) ) )
where D and G denote the discriminator and generator, respectively. To fool the discriminator, the adversarial loss on the generator part is defined as:
L a d v = log ( D ( G ( I L R ) ) )
Through adversarial training of the D and G, the feature distribution of the super-resolved images will ensemble to their ground truth, thus generating clear and visually favorable images.
In addition, to improve visual perceptual quality, perceptual loss is calculated by minimizing the discrepancy between super-resolved images and reference images in deep feature space:
L p e r = 1 C i H i W i ϕ i ( I S R ) ϕ i ( I H R ) 1
where ϕ i denotes the i t h layer feature extraction operation using pre-trained VGG19 network. C i , H i and W i denotes the corresponding channels, height and width of the feature map, respectively.
Finally, the super-resolution loss, which combines the advantages of the above-mentioned losses, can be defined as:
L s r = L r e c + α L a d v + β L p e r
where α and β denote the corresponding weights for adversarial loss and perceptual loss, respectively.

3.4.2. Change Detection Loss

For the CD network, two simple losses are adopted, i.e., weighted binary cross-entropy loss L b c e and intersection over union loss L i o u . In particular, the number of changed pixels is usually much less that of the unchanged pixels in CD datasets. To address sample imbalance issues, L b c e is calculated by assigning different weights to changed and unchanged pixels, respectively:
L b c e = 1 N γ j y + log ( P ( y j = 1 ) ) + ( 1 γ ) j y log ( P ( y j = 0 ) )
where N denotes the total sample number in the dataset, γ = y y + + y and 1 γ = y + y + + y denote the weights of the changed and unchanged pixels, respectively. y + and y denote the number of the changed and unchanged pixels, respectively. P ( . ) denotes the sigmoid function.
In addition, assume y p D c and y t D c denote the predicted change maps and their ground truth in the change map space D c , respectively, L i o u can be defined as:
L i o u = 1 y p , y t D c y p y t y p + y t y p y t
Note that, L b c e is a pixel-based loss, while L i o u is an area-based loss. By combining the advantages of the two losses, more stable CD performance can be achieved. Finally, the CD loss can be defined as:
L c d = L b c d + L i o u

4. Experiments and Results

4.1. Dataset Descriptions

To verify the effectiveness of the proposed RACDNet, a novel multi-resolution change detection dataset (MRCDD) is created specially for multi-resolution optical RS images CD task. The images were acquired during the periods between 2006 and 2019, covering the suburb areas of Wuhan City, China, where the land use/land cover changed rapidly in the past decade. For the benefit of multi-resolution image pairs generation, Google Earth service through BIGEMAP software was used to collect 28 multi-resolution image pairs with three bands of red, green, and blue. The spatial resolution of the high-resolution images is 0.5 m, with the size ranging from 2668 × 2148 pixels to 10,368 × 10,320 pixels. While the spatial resolution of the low-resolution images is 2m, with a quarter size of their high-resolution counterparts. The main ground types include buildings, water, bare land, forests, roads, etc. Based on the high-resolution image pairs, we annotate the main change type, namely the buildings. After initial annotation, careful visual inspection is also made to avoid possible labeling errors. To facilitate GPU training, the high-resolution image pairs are cropped into 512 × 512 non-overlapping image clips, while the low-resolution image pairs are cropped into 128 × 128 non-overlapping image clips. Finally, we obtain 3812 multi-resolution image pairs and the corresponding ground truth (GT) of change maps. Some typical examples of the MRCDD are presented in Figure 8. Note that due to the limitation of Goole Earth image geometric quality, small mis-registration errors exist widely between the two periods of images, which poses great challenge for CD methods.

4.2. Training Details

The proposed RACDNet is implemented using Pytorch framework, which is powered on a workstation with Intel Xeon CPU (3.6 GHz, 8 cores, 32 GB RAM) and a NVIDIA GTX 1080Ti GPU with 11 GB memory. During the training of the SR network, the Adam optimizer is adopted for both the discriminator and generator. The initial learning rate is set to 1 × 10 4 , which is decayed using a “MultiStepLR” scheme. The batchsize is set to 32 and the epoch is set to 30. To alleviate over-fitting effect, the training data are augmented by random cropping, flipping and rotation. As for the hyper-parameters, the ω i in Equation (8) are set to { 1 , 10 , 10 } . Besides, α is set to 0.001 and β is set to 0.1 as suggested in [81].
For the CD network, Adam optimizer is also adopted with a base learning rate of 1 × 10 4 . The batchsize is set to 8 with 30 epochs. In a similar way, the training data are augmented online through randomly flipping in horizontal and vertical directions and rotating by 90 , 180 , and 270 . In addition, test time augmentation (TTA) strategy is utilized to improve prediction performance through random flipping and rotation. To facilitate network convergence, ResNet34 is adopted as the backbone for the encoder.

4.3. Competitors

To verify the effectiveness and superiority of the proposed RACDNet, we compare it with several state-of-the-art CD methods, which are:
(1)
Fully convolutional-early fusion (FC-EF) network [28], which is the first FCN-based CD architecture in RS community. Two periods of images are stacked as the input, a UNet-like architecture is then used to produce change maps.
(2)
Fully convolutional Siamese-concatenation (FC-Siam-conc) network [28]. It is a Siamese variant of FC-EF, where two periods of images are fed into two separate branches during encoding stage and fused by concatenation at decoding stage.
(3)
Fully convolutional Siamese-difference (FC-Siam-diff) network [28]. It is another Siamese extension of FC-EF. Compared with FC-Siam-conc, encoder features are fused by absolute difference instead of concatenation.
(4)
Fully convolutional network with pyramid pooling (FCN-PP) [32]. It is an encoder-decoder architecture, which basically follows FC-EF but with a pyramid pooling module to enlarge the receptive field at the end of the encoder.
(5)
A deeply supervised image fusion network (IFN) for CD [82]. It is an extension of FC-Saim-conc by adding attention modules and deep supervision strategy in the decoder.
(6)
A densely connected Siamese network (SNUNet) for CD [43]. It is a combination of Siamese network and NestedUNet, where localization information loss can be alleviated through compact information transmission between encoder and decoder. Ensemble channel attention module is further adopted for mitigating the semantic gap in deep supervision.
(7)
A bitemporal image transformer (BIT) network [57]. Based on resnet backbone, a novel transformer-based encoder and decoder is first proposed to model spatial–temporal context and refine deep features for CD.

4.4. Evaluation Metrics

For quantitative analysis of the proposed EWDSR network, four metrics are employed, namely peak signal to noise ratio (PNSR), structural similarity index (SSIM), learned perceptual image patch similarity (LPIPS) and natural image quality evaluator (NIQE). To be specific, PNSR is a reference value for measuring the image quality between the maximum signal and the background noise, a larger PNSR leads to smaller image distortion. It is defined as:
MSE = 1 H W i = 0 H 1 j = 0 W 1 [ I H R ( i , j ) I S R ( i , j ) ] 2
PNSR = 20 · log ( 255 MSE )
where I H R and I S R denote reference image and super-resolved image, respectively, H and W denote the height and width of the images, respectively.
Based on the theory of structural similarity of human visual system, SSIM is calculated by estimating brightness with mean, contrast with variance and structural similarity with covariance:
SSIM ( x , y ) = ( 2 μ x μ y + c 1 ) ( 2 σ x y + c 2 ) ( μ x 2 + μ y 2 + c 1 ) ( σ x 2 + σ y 2 + c 2 )
where x and y denote the reference image and reconstructed image, respectively, μ x and μ y denote the corresponding mean values, σ x and σ y denote the corresponding variance values, σ x y denotes the corresponding covariance value, c 1 and c 2 denote two constants for computational stability. Note that a higher SSIM leads to better reconstruction performance.
However, PNSR and SSIM are favorable to over-smooth results. To overcome the drawbacks, LPIPS and NIQE are further introduced by considering visual perceptual quality. LPIPS measures the similarity between the reference image x and the reconstructed image y based on the extracted deep features, which can be defined as:
LPIPS ( x , y ) = l 1 H l W l h , w ω l ( φ l ( x ) φ l ( y ) ) 2 2
where l denotes the l t h pretrained network, H l and W l denote the height and width of l t h feature maps, ω l denotes channel-wise vector, ⊙ denotes dot production, φ l ( . ) denotes feature extraction operation. A smaller LPIPS value will lead to better visual perceuptual performance. Different from LPIPS, NIQE is a reference-free metric, which is calculated through Gaussian statistic analysis of 36 typical nature scenes [83]. A smaller NIQE value also leads to better visual perceptual performance.
For the benefit of quantitative analysis of CD results, four metrics of F1-score (F1), overall accuracy (OA), Kappa and intersection over union (IoU) are introduced. They are defined as:
F 1 = 2 × TP 2 × TP + FP + FN
OA = TP + TN TP + FP + TN + FN
Kappa = OA PRE 1 PRE
PRE = ( TP + FN ) × ( TP + FP ) ( TP + TN + FP + FN ) 2 + ( TN + FP ) × ( TN + FN ) ( TP + TN + FP + FN ) 2
IoU = TP TP + FP + FN
where TP denotes the number of true positives, FP denotes the number of false positives, TN denotes the number of true negatives, and FN denotes the number of false negatives. Note that higher F1, OA, Kaapa and IoU indicate better overall CD performance.

4.5. Super-Resolution Results

To verify the effectiveness of the proposed EWDSR network, we compare it with four SR methods, namely Bicubic, EDSR [70], WDSR [71] and contextual transformation network (CTN) for remote-sensing image SR [84]. For visual analysis, six typical areas are selected, and the visual results of different methods are presented in Figure 9. One can observe that Bicubic method, which only employs a simple upsampling strategy through neighbourhood pixel interpolation, fails to recover edge and structure information. On the contrary, EDSR achieves a much better SR result, where the mapping relationship between high- and low-resolution image pairs can be learned by using a deep residual network. In addition, the edges are more clear in WDSR method. On the contrary, CTN method only achieves comparable visual performance against EDSR. Note that our proposed EWDSR method achieves the best visual performance among the compared methods, where the edge and structure information can be best recovered. The reasons lie in the following aspects: (1) different weights are assigned into different areas based on reconstruction difficulty, thus forcing the network to focus more on the texture-rich areas and recover more detailed information; (2) adversarial loss and perceptual loss are included to improve visual quality of the results.
For quantitative analysis, four metrics of PNSR, SSIM, LPIPS and NIQE are calculated. Table 1 reports the quantitative results of different super-resolution methods. As can be seen, Bicubic method achieves the lowest PNSR and SSIM, while the largest LPIPS and NIQE. Compared with Bicubic, EDSR obtains better metric scores by introducing an effective deep super-resolution network. By introducing wide feature maps, weight normalization and pixel shuffle strategies, WDSR outperforms EDSR on the four metrics, with increases of 0.89% and 0.79% in PNSR and SSIM, respectively, and decreases of 6.32% and 1.46% in LPIPS and NIQE, respectively. Compared with EDSR, CTN obtains even poor metric scores except PNSR, which demonstrates the limitations of CTN when dealing with real-world SR task. Note that our proposed EWDSR achieves the best quantitative performance against the compared methods. Compared with EDSR, it yields gains of 8.25% and 4.13% in PNSR and SSIM, respectively, while decreases of 18.90% and 16.93% in LPIPS and NIQE, respectively. This demonstrates the effectiveness and superiority of the proposed EWDSR network.

4.6. Change Detection Results

To verify the effectiveness and superiority of the proposed CD method, the results of eight typical areas are selected and presented in Figure 10. One can observe that many missed detections (red areas) and false alarms (yellow areas) arise in FC-EF method (Figure 10c). Rather than simply stacking bi-temporal images as the input, deep features of bi-temporal images are learned independently in FC-EF-conc method, which are subsequently concatenated for change information extraction. In such a way, explicit feature comparison and fusion are realized to facilitate change map generation, leading to reduced missed detections and false alarms (as shown in Figure 10d). Note that compared with FC-EF method, FC-EF-diff obtains even worse visual performance (as shown in Figure 10e). This is due to the reason that element-wise difference operation is conducted to fuse bitemporal deep features, which are however not accurately spatially aligned caused by registration errors. As a result, many uncertain areas arise in the difference maps, which greatly influences the change map generation. By including pyramid pooling module, the receptive field can be enlarged to capture more global information, which is beneficial for subsequent change information extraction. Therefore, FCN-PP obtains a superior visual performance against FC-EF, as shown in Figure 10f. Surprisingly, despite introducing attention modules and deep supervision strategy, IFN achieves worse performance than FC-Siam-conc method (as shown in Figure 10g). This may be attributed to the training instability caused by large network parameters and huge computational consumption during training (316.52 GMac vs. 56.03 GMac, as shown in Table 2). Similarly, SNUNet yields an inferior performance against FC-Siam-conc due to large computational complexity (187.26 GMac vs. 56.03 GMac, as shown in Table 2). Different from FC-Siam-diff, in BIT, deep features are refined by using semantic tokens before generating difference feature maps, which are more robust towards registration errors. Therefore, BIT obtains a much better visual performance, as shown in Figure 10i. Note that, compared with the other methods, our proposed RACDNet achieves the best visual performance with the least missed detections and false alarms, as presented in Figure 10j. This is due to the reasons that: (1) DCUs are adopted to align bitemporal deep features effectively, thereby generating highly reliable difference maps for subsequent change analysis; (2) atrous convolution units are used to enlarge the network receptive field, which facilitates to capture multi-scale and global information for effective feature representations; (3) attention units are employed during decoding stage, which aims to bridge the gap between encoder and decoder, thus generating robust fused features for change information extraction.
For the benefit of quantitative analysis, four metrics of F1, OA, Kappa and IoU are calculated and reported Table 2. In addition, the model parameters, computational complexity and training time are also reported for comprehensive comparisons and analysis. One can observe that, compared with FC-EF method, FC-Siam-conc achieves slightly better quantitative performance. However, the model parameters and computation overhead increase rapidly. On the contrary, the model parameters in FC-Siam-diff remains unchanged, while only the computation overhead increases slightly. Nevertheless, the four quantitative scores deteriorate significantly due to the influence of uncertain difference feature maps. By introducing pyramid pooling module, FCN-PP obtains a much better quantitative performance against FC-EF with moderate model parameters increase and slight computational complexity increase. Meanwhile, the BIT method obtains a similar performance increase by using transformer-based feature refinement. However, the computational complexity increase sharply (105.01 GMac vs. 26.90 GMac) due to the large computational consumption of transformer architectures. Note that IFN method observes a sharp model parameters increase and huge computational complexity (50.71 M vs. 3.84 M, 316.52 GMac vs. 26.90 GMac), which easily leads to unstable training. As a result, the training time increase sharply (23.95h vs. 4.26 h) and the four quantitative scores drop sharply. Differently, due to the introduction of dense connections, SNUNet observes moderate model parameters increase but large computational overhead increase (12.03 M vs. 3.84 M, 187.26 GMac vs. 26.90 GMac). That also leads to sharp increase of training time (22.50 h vs. 4.26 h) and large drop of the quantitative scores. By combining the advantages of DCUs, ACUs and AUs, our RACDNet obtains the highest metric scores against the compared methods. Compared with FC-EF, it observes an increase of 5.15% in F1, an increase of 1.69% in OA, an increase of 6.15% in Kappa, and an increase of 8.3% in IoU, respectively. In addition, although the parameters increase sharply (49.32M vs. 3.84M), the computational complexity increases only moderately (89.84 GMac vs. 26.90 GMac), which facilitates to efficient network training. We can observe that the training time of RACDNet is 16.67 h, which is much less than those of IFN and SNUNet. Therefore, our proposed RACDNet achieves a better balance between accuracy and efficiency.

5. Discussion

5.1. Ablation Study on the Proposed Super-Resolution Network

To facilitate detailed information recovery, a novel weighted reconstruction loss (WRL) is proposed by using three masks of flat areas, edge areas and corner areas. In addition, adversarial and perceptual loss (APL) are further introduced to improve visual perceptual quality. To verify the effectiveness of these modules, an ablation study is conducted and four evaluation metrics of PNSR, SSIM, LPIPS, and NIQE are calculated. As presented in Table 3, one can observe that, the baseline method of WDSR obtains the lowest quantitative scores. The four metrics can be improved to different degrees by including WRL module or APL module. Note that our proposed method, which introduces both WRL and APL modules, achieves the best quantitative performance against other methods. This demonstrates the effectiveness of different modules in improving SR performance.

5.2. Ablation Study on the Proposed CD Network

In our proposed Siamese–UNet-based CD network, three main modules are adopted, namely: (1) deformable convolution unit (ACU), which aims to align bitemporal deep features by using the learned offsets; (2) atrous convolution unit (ACU), which aims to enlarge the network receptive field and capture multi-scale information; and (3) attention unit (AU), which aims to bridge the semantic gap between the encoder and decoder, thereby generating robust feature representations. To verify the effectiveness of each module, we conduct an ablation study. Table 4 reports the quantitative performance based on the combinations of different modules, where Baseline denotes the network without using any of the three modules. We conclude that the Baseline method achieves the worst quantitative performance against the compared methods. By including either of the three modules, the four metric scores can be increased to different degrees. This demonstrates the effectiveness of each module in improving the CD performance. When employing two of the three modules, the metric scores can be further increased, which implies that the three different modules are complementary to each other. Note that, our proposed RACDNet, which combines all the three modules, obtains the best quantitative performance among the compared methods. Compared with the Baseline, it yields an increase of 8.66% in F1, an increase of 2.71% in OA, an increase of 10.24% in Kappa, and an increase of 13.55% in IoU, respectively. This demonstrates the effectiveness and superiority of our proposed method.

5.3. Effect of Super-Resolution on CD performance

The performance of super-resolution in crucial for reconstructing high-quality bitemporal images, which is a prerequisite for the following CD task. To verify the hypothesis, we carry out a comparative study based on different reconstructed images. To be specific, the low-resolution images from T 1 period are first super-resolved by using Bicubic, EDSR, WDSR, CTN and EWDSR methods, respectively. Then, based on the super-resolved images from T 1 period and high-resolution images from T 2 period, the proposed alignment-aware CD network is adopted to generate the change maps. Figure 11 presents the visual results of different methods. One can observe that, our proposed RACDNet outperforms the compared methods significantly with reduced missed detections and false alarms. This is due to the fact that more high-frequency information such as edges and structures can be recovered by our EWDSR network, thus enhancing the spatial structure difference between buildings and other ground objects. This is beneficial for the CD network to capture building changes while ignoring background noises. Table 5 reports the quantitative performance of CD results based on different super-resolution methods, which is consistent with the visual comparisons. Compared with Bicubic-CD method, different performance increases are observed by using EDSR-CD, WDSR-CD or CTN-CD, where the reconstruction quality can be improved though elaborately-designed deep SR networks. Note that due to effective recovery of high-frequency information, our proposed method obtains the highest scores on all the four metrics, with an increase of 3.75% in F1, an increase of 1.34% in OA, an increase of 4.56% in Kappa, and an increase of 6.12% in IoU, respectively.

6. Conclusions

Contemporary deep learning-based CD methods rely heavily on high-quality bitemporal images with identical resolutions and accurate geometric alignment, which are difficult to acquire in real-world scenarios. To address the issues, in this paper, we proposed a novel resolution- and alignment-aware network named RACDNet, which is trained in a two-stage manner. In the first stage, an enhanced WDSR network is proposed by introducing weighted reconstruction loss, adversarial loss and perceptual loss, which aims to better recovery detailed information as well as improving visual quality of SR results. In the second stage, a novel alignment-aware CD network is proposed based on a Siamese–UNet architecture. At the end of the encoder, atrous convolution units are used to enlarge the receptive field as well as capturing multi-scale information. To align bitemporal features effectively, DCUs are adopted by learning the offsets efficiently. Attention mechanism is further used in the decoding stage to bridge the semantic gap between the encoder and decoder. To verify the effectiveness of the proposed method, a novel multi-resolution CD dataset termed MRCDD is created. Extensive experimental results demonstrate the effectiveness and superiority of the proposed method, which outperforms the compared methods on both visual comparisons and quantitative metrics. In the future, more advanced image super-resolution and alignment methods will be investigated to further improve the accuracy and efficiency of the proposed method.

Author Contributions

Conceptualization, J.T. and D.P.; methodology, J.T.; software, D.P.; validation, J.T. and D.P.; formal analysis, H.G. and H.D.; investigation, J.T. and D.P.; resources, D.P.; writing—original draft preparation, J.T.; writing—review and editing, D.P. and H.G.; supervision, D.P. and H.D.; project administration, D.P.; funding acquisition, D.P. and H.G. All authors have read and agreed to the published version of the manuscript.

Funding

This work was funded by the National Natural Science Foundation of China (under grant numbers: 41801386, 41971414 and 41571350).

Data Availability Statement

The dataset will be open to public via https://github.com/daifeng2016/Multi-resolution-Change-Detection (accessed on 31 July 2022).

Acknowledgments

The authors sincerely appreciate the helpful comments and constructive suggestions given by the academic editors and reviewers.

Conflicts of Interest

The authors declare no conflict of interest.

Abbreviations

The following abbreviations are used in this manuscript:
CDChange detection
MRCDDMulti-resolution change detection dataset
RSRemote sensing
TCDTraditional change detection
DLCDDeep learning change detection
PCAPrincipal component analysis
MADMultivariate alteration detection
SFASlow feature analysis
PBCDPixel-based change detection
OBCDObject-based change detection
DNNDeep neural network
SVMSupport vector machine
DIDifference image
CNNConvolution neural network
FCFully connected
FCNFully convolutional network
CAChannel attention
SASpatial attention
CBAMConvolutional block attention modules
MRPEMMulti-receptive field position enhancement module
ECAMEnsemble channel attention module
BITBitemporal image transformer
MSCANetMulti-scale context aggregation network
MLPMulti-layer perception
DCUDeformable convolution unit
ACUAtrous convolution unit
AUAttention unit
SRSuper-resolution
LRLow-resolution
HRHigh-resolution
VDSRVery deep super-resolution
EDSREnhanced deep super-resolution
GANGenerative adversarial network
RSIRRemote sensing image registration
GCPGround control points
DCDeformable convolution
FC-EFFully convolutional-early fusion
FC-Siam-concFully convolutional Siamese-concatenation
FC-Siam-diff  Fully convolutional Siamese-difference
FCN-PPFully convolutional network with pyramid pooling
IFNImage fusion network
PNSRPeak signal to noise ratio
SSIMStructural similarity index
LPIPSLearned perceptual image patch similarity
NIQENatural image quality evaluator
LiDARLight Detection and Ranging
CTNContextual transformation network
SNUNetSiamese network and NestedUNet

References

  1. Ji, S.; Shen, Y.; Lu, M.; Zhang, Y. Building instance change detection from large-scale aerial images using convolutional neural networks and simulated samples. Remote Sens. 2019, 11, 1343. [Google Scholar] [CrossRef]
  2. Li, Y.; Martinis, S.; Plank, S.; Ludwig, R. An automatic change detection approach for rapid flood mapping in Sentinel-1 SAR data. Int. J. Appl. Earth Obs. Geoinf. 2018, 73, 123–135. [Google Scholar] [CrossRef]
  3. Luo, H.; Liu, C.; Wu, C.; Guo, X. Urban change detection based on Dempster–Shafer theory for multitemporal very high-resolution imagery. Remote Sens. 2018, 10, 980. [Google Scholar] [CrossRef]
  4. Roy, D.P.; Huang, H.; Boschetti, L.; Giglio, L.; Yan, L.; Zhang, H.H.; Li, Z. Landsat-8 and Sentinel-2 burned area mapping—A combined sensor multi-temporal change detection approach. Remote Sens. Environ. 2019, 231, 111254. [Google Scholar] [CrossRef]
  5. Anniballe, R.; Noto, F.; Scalia, T.; Bignami, C.; Stramondo, S.; Chini, M.; Pierdicca, N. Earthquake damage mapping: An overall assessment of ground surveys and VHR image change detection after L’Aquila 2009 earthquake. Remote Sens. Environ. 2018, 210, 166–178. [Google Scholar] [CrossRef]
  6. Hussain, M.; Chen, D.; Cheng, A.; Wei, H.; Stanley, D. Change detection from remotely sensed images: From pixel-based to object-based approaches. ISPRS J. Photogramm. Remote Sens. 2013, 80, 91–106. [Google Scholar] [CrossRef]
  7. Tewkesbury, A.P.; Comber, A.J.; Tate, N.J.; Lamb, A.; Fisher, P.F. A critical synthesis of remotely sensed optical image change detection techniques. Remote Sens. Environ. 2015, 160, 1–14. [Google Scholar] [CrossRef]
  8. Shi, W.; Zhang, M.; Zhang, R.; Chen, S.; Zhan, Z. Change detection based on artificial intelligence: State-of-the-art and challenges. Remote Sens. 2020, 12, 1688. [Google Scholar] [CrossRef]
  9. Deng, J.; Wang, K.; Deng, Y.; Qi, G. PCA-based land-use change detection and analysis using multitemporal and multisensor satellite data. Int. J. Remote Sens. 2008, 29, 4823–4838. [Google Scholar] [CrossRef]
  10. Marpu, P.R.; Gamba, P.; Canty, M.J. Improving change detection results of IR-MAD by eliminating strong changes. IEEE Geosci. Remote Sens. Lett. 2011, 8, 799–803. [Google Scholar] [CrossRef]
  11. Wu, C.; Zhang, L.; Du, B. Kernel slow feature analysis for scene change detection. IEEE Trans. Geosci. Remote Sens. 2017, 55, 2367–2384. [Google Scholar] [CrossRef]
  12. Celik, T. Unsupervised change detection in satellite images using principal component analysis and k-means clustering. IEEE Geosci. Remote Sens. Lett. 2009, 6, 772–776. [Google Scholar] [CrossRef]
  13. Benedek, C.; Szirányi, T. Change detection in optical aerial images by a multilayer conditional mixed Markov model. IEEE Trans. Geosci. Remote Sens. 2009, 47, 3416–3430. [Google Scholar] [CrossRef]
  14. Lv, P.; Zhong, Y.; Zhao, J.; Zhang, L. Unsupervised change detection based on hybrid conditional random field model for high spatial resolution remote sensing imagery. IEEE Trans. Geosci. Remote Sens. 2018, 56, 4002–4015. [Google Scholar] [CrossRef]
  15. Wan, L.; Xiang, Y.; You, H. An object-based hierarchical compound classification method for change detection in heterogeneous optical and SAR images. IEEE Trans. Geosci. Remote Sens. 2019, 57, 9941–9959. [Google Scholar] [CrossRef]
  16. Wang, X.; Liu, S.; Du, P.; Liang, H.; Xia, J.; Li, Y. Object-based change detection in urban areas from high spatial resolution images based on multiple features and ensemble learning. Remote Sens. 2018, 10, 276. [Google Scholar] [CrossRef]
  17. Leichtle, T.; Geiß, C.; Wurm, M.; Lakes, T.; Taubenböck, H. Unsupervised change detection in VHR remote sensing imagery—An object-based clustering approach in a dynamic urban environment. Int. J. Appl. Earth Obs. Geoinf. 2017, 54, 15–27. [Google Scholar] [CrossRef]
  18. Lu, J.; Li, J.; Chen, G.; Zhao, L.; Xiong, B.; Kuang, G. Improving pixel-based change detection accuracy using an object-based approach in multitemporal SAR flood images. IEEE J. Sel. Top. Appl. Earth Obs. Remote Sens. 2015, 8, 3486–3496. [Google Scholar] [CrossRef]
  19. Pan, J.; Li, X.; Cai, Z.; Sun, B.; Cui, W. A Self-Attentive Hybrid Coding Network for 3D Change Detection in High-Resolution Optical Stereo Images. Remote Sens. 2022, 14, 2046. [Google Scholar] [CrossRef]
  20. Cao, S.; Du, M.; Zhao, W.; Hu, Y.; Mo, Y.; Chen, S.; Cai, Y.; Peng, Z.; Zhang, C. Multi-level monitoring of three-dimensional building changes for megacities: Trajectory, morphology, and landscape. ISPRS J. Photogramm. Remote Sens. 2020, 167, 54–70. [Google Scholar] [CrossRef]
  21. Zhu, X.X.; Tuia, D.; Mou, L.; Xia, G.S.; Zhang, L.; Xu, F.; Fraundorfer, F. Deep learning in remote sensing: A comprehensive review and list of resources. IEEE Geosci. Remote Sens. Mag. 2017, 5, 8–36. [Google Scholar] [CrossRef]
  22. Zhang, L.; Zhang, L.; Du, B. Deep learning for remote sensing data: A technical tutorial on the state of the art. IEEE Geosci. Remote Sens. Mag. 2016, 4, 22–40. [Google Scholar] [CrossRef]
  23. Ma, L.; Liu, Y.; Zhang, X.; Ye, Y.; Yin, G.; Johnson, B.A. Deep learning in remote sensing applications: A meta-analysis and review. ISPRS J. Photogramm. Remote Sens. 2019, 152, 166–177. [Google Scholar] [CrossRef]
  24. Hou, B.; Wang, Y.; Liu, Q. Change detection based on deep features and low rank. IEEE Geosci. Remote Sens. Lett. 2017, 14, 2418–2422. [Google Scholar] [CrossRef]
  25. Zhang, H.; Gong, M.; Zhang, P.; Su, L.; Shi, J. Feature-level change detection using deep representation and feature change analysis for multispectral imagery. IEEE Geosci. Remote Sens. Lett. 2016, 13, 1666–1670. [Google Scholar] [CrossRef]
  26. Zhan, Y.; Fu, K.; Yan, M.; Sun, X.; Wang, H.; Qiu, X. Change detection based on deep siamese convolutional network for optical aerial images. IEEE Geosci. Remote Sens. Lett. 2017, 14, 1845–1849. [Google Scholar] [CrossRef]
  27. Zhang, M.; Xu, G.; Chen, K.; Yan, M.; Sun, X. Triplet-based semantic relation learning for aerial remote sensing image change detection. IEEE Geosci. Remote Sens. Lett. 2018, 16, 266–270. [Google Scholar] [CrossRef]
  28. Daudt, R.C.; Le Saux, B.; Boulch, A.; Gousseau, Y. Urban change detection for multispectral earth observation using convolutional neural networks. In Proceedings of the IGARSS 2018-2018 IEEE International Geoscience and Remote Sensing Symposium, Valencia, Spain, 22–27 July 2018; pp. 2115–2118. [Google Scholar]
  29. Wang, Q.; Yuan, Z.; Du, Q.; Li, X. GETNET: A general end-to-end 2-D CNN framework for hyperspectral image change detection. IEEE Trans. Geosci. Remote Sens. 2018, 57, 3–13. [Google Scholar] [CrossRef]
  30. Alcantarilla, P.F.; Stent, S.; Ros, G.; Arroyo, R.; Gherardi, R. Street-view change detection with deconvolutional networks. Auton. Robot. 2018, 42, 1301–1322. [Google Scholar] [CrossRef]
  31. Sun, Y.; Zhang, X.; Huang, J.; Wang, H.; Xin, Q. Fine-grained building change detection from very high-spatial-resolution remote sensing images based on deep multitask learning. IEEE Geosci. Remote Sens. Lett. 2020, 19, 8000605. [Google Scholar] [CrossRef]
  32. Lei, T.; Zhang, Y.; Lv, Z.; Li, S.; Liu, S.; Nandi, A.K. Landslide inventory mapping from bitemporal images using deep convolutional neural networks. IEEE Geosci. Remote Sens. Lett. 2019, 16, 982–986. [Google Scholar] [CrossRef]
  33. Lv, Z.; Huang, H.; Gao, L.; Benediktsson, J.A.; Zhao, M.; Shi, C. Simple Multiscale UNet for Change Detection with Heterogeneous Remote Sensing Images. IEEE Geosci. Remote Sens. Lett. 2022, 19, 2504905. [Google Scholar] [CrossRef]
  34. Li, L.; Wang, C.; Zhang, H.; Zhang, B. Residual UNet for urban building change detection with Sentinel-1 SAR data. In Proceedings of the IGARSS 2019-2019 IEEE International Geoscience and Remote Sensing Symposium, Yokohama, Japan, 28 July–2 August 2019; pp. 1498–1501. [Google Scholar]
  35. Papadomanolaki, M.; Vakalopoulou, M.; Karantzalos, K. A deep multitask learning framework coupling semantic segmentation and fully convolutional LSTM networks for urban change detection. IEEE Trans. Geosci. Remote Sens. 2021, 59, 7651–7668. [Google Scholar] [CrossRef]
  36. Song, L.; Xia, M.; Jin, J.; Qian, M.; Zhang, Y. SUACDNet: Attentional change detection network based on siamese U-shaped structure. Int. J. Appl. Earth Obs. Geoinf. 2021, 105, 102597. [Google Scholar] [CrossRef]
  37. Shao, R.; Du, C.; Chen, H.; Li, J. SUNet: Change Detection for Heterogeneous Remote Sensing Images from Satellite and UAV Using a Dual-Channel Fully Convolution Network. Remote Sens. 2021, 13, 3750. [Google Scholar] [CrossRef]
  38. Peng, D.; Zhang, Y.; Guan, H. End-to-end change detection for high resolution satellite images using improved UNet++. Remote Sens. 2019, 11, 1382. [Google Scholar] [CrossRef]
  39. Peng, X.; Zhong, R.; Li, Z.; Li, Q. Optical remote sensing image change detection based on attention mechanism and image difference. IEEE Trans. Geosci. Remote Sens. 2020, 59, 7296–7307. [Google Scholar] [CrossRef]
  40. Zhang, X.; Yue, Y.; Gao, W.; Yun, S.; Su, Q.; Yin, H.; Zhang, Y. DifUnet++: A satellite images change detection network based on UNet++ and differential pyramid. IEEE Geosci. Remote Sens. Lett. 2021, 19, 8006605. [Google Scholar] [CrossRef]
  41. Raza, A.; Huo, H.; Fang, T. EUNet-CD: Efficient UNet++ for change detection of very high-resolution remote sensing images. IEEE Geosci. Remote Sens. Lett. 2022, 19, 3510805. [Google Scholar] [CrossRef]
  42. Li, H.; Zhu, F.; Zheng, X.; Liu, M.; Chen, G. MSCDUNet: A Deep Learning Framework for Built-Up Area Change Detection Integrating Multispectral, SAR and VHR Data. IEEE J. Sel. Top. Appl. Earth Obs. Remote Sens. 2022, 15, 5163–5176. [Google Scholar] [CrossRef]
  43. Fang, S.; Li, K.; Shao, J.; Li, Z. SNUNet-CD: A densely connected Siamese network for change detection of VHR images. IEEE Geosci. Remote Sens. Lett. 2021, 19, 8007805. [Google Scholar] [CrossRef]
  44. Xiang, X.; Tian, D.; Lv, N.; Yan, Q. FCDNet: A Change Detection Network Based on Full-scale Skip Connections and Coordinate Attention. IEEE Geosci. Remote Sens. Lett. 2022, 19, 6511605. [Google Scholar] [CrossRef]
  45. Wang, Y.; Gao, L.; Hong, D.; Sha, J.; Liu, L.; Zhang, B.; Rong, X.; Zhang, Y. Mask DeepLab: End-to-end image segmentation for change detection in high-resolution remote sensing images. Int. J. Appl. Earth Obs. Geoinf. 2021, 104, 102582. [Google Scholar] [CrossRef]
  46. Venugopal, N. Automatic semantic segmentation with DeepLab dilated learning network for change detection in remote sensing images. Neural Process. Lett. 2020, 51, 2355–2377. [Google Scholar] [CrossRef]
  47. Hou, X.; Bai, Y.; Li, Y.; Shang, C.; Shen, Q. High-resolution triplet network with dynamic multiscale feature for change detection on satellite images. ISPRS J. Photogramm. Remote Sens. 2021, 177, 103–115. [Google Scholar] [CrossRef]
  48. Dong, J.; Zhao, W.; Wang, S. Multiscale context aggregation network for building change detection using high resolution remote sensing images. IEEE Geosci. Remote Sens. Lett. 2021, 19, 8022605. [Google Scholar] [CrossRef]
  49. Pan, F.; Wu, Z.; Jia, X.; Liu, Q.; Xu, Y.; Wei, Z. A Temporal-Reliable Method for Change Detection in High-Resolution Bi-Temporal Remote Sensing Images. Remote Sens. 2022, 14, 3100. [Google Scholar] [CrossRef]
  50. Cheng, G.; Wang, G.; Han, J. ISNet: Towards Improving Separability for Remote Sensing Image Change Detection. IEEE Trans. Geosci. Remote Sens. 2022, 60, 5623811. [Google Scholar] [CrossRef]
  51. Pan, J.; Cui, W.; An, X.; Huang, X.; Zhang, H.; Zhang, S.; Zhang, R.; Li, X.; Cheng, W.; Hu, Y. MapsNet: Multi-level feature constraint and fusion network for change detection. Int. J. Appl. Earth Obs. Geoinf. 2022, 108, 102676. [Google Scholar] [CrossRef]
  52. Chen, T.; Lu, Z.; Yang, Y.; Zhang, Y.; Du, B.; Plaza, A. A Siamese Network Based U-Net for Change Detection in High Resolution Remote Sensing Images. IEEE J. Sel. Top. Appl. Earth Obs. Remote Sens. 2022, 15, 2357–2369. [Google Scholar] [CrossRef]
  53. Chen, H.; Shi, Z. A spatial–temporal attention-based method and a new dataset for remote sensing image change detection. Remote Sens. 2020, 12, 1662. [Google Scholar] [CrossRef]
  54. Shi, Q.; Liu, M.; Li, S.; Liu, X.; Wang, F.; Zhang, L. A deeply supervised attention metric-based network and an open aerial image dataset for remote sensing change detection. IEEE Trans. Geosci. Remote Sens. 2021, 60, 5604816. [Google Scholar] [CrossRef]
  55. Zheng, H.; Gong, M.; Liu, T.; Jiang, F.; Zhan, T.; Lu, D.; Zhang, M. HFA-Net: High frequency attention siamese network for building change detection in VHR remote sensing images. Pattern Recognit. 2022, 129, 108717. [Google Scholar] [CrossRef]
  56. Ding, Q.; Shao, Z.; Huang, X.; Altan, O. DSA-Net: A novel deeply supervised attention-guided network for building change detection in high-resolution remote sensing images. Int. J. Appl. Earth Obs. Geoinf. 2021, 105, 102591. [Google Scholar] [CrossRef]
  57. Chen, H.; Qi, Z.; Shi, Z. Remote sensing image change detection with transformers. IEEE Trans. Geosci. Remote Sens. 2021, 60, 5607514. [Google Scholar] [CrossRef]
  58. Ke, Q.; Zhang, P. Hybrid-TransCD: A Hybrid Transformer Remote Sensing Image Change Detection Network via Token Aggregation. ISPRS Int. J. Geo-Inf. 2022, 11, 263. [Google Scholar] [CrossRef]
  59. Liu, M.; Chai, Z.; Deng, H.; Liu, R. A CNN-transformer Network with Multi-scale Context Aggregation for Fine-grained Cropland Change Detection. IEEE J. Sel. Top. Appl. Earth Obs. Remote Sens. 2022, 15, 4297–4306. [Google Scholar] [CrossRef]
  60. Song, F.; Zhang, S.; Lei, T.; Song, Y.; Peng, Z. MSTDSNet-CD: Multiscale Swin Transformer and Deeply Supervised Network for Change Detection of the Fast-Growing Urban Regions. IEEE Geosci. Remote Sens. Lett. 2022, 19, 5607514. [Google Scholar] [CrossRef]
  61. Bandara, W.G.C.; Patel, V.M. A transformer-based siamese network for change detection. arXiv 2022, arXiv:2201.01293. [Google Scholar]
  62. Zhang, C.; Wang, L.; Cheng, S.; Li, Y. SwinSUNet: Pure Transformer Network for Remote Sensing Image Change Detection. IEEE Trans. Geosci. Remote Sens. 2022, 60, 5224713. [Google Scholar] [CrossRef]
  63. Wang, P.; Wang, L.; Leung, H.; Zhang, G. Super-resolution mapping based on spatial–spectral correlation for spectral imagery. IEEE Trans. Geosci. Remote Sens. 2020, 59, 2256–2268. [Google Scholar] [CrossRef]
  64. Wang, P.; Bayram, B.; Sertel, E. A comprehensive review on deep learning based remote sensing image super-resolution methods. Earth-Sci. Rev. 2022, 232, 104110. [Google Scholar] [CrossRef]
  65. Irani, M.; Peleg, S. Improving resolution by image registration. CVGIP Graph. Model. Image Process. 1991, 53, 231–239. [Google Scholar] [CrossRef]
  66. Yang, J.; Wright, J.; Huang, T.S.; Ma, Y. Image super-resolution via sparse representation. IEEE Trans. Image Process. 2010, 19, 2861–2873. [Google Scholar] [CrossRef]
  67. Timofte, R.; De Smet, V.; Van Gool, L. Anchored neighborhood regression for fast example-based super-resolution. In Proceedings of the IEEE International Conference on Computer Vision, Sydney, Australia, 1–8 December 2013; pp. 1920–1927. [Google Scholar]
  68. Dong, C.; Loy, C.C.; He, K.; Tang, X. Image super-resolution using deep convolutional networks. IEEE Trans. Pattern Anal. Mach. Intell. 2015, 38, 295–307. [Google Scholar] [CrossRef] [PubMed]
  69. Kim, J.; Lee, J.K.; Lee, K.M. Accurate image super-resolution using very deep convolutional networks. In Proceedings of the IEEE Conference on Computer Vision and Pattern Recognition, Las Vegas, NV, USA, 27–30 June 2016; pp. 1646–1654. [Google Scholar]
  70. Lim, B.; Son, S.; Kim, H.; Nah, S.; Mu Lee, K. Enhanced deep residual networks for single image super-resolution. In Proceedings of the IEEE Conference on Computer Vision and Pattern Recognition Workshops, Honolulu, HI, USA, 21–26 July 2017; pp. 136–144. [Google Scholar]
  71. Yu, J.; Fan, Y.; Yang, J.; Xu, N.; Wang, Z.; Wang, X.; Huang, T. Wide activation for efficient and accurate image super-resolution. arXiv 2018, arXiv:1808.08718. [Google Scholar]
  72. Ledig, C.; Theis, L.; Huszár, F.; Caballero, J.; Cunningham, A.; Acosta, A.; Aitken, A.; Tejani, A.; Totz, J.; Wang, Z.; et al. Photo-realistic single image super-resolution using a generative adversarial network. In Proceedings of the IEEE Conference on Computer Vision and Pattern Recognition, Honolulu, HI, USA, 21–26 July 2017; pp. 4681–4690. [Google Scholar]
  73. Liu, M.; Shi, Q.; Marinoni, A.; He, D.; Liu, X.; Zhang, L. Super-resolution-based change detection network with stacked attention module for images with different resolutions. IEEE Trans. Geosci. Remote Sens. 2021, 60, 4403718. [Google Scholar] [CrossRef]
  74. Karami, E.; Prasad, S.; Shehata, M. Image matching using SIFT, SURF, BRIEF and ORB: Performance comparison for distorted images. arXiv 2017, arXiv:1710.02726. [Google Scholar]
  75. Li, J.; Hu, Q.; Ai, M. RIFT: Multi-modal image matching based on radiation-variation insensitive feature transform. IEEE Trans. Image Process. 2019, 29, 3296–3310. [Google Scholar] [CrossRef]
  76. Ye, X.; Ma, J.; Xiong, H. Local Affine Preservation With Motion Consistency for Feature Matching of Remote Sensing Images. IEEE Trans. Geosci. Remote Sens. 2021, 60, 5613912. [Google Scholar] [CrossRef]
  77. Ma, J.; Li, Z.; Zhang, K.; Shao, Z.; Xiao, G. Robust feature matching via neighborhood manifold representation consensus. ISPRS J. Photogramm. Remote Sens. 2022, 183, 196–209. [Google Scholar] [CrossRef]
  78. Li, Z.; Yue, J.; Fang, L. Adaptive Regional Multiple Features for Large-Scale High-Resolution Remote Sensing Image Registration. IEEE Trans. Geosci. Remote Sens. 2022, 60, 5617313. [Google Scholar] [CrossRef]
  79. Zhu, J.Y.; Park, T.; Isola, P.; Efros, A.A. Unpaired image-to-image translation using cycle-consistent adversarial networks. In Proceedings of the IEEE International Conference on Computer Vision, Venice, Italy, 22–29 October 2017; pp. 2223–2232. [Google Scholar]
  80. Dai, J.; Qi, H.; Xiong, Y.; Li, Y.; Zhang, G.; Hu, H.; Wei, Y. Deformable convolutional networks. In Proceedings of the IEEE International Conference on Computer Vision, Venice, Italy, 22–29 October 2017; pp. 764–773. [Google Scholar]
  81. Dong, R.; Zhang, L.; Fu, H. RRSGAN: Reference-based super-resolution for remote sensing image. IEEE Trans. Geosci. Remote Sens. 2021, 60, 5601117. [Google Scholar] [CrossRef]
  82. Zhang, C.; Yue, P.; Tapete, D.; Jiang, L.; Shangguan, B.; Huang, L.; Liu, G. A deeply supervised image fusion network for change detection in high resolution bi-temporal remote sensing images. ISPRS J. Photogramm. Remote Sens. 2020, 166, 183–200. [Google Scholar] [CrossRef]
  83. Mittal, A.; Soundararajan, R.; Bovik, A.C. Making a “completely blind” image quality analyzer. IEEE Signal Process. Lett. 2012, 20, 209–212. [Google Scholar] [CrossRef]
  84. Wang, S.; Zhou, T.; Lu, Y.; Di, H. Contextual Transformation Network for Lightweight Remote-Sensing Image Super-Resolution. IEEE Trans. Geosci. Remote Sens. 2021, 60, 5615313. [Google Scholar] [CrossRef]
Figure 1. Overview of the proposed RACDNet.
Remotesensing 14 04527 g001
Figure 2. Architecture of the enchanced WDSR network.
Remotesensing 14 04527 g002
Figure 3. Architecture of the discriminator network.
Remotesensing 14 04527 g003
Figure 4. Architecture of the alignment-aware CD network.
Remotesensing 14 04527 g004
Figure 5. Architecture of the residual convolution (ResConv) unit.
Remotesensing 14 04527 g005
Figure 6. Architecture of the deformable convolution unit (DCU).
Remotesensing 14 04527 g006
Figure 7. Architecture of the attention unit (AU).
Remotesensing 14 04527 g007
Figure 8. Example images of the MRCDD.
Remotesensing 14 04527 g008
Figure 9. Visual comparisons of super-resolution results for different methods. (a) LR. (b) Bicubic. (c) EDSR. (d) WDSR. (e) CTN. (f) Proposed EDWSR. (g) HR.
Remotesensing 14 04527 g009
Figure 10. Visual comparisons of CD results for different methods. (a) Super-resolved Image T1. (b) Image T2. (c) FC-EF. (d) FC-Siam-conc. (e) FC-Siam-diff. (f) FCN-PP. (g) IFN. (h) SNUNet. (i) BIT. (j) RACDNet. (k) GT.
Remotesensing 14 04527 g010
Figure 11. Visual performance of CD results based on different super-resolution methods. (a) Image T1 (LR, resized to the size of the HR). (b) Image T2 (HR). (c) Bicubic-CD. (d) EDSR-CD. (e) WDSR-CD. (f) CTN-CD. (g) Proposed RACDNet. (h) GT.
Remotesensing 14 04527 g011
Table 1. Quantitative performance of different super-resolution methods. The best values are in bold.
MethodsPNSR ↑SSIM ↑LPIPS ↓NIQE ↓
Bicubic28.16350.74420.47277.4005
EDSR28.98060.76710.40956.7203
WDSR29.23910.77500.38366.6220
CTN29.90730.75590.44077.2786
Proposed EWDSR31.37290.80840.22055.5828
Table 2. Quantitative comparisons of different CD methods. The best values are in bold.
MethodsF1 (%)OA (%)Kappa (%)IoU (%)Params (M)FLOPs (G)Time (h)
FC-EF86.0395.1083.0775.493.8426.904.26
FC-Siam-conc86.6295.3583.8276.4010.1256.037.63
FC-Siam-diff67.0490.5461.9950.423.8331.815.57
FCN-PP88.1095.7685.5278.7412.7535.765.34
IFN79.4993.3975.6465.9750.71316.5223.95
SNUNet82.9093.8779.1770.7912.03187.2622.50
BIT88.0695.4585.2578.6711.99105.019.81
Proposed RACDNet91.1896.7989.2283.7949.3289.8416.67
Table 3. Ablation study on the proposed super-resolution network. The best values are in bold.
MethodsPNSR ↑SSIM ↑LPIPS ↓NIQE ↓
WDSR29.23910.77500.38366.6220
WDSR+WL29.81590.75080.35896.1929
WDSR+APL30.16250.81300.29256.4854
WDSR+WL+APL31.37290.80840.22055.5828
Table 4. Ablation study on the proposed CD network. The best values are in bold.
MethodsF1 (%)OA (%)Kappa (%)IoU (%)
Baseline82.5294.0878.9870.24
Baseline+AU85.0394.5181.6773.96
Baseline+ACU85.1994.8882.1174.21
Baseline+DCU88.3895.8085.8279.18
Baseline+ACU+AU88.5195.9386.0379.38
Baseline+DCU+AU89.7996.2887.5281.47
Baseline+DCU+ACU90.3896.5288.2682.45
Proposed91.1896.7989.2283.79
Table 5. Quantitative performance of CD results based on different super-resolution methods. The best values are in bold.
MethodsF1 (%)OA (%)Kappa (%)IoU (%)
Bicubic-CD87.4395.4584.6677.67
EDSR-CD88.0495.6785.4078.63
WDSR-CD89.3596.1586.9980.74
CTN-CD87.6895.6085.0078.06
Proposed RACDNet91.1896.7989.2283.79
Publisher’s Note: MDPI stays neutral with regard to jurisdictional claims in published maps and institutional affiliations.

