Technical Note

Implementation of a Rainfall Normalization Module for GSMaP Microwave Imagers and Sounders

by
Munehisa K. Yamamoto
* and
Takuji Kubota
Earth Observation Research Center, Japan Aerospace Exploration Agency, Tsukuba 305-8505, Japan
*
Author to whom correspondence should be addressed.
Remote Sens. 2022, 14(18), 4445; https://doi.org/10.3390/rs14184445
Submission received: 29 July 2022 / Revised: 29 August 2022 / Accepted: 1 September 2022 / Published: 6 September 2022
(This article belongs to the Special Issue Remote Sensing for Precipitation Retrievals)

Abstract

:
This paper introduces the Method of Microwave Rainfall Normalization (MMN) for the Global Satellite Mapping of Precipitation (GSMaP) algorithm in its latest version (V05, algorithm version 8), released in December 2021. The method aims to mitigate the discrepancy of GSMaP rainfall estimates among passive microwave (PMW) imagers/sounders (MWIs/MWSs) due to differences in sensor specifications and retrieval algorithms. The basic idea of the MMN module is to calibrate target PMW sensors with reference sensors (the Global Precipitation Measurement (GPM) Microwave Imager (GMI) and the Tropical Rainfall Measuring Mission (TRMM) Microwave Imager (TMI)) using the cumulative distribution function (CDF) of the rain rate. Differences between the CDF and normalization table for MWSs are greater than MWIs due to different rain retrieval algorithms. More (less) MWS rainfall is detected over the ocean (land) than GMI rainfall. Matchup rainfall data between GMI and a target PMW sensor are compared to evaluate MMN performance. The monthly mean rainfall and mean bias error were improved for almost all PMW sensors. This study leaves open the possibility for further inter-calibration and improvement of rain detection and heavy rainfall retrievals.

1. Introduction

The Global Precipitation Measurement (GPM) mission aims to make highly accurate frequent global precipitation observations using the GPM core observatory and constellation satellites carrying passive microwave (PMW) imagers/sounders (MWIs/MWSs) [1,2]. The PMW rain retrieval algorithms were developed in Japan [3,4,5]. The Global Satellite Mapping of Precipitation (GSMaP) data were provided by the Japan Aerospace Exploration Agency (JAXA) as the Japanese GPM Product [4].
Multi-satellite precipitation products such as the GSMaP Climate Prediction Center morphing method (CMORPH, and Integrated Multi-Satellite Retrievals for GPM (IMERG) have been evaluated with rain gauges globally and in specific regions (e.g., [6,7]). Furthermore, different specifications of the instruments (e.g., onboard bands, frequencies, and fields of view) and different precipitation estimation algorithms can cause inconsistent precipitation estimates for each satellite sensor [7]. Even MWIs’ constellations with similar microwave channels do not have identical characteristics (e.g., [8]). For CMORPH, for example, rainfall estimates derived from the Tropical Rainfall Measuring Mission (TRMM) Microwave Imager (TMI) and the Special Sensor of Microwave Imager (SSM/I) are in good agreement despite the large differences in retrieval footprint resolutions caused by different orbit altitudes. In contrast, rainfall data provided by the Advanced Microwave Sounding Unit (AMSU) algorithm differs from MWI rainfall estimates for the ocean [9]. Joyce et al. [9] mentioned that the MWI instruments are equipped with channels that detect both emission and scattering signatures. In contrast, the MWS can detect only scattering signals using high-frequency channels, which can lead to biased estimates.
Because of the discrepancy among PMW rain estimates, some PMW precipitation correction methods have been proposed. CMORPH applies a normalization procedure [9,10,11]. Using the rain rate probability distribution function (PDF), they mitigated the systematic differences between PMW and TMI estimates using collocated data pairs observed within 30 min intervals over 10-day periods. The TRMM Mutisatellite Precipitation Analysis (TMPA) [12] and IMERG apply quantile–quantile matching [13,14] to microwave inter-calibration [15]. Tan et al. [16] evaluated the rainfall estimates from the five PMW sensors retrieved by the IMERG PMW algorithm. They concluded that the error for AMSR has a systematic high bias related to the calibration issue, and that there is a systematic bias for rainfall intensity for TMI, SSMIS, and MHS due to the low resolution. The same issue has been recognized for GSMaP estimates [17]. However, it is difficult to reduce such differences by a conventional algorithm, and implementation of a rainfall normalization method is expected.
This study aims to reduce the discrepancies in rainfall estimates by GSMaP MWIs and MWSs. The study developed a Method of Microwave Rainfall Normalization (MMN) for the GSMaP [17], implemented in the latest version (V05, algorithm version 8, released on 1 December 2021). The data used in this study and overviews of the MMN module are described in Section 2. Section 3 presents the differences in rainfall characteristics among the MWI/MWS sensors in GSMaP, and the evaluation of the MMN module is presented in Section 4. Section 5 provides our concluding remarks.

2. Method

2.1. Data

This study used averaged global gridded data (Level 3, or “L3”) of the final test version of GSMaP V05 for specific PMW sensors (i.e., unmerged L3 data) during April–October 2014. The available sensors are summarized in Table A1. The basic specifications of the PMW sensor are shown in Table 1. The GSMaP precipitation retrieval algorithm is different in the grouped PMW sensors. Compared to GMI, TMI, AMSR, and SSM/I do not have high-frequency channels over 100 GHz. This leads to a lack of snow retrievals in low-temperature regions. SSM/I and SSMIS do not have a 10 GHz channel, which is weak for heavy rainfall over the ocean. The scanning method and onboard sensor for AMSU and MHS differ from MWIs, so the GSMaP precipitation retrieval algorithm is much different due to the lack of emission signals, particularly over the ocean.

2.2. MMN Algorithm

This section describes the algorithm of the MMN module for GSMaP V05. The MMN module is inserted between the gridding and PMW merging processes after the PMW retrieval in the GSMaP core algorithm (see Figure 20.2 in [18] for the overall process flowchart). Figure 1 shows the details of the MMN flowchart. The steps of the MMN module are as follows:
  • The number of occurrences of each sensor for each surface type (ocean, land, and coast), each month (or the last 30 days), every 5° of latitude, and each 0.01 mm h−1 of rainfall intensity is accumulated from the PMW L3 hourly rainfall intensity. The rainfall intensity data under the orographic rainfall condition [19] are excluded because the differences between the look-up table for rain retrieval and the PMW algorithm cause a gap in rain estimates between orographic and non-orographic conditions and distort the correction table.
  • The cumulative distribution function (CDF, the same as the percentile value) of rain intensity for each sensor (Ri, i denotes a given sensor) is calculated (hereafter, CDF at a given rainfall intensity and rainfall intensity at a given CDF denote CDF[Ri] and Ri[CDFi], respectively). Samples above the 99th percentile are not used to create the correction table; this excludes incorrect samples due to abnormal termination or malfunctions (e.g., upper limit). The correction table between the rainfall intensity at 99th percentile to 300 mm h−1 is linearly interpolated to reduce unstable conditions for heavy rainfall.
  • A correction table (Tc) is created to replace the original rainfall intensity of each target sensor (Rt) with the rainfall intensity of the reference sensor (Rr) corresponding to the same CDF value, and to multiply the rainfall intensity of the target sensor by the ratio of each month (or the last 30 days) for the accumulated rainfall of the target (At) and reference sensors (Ar). Tc for a given Rt is defined as follows:
    T c R t = R r C D F t R t × A r / A t
  • The PMW L3 rainfall intensity is corrected using the correction table, except for the AMSR series (GW1_AM2 in this study), whose frequency and algorithm are close to COR_GMI. The oceanic table is used for the coastal region because of the small number of samples. Aside from this, the CDF, including non-rain samples, is also calculated. If the percentile at the lowest raining bin for the target MWI/MWS is lower than the reference value, the normalized rainfall becomes no-rain. For the polar side (above 60° of latitude), the correction table at 60° latitude is extrapolated considering the observation areas by the GPM Core Observatory with an inclination of 65°. For the standard version after the launch of the GPM Core Observatory, the reference sensor is COR_GMI. For the reanalysis version before the launch, TRM_TMI is used as a reference.

3. Result

3.1. Differences in CDF among PMW Sensors

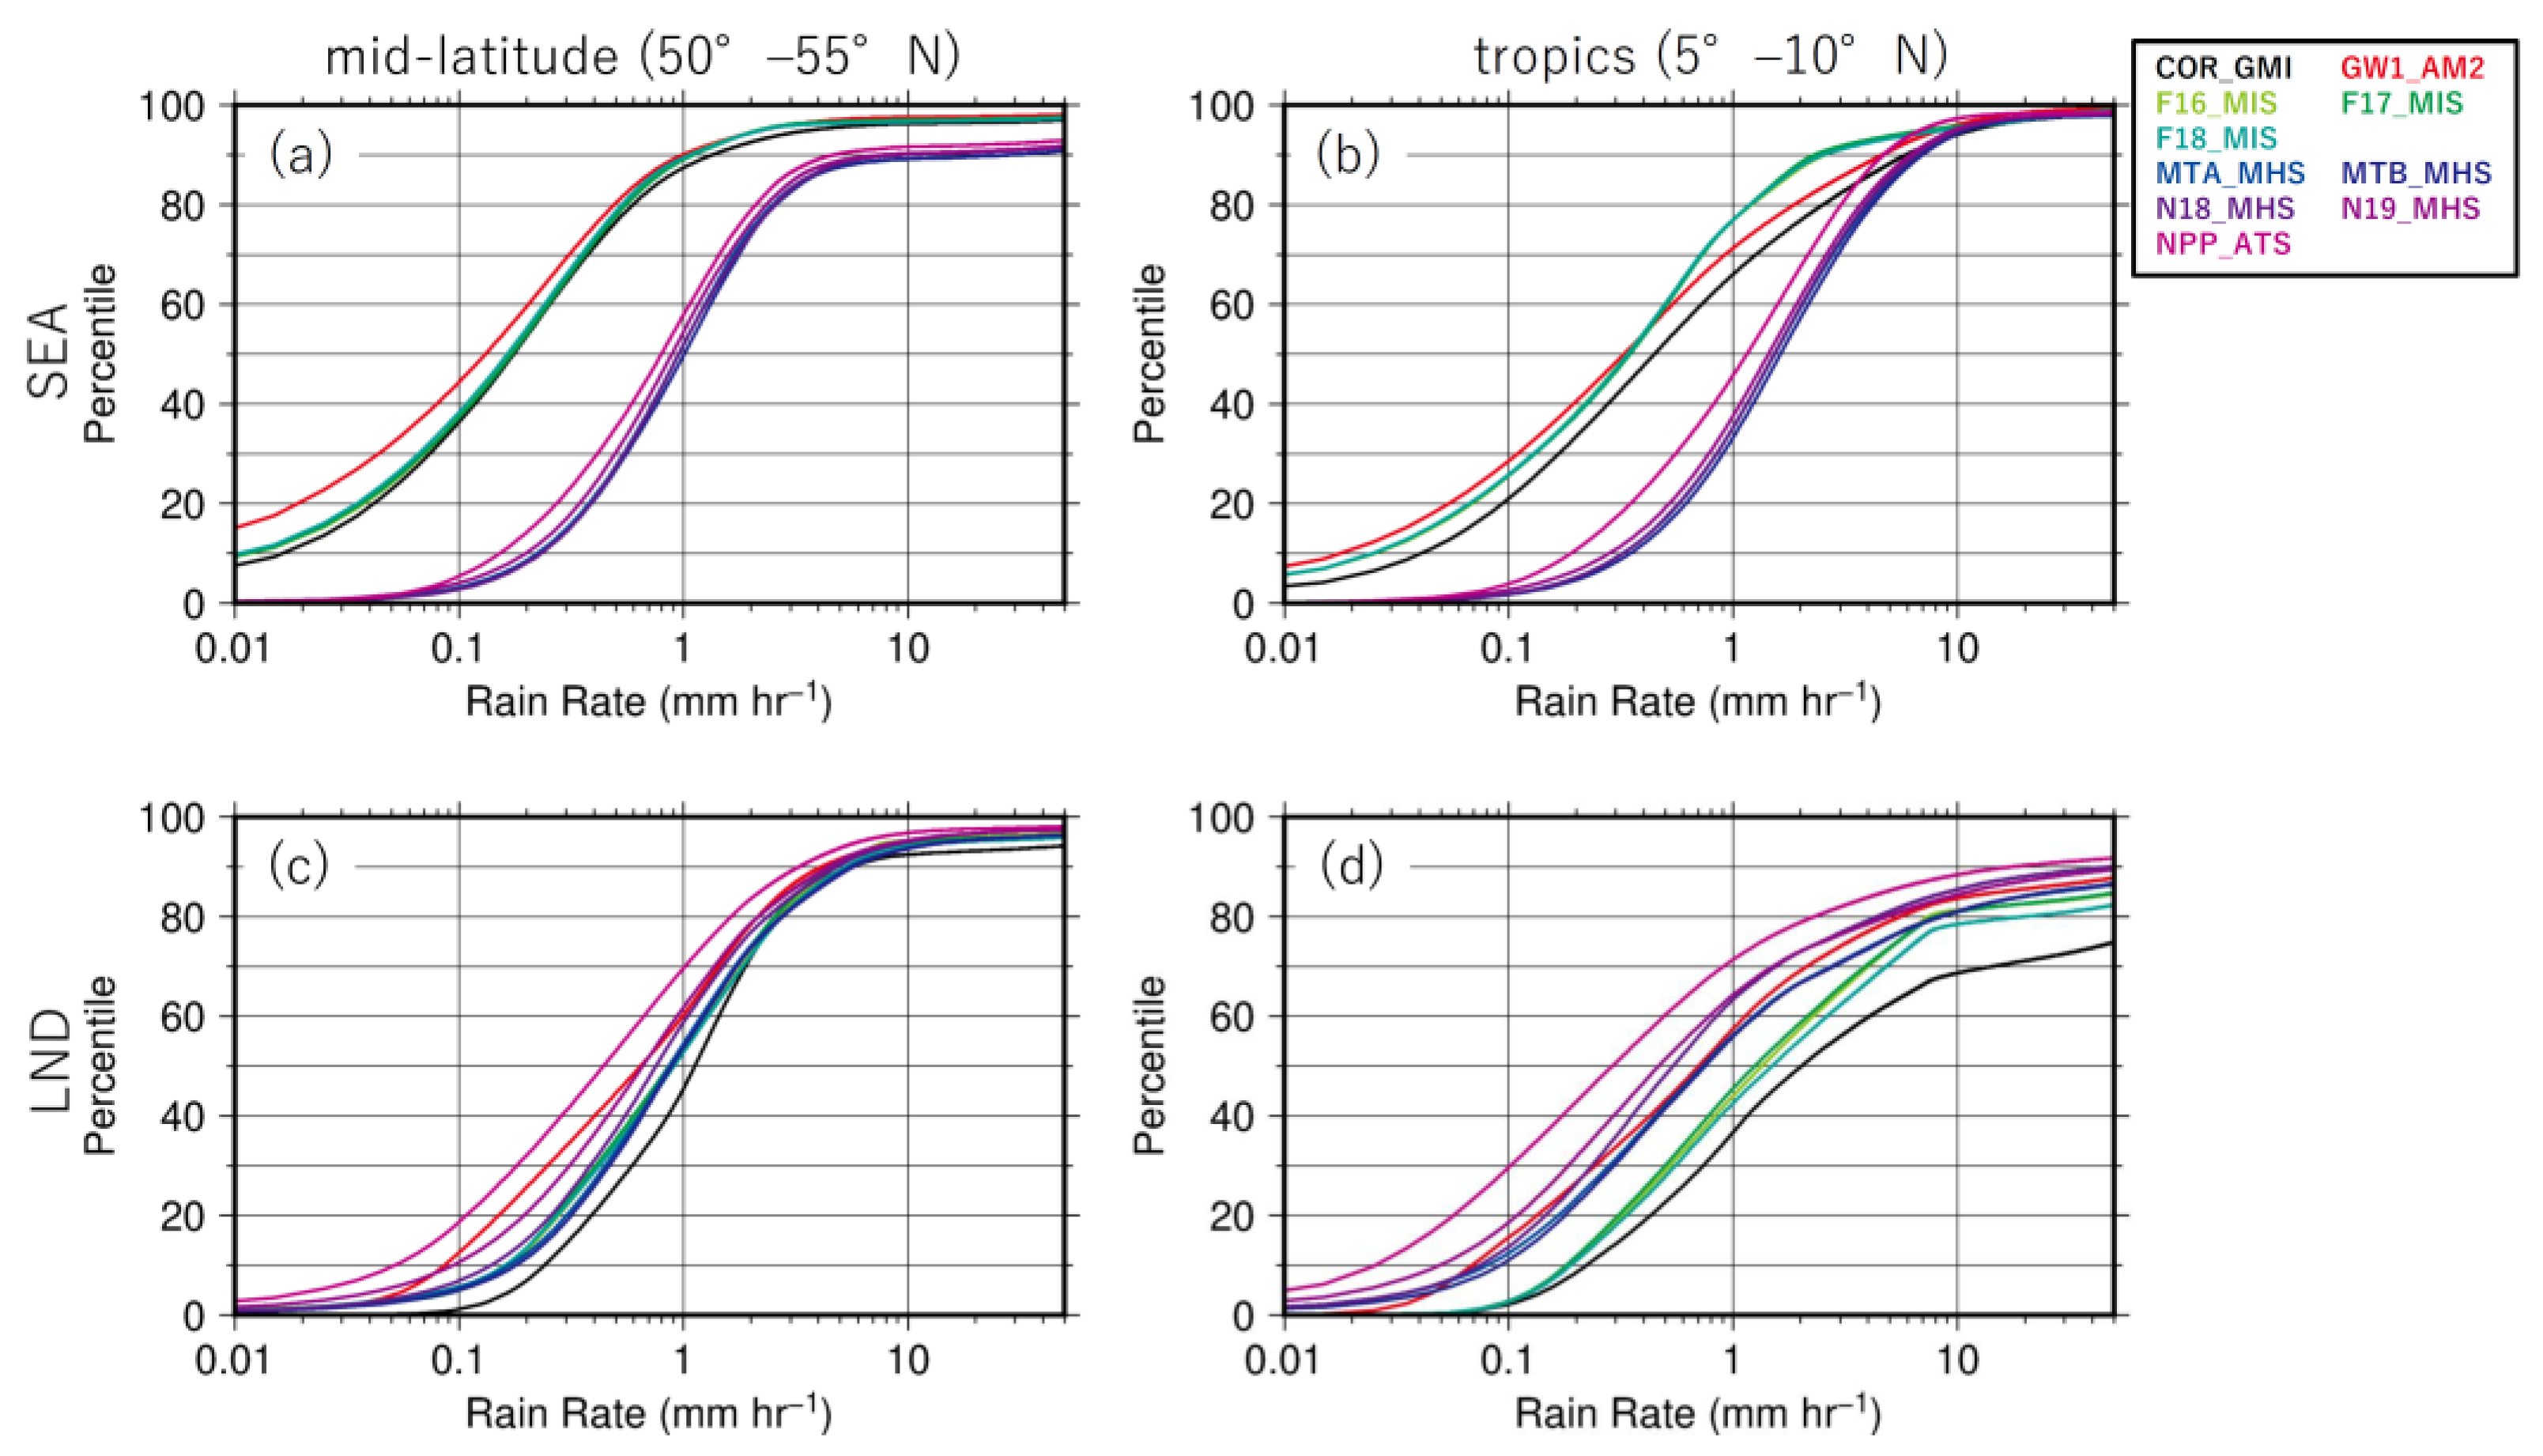
Percentiles of binned-rainfall counts for each PMW sensor over ocean and land in the mid-latitudes (55°–50°N) and tropics (5°–10°N) in July 2014 are illustrated in Figure 2. Over the ocean (Figure 2a,b), the CDF distribution appears to be grouped by sensor type (i.e., GMI, AMSR, SSMIS, and MWSs) regardless of latitude. The differences in CDF distribution for MWSs are larger than MWIs, particularly in the mid-latitudes (Figure 2a), caused by the PMW precipitation retrieval algorithm rather than individual sensor specifications or the PMW sensor equator-crossing time. Compared to the COR_GMI, the percentile values for a given precipitation intensity are generally higher for the SSMIS series and GW1_AM2 and significantly lower for MWSs. These tendencies show that higher (lower) percentile values at a given rain intensity indicate weaker (heavier) rainfall than the reference sensor. In the tropics (Figure 2b), the percentile values of NPP_ATS and MHSs overtake that of COR_GMI at 4.5 and 8 mm h−1, respectively. This implies that neither weak nor heavy rainfall is likely to appear for MWSs. Lower percentile values in the weak rainfall rate indicate that a part of the rain retrieval algorithm is updated for MWIs only. For heavy rainfall, MWSs cannot retrieve heavy rainfall from the emissivity signals.
Over land (Figure 2c,d), the percentile values at a given rain intensity for all the target sensors are higher than for COR_GMI. This tendency of MWSs is more significant than the SSMIS series due to the different algorithms. In addition, the variability in CDF distribution among the PMW sensors in the tropics (Figure 2d) is greater than that in the mid-latitudes (Figure 2c). This indicates that both weaker and heavier rainfall is more frequently estimated, and these tendencies are more significant for MWSs than SSMIS. This may be due to spatiotemporal variability, such as heavy convective rainfall, and the diurnal variation of rainfall is greater than in oceanic rainfall systems.

3.2. Normalization Table

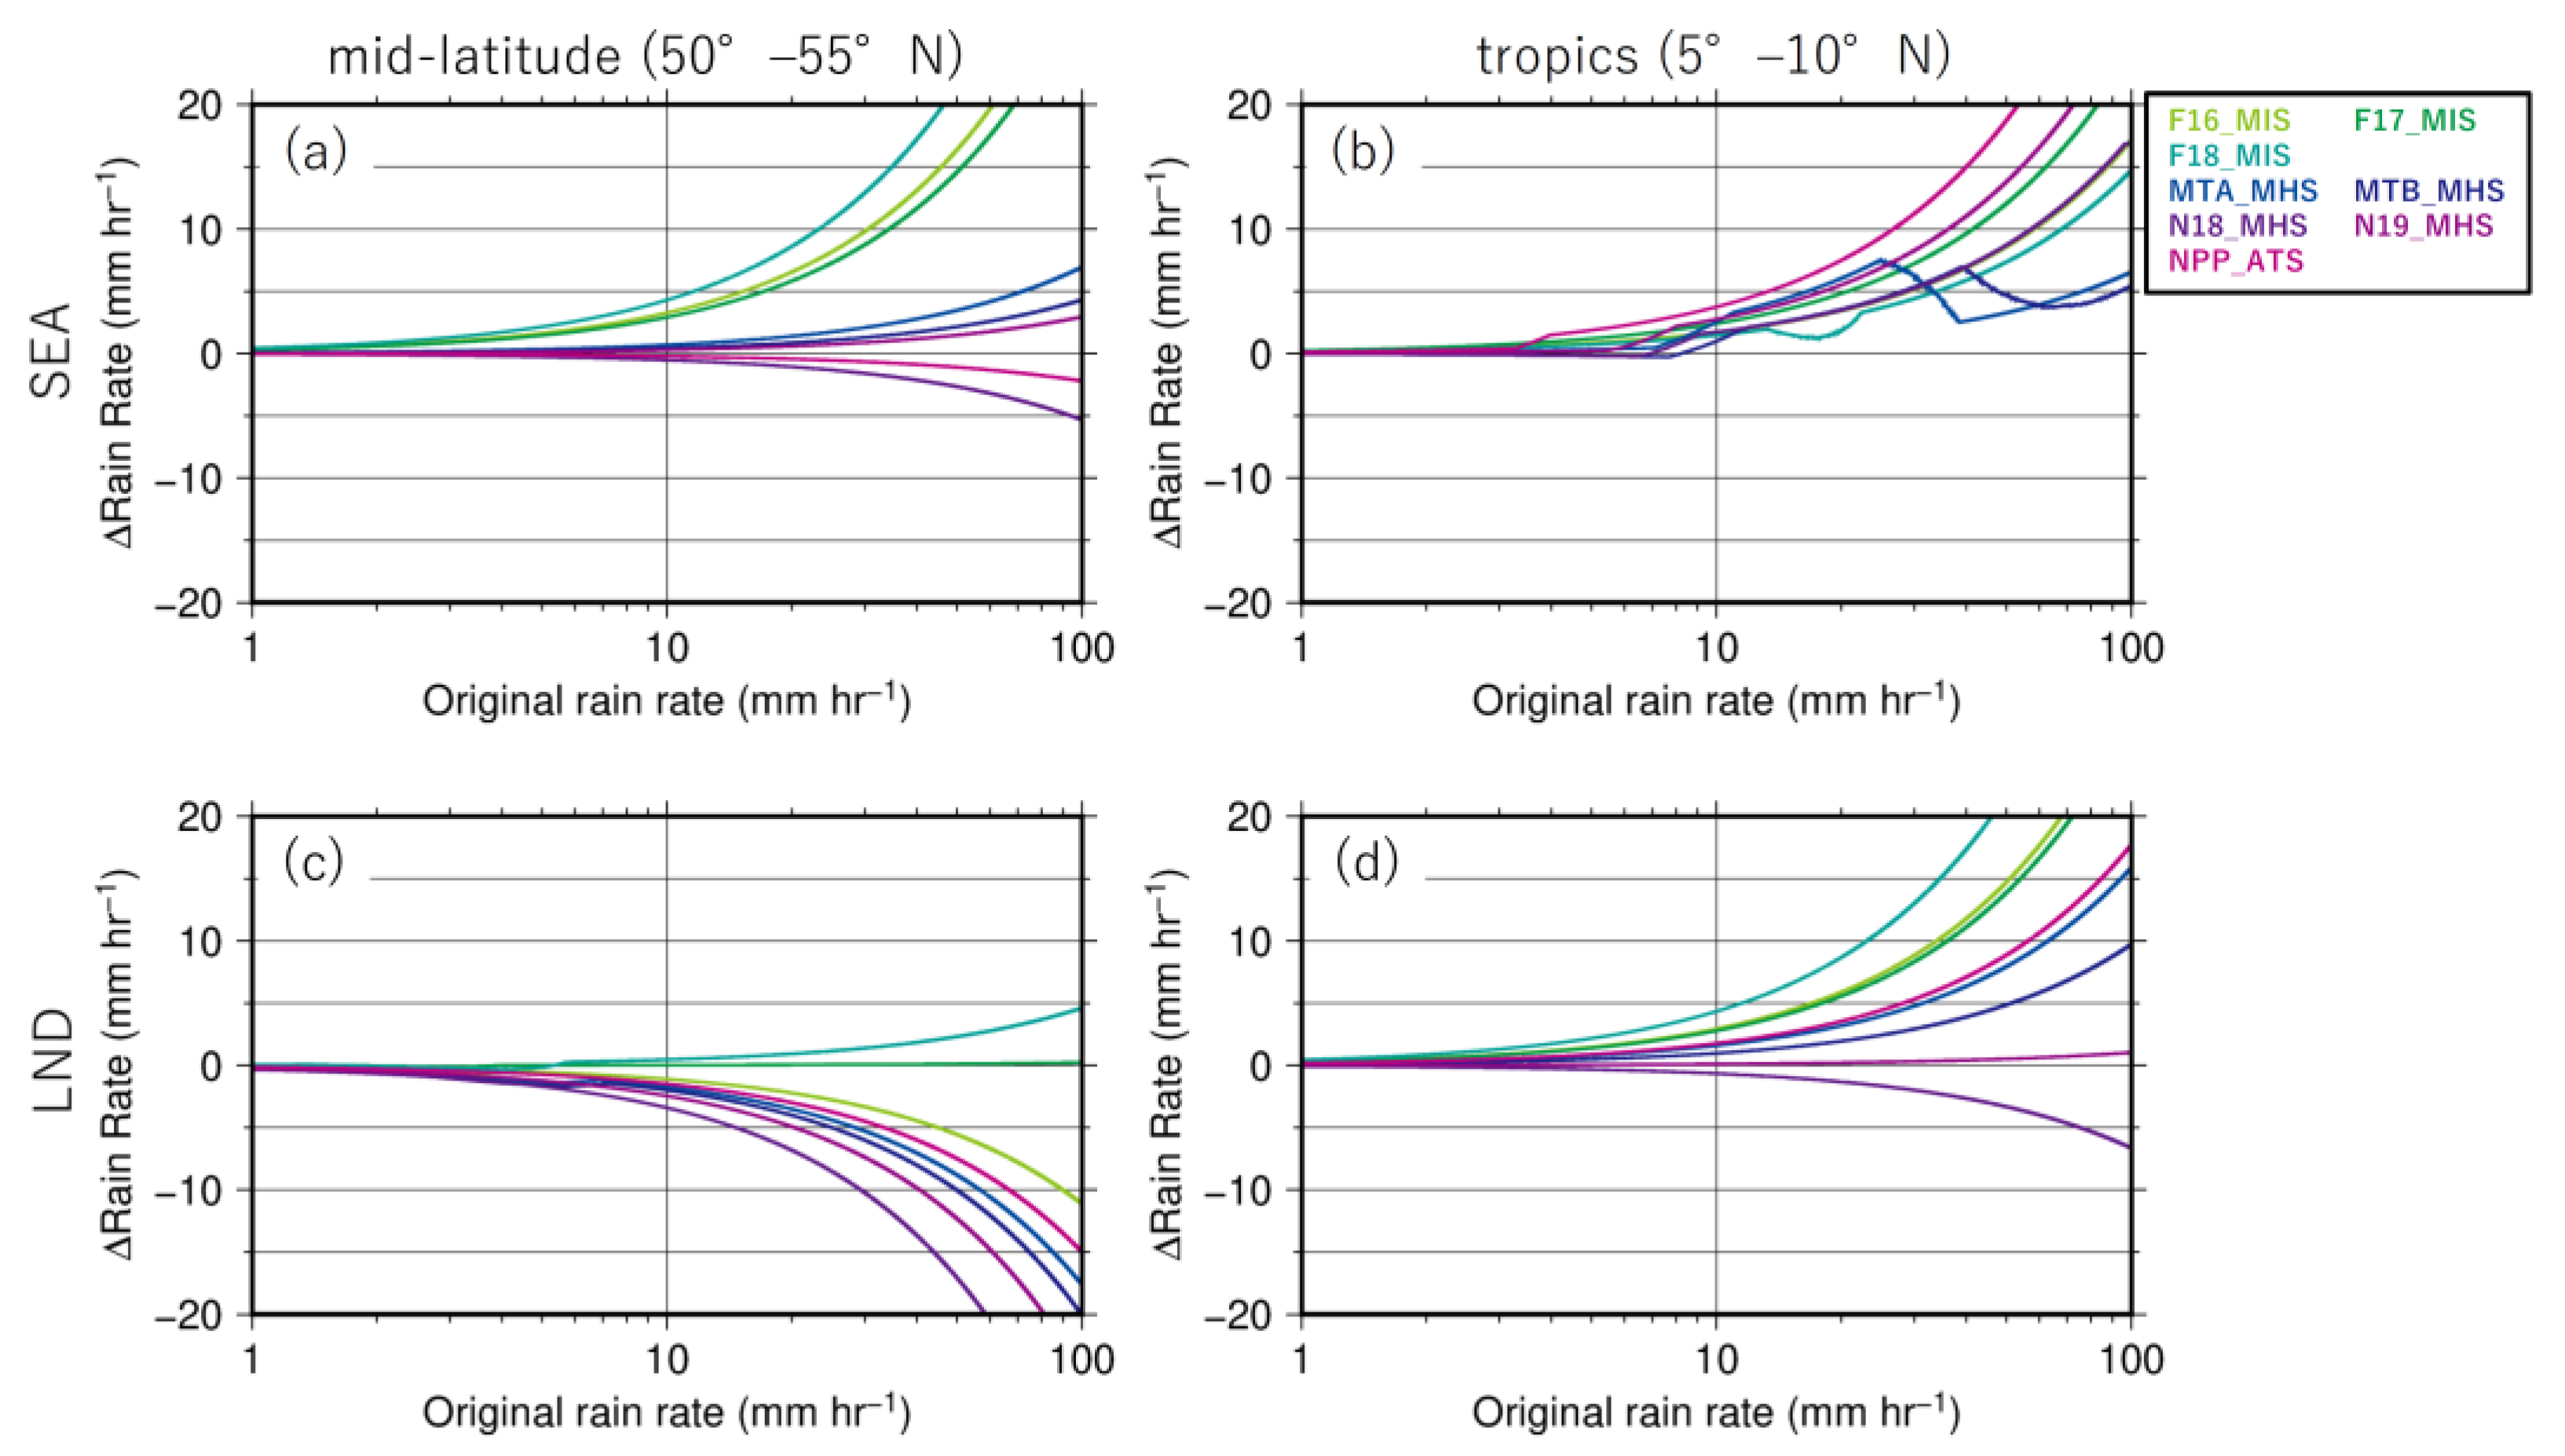
Figure 3 shows the amount of correction for rainfall intensity for each target sensor based on the normalization table for each PMW sensor in the mid-latitude and tropics in July 2014. Over the ocean (Figure 3a,b), the SSMIS series is corrected to increase rain intensity by 12–14% (11–12%) in the mid-latitudes (tropics) regardless of the rain intensity. For MWSs, few corrections of rain intensity can be seen in either the mid-latitudes or the tropics. However, an increasing correction occurred around 4 mm h−1 (NPP_ATS) and 8 mm h−1 (other MWSs) in the tropics (Figure 3b). This distortion of the correction table reflects the CDF difference between the COR_GMI and MWSs as shown in the previous section.
Over land (Figure 3c,d), the SSMIS series has a small correction in the mid-latitudes and a small (about 10%) increasing correction in the tropics. For MWSs, 13–15% of a decreasing correction appeared in the mid-latitudes, and there were few corrections in the tropics except for NPP_ATS.

3.3. Evaluations of MMN Method

To evaluate the effect of the MMN method quantitatively, matchup data for GMI and other PMW sensors were collected within 15 min during April–October 2014. Zonal mean monthly rainfall for the specific PMW sensors before (uncorrected) and after (corrected) MMN application are compared with that for COR_GMI. In addition, the indices of evaluation are chosen as the mean bias error (MBE or bias), root mean square error (RMSE), and correlation coefficient (CC) as follows:
MBE = 1 N R t R r
RMSE = 1 N R t R r 2
CC = R t R t ¯ R r R r ¯ R t R t ¯ 2 R r R r ¯ 2
where N is the number of samples; Rt and Rr are the rain intensities for the target PMW sensor and the reference PMW sensor (COR_GMI), respectively; R t ¯ and R r ¯ are the average of each variable. MBE and RMSE score better when the value is close to 0, and CC scores worse when the value is close to 0.
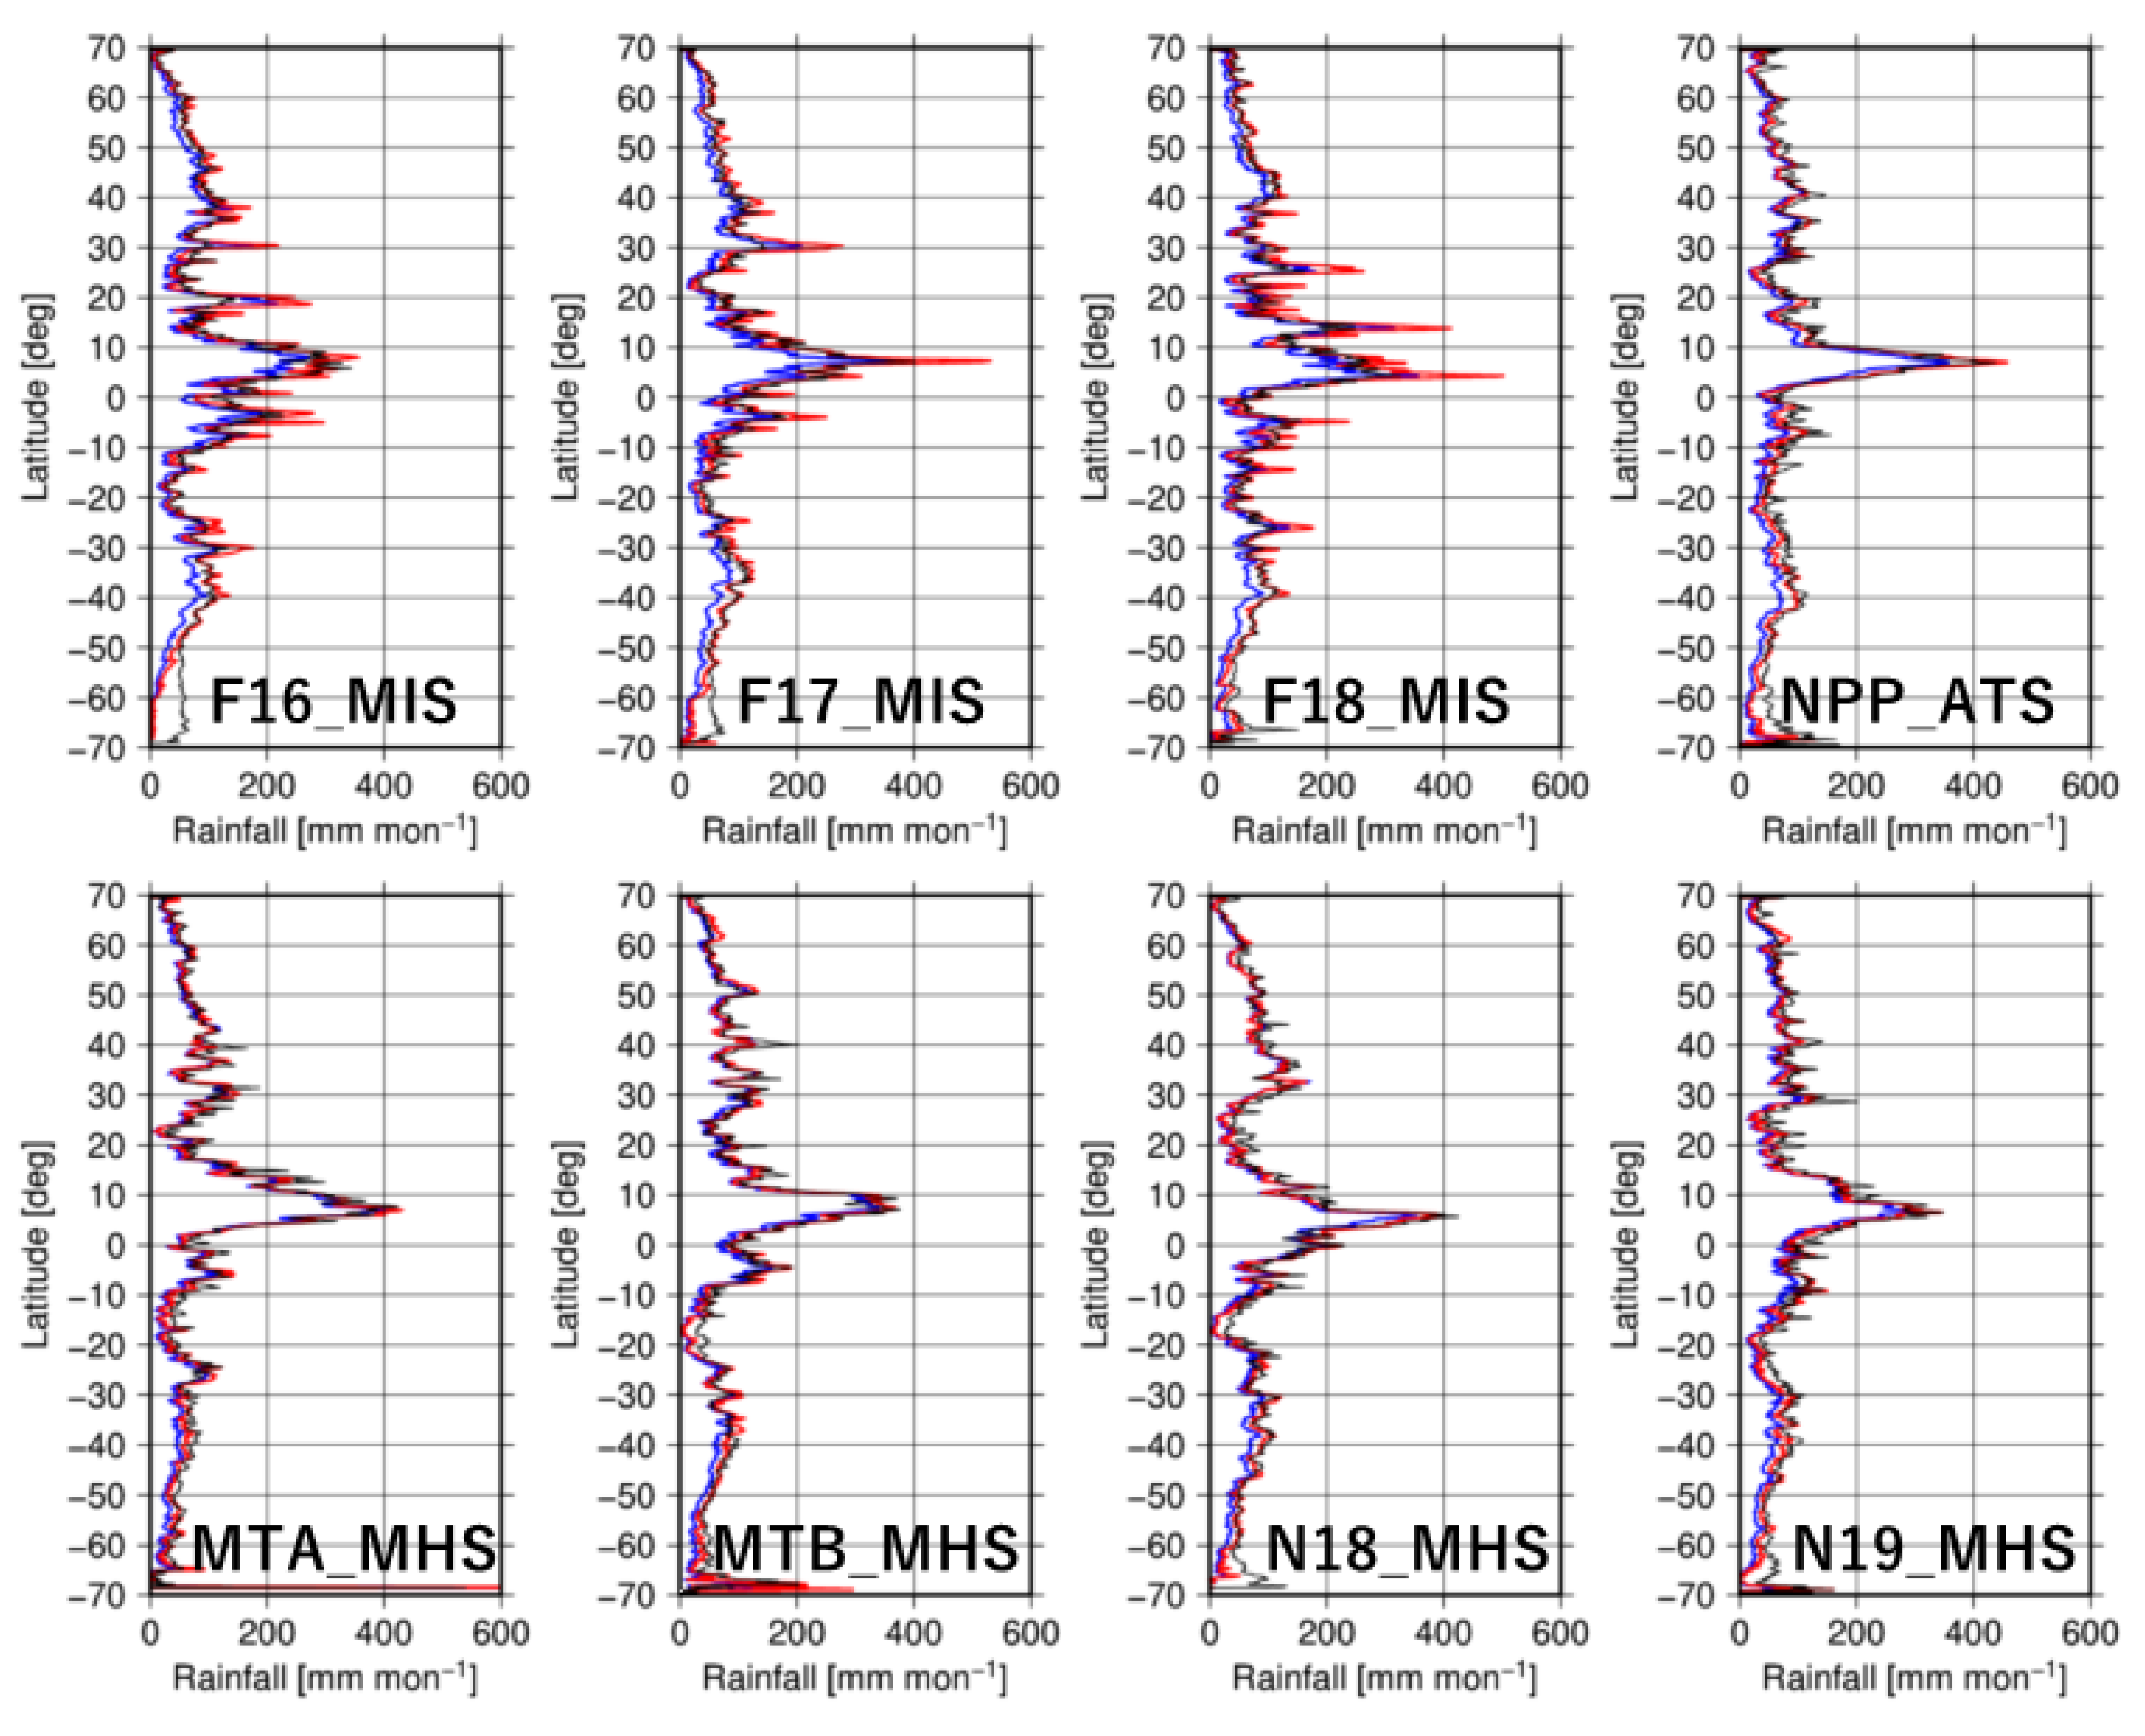
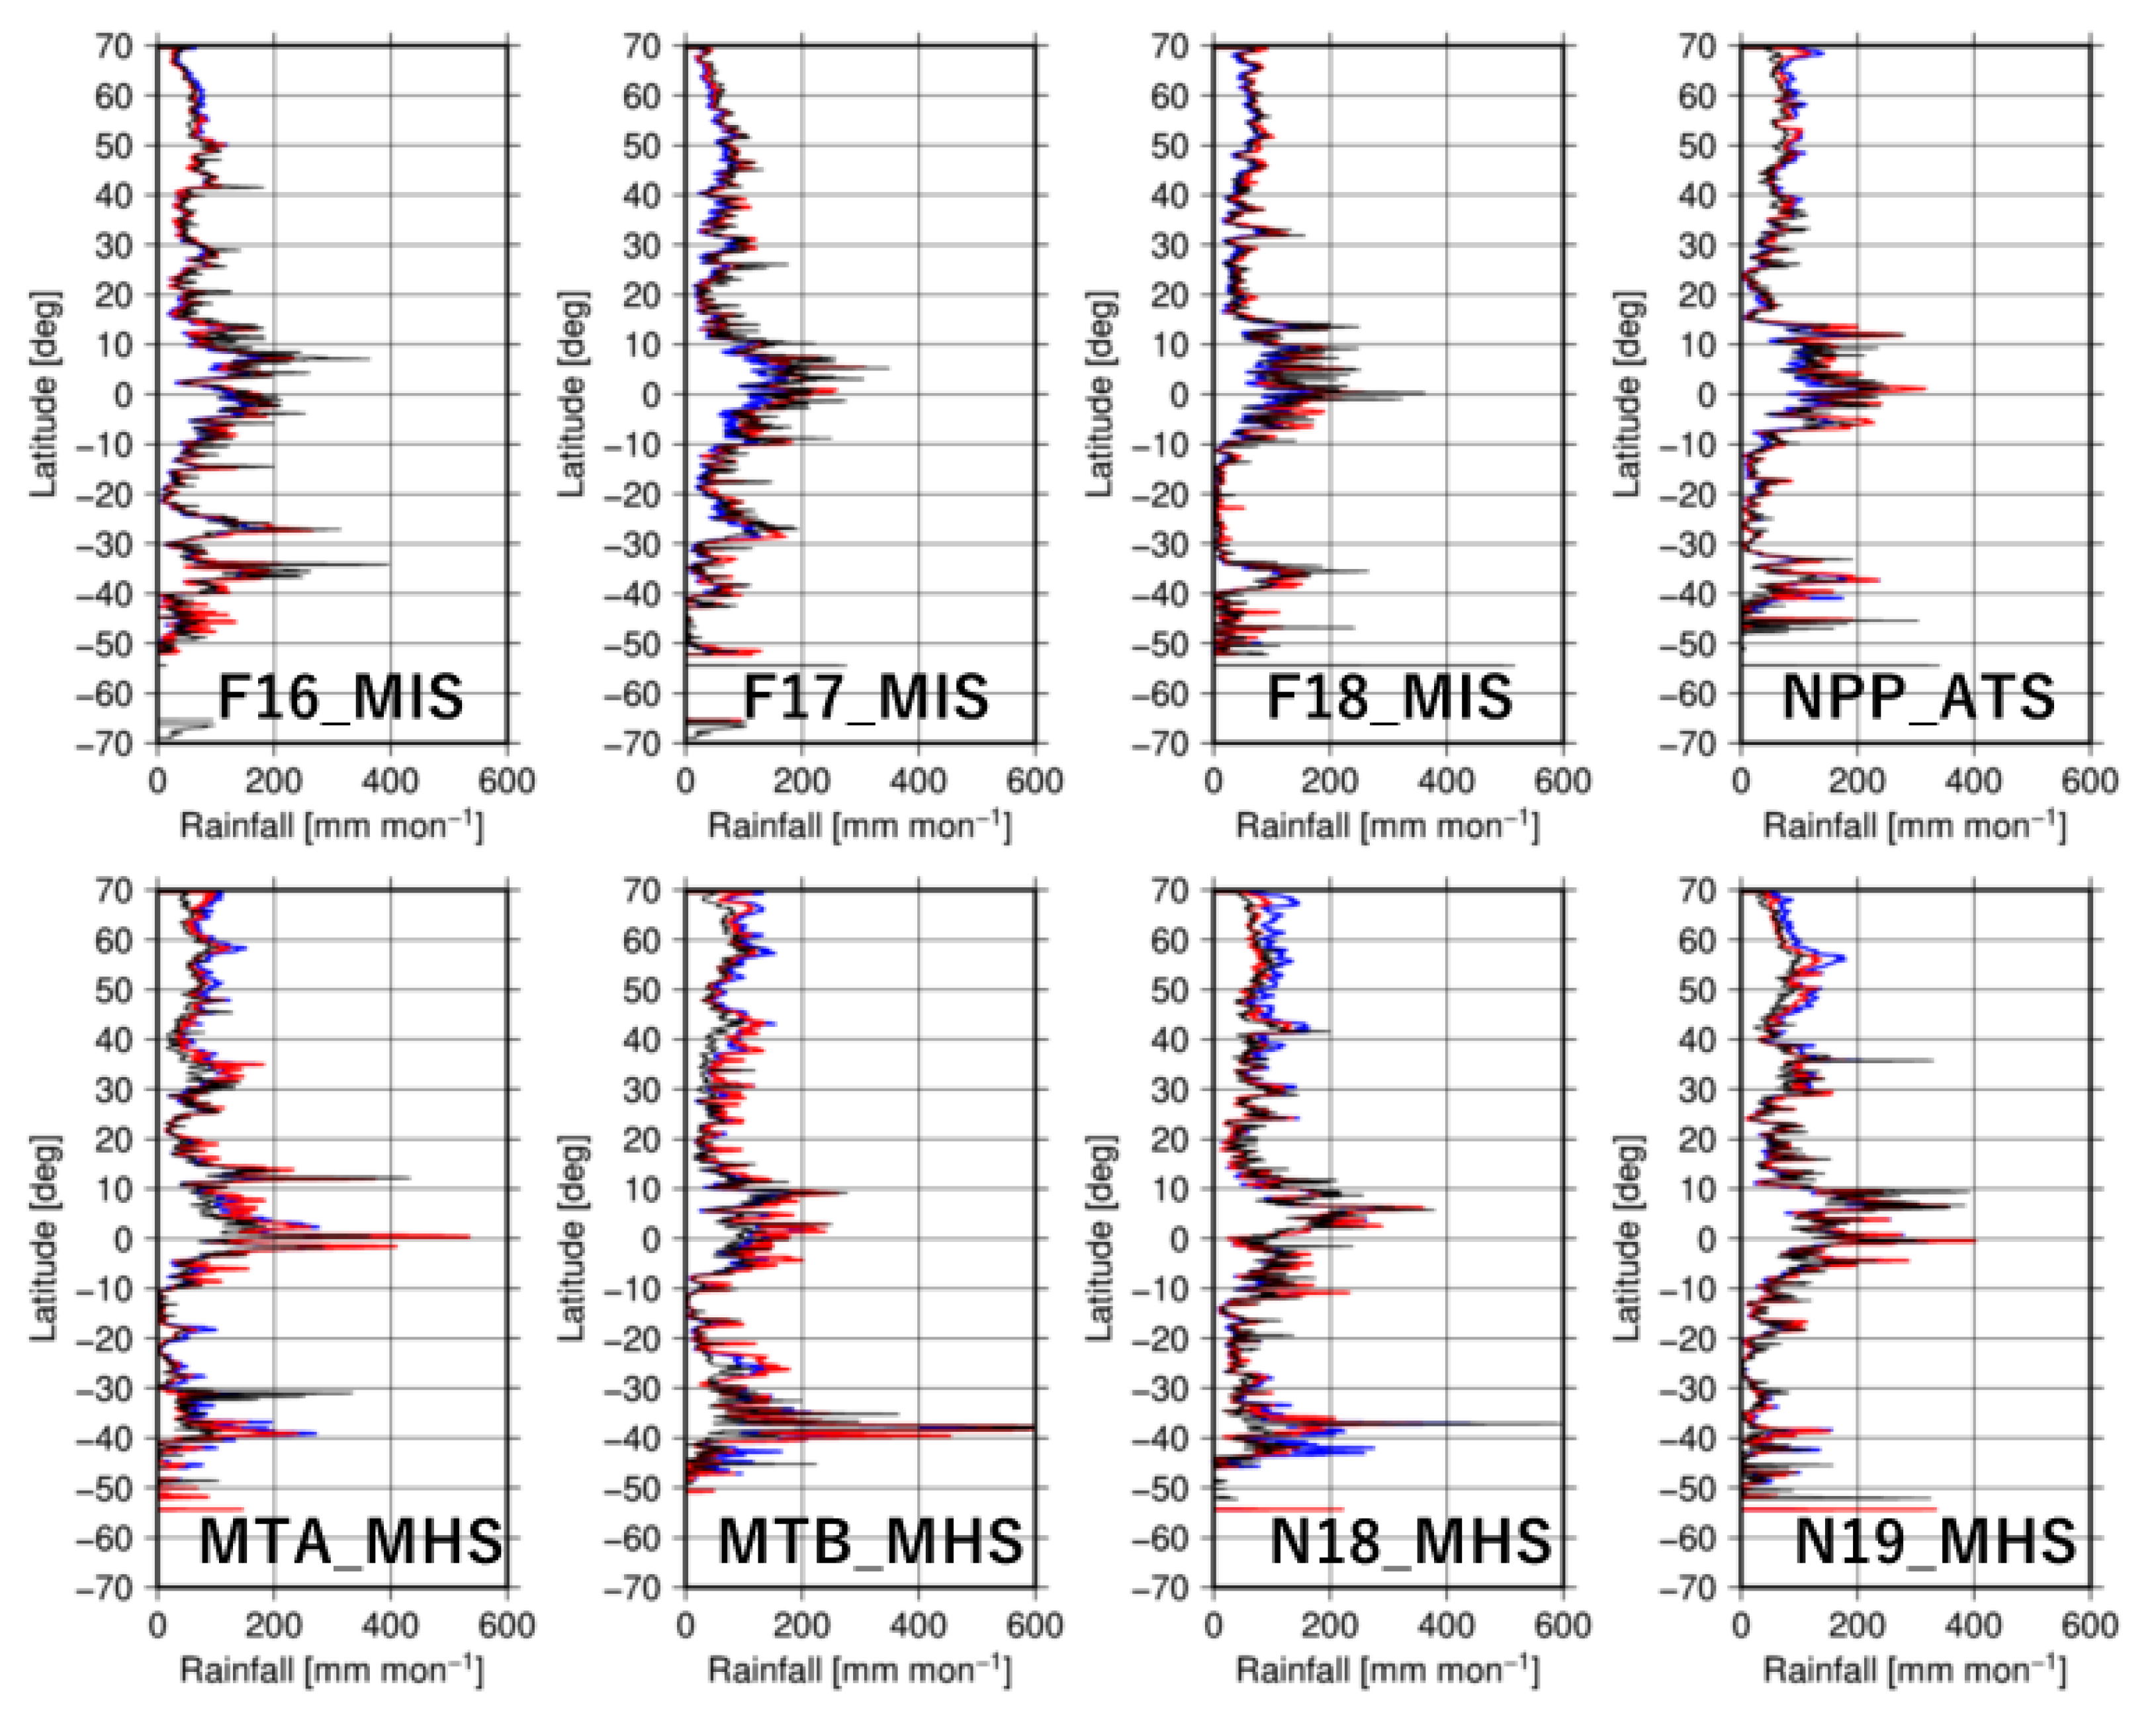
The zonal mean matchup monthly rainfall data over ocean and land for the specific PMW sensors are shown in Figure 4 and Figure 5, respectively. Over the ocean before the MMN correction (blue lines in Figure 4), the SSMIS series and COR_GMI monthly mean rainfall are almost equal in the tropics and the northern mid-latitudes. It showed an underestimation trend in the southern mid-latitudes compared to COR_GMI. For MWSs, there is a slight decrease in the tropics and a stronger trend of underestimation in the southern mid-latitudes. After the MMN correction (red lines), the monthly mean rainfall for the SSMIS series is close to that in COR_GMI in the mid-latitudes, although an overestimation trend can be seen in F17 and F18 in the tropics. There are few corrections in the polar regions in the southern hemisphere (60°–70°S) in F16 and F17, which is due to a lack of rainfall (the MMN method can eliminate rainfall but cannot create rainfall). Overall, MWS rainfall after the MMN correction improves in the regions of underestimation except for 70°S (a case of misdetection of sea ice as heavy rainfall). Over land (Figure 5), rainfall in the tropics for the SSMIS series underestimates compared with that for COR_GMI before the MMN correction. MWSs have the opposite tendency (i.e., overestimate) in both hemispheres in the mid-latitudes. Similarly, over the ocean, these over- and underestimates are improved after the MMN correction.
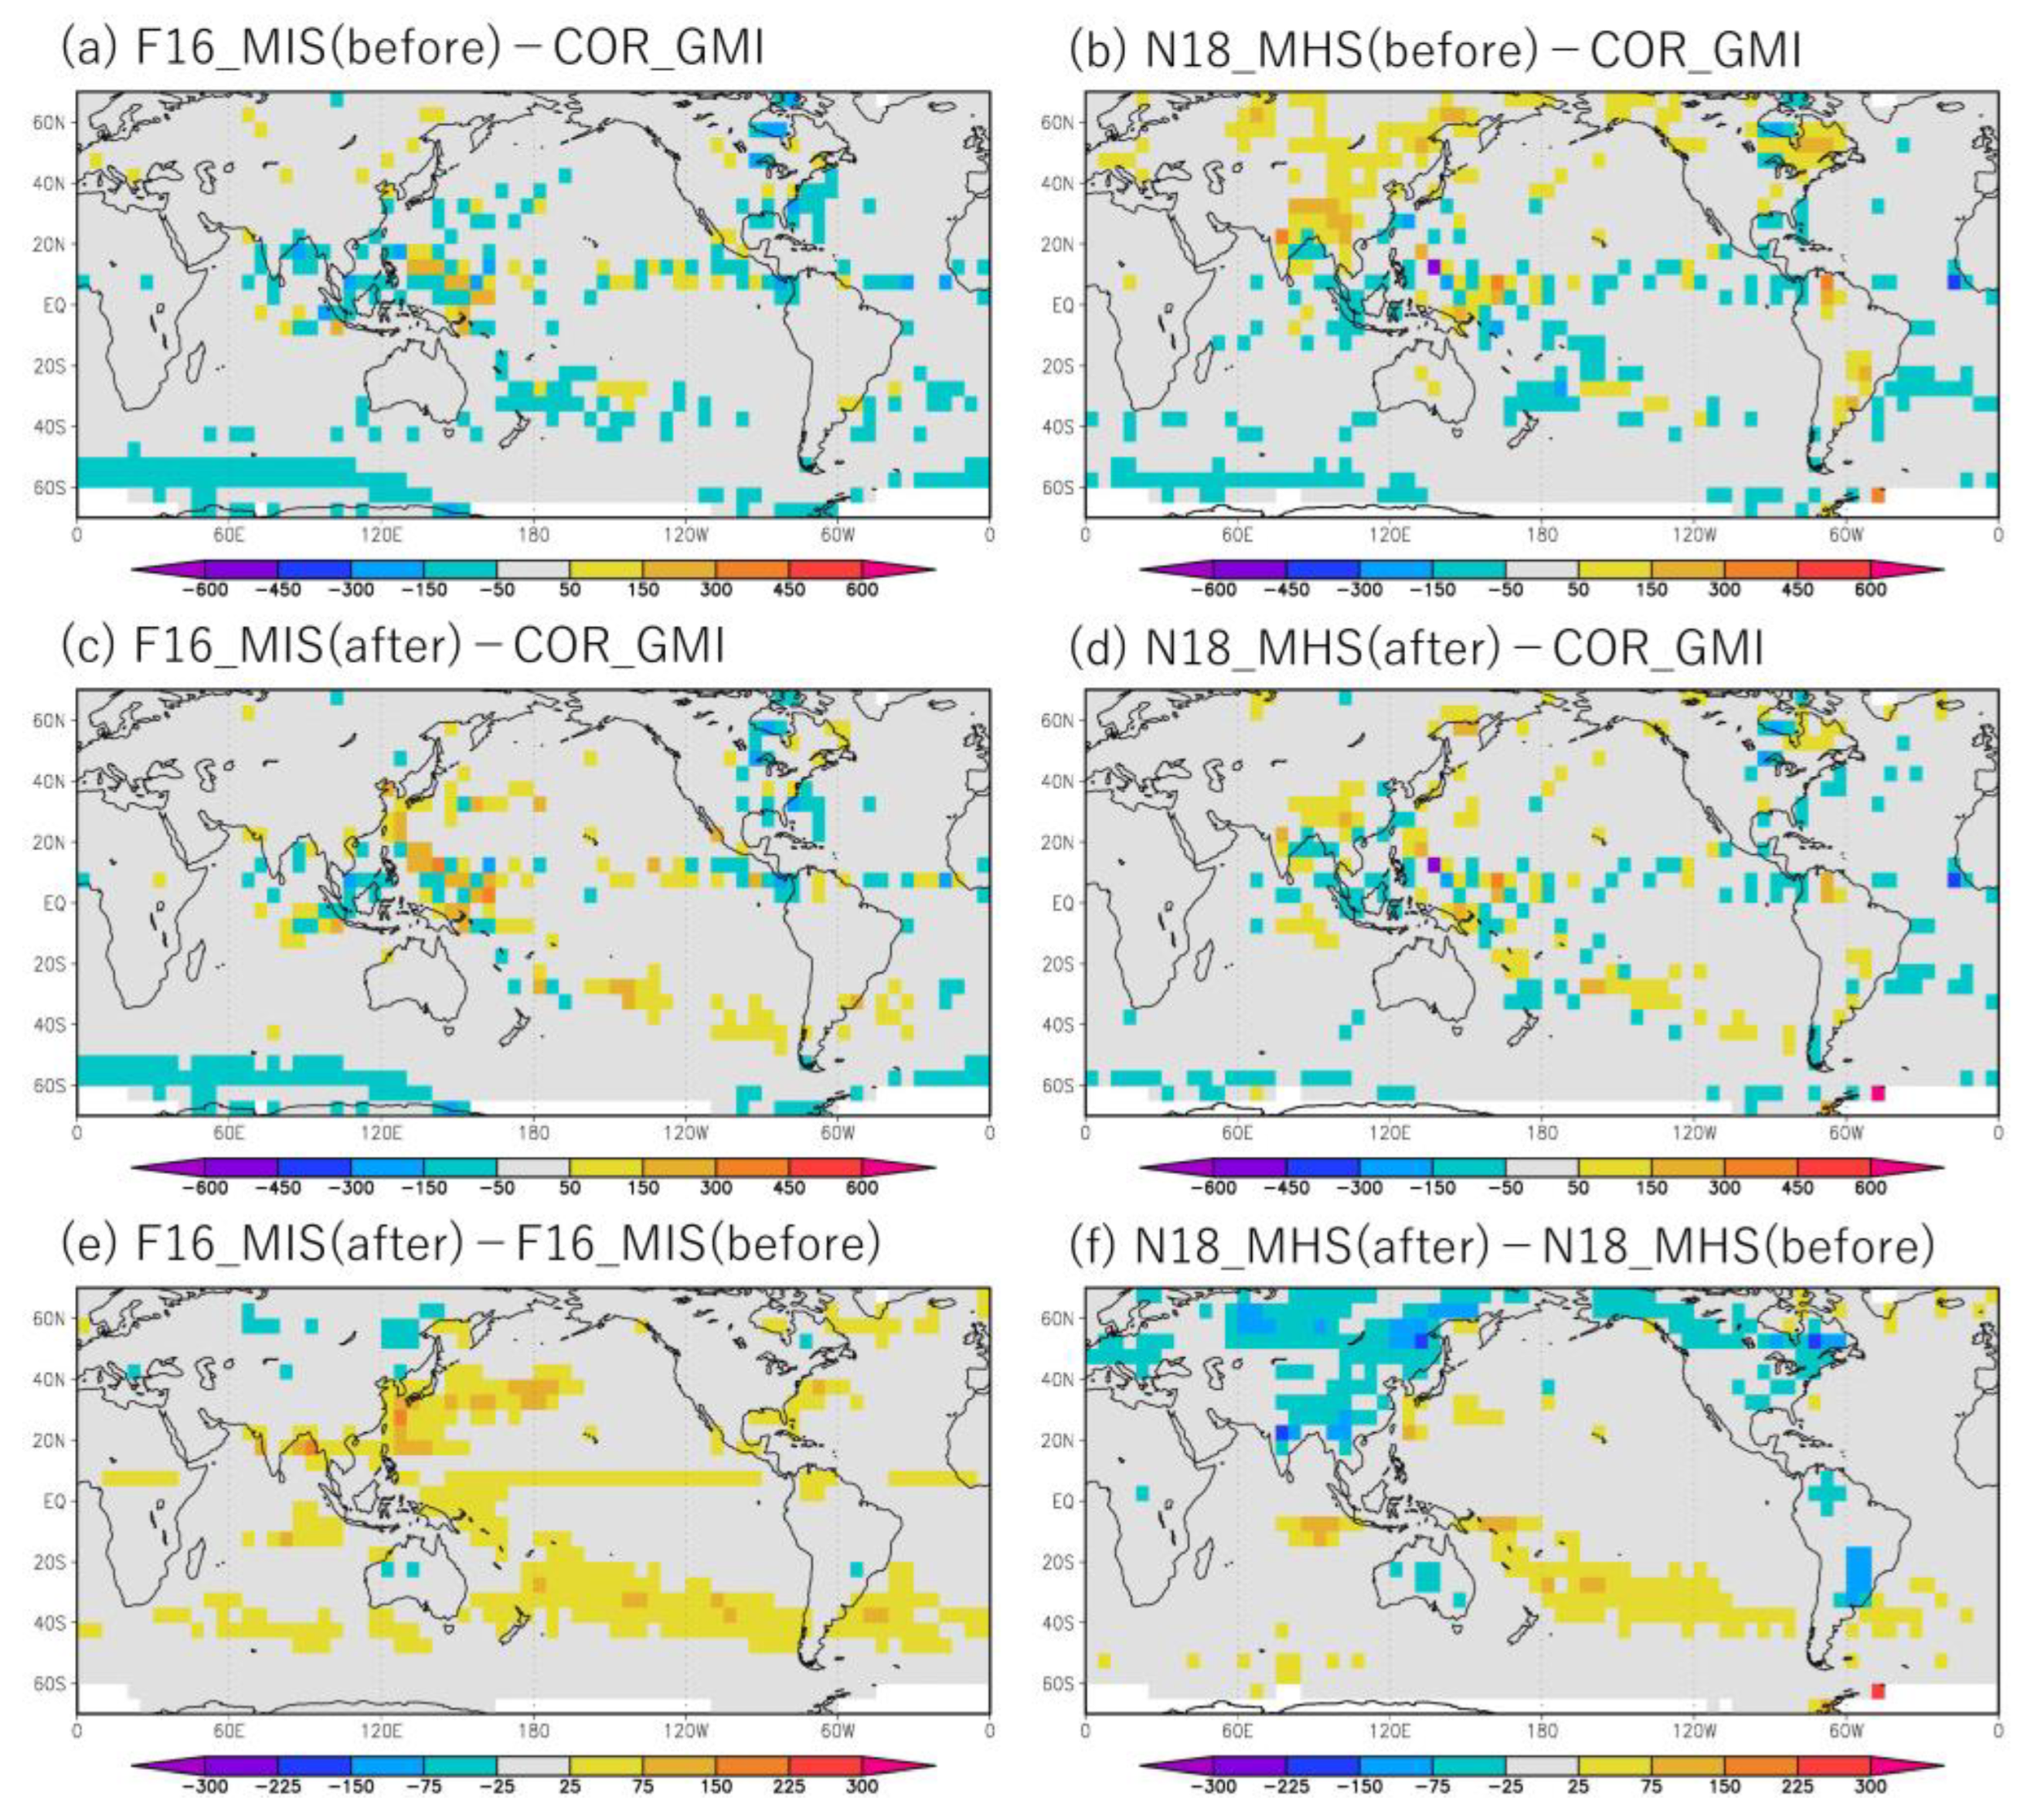
Traditionally, such comparisons have been made using all observation samples rather than matchups [20]. When Figure 4 and Figure 5 are recreated with all the observation samples, the above features are more distinct (not shown). Figure 6 illustrates bias in the monthly mean rainfall between the target PMW sensors (F16_MIS and N18_MHS) before and after the MMN correction and COR_GMI (those from the matchup data are variated due to an insufficient number of samples, even a seven-month accumulation). F16_MIS rainfall overestimates in the Russian region and underestimates in the northwest Pacific, SPCZ, and the Indian Ocean compared to that for COR_GMI before the MMN correction (Figure 6a). A more distinct tendency can be seen for N18_MHS (Figure 6b). After the correction (Figure 6c,d), these biases have shrunk. However, the correction is slightly excessive for F16_MIS. The underestimation of rainfall in the South Atlantic had not been fully resolved, but this underestimation may have been compensated for in other areas.
Table 2 shows the MBE scores for the target PMW sensors against COR_GMI before and after the MMN correction. It is reasonable that the MBE for all the target PMW sensors improved after the application of MMN, except for F16_MIS for land. However, RMSE (Table 3) and CC (Table 4) do not necessarily show an improvement with the MMN method. A systematic deterioration can be seen in RMSE over the ocean for all the PMW sensors and CC over the ocean for MWSs. Since RMSE integrates the square of the error, the error contribution from heavy rainfall is significant. As for CC, the distortion of the CDF difference may have affected the results. As mentioned for Figure 2, compared to the CDF distribution of MWI, that of MWS was much further from the distribution of COR_GMI. This distortion is due to systematic differences between rain/no-rain classification and the maximum estimation intensity of heavy rainfall. Since the MMN method cannot change from no rainfall to rainfall, the sensor-to-sensor correction of the rain/no-rain classification method [21] must be considered separately. In addition, the rainfall intensity at high percentile values varies significantly depending on the presence or absence of heavy rainfall samples. Since heavy rainfall samples are very scarce, the amount and difference of samples must be carefully considered.

4. Discussion

The MMN algorithm has a structure similar to CMORPH. Compared to other PMW precipitation correction methods, MMN corrects not only GMI-observation regions but also the polar region to use GMI data. CMORPH uses SSM/Is [9] and AMSR-E [10] estimates for polar regions in addition to TMI. IMERG uses the estimates from the Combined Radar–Radiometer Algorithm [22], which combines the GMI and Dual-frequency Precipitation Radar onboarding the GPM core satellite. CMORPH and IMERG correct CDF only, but MMN also corrects it to utilize the rainfall amount. MMN applies to both land and ocean with multiple latitude tables, while PMW precipitation correction applies only to the ocean and applies to land with a one global table for IMERG.
On the other hand, CMORPH and IMERG use matchup data, and MMN does not work due to sampling issues. IMERG has a fixed correction table, but MMN is inappropriate due to corrections utilizing the rainfall amount. MMN cannot correct for non-precipitation. CMORPH applied a recursive filter but has the same problem.
The MMN module studied here should work effectively under similar rain detection levels and upper limits among the target PMW sensors. On the other hand, it cannot work well in different rain detection levels among the sensors, because the MMN cannot create the rainfall. Improvements in the inter-calibration of the brightness temperature and rain retrieval algorithm are one of the solutions for further reduction in the discrepancy of rainfall estimates among the PMW sensors.

5. Conclusions

This study proposed the MMN for the GSMaP precipitation retrieval algorithm in its latest version (V05, algorithm version 8) to mitigate the discrepancy of GSMaP rainfall estimates among the PMW sensors due to different specifications of the instruments and retrieval algorithms. The algorithm of the MMN module is described, and the basic idea is to calibrate all the PMW sensors except for the reference sensors (COR_GMI and TRM_TMI) to match the CDF of the rain rate in the last 30 days.
CDF distributions differed from PMW algorithms rather than individual sensor specifications and equator-crossing times. Compared to COR_GMI, over the ocean, lighter rainfall exists for SSMIS, and neither lighter nor heavier rainfall occurred for MWSs. Over land, both weak and heavy rainfall are likely to appear for all the target sensors. The variability in CDF distribution is more significant in the tropics than in the mid-latitudes, and for MWSs than in the SSMIS series.
The correction effect by the MMN module was evaluated using seven months of matchup data for GMI and other PMW sensors. It was confirmed that the zonal mean rainfall and bias in the accumulated rain amount are improved by the MMN correction for almost all the PMW sensors in both ocean and land regions. However, a further evaluation including other evaluation indexes due to an insufficient number of samples, and validation results using ground instruments, such as a ground–radar dataset calibrated by rain gauges provided by the Japan Meteorological Agency, are regarded as a task for the future.

Author Contributions

M.K.Y. and T.K. designed this study and wrote this manuscript. M.K.Y. conducted the analysis and investigation and wrote the original draft preparation; T.K. supported writing the original draft preparation and contributed to discussions and revisions. All authors have read and agreed to the published version of the manuscript.

Funding

This research has received no external funding.

Data Availability Statement

Not applicable.

Acknowledgments

The authors thank the members of the GSMaP Project Team for their valuable discussions and comments. We are grateful to the members of TRMM-GPM-EarthCARE Group of RESTEC for their helpful computing support.

Conflicts of Interest

The authors declare that there are no conflict of interest.

Appendix A

Acronyms of the Platforms and the PMW sensors used in this study are shown in Table A1.
Table A1. Acronyms of the Platforms and the PMW sensors used in this study.
AcronymsPlatformSensor Name
COR_GMIGPM Core ObservatoryGPM Microwave Imager (GMI)
TRM_TMITropical Rainfall Measuring MissionTRMM Microwave Imager (TMI)
GW1_AM2Global Change Observation Mission 1st-WaterAdvanced Microwave Scanning Radiometer 2 (AMSR2)
F16_MISDefense Meteorological Satellite Program F-16Special Sensor Microwave Imager Sounder (SSMIS)
F17_MISDefense Meteorological Satellite Program F-17
F18_MISDefense Meteorological Satellite Program F18
N18_MHSNational Oceanic and Atmospheric Administration 18Microwave Humidity Sounder (MHS)
N19_MHSNational Oceanic and Atmospheric Administration 19
NPP_ATSSuomi National Polar-orbiting PartnershipAdvanced Technology Microwave Sounder (ATMS)

References

  1. Hou, A.Y.; Kakar, R.K.; Neeck, S.; Azarbarzin, A.A.; Kummerow, C.D.; Kojima, M.; Oki, R.; Nakamura, K.; Iguchi, T. The Global Precipitation Measurement Mission. Bull. Am. Meteorol. Soc. 2014, 95, 701–722. [Google Scholar] [CrossRef]
  2. Skofronick-Jackson, G.; Petersen, W.A.; Berg, W.; Kidd, C.; Stocker, E.F.; Kirschbaum, D.B.; Kakar, R.; Braun, S.A.; Huffman, G.J.; Iguchi, T.; et al. The Global Precipitation Measurement (GPM) Mission for Science and Society. Bull. Am. Meteorol. Soc. 2017, 98, 1679–1695. [Google Scholar] [CrossRef] [PubMed]
  3. Kubota, T.; Shige, S.; Hashizume, H.; Aonashi, K.; Takahashi, N.; Seto, S.; Hirose, M.; Takayabu, Y.N.; Nakagawa, K.; Iwanami, K.; et al. Global Precipitation Map using Satelliteborne Microwave Radiometers by the GSMaP Project: Production and Validation. IEEE Trans. Geosci. Remote Sens. 2007, 45, 2259–2275. [Google Scholar] [CrossRef]
  4. Aonashi, K.; Awaka, J.; Hirose, M.; Kozu, T.; Kubota, T.; Liu, G.; Shige, S.; Kida, S.; Seto, S.; Takahashi, N.; et al. GSMaP passive microwave precipitation retrieval algorithm: Algorithm description and validation. J. Meteorol. Soc. Jpn. 2009, 87, 119–136. [Google Scholar] [CrossRef]
  5. Shige, S.; Yamamoto, T.; Tsukiyama, T.; Kida, S.; Ashiwake, H.; Kubota, T.; Seto, S.; Aonashi, K.; Okamoto, K. The GSMaP precipitation retrieval algorithm for microwave sounders—Part I: Over-ocean algorithm. IEEE Trans. Geosci. Remote Sens. 2019, 47, 3084–3097. [Google Scholar] [CrossRef]
  6. Gentilucci, M.; Barbieri, M.; Pambianchi, G. Reliability of the IMERG product through reference rain gauges in Central Italy. Atmos. Res. 2022, 278, 106340. [Google Scholar] [CrossRef]
  7. Ning, S.; Song, F.; Udmale, P.; Jin, J.; Thapa, B.R.; Ishidaira, H. Error analysis and evaluation of the latest GSMaP and IMERG precipitation products over Eastern China. Adv. Meteorol. 2017, 2017, 1803492. [Google Scholar] [CrossRef]
  8. Kubota, T.; Shige, S.; Kachi, M.; Aonashi, K. Development of SSMIS rain retrieval algorithm in the GSMaP project. In Proceedings of the 25th International Symposium on Space Technology and Science, Okinawa, Japan, 5–12 June 2011. [Google Scholar]
  9. Joyce, R.J.; Janowiak, J.E.; Arkin, P.A.; Xie, P. CMORPH: A method that produces global precipitation estimates from passive microwave and infrared data at high spatial and temporal resolution. J. Hydrometeorol. 2004, 5, 487–503. [Google Scholar] [CrossRef]
  10. Joyce, R.J.; Xie, P. Kalman-filter-based CMORPH. J. Hydrometeorol. 2011, 12, 1547–1563. [Google Scholar] [CrossRef]
  11. Xie, P.; Joyce, R.; Wu, S.; Yoo, S.-H.; Yarosh, Y.; Sun, F.; Lin, R. Reprocessed, bias-corrected CMORPH global high-resolution precipitation estimates from 1998. J. Hydrometeorol. 2017, 18, 1617–1641. [Google Scholar] [CrossRef]
  12. Huffman, G.J.; Adler, R.F.; Bolvin, D.T.; Gu, G.; Nelkin, E.J.; Bowman, K.P.; Hong, Y.; Stocker, E.F.; Wolf, D.B. The TRMM Multisatelilte Precipitation Analysis (TMPA): Quasi-global, multiyear combined-sensor precipitation estimates and fine scales. J. Hydrometeorol. 2007, 8, 38–55. [Google Scholar] [CrossRef]
  13. Miller, J.R. A climatological Z-R relationship for convective storms in the northern Great Plains. In Proceedings of the 15th Radar Meteorology Conference, Champaign-Urbana, IL, USA, 10–12 October 1972; pp. 153–154. [Google Scholar]
  14. Krajewski, W.F.; Smith, J.A. On the estimation of climatological Z-R relationships. J. Appl. Meteorol. Climatol. 1991, 30, 1436–1445. [Google Scholar] [CrossRef]
  15. Huffman, G.J.; Bolvin, D.T.; Braithwaite, D.; Hsu, K.; Joyce, R.; Kidd, C.; Nelkin, E.J.; Sorooshian, S.; Tan, J.; Xie, P. Algorithm Theoretical Basis Document (ATBD) Version 06 NASA Global Precipitation Measurement (GPM) Integrated Multi-Satellite Retrievals for GPM (IMERG), National Aeronautics and Space Administration. 2020. Available online: https://gpm.nasa.gov/sites/default/files/2020-10/IMERG_doc_201006.pdf (accessed on 28 July 2022).
  16. Tan, J.; Petersen, W.A.; Tokay, A. A novel approach to identify sources of errors in IMERG for GPM ground validation. J. Hydrometeorol. 2016, 17, 2477–2491. [Google Scholar] [CrossRef]
  17. Yamamoto, M.K.; Kubota, T. Development of rainfall normalization module for GSMaP microwave imagers and sounders. In Proceedings of the International Geoscience and Remote Sensing Symposium, Waikoloa, HI, USA, 26 September–2 October 2020; pp. 3611–3614. [Google Scholar]
  18. Kubota, T.; Aonashi, K.; Ushio, T.; Shige, S.; Takayabu, Y.N.; Kachi, M.; Arai, Y.; Tashima, T.; Masaki, T.; Kawamoto, N.; et al. Global Satellite Mapping of Precipitation (GSMaP) Products in the GPM Era. In Satellite Precipitation Measurement; Levizzani, V., Kidd, C., Kirschbaum, D., Kummerow, C., Nakamura, K., Turk, J., Eds.; Advances in Global Change Research 67; Springer: Berlin/Heidelberg, Germany, 2020; pp. 355–373. [Google Scholar] [CrossRef]
  19. Yamamoto, M.K.; Shige, S. Implementation of an orographic/nonorographic rainfall classification scheme in the GSMaP algorithm for microwave radiometers. Atmos. Res. 2015, 163, 36–47. [Google Scholar] [CrossRef]
  20. Brief Description of GSMaP Version 04/Algorithm Version 7. Available online: https://www.eorc.jaxa.jp/GPM/doc/product_info/release_note_gsmapv04-v7_en.pdf (accessed on 28 July 2022).
  21. Seto, S.; Takahashi, N.; Iguchi, T. Rain/no-rain classification method for microwave radiometer observations over land using statistical information for brightness temperature under no-rain conditions. J. Appl. Meteorol. Climatol. 2005, 44, 1243–1259. [Google Scholar] [CrossRef] [Green Version]
  22. Olson, W.S. GPM Combined Radar-Radiometer Algorithm Team: GPM Combined Radar-Radiometer Precipitation Algorithm Theoretical Basis Document (Version 5). 2018. Available online: https://gpm.nasa.gov/sites/default/files/2020-05/Combined_algorithm_ATBD.V05.pdf (accessed on 28 July 2022).
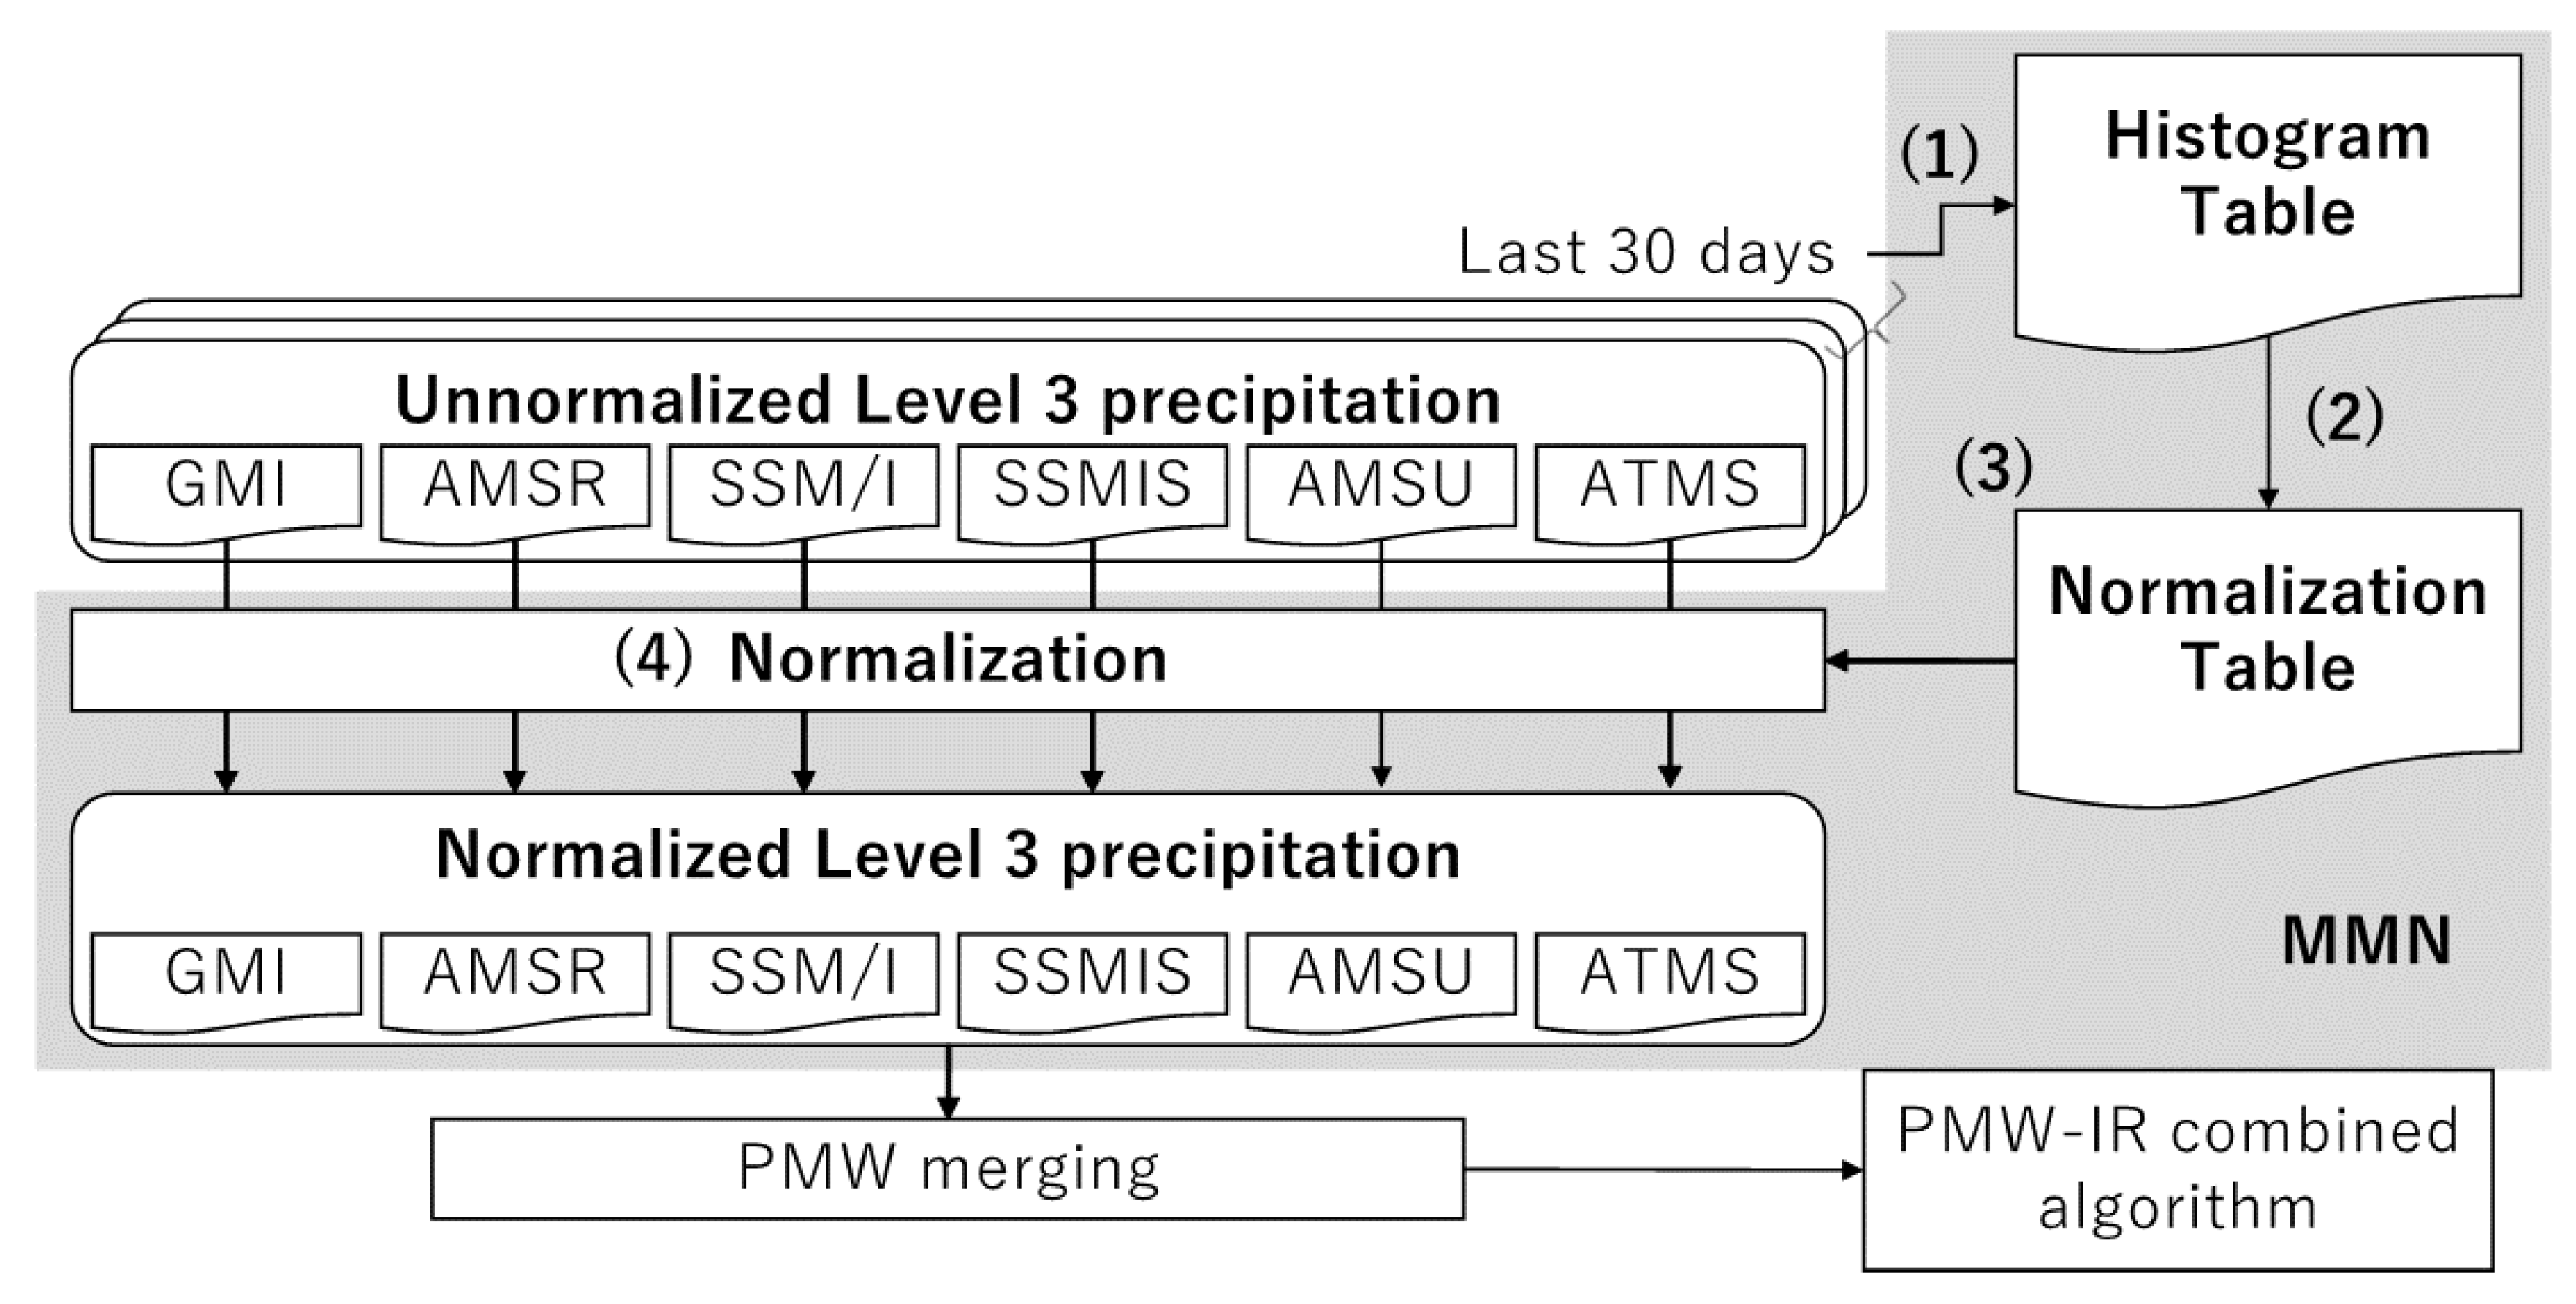
Figure 1. Process flowchart of the MMN module. Numbered list corresponds to the steps in Section 3.1.
Remotesensing 14 04445 g001
Figure 2. Cumulative distribution function of rainfall in July 2014 in (a) 50°–55°N and (b) 5°–10°N over ocean. (c,d) are the same as (a,b) except for over land.
Remotesensing 14 04445 g002
Figure 3. Relationship of the rain rate before the MMN correction (x-axis) and the rain rate difference from the corrected to uncorrected (y-axis) MMN. in July 2014 in (a) 50°–55°N and (b) 5°–10°N over ocean. (c,d) are the same as (a,b) except for over land.
Remotesensing 14 04445 g003
Figure 4. Zonal mean rainfall amount of matchup between target PMW sensors (named in each figure) and COR_GMI (black line) before (blue line) and after (red line) the MMN correction over the ocean.
Remotesensing 14 04445 g004
Figure 5. The same as Figure 4 except for over land.
Remotesensing 14 04445 g005
Figure 6. Monthly rainfall difference in July 2014 between (a) F16_MIS before MMN correction and COR_GMI, (c) F16_MIS after MMN correction and COR_GMI, and (e) F16_MIS before and after MMN correction. (b,d,f) are the same as (a,c,e), except for N18_MHS.
Remotesensing 14 04445 g006
Table 1. Specifications of PMW sensor.
Freq.GMITMI,
AMSR
SSM/ISSMISAMSU,
MHS, ATMS
10 GHz
19 GHz
23/31 GHz
37 GHz
85 GHz
>100 GHz
Scan methodConicalCross-track
Table 2. MBE scores for target PMW target sensors against COR_GMI in April–October 2014. Bold numbers indicate improved scores (uncorrected) and after (corrected) MMN correction.
SensorSEALND
UncorrectedCorrectedUncorrectedCorrected
F16_MIS−0.037−0.0120.001−0.003
F17_MIS−0.034−0.005−0.019−0.006
F18_MIS−0.0270.004−0.0100.006
MTA_MHS−0.022−0.0090.0280.017
MTB_MHS−0.021−0.0050.0320.027
N18_MHS−0.024−0.0090.0300.002
N19_MHS−0.031−0.0130.0260.011
NPP_ATS−0.034−0.0150.0140.010
Table 3. The same as Table 2 except for RMSE.
SensorSEALND
UncorrectedCorrectedUncorrectedCorrected
F16_MIS0.6650.8340.6770.671
F17_MIS0.5840.7520.6440.641
F18_MIS0.7090.9500.6610.673
MTA_MHS0.5500.5750.7320.718
MTB_MHS0.5510.5850.7580.782
N18_MHS0.5210.5540.8280.791
N19_MHS0.5160.5460.8370.828
NPP_ATS0.5170.5350.7340.740
Table 4. The same as Table 2 except for CC.
SensorSEALND
UncorrectedCorrectedUncorrectedCorrected
F16_MIS0.5870.5930.5870.598
F17_MIS0.6330.6340.6540.656
F18_MIS0.6300.6320.6020.601
MTA_MHS0.6840.6740.5800.578
MTB_MHS0.6560.6520.5970.582
N18_MHS0.6800.6690.5610.567
N19_MHS0.6710.6600.5670.560
NPP_ATS0.6480.6440.5030.504
Publisher’s Note: MDPI stays neutral with regard to jurisdictional claims in published maps and institutional affiliations.