Review

Remote Sensing Precursors Analysis for Giant Landslides

1
State Key Laboratory of Resources and Environmental Information System, Institute of Geographic Sciences and Natural Resources Research, Chinese Academy of Sciences, Beijing 100101, China
2
School of Geological Engineering and Geomatics, Chang’an University, Xi’an 710064, China
3
University of Chinese Academy of Sciences, Beijing 100049, China
*
Author to whom correspondence should be addressed.
Remote Sens. 2022, 14(17), 4399; https://doi.org/10.3390/rs14174399
Submission received: 4 July 2022 / Revised: 27 August 2022 / Accepted: 30 August 2022 / Published: 4 September 2022
(This article belongs to the Special Issue Geological Applications of Remote Sensing and Photogrammetry)

Abstract

:
Monitoring and early warning systems for landslides are urgently needed worldwide to effectively reduce the losses of life and property caused by these natural disasters. Detecting the precursors of giant landslides constitutes the premise of landslide monitoring and early warning, and remote sensing is a powerful means to achieve this goal. In this work, we aim to summarize the basic types and evolutionary principles of giant landslide precursors, describe the remote sensing methods capable of identifying those precursors, and present typical cases of related sliding. Based on a review of the literature and an analysis of remote sensing imagery, the three main types of remote sensing techniques for capturing the geomorphological, geotechnical, and geoenvironmental precursors of giant landslides are optical, synthetic aperture radar (SAR), and thermal infrared methods, respectively. Time-series optical remote sensing data from medium-resolution satellites can be used to obtain abundant information on geomorphological changes, such as the extension of cracks and erosion ditches, and band algebraic analysis, image enhancement, and segmentation techniques are valuable for focusing on the locations of geomorphological landslide precursors. SAR sensors have the ability to monitor the slight slope deformation caused by unfavorable geological structures and can provide precursor information on imminent failure several days before a landslide; furthermore, persistent scatterer interferometric SAR has significant advantages in large-scale surface displacement monitoring. Thermal infrared imagery can identify landslide precursors by monitoring geoenvironmental information, especially in permafrost regions where glaciers are widely distributed; the reason may be that freeze–thaw cycles and snowmelt caused by increased temperatures affect the stability of the surface. Optical, SAR, and thermal remote sensing all exhibit unique advantages and play an essential role in the identification of giant landslide precursors. The combined application of these three remote sensing technologies to obtain the synthetic geomorphological, geotechnical, and geoenvironmental precursors of giant landslides would greatly promote the development of landslide early warning systems.

1. Introduction

Landslides constitute major natural hazards that cause tremendous “direct” losses, namely, losses of life and damage to buildings, properties, and infrastructures [1,2,3]. In addition, landslides have relevant “indirect” costs on society encompassing losses of productivity, reductions in the value of real estate, lost tax revenue, and other economic impacts [4,5]. Unfortunately, present-day landslide disasters still wreak havoc on human life and property, and landslides will inevitably continue to do so well into the future [6]. Significantly, giant landslides can cause the most tragic and irrecoverable losses and damages due to the enormous scale and complex dynamical mechanisms. Here, a “giant landslide” represents some large mass movement occurring in some geological moments caused by engineering activities, heavy rainfall, or strong earthquakes [7,8]. The areal extent of a giant landslide can be defined to a greater or lesser extent, and the landslide volume may range from tens to thousands of cubic kilometers [9]. Accordingly, to effectively reduce the human and economic losses attributable to landslide disasters, there is an immediate need to monitor and provide early warnings of landslides worldwide [10], for which we firmly assert that it is crucial to employ various methods to improve the coverage and accuracy of landslide early warning systems.
To more effectively monitor landslides and warn communities of their occurrence, the following issues need to be considered: Will a landslide occur at a certain location (Figure 1)? Are there any detectable features that would indicate whether a landslide could occur? How can these features be captured? Disasters do not occur suddenly; however, antecedent phenomena can often be observed before disaster strikes. Therefore, the application of any method to detect precursor information (such as slope movements) before the occurrence of a giant landslide is the premise of landslide monitoring [11,12]. In particular, innovative remote sensing technologies can be used to detect landslide precursors, with higher accuracy for large landslides. This will promote landslide monitoring and early warning, and mitigate landslide disaster losses [13,14].
Landslide precursors are defined as particular features or phenomena that indicate whether a slope mass is sliding in a time series and whether that slope has a high possibility of triggering a landslide. Such precursors may be landslide deformation variables [15], a change in pore water pressure [16], the slope characteristics over the long-term formation process of landslides, and so on. Generally, landslide precursors can be divided into several types according to the contributing factors. Examples include geomorphological precursors (scarp extension and rupture, cracking, and erosion ditches), geological precursors (lithology and geological structure), geotechnical precursors (slope deformation and changes in the cover characteristics), hydrological precursors (changes in the water color, flow speed, and water content), environmental precursors (thermal changes such as temperature and snow line variations), and other precursors, such as the emission of seismic waves (Table 1).
All the abovementioned landslide precursors can be captured by various methods (Table 1). Nevertheless, two main kinds of methods are employed to identify landslide precursors. The first kind of method is traditional field surveying or ground station monitoring, in which measurement instruments are deployed on the slope to obtain parameters such as the inclination and water pressure. However, traditional techniques are usually implemented at the local scale, i.e., on individual slopes [17,18,19,20,21,22], and therefore, are time-consuming. Moreover, traditional surveying and monitoring require expert knowledge on the hazard, so the results remain highly subjective [23,24].
The second kind of technique, namely, remote sensing, has been an efficient way to monitor slope movements over vast mountainous regions for many years [13,14]. Satellite sensors have been used to measure the variations in the spectral signature of the land surface to delineate geomorphological units and structure types and to infer the occurrence of mechanical processes without necessarily measuring displacements, deformations, or applied forces directly [25,26,27,28]. Remote sensing data, which are processed and analyzed manually, semiautomatically, or automatically, can be utilized to extract landslide precursor information and have numerous advantages related to their wide coverage [29,30], sustainability, and stability, and to the abundance of data sources [31]. More importantly, landslide precursors are dynamic phenomena and thus require a clear record of the whole sliding process. In addition, landslides often occur in areas with complex terrain conditions and harsh environments, making it difficult to obtain landslide data [32]. Therefore, in recent years, remote sensing has become an important method for conducting landslide research [33,34] and obtaining landslide precursor information [35,36].
There are three major types of remote sensing techniques according to their electromagnetic spectra (Table 1): optical [37], microwave [14], and thermal [38]. Generally, optical, synthetic aperture radar (SAR), and infrared remote sensing are best suited to capturing geomorphological precursors, geotechnical precursors, and thermal environment precursors of giant landslides, respectively. Accordingly, this paper discusses the applications of remote sensing techniques in the analysis of these three particular types of landslide precursors. Studies on landslide monitoring and precursor identification are reviewed, and remote sensing image data are analyzed. On this basis, the basic theories, main methods of capture, and representative cases of these three main landslide precursors are introduced. We further compared the advantages, limitations, and priority applications of these three remote sensing techniques for future giant landslide analysis.

2. Geomorphological Precursors

2.1. Theories

The features and structural patterns of landforms on the Earth’s surface can reveal the origins of geomorphological processes and the mechanisms responsible for their occurrence. Surface discontinuities (such as erosion ditches, cracks, and ruptures) observed in rocks and sediments have proven to be valuable indicators of the deformation histories and stress patterns of slopes and have been shown to exert considerable influences on the slope stability [38,39,40,41,42].
Structural discontinuities in hard rocks, soft rocks, and sediments yield different types of landslide precursor information. On hard rock slopes, structural discontinuities (e.g., ruptures) can be analyzed to characterize potentially unstable areas [43,44,45,46,47,48,49]. In contrast, the analysis of surface cracks in soft rock slopes and sediments may indicate the development of future failures [50,51,52,53,54], so such cracks are often considered a geoindicator of the activity stage of a landslide. The characteristics of surface erosion ditches in sediments also influence water infiltration and drainage processes, which in turn affect the groundwater system and the kinematic responses of slopes to hydrological events [55,56,57]. All of the above information provided by structural discontinuities can be leveraged as indicators of slope sliding and thus as precursors of landslides.
Therefore, the distribution characteristics of surface discontinuities in the slope are important geomorphological precursors of giant landslides. Generally, erosion ditches develop in the slope before a landslide occurs, and when the slope mass slowly moves downward, cracks are generated at certain locations across the slope.

2.2. Identification Methods

Optical remote sensing data are the most frequent source of information for detecting the geomorphological precursors of landslides, as such data yield abundant information on the geometric shapes and changes in landforms. Optical imagery can also provide long time-series information regarding the evolution of ditches and cracks, whose evolution characteristics can be applied to speculate on the type and size of possible landslides, as well as the extent and magnitude of the movement [58,59]. High-resolution remote sensing images have good optical properties and thus can provide clear details of geomorphological landslide precursors. In practical applications, specific feature indicators are used to highlight the monitored geomorphological precursors based on the surface characteristics of the target area. Characteristic indices constructed by combining different bands of remote sensing data with topographic landslide features are often used to extract geomorphological precursors [60,61]. In this context, due to its advantages of a long time span [62,63] and the ease of obtaining continuous time-series data [63,64], medium-resolution remote sensing often can provide more spectral information than high-resolution remote sensing data, and the combination of spectral features with algebraic band operations can efficiently distinguish landslide geomorphological precursors and other geomorphic features. Consequently, Landsat, Sentinel-2, and other medium-resolution remote sensing satellites represent important data sources for acquiring time-series data [65,66,67] and continue to play an important role in disaster identification [68,69]. Generally, medium-resolution remote sensing images are essential for identifying the long-term geomorphological precursors of giant landslides [18].
The geomorphological precursors of landslides and the surrounding environment have different morphological characteristics and radiation intensities, which are expressed as significantly different spectral features on optical remote sensing images. In the extraction of landslide precursor information, spatial clustering and feature discrimination are first carried out based on such differences in the feature radiation intensity, and suitable image data and wavebands are selected based on key feature category characteristics. The relationships between the spectral features of the landslide precursors and the surrounding environment are then analyzed to extract landslide precursors based on spectral features. However, as the geotechnical compositions of different areas where landslides may occur often vary substantially, it is difficult to directly characterize landslide precursors with a single spectral feature. Moreover, optical remote sensing image data can exhibit significant signal differences due to differences in the satellite imaging angles and solar altitude angles, and mountainous areas can be affected by dense, low-lying clouds that can affect the interpretation of remote sensing images. Therefore, image enhancement should be implemented to increase the contrast between the target area and other features for identifying landslide precursors in highland or mountainous areas. The multidimensional information of remote sensing images is also useful for improving the detectability of landslide precursor features and the effectiveness of feature information extraction. Finally, the differences between landslide precursors and the surrounding environment in terms of grayscale features, spectral features, and time-series features are analyzed to achieve image segmentation and extract landslide precursor information.
Image enhancement techniques commonly include image algebraic and mathematical morphological methods. For areas where the surface is dominated by vegetation, normalized difference vegetation index (NDVI) [70] images are obtained by algebraic waveband operations, providing an exponential threshold constraint for the discrimination of landslide precursor information and effectively improving the recognition of landslide precursors. For multiband remote sensing data, principal component analysis and independent variable analysis methods are often used to select the most appropriate bands, and the optimal band combination is then obtained through algebraic band operations, which also enhance images to a certain extent. The aim of image segmentation is to obtain highly homogeneous images of areas. Using such images as basic discriminators, images based on the NDVI or other indices are used as constraints to obtain potential landslide precursor areas. A number of commonly used image segmentation methods have been developed with different emphases. For example, K-means segmentation works well for single-band segmentation where feature patches do not intersect, whereas the watershed algorithm is suitable for more complex images, but is more sensitive to noise. In contrast, the mean-shift algorithm for single-band segmentation yields a mean-value segmentation patch even when the total number of segmented pixels is small. Therefore, the mean-shift image segmentation algorithm can ensure a high degree of homogeneity within the segmented patches with a reasonable segmentation speed, which is advantageous for the identification of landslide precursors under the constraint of a maximum number of pixels per segmented patch.

2.3. Case Studies

Geomorphological precursor information, such as erosion ditches, cracks, ruptures, land cover changes, and variations in the optical properties of the land surface, can be clearly observed before the occurrence of a landslide and, therefore, can be effectively detected by optical remote sensing, as shown in the actual case study below.

2.3.1. Cracks

The Baige landslide occurred at night on 10 October 2018, on the west bank of the Jinsha River flowing along the southeastern margin of the Qinghai–Tibet Plateau (31°4′57″N, 98°42′7″E) (for details of the Baige landslide, see Section 3.3.2). Four optical images covering the Baige landslide were purchased by Li et al. [71], including a Sentinel-2 medium-resolution multispectral image taken on 21 May 2018, Gaofen-2 (GF-2) satellite images acquired before the landslide on 5 August 2017 and 28 February 2018, and a SuperView image of the scene after the first collapse. When comparing the optical satellite images of the landslide area before and after the collapse event, obvious changes in tensile cracking were observed. It was speculated that the fractured rock mass was damaged by tectonic activity, after which the slope became unstable under the combined influence of rainfall, weathering, and fluvial erosion, causing the slope to initiate sliding [72,73,74,75,76]. This case study demonstrates that monitoring and analyzing the evolution of tensile cracks are helpful for discerning the slip stage of a landslide mass.
The Xinmo landslide, named after the county in which it occurred (Maoxian County) (32°03′58″ N, 103°39′02″ E), occurred at 5:45 a.m. on 24 June 2017, approximately 50 km from the Xinmo village. This landslide resulted in tremendous losses of life and property. The landslide elevation difference was 1200 m, the horizontal distance of the sliding surface was 2800 m, and the cumulative total volume of the landslide mass was approximately 18 × 106 m3 [11,77,78,79]. An analysis of an IKONOS remote sensing image with a resolution of 1.0 m taken in July 2005 (approximately 3 years before the Wenchuan Ms 8.0 earthquake occurred) found two dominant cracks in the sliding source zone near the ridge top. One crack extended tens of meters, and the joints were continuously distributed, forming laterally separated landslide boundaries. The other crack formed multiple dominant tectonic or brittle shear zones caused by the gravitational collapse of the slope and may have controlled the exit behavior of the landslide [77]. A separate analysis of a Sentinel-2 remote sensing image acquired on 8 August 2008, three months after the Wenchuan Ms 8.0 earthquake, revealed the presence of densely distributed cracks at the ridge top. Three cracks were almost parallel and oriented along the sliding direction of the Xinmo landslide; hence, these cracks may have easily developed into shear fractures during the landslide. A fourth crack was discovered parallel to the trailing edge of the landslide and could easily have developed into a tensile crack during the sliding event. Signs of rocks moving down the fourth crack in the sliding source area at the ridge top have been noted [80]. Another IKONOS remote sensing image with a resolution of 1.0 m taken in June 2013 (five years after the Wenchuan earthquake) was analyzed only to find that the crack structure was similar to that before the Wenchuan Ms 8.0 earthquake, with two fractures distributed in the sliding source area; however, a new system of densely distributed longitudinal cracks had developed in the middle of the sliding source area parallel to the slope aspect, which greatly increased the fragmentation of the rock mass. An analysis of a GF-2 remote sensing image with a resolution of 0.8 m taken in April 2017 (two months before the landslide) indicated that, in comparison with the previous images, the slope surface in the sliding source area was obviously looser and that the cracks were further stretched, indicating local slippage at the surface. In addition, obvious cracks were shown on the east and west sides of the ridge top: the cracks on the west side had obviously been truncated by other fractures, and those on the east side tended to extend downward along the slope. Thirty-six hours before the Xinmo landslide, special survey photos of geological disasters in the Xinmo village showed that the cracks in the sliding source area had developed into a bulging fracture zone. These studies fully demonstrated the precursor information of an imminent landslide.
Based on the analysis of optical remote sensing imagery, this research not only identified the precursors (cracks) of landslides that have occurred, but also identified and monitored those of landslides that did not (but may be about to) occur. Landsat remote sensing images were used to monitor the changes in the cracks on a slope next to a highway on the Southeastern Qinghai–Tibet Plateau for five years (Figure 2). The successive high-definition remote sensing images of the same slope show the distribution and development of these cracks. Before 2015, the crack traces were relatively inconspicuous, while the image on 16 April 2015, demonstrates obvious tensile cracks on the slope (Figure 2e). In particular, in the image taken on 13 May 2018, the whole unstable slope appears to be gradually moving toward the road, and the tensile cracks have gradually become stretched and enlarged. At the same time, starting in 2015, at the base of the landslide (at the foot of the slope), a bulging fracture zone formed as a result of the sliding-induced shear extrusion of the slope and gradually enlarged (Figure 2a and Figure 3b–d). Across the entire time sequence, crack precursors gradually appeared and became increasingly well-defined, which means that the occurrence of a landslide may be imminent. As typical discontinuities visible at the surface, cracks are confirmed to be important indicators of slope deformation and instability, and are the main source of precursor information for giant landslides. Furthermore, this work shows that the evolution of cracks can be obtained by optical remote sensing, and the results can help predict the occurrence of giant landslides.

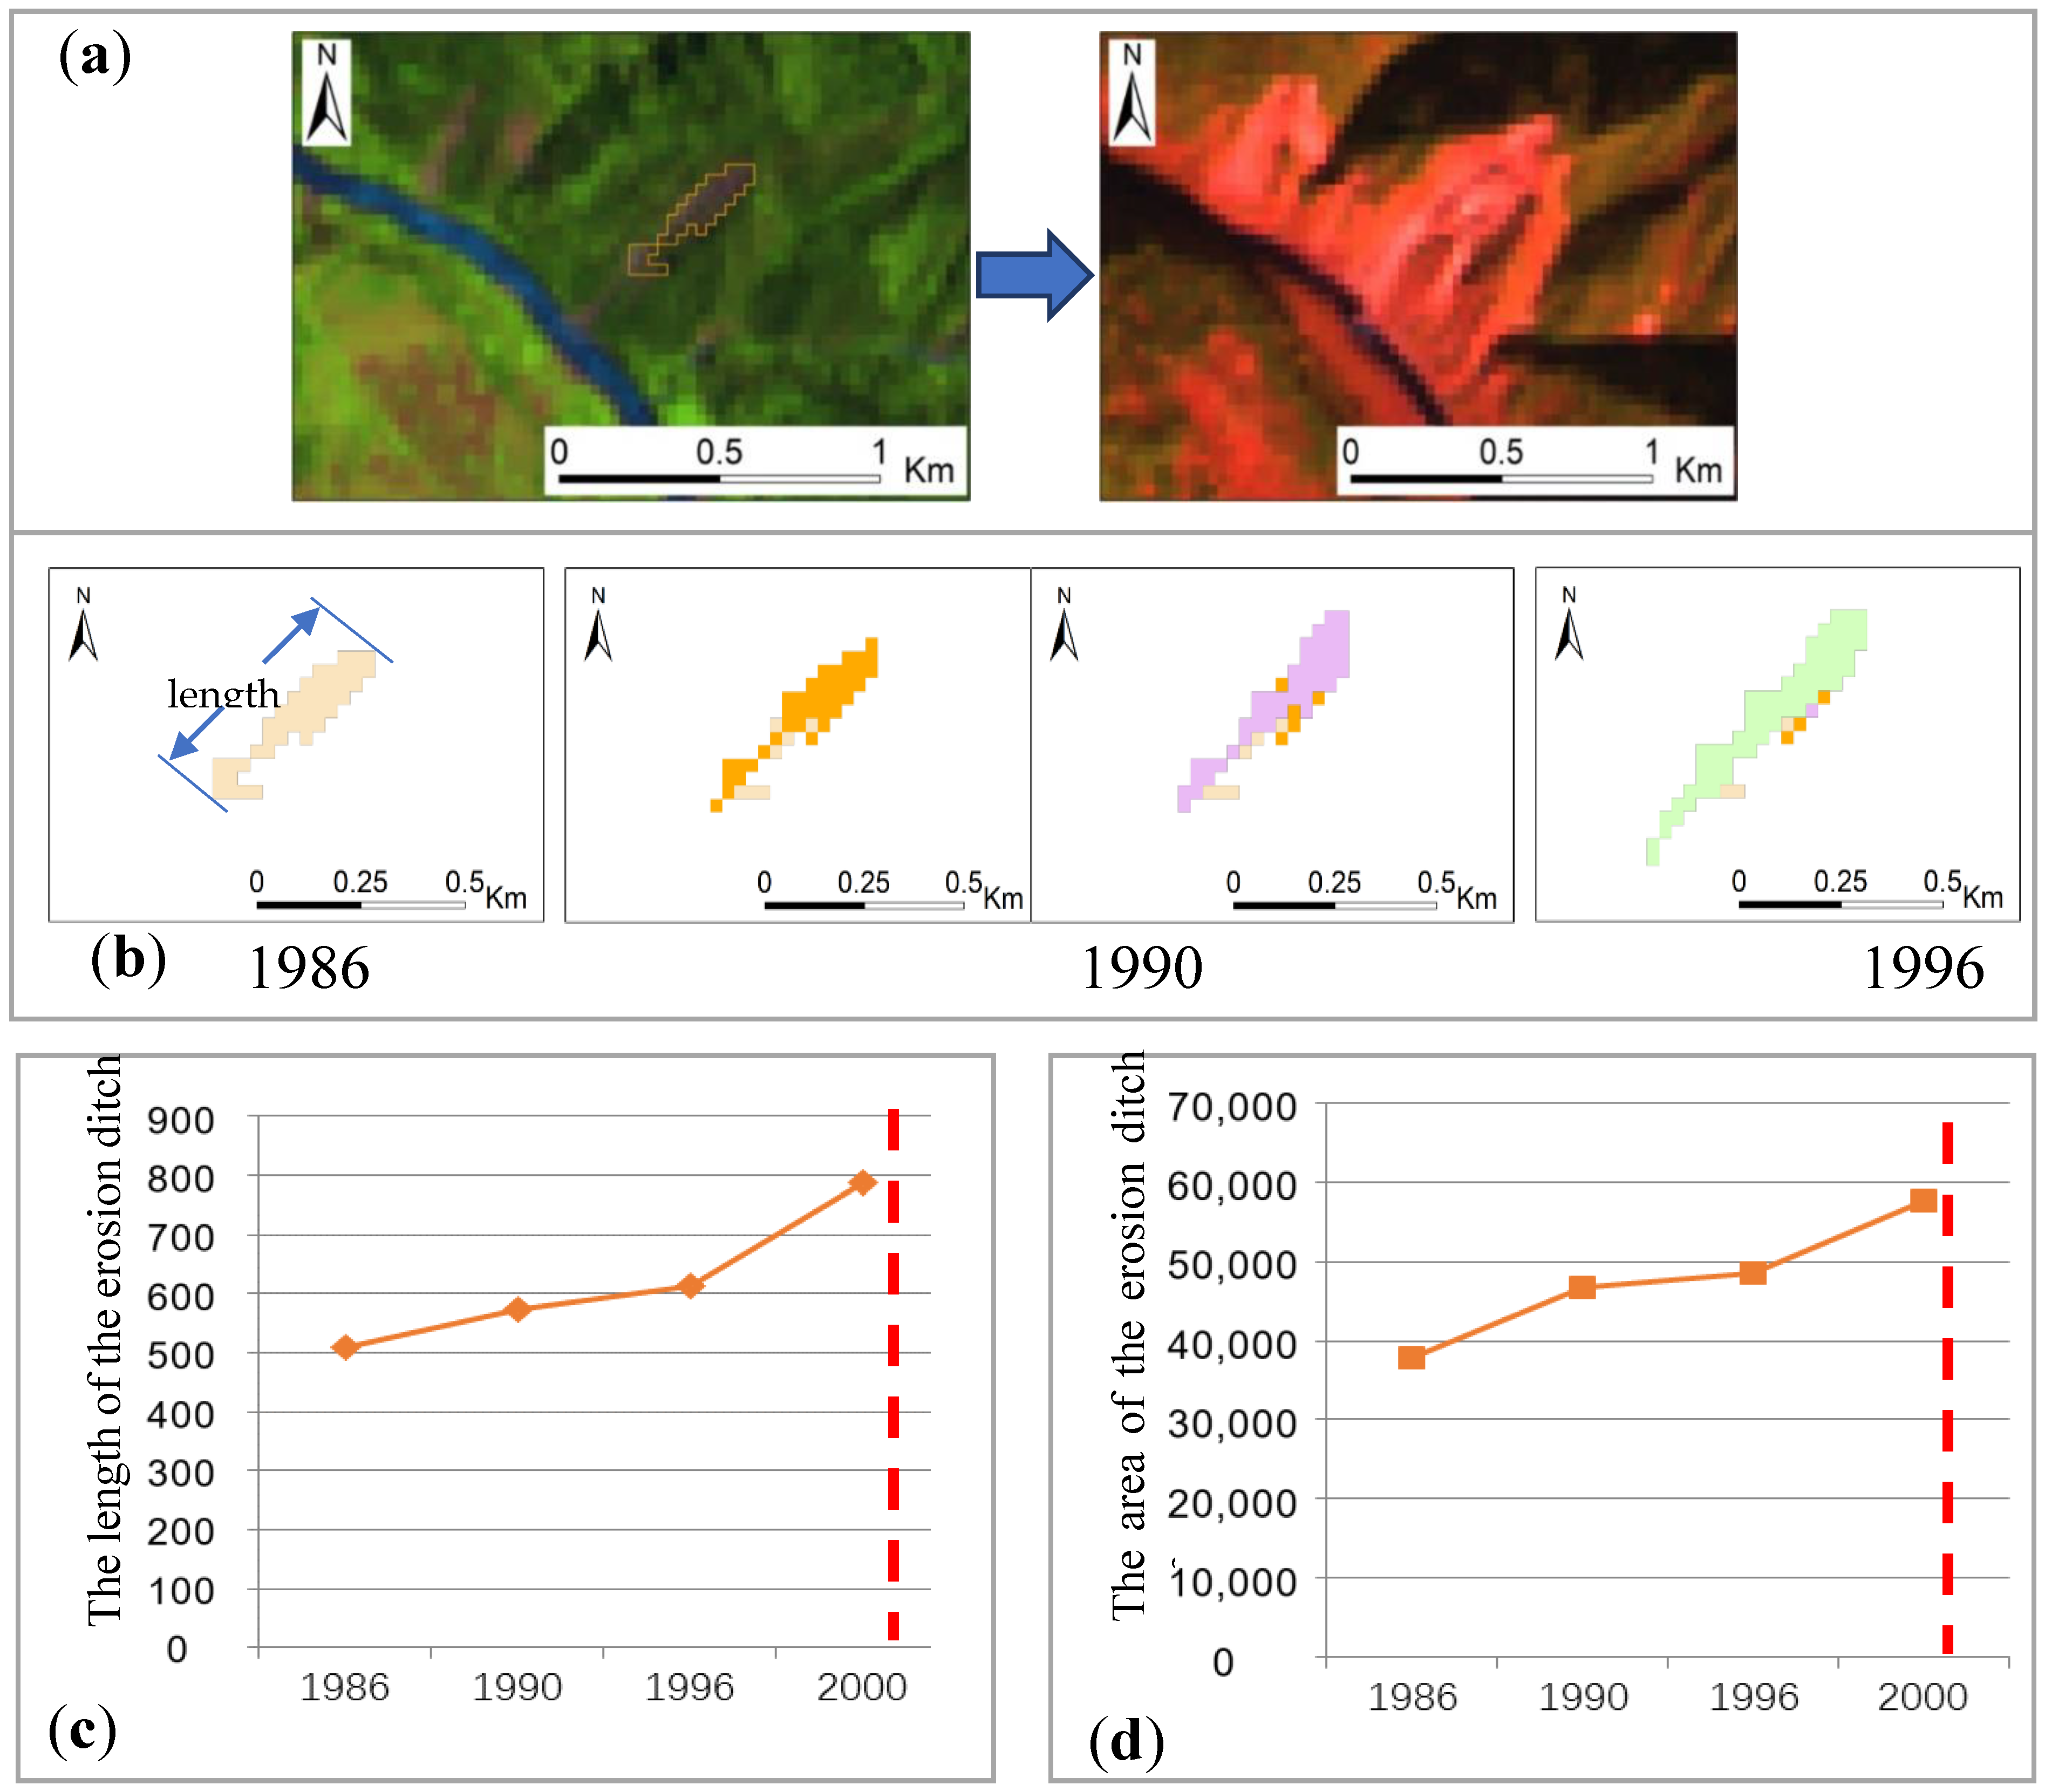
2.3.2. Erosion Ditches

As another dominant geomorphological precursor of giant landslides, erosion ditches can also be effectively detected by optical remote sensing. For example, consider the Danba landslide, which was triggered by heavy rainfall in Meilonggou Gully in Danba County, Sichuan Province, China, early in the morning on 17 June 2020. Erosion ditches obviously existed on the eastern edge of the unstable slope before the landslide occurred, and optical images showed that the unstable slope gradually moved toward the foot of the slope at a speed of approximately 3–5 cm/day before the landslide, which threatened the safety of two-thirds of the town at the foot of the slope [81,82]. Another extensive slope failure, namely, the Akatani landslide, occurred at 16:21:30 on 4 September 2011, in Nara Prefecture, Central Japan. According to accurate light detection and ranging (LiDAR)-measured topographic data, large erosion ditches existed along the southwestern edge of the landslide before it occurred [83,84,85]. These two representative landslide cases show that erosion ditches are key precursors indicating the instability of giant landslides.
Likewise, using optical imagery, we detected an obvious erosion ditch on the east bank of a river valley on the Eastern Qinghai–Tibet Plateau; this ditch has been proven to be the precursor of a landslide that has occurred (Figure 3a). As shown in Figure 3b, the evolution of this erosion ditch was investigated using Landsat remote sensing images in different periods. Remote sensing images taken in 1986, 1990, 1996, and 2000 were selected to extract multispectral data, and the NDVI was constructed to classify the images. The relationship among the shape, aspect, and topography in the image was utilized to identify the location, length, and area of the erosion ditch in different periods and to observe the changes in and development of the erosion ditch over 14 years (the detailed classification steps are described in Section 3.2). We found that the erosion ditch gradually expanded over the 14-year period. According to the location of the edge of the erosion ditch, the erosion ditch expanded slowly in the first 10 years, and the expansion was concentrated mainly on the upper edge of the ditch far from the river channel. In the last four years, however, the rate of expansion of the erosion ditch accelerated, and the expansion area was concentrated mainly at the lower edge of the ditch near the river.
The evolutionary characteristics of the erosion ditch, including the change trends of the ditch length (Figure 3c) and area (Figure 3d), were analyzed quantitatively. In 1986, 1990, 1996, and 2000, the length of the erosion ditch was 510, 572, 612, and 787 m, respectively, and the corresponding area of the erosion ditch was 37,800, 46,800, 48,600, and 57,600 m3, respectively. Both the length and the area of the erosion ditch slowly increased in the first 10 years, after which the rate of increase accelerated from 1996 to 2000. Overall, the length of the erosion ditch increased by 54.31% from 510 to 787 m over the whole 14-year period, while the area increased by 52.38% from 37,800 to 57,600 m3. These results show that the length and area of the erosion ditch increased from 1986 to 2000, which further confirms the findings from the above analysis of the erosion ditch expansion trend. The main reason for the accelerated expansion of the lower edge of the ditch in the last four years may be due to the sliding of the deposits on the upper edge of the ditch, which aggravated the load on (and further eroded) the lower edge of the ditch, thus further promoting the occurrence of the landslide.
Generally, as precursors of landslides, erosion ditches first begin as small ditches that gradually expand on either side and finally become the slope center of the landslide. The use of optical images to detect the locations and monitor the evolution of erosion ditches in landslide-prone areas is an important means to prevent giant landslides.

3. Geotechnical Precursors

3.1. Theories

The occurrence of a landslide can be triggered by many factors, but the presence of weak structural planes [86,87] and unfavorable geological structures [88,89] have been proven to be major determining factors, while external factors such as groundwater, rainfall, and disturbances of geological structures accelerate slope deformation [90,91,92,93,94]. For example, groundwater fluctuations reduce the soil strength [95,96], and excavation of the slope toe disturbs the stress balance of the soil [97]. All of these factors, especially those in a complex geological environment, may trigger the movement and deformation of the rock and soil on the slope and even cause the slope mass to slide.
Researchers assert that landslides do not occur instantaneously, but instead are formed via the gradual accumulation of energy, which gradually deforms the rock and soil material of the unstable slope [94,98]. First, small-scale deformation transpires over a period of time, following which large-scale deformation produces a giant landslide. Therefore, as precursor phenomena of landslides, geotechnical movements in the neighborhood of the ground surface, such as the deformation of the slope and changes in the cover characteristics, need to be continuously monitored and captured. This is one of the most effective ways to effectively mitigate the risks posed by giant landslides [99].

3.2. Identification Methods

The large-scale monitoring of displacements produced by geohazards first became available to researchers with the development of interferometric techniques applied to SAR data [100,101,102,103,104,105,106]. For example, Peng Liu, Zhenhong Li, and other scholars used interferometric SAR (InSAR) time-series data to monitor landslide displacements in the Badong section of the Three Gorges Project. Time-series Environmental Satellite (ENVISAT) SAR images were used to identify two significant landslides with annual deformation rates of 10–15 mm/yr. The results revealed a significant correlation between the seasonal variability of the landslides and the seasonal periodicity of the water level, which was confirmed by field experiments [107]. InSAR processing further allows the generation of digital elevation models as well as the detection and monitoring of slope movements by comparing range information (R1 and R2) gathered from a SAR sensor at two slightly different view angles or at different times. The subtle ground deformation (ΔR) can then be derived from the phase difference between the images [11,103,108].
For many years, excessively long revisit periods and the limited access to satellite radar data available for interferometric analyses limited the use of SAR sensors as a tool for monitoring ground deformations over wide areas. However, over the last decade, with the launch of new satellite constellations, the acquisition frequency has increased so much that satellite InSAR has become suitable for displacement monitoring and (under certain circumstances and for some types of phenomena) precursor detection purposes.
Moreover, conventional InSAR techniques (i.e., based on the analysis of just two acquisitions) have significantly improved. At present, an increasing number of studies are being conducted on multi-interferogram algorithms, which balance the quality of displacement measurements for spatial continuity. These techniques use long time series of SAR images to estimate and remove the atmospheric component of the interferometric phase over a sparse grid of coherent points, generally referred to as permanent or persistent scatterers [108,109,110]. Permanent scatterer interferometry (PSI), also referred to as PSInSAR, has significant advantages in large-scale surface displacement monitoring; examples of these benefits include the use of persistent scatterers, the elimination of atmospheric effects, the high accuracy of deformation measurements (on the millimeter scale), and the ability to acquire time series deformation, which considerably improve the efficiency of surface deformation monitoring. More recently, highly sophisticated PSI techniques have been shown to be capable of maximizing the spatial density of measurement points by taking advantage of different scattering mechanisms [111,112]. For example, the SqueeSAR technique, a second-generation PSInSAR algorithm, is based on the processing of long time series of coregistered SAR images acquired over the same target area from the same acquisition geometry and can more effectively obtain displacement data. To this end, the PSInSAR technique is now commonly used via time-series analysis for landslide displacement monitoring and precursor detection [5,113,114,115,116,117,118,119], and for the identification of changes in deformation rates [120] to predict the occurrence of landslides.

3.3. Case Studies

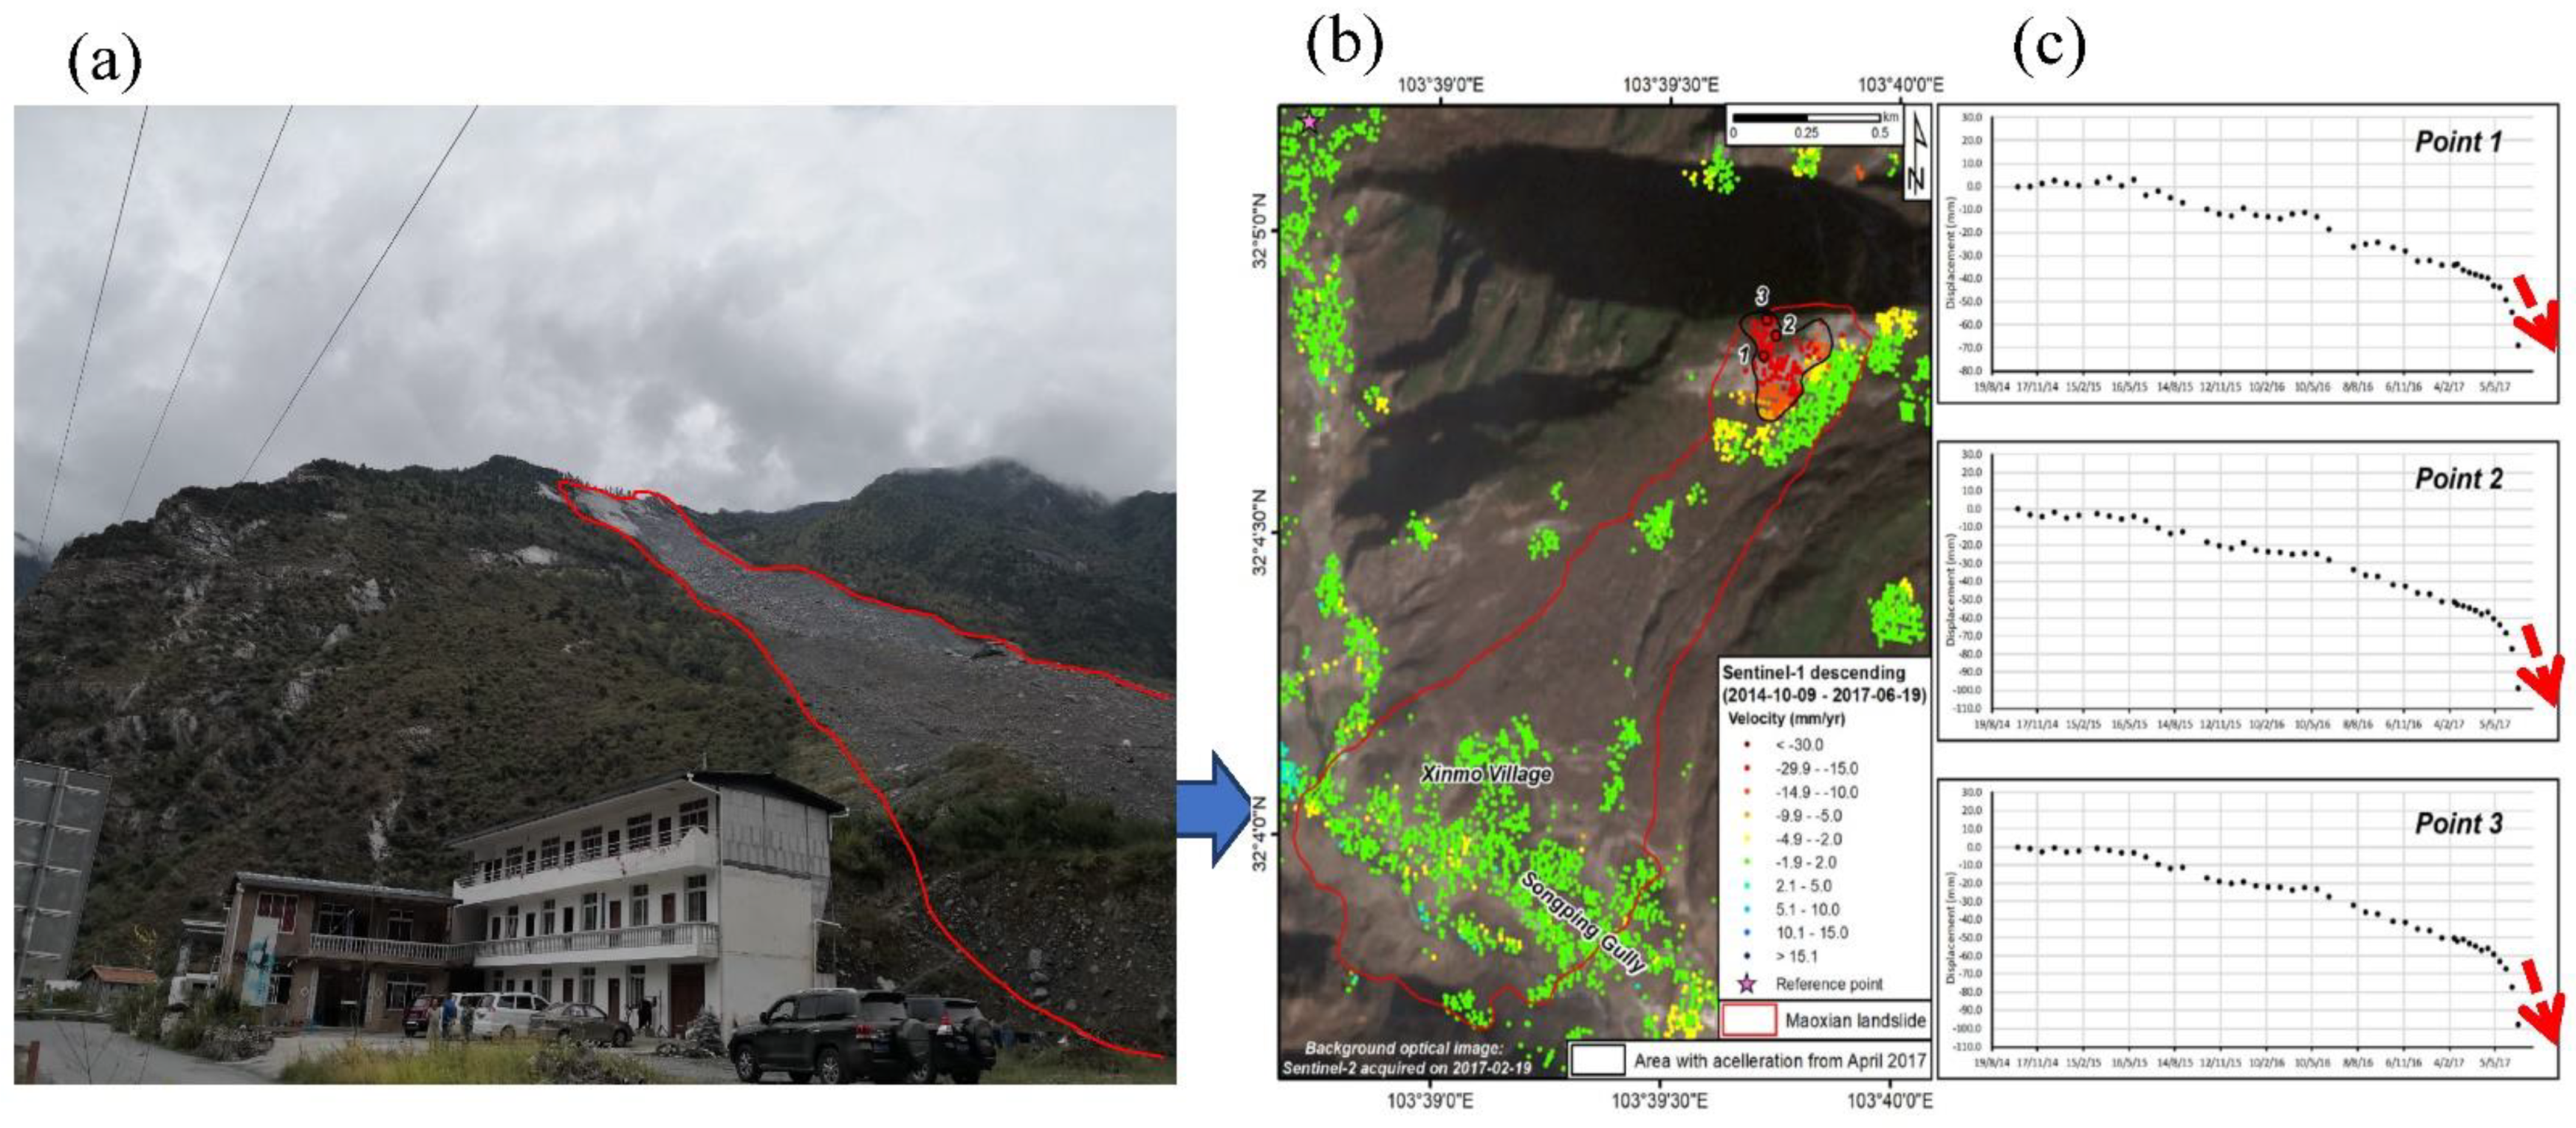
3.3.1. The Xinmo Landslide

As described in Section 3.3.2, the Xinmo landslide occurred in the Sichuan Province, China, on 24 June 2017, and caused considerable losses of life and property (Figure 4a). The Sichuan Province is notoriously prone to landslides and seismic activity, and vast stretches of land are composed of numerous unstable slopes. Hence, large-scale displacement monitoring is a valuable tool for detecting landslide precursors in this region, particularly when the site is difficult to access or there is a lack of clear precursor information, which makes the monitoring of specific features either impossible or impractical. Intrieri et al. [11] detected precursors of the Xinmo landslide with Sentinel-1 data and SqueeSAR technology to describe the main kinematic characteristics of the Xinmo landslide in relation to the prospective use of multitemporal Sentinel-1 observations for early warning purposes. The application of the SqueeSAR algorithm to Sentinel-1 data provided valuable information on ground movements before the event. In their research, displacement data were calculated with respect to a reference point located in a stable sector north of the Xinmo landslide area. Kuang et al. [121] used Sentinel-1A/B C-band time-series SAR data to analyze the prefailure surface deformation characteristics of the Xinmo landslide source area and reported that the slope deformation rate reached −30 and −18 mm/year in the descending track and the ascending track, respectively; in addition, obvious accelerations at the selected measurement points were detected before the failure occurred. Moretto et al. [122] collected 45 Sentinel-1 images from October 2014 to 19 June 2017, and used advanced differential InSAR (A-DInSAR) to observe the prefailure deformation behavior in the Xinmo landslide area; upon examining the spatial distribution and time-series change trend of the measurement points in the area, they found that there is a “likely failure window” during which slope collapse is imminent.
The area surrounding Xinmo village exhibits very low deformation rates ranging between 2.0 and 2.0 mm/year, indicating relatively stable ground conditions (green to light blue regions in Figure 4b). Nevertheless, active movements were detected in a large sector of the slope above the Xinmo village (red regions), which is interpreted as the source area of the landslide. Here, approximately 700 measurement points were identified with deformation rates exceeding several millimeters per year. In this case, considering the acquisition geometry and the orientation of the slope, the measured deformation rates are consistent with the occurrence of precursory movements over a large sector of the slope affected by the landslide that occurred on 24 June 2017. In addition to the simple mean annual velocity, the time-series displacement at each measurement point was analyzed to describe the evolution of deformation over the entire monitoring period (from 9 October 2014 to 19 June 2017), highlighting the potential for sudden acceleration that may occur [11].
To enhance the information on the changes in displacement, the time-series displacement at each measurement point on the ground deformation map was automatically analyzed to identify any changes in the deformation pattern during the 180 days preceding the landslide (from December 2016 to June 2017). This trend change analysis revealed that the deformation of a large group of monitoring points in the upper part of the Xinmo landslide gradually accelerated, beginning in April 2017, as is clearly visible in the deformation time series (Figure 4c). These results suggest that the PSI method yields results that are consistent with those of the SqueeSAR technique [123]. In the landslide source area, the block displacement rate is larger than that in other regions. If InSAR had been actively used to monitor the surface displacements over this region before the landslide, precursory information suggesting the imminent failure of the slope could have been given in the first days of June 2017 [11].

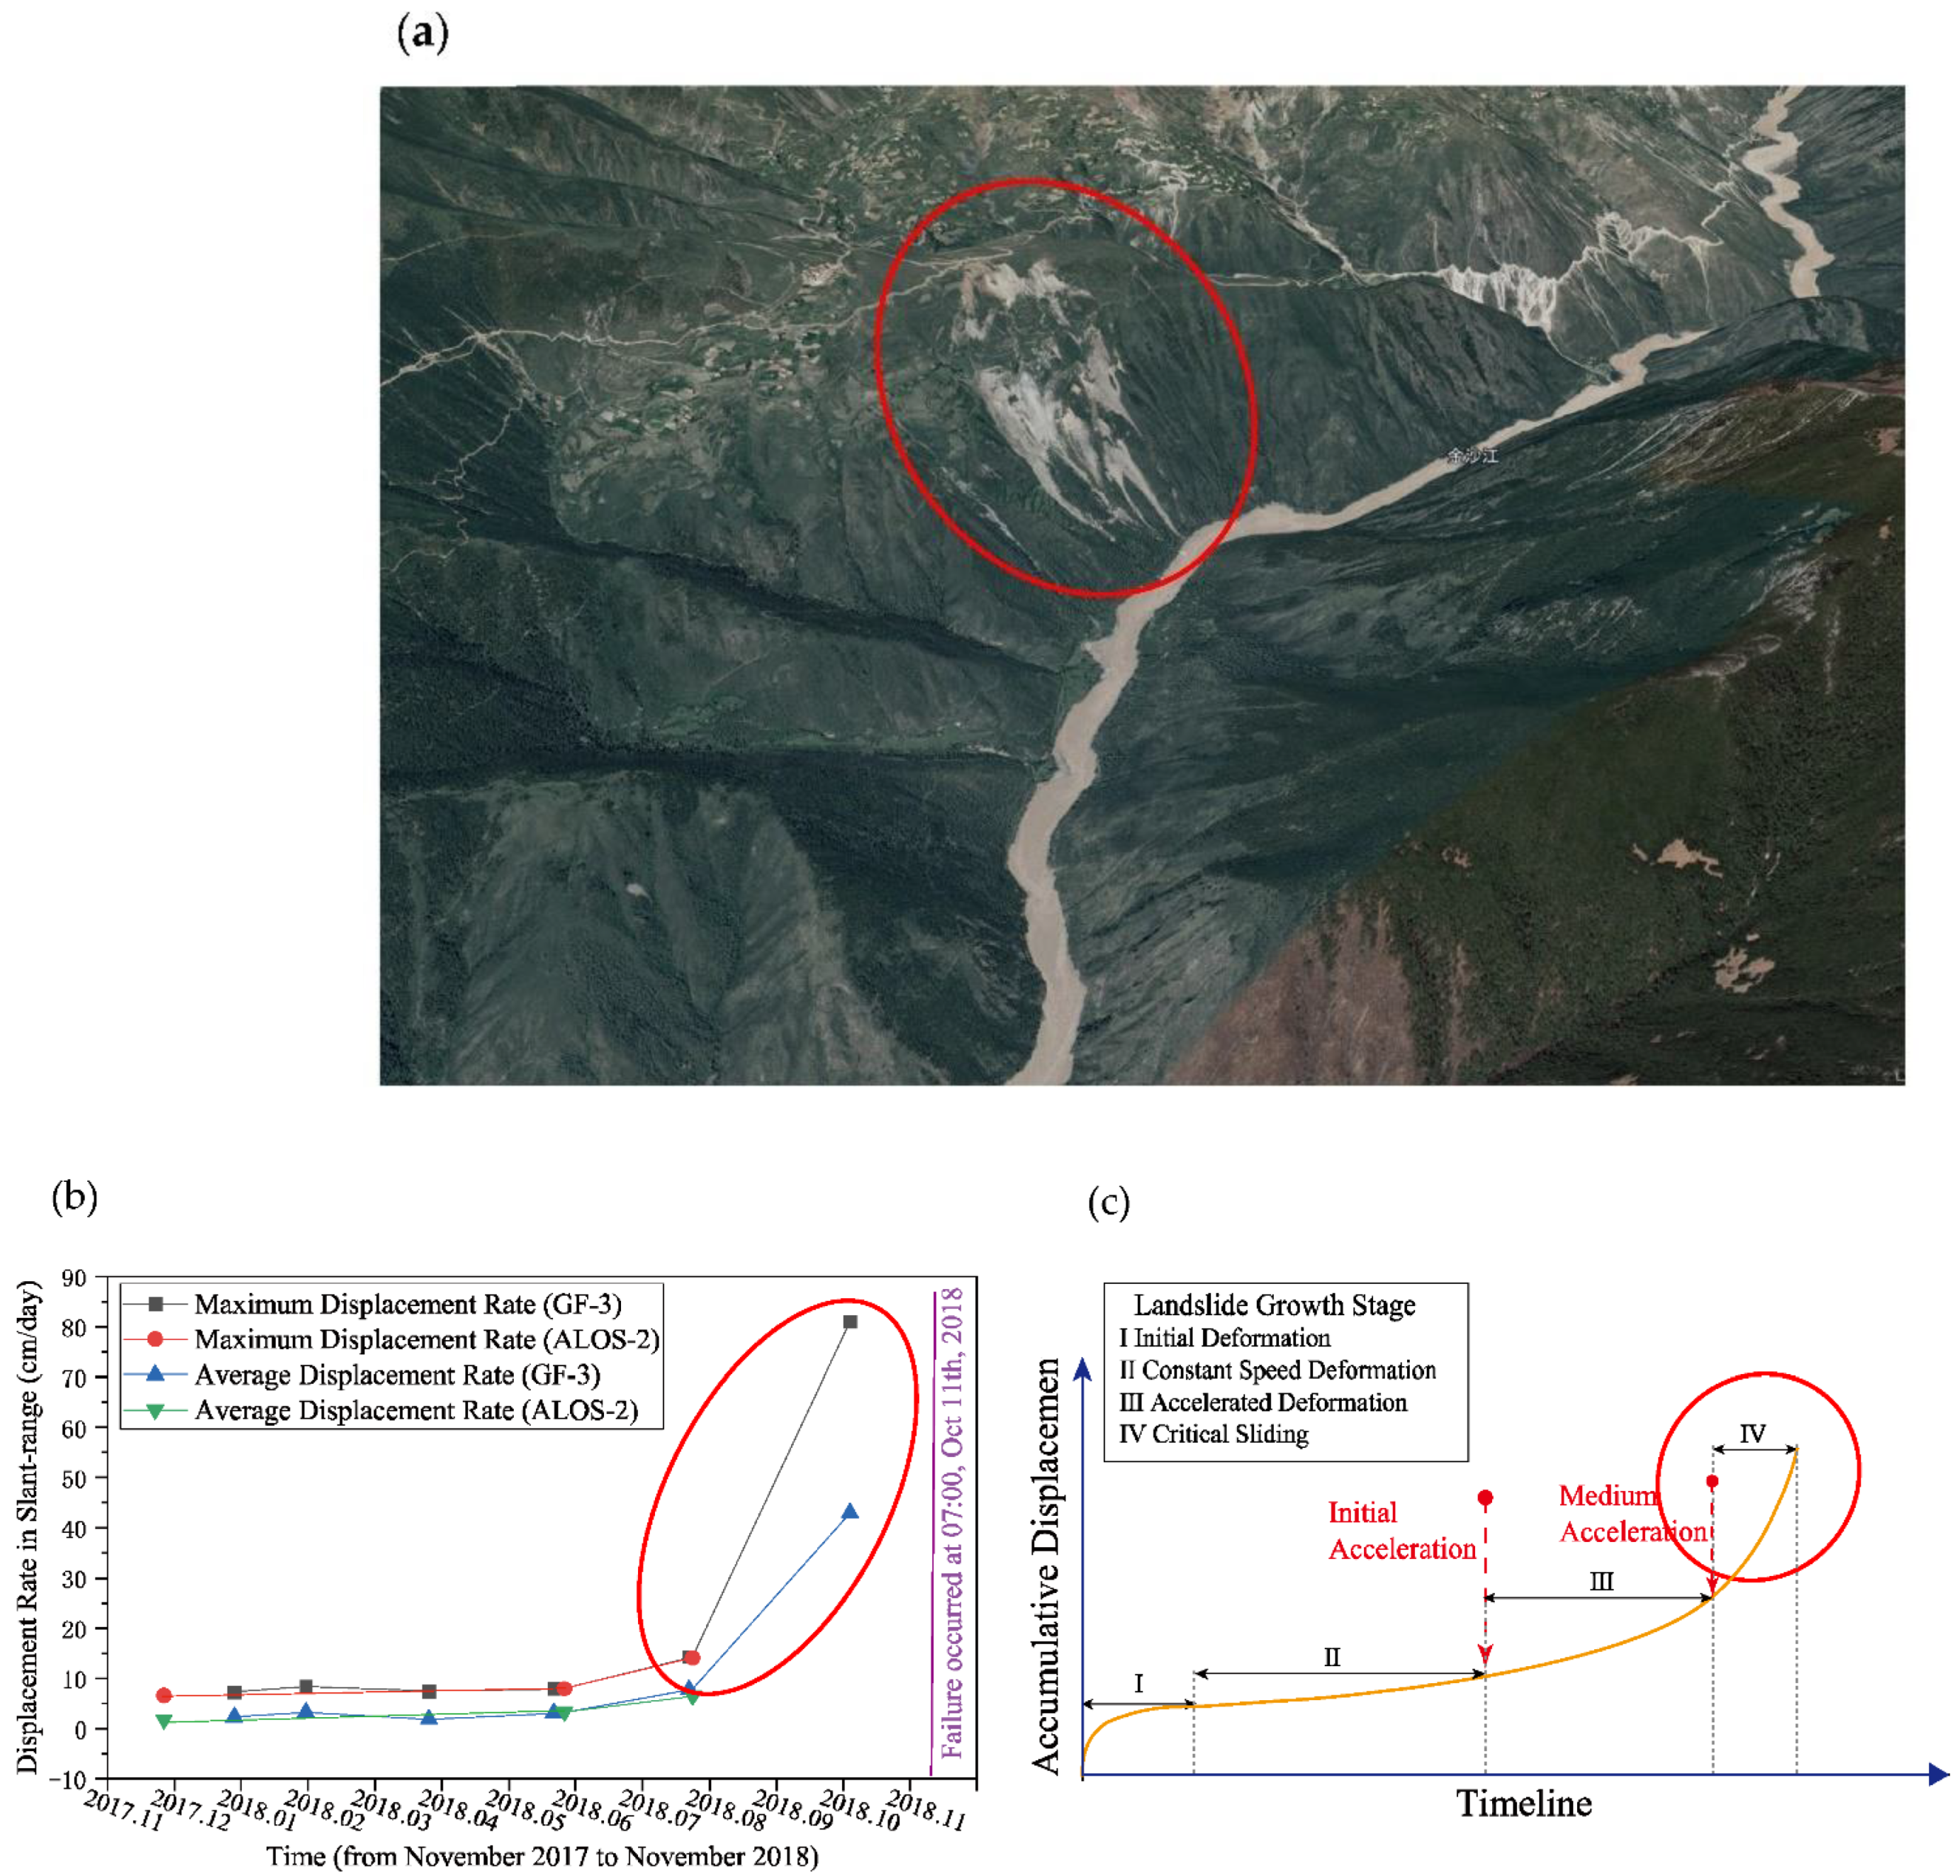
3.3.2. The Baige Landslide

The Baige landslide occurred at night-time on 10 October 2018, on the west bank of the Jinsha River flowing on the southeastern margin of the Qinghai–Tibet Plateau (31°4′57″ N, 98°42′7″ E) [71]. Approximately 23 million m3 of rock and debris on the slope collapsed and blocked the Jinsha River, forming a landslide-dammed lake with a volume of approximately 290 million m3 [124]. Twenty-four days after the first collapse, on 3 November, a second slope failure occurred on the same slope, resulting in 3.5 million m3 of rock detaching from the steep slope and once again damming the Jinsha River for nine days. The damming of the lake and the flood that formed when the dam broke inundated and damaged thousands of houses and infrastructure components (such as bridges, roads, and part of the Yebatan hydropower project under construction) both upstream and downstream [124].
Determining the time at which the first collapse of the Baige landslide was initiated in 2018 is difficult due to the lack of detailed field surveys and measurements prior to the failure. Nevertheless, the Baige landslide is located in a deeply incised V-shaped valley 100–300 m wide with a slope ranging from 35° to 55°; as a result of this geometry, both sides of the valley undergo extreme unloading and deformation [125]. The landslide area is crossed by the N-NW-trending Jinsha tectonic belt, forming complex structural conditions with multiple faults and structural blocks and undermining the slope with long-term tectonic activities [124]. It is widely accepted that this landslide event occurred as a result of long-term slope deformation [74,124,126,127,128,129,130,131]. Liu et al. [132] collected 28 Advanced Land Observing Satellite (ALOS) SAR images from January 2007 to August 2018 to characterize the deformation history and temporal evolution of the Baige landslide and used a new offset tracking method to correct the SAR image deformation errors; they found that the maximum cumulative deformation of the Baige landslide in the radar line of sight reached approximately −60 m. Li et al. [71] used ALOS and Sentinel-1 spaceborne SAR data from 2007 to 2018 to study the temporal evolution of the surface displacement of the Baige landslide before the first collapse. Linear quadratic creep and accelerating tertiary creep before failure were observed, confirming the feasibility of using SAR to capture the precursors of landslides to predict failure. Jia et al. [133] obtained four ALOS-2 SAR scenes from July 2017 to July 2018 and proposed an improved migration tracking method to analyze the temporal and spatial displacement patterns of the Baige landslide; they speculated that the landslide was likely caused by thrust loads. The abovementioned studies demonstrate that SAR remote sensing plays a powerful role in landslide monitoring, particularly in areas where ground truth data are scarce.
Studies have shown that temporal pattern-based displacement monitoring can help determine the current slip state of an unstable slope and provide support for landslide prediction and risk assessment [134,135]. Jia et al. [133] extracted time series of displacement rate changes based on SAR images and drew the creep curves shown in Figure 5b, and the correlation between the timeline and the displacement rate was used to fit the standard landslide model, as shown in Figure 5c [136], revealing the evolution of the deformation of the Baige landslide. From July 2017 to May 2018, neither the maximum nor the average displacement rate fluctuated much (1–3 cm/day). In Stage II (Figure 5c), the slope mass experienced long-term, nearly constant creep, followed in the subsequent two months by significantly accelerated deformation during Stage III. The deformation of the slope mass then accelerated further, and the average and maximum displacement rates increased several times compared with those in the previous stage. The acceleration of deformation from 6 September to 5 October indicates that the landslide entered a critical sliding stage and would soon enter the stage of failure. Indeed, sliding failure occurred after approximately six days (blue line in Figure 5b).

4. Geoenvironmental Precursors

4.1. Theories

Geoenvironmental changes, such as freeze–thaw cycles and large diurnal temperature differences in permafrost areas, are major factors that seriously affect the surface stability. In particular, the strong sunlight that strikes the Qinghai–Tibet Plateau at high altitudes and the harsh climatic conditions therein lead to the extremely poor stability of permafrost [137]. Moreover, the continuous increase in temperature caused by global warming has aggravated the snow-thawing and freeze–thaw cycles in plateau areas, and the resulting instability of permafrost has become one of the most important contributing factors to geological disasters [138].
Many studies have revealed that the effects of increased temperatures, such as the melting of snow and freeze–thaw cycles, can cause surface deformation and further induce landslides [139,140,141]. Taking the permafrost region of the Qinghai–Tibet Plateau as an example, Meng et al. [142] analyzed the effects of freeze–thaw cycles on surface deformation under temporal temperature variations and demonstrated that temperature changes are a crucial factor in controlling surface deformation. The reason is that an increase in temperature leads to the melting of glaciers, and the resulting meltwater increases the self-weight of the slope, penetrates into the ground (thereby lubricating the sliding surface of the slope), and increases the seepage force and pore water pressure of the soil. In addition, large diurnal temperature differences and freeze–thaw cycles cause the rock to crack, allowing meltwater to infiltrate deep into the rock. As a result, the effective strength of the failure surface is reduced, which eventually triggers movement. In particular, summer is a high-temperature season during which glaciers melt, and the increased rainfall intensity and frequency further accelerate the occurrence of landslides.
In addition, land surface temperature is often directly related to the occurrence of landslides, and changes in the thermal environment can be used as landslide precursors, especially in areas where glaciers are widely distributed [143].

4.2. Identification Methods

The thermal environment precursors of landslides can be detected by using time-series thermal infrared image data. Thermal infrared remote sensing is a remote sensing technique that utilizes invisible light to remotely measure hot objects on the ground. Thermal infrared sensors can acquire information in a large acquisition range, conduct rapid data updates, and implement spatiotemporal dynamic monitoring, thereby compensating for the shortcomings of traditional observation methods. Accordingly, the monitoring of geoenvironmental landslide precursors has developed from the traditional static fixed-point observation mode to the dynamic and continuous large-area observation mode, making the prediction and prevention of landslides more efficient.
With the continuous development of satellite remote sensing technology, thermal infrared data have become more diverse and are currently widely used to retrieve land surface temperatures; consequently, related research and applications have made considerable progress [144,145]. Various satellites and airborne sensors, such as the Heat Capacity Mapping Mission (HCMM), Landsat Thematic Mapper ™/Enhanced Thematic Mapper Plus (ETM+), the Thermal Infrared Multispectral Scanner (TIMS), the Advanced Very-High-Resolution Radiometer (AVHRR), the Moderate-Resolution Imaging Spectroradiometer (MODIS), the Thermal Infrared Sensor (TIRS), and the Advanced Spaceborne Thermal Emission and Reflection Radiometer (ASTER), have been developed to collect remotely sensed thermal infrared data from the Earth’s surface. Nevertheless, two important steps must be implemented in the process of using thermal infrared remote sensing data to retrieve the surface temperature: an atmospheric correction and the separation of temperature and specific emissivity. Common inversion algorithms include single-band algorithms (e.g., the single window algorithm, the radiation transfer equation algorithm, and the single-channel algorithm), split-window algorithms, and multichannel algorithms [146,147,148,149]. These various algorithms for inverting land surface temperatures have their own advantages and disadvantages, and are thus suitable for processing thermal infrared remote sensing data from different sources to detect landslide precursor information in various regions and at varying scales, and to provide technical support for disaster prevention and mitigation.

4.3. Case Studies

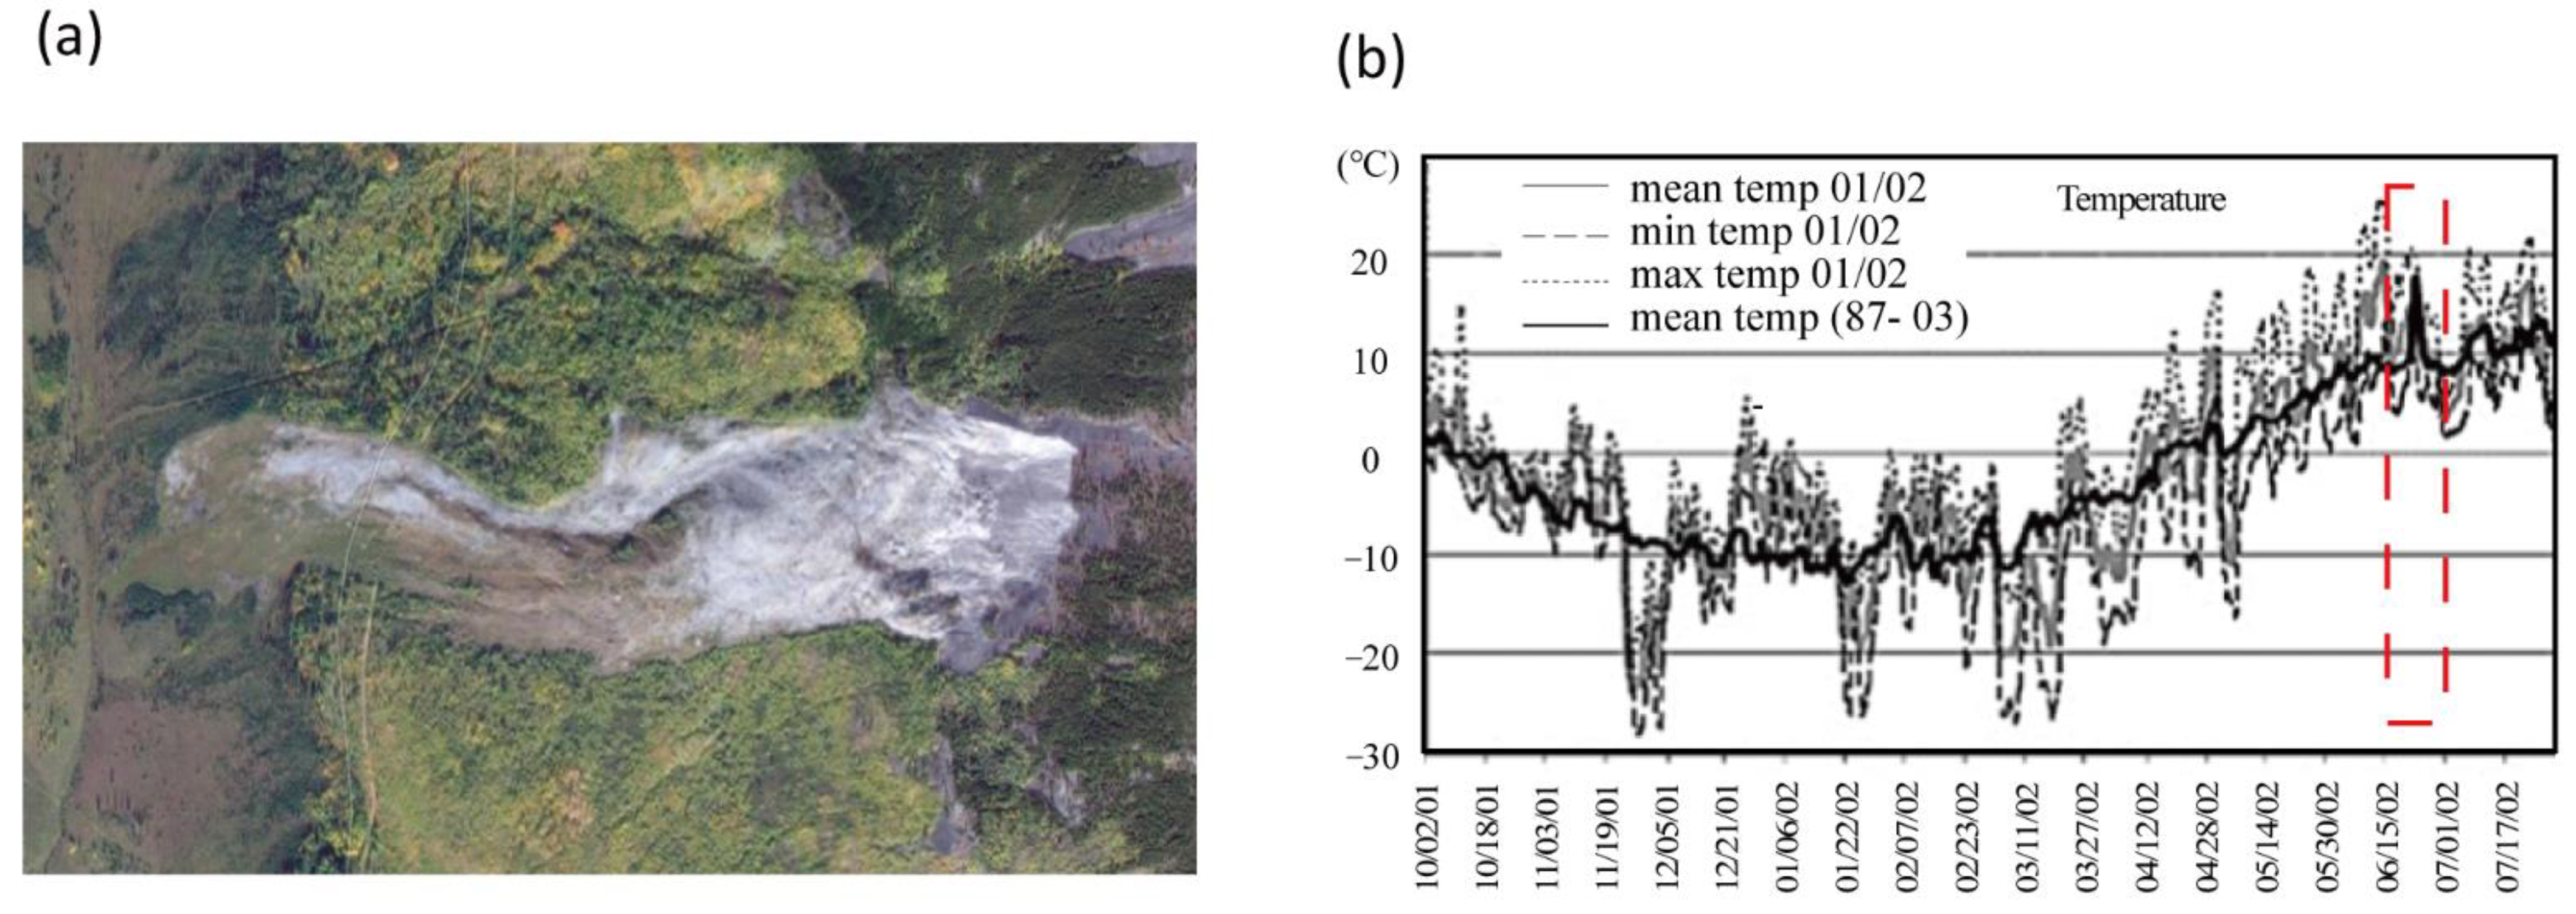
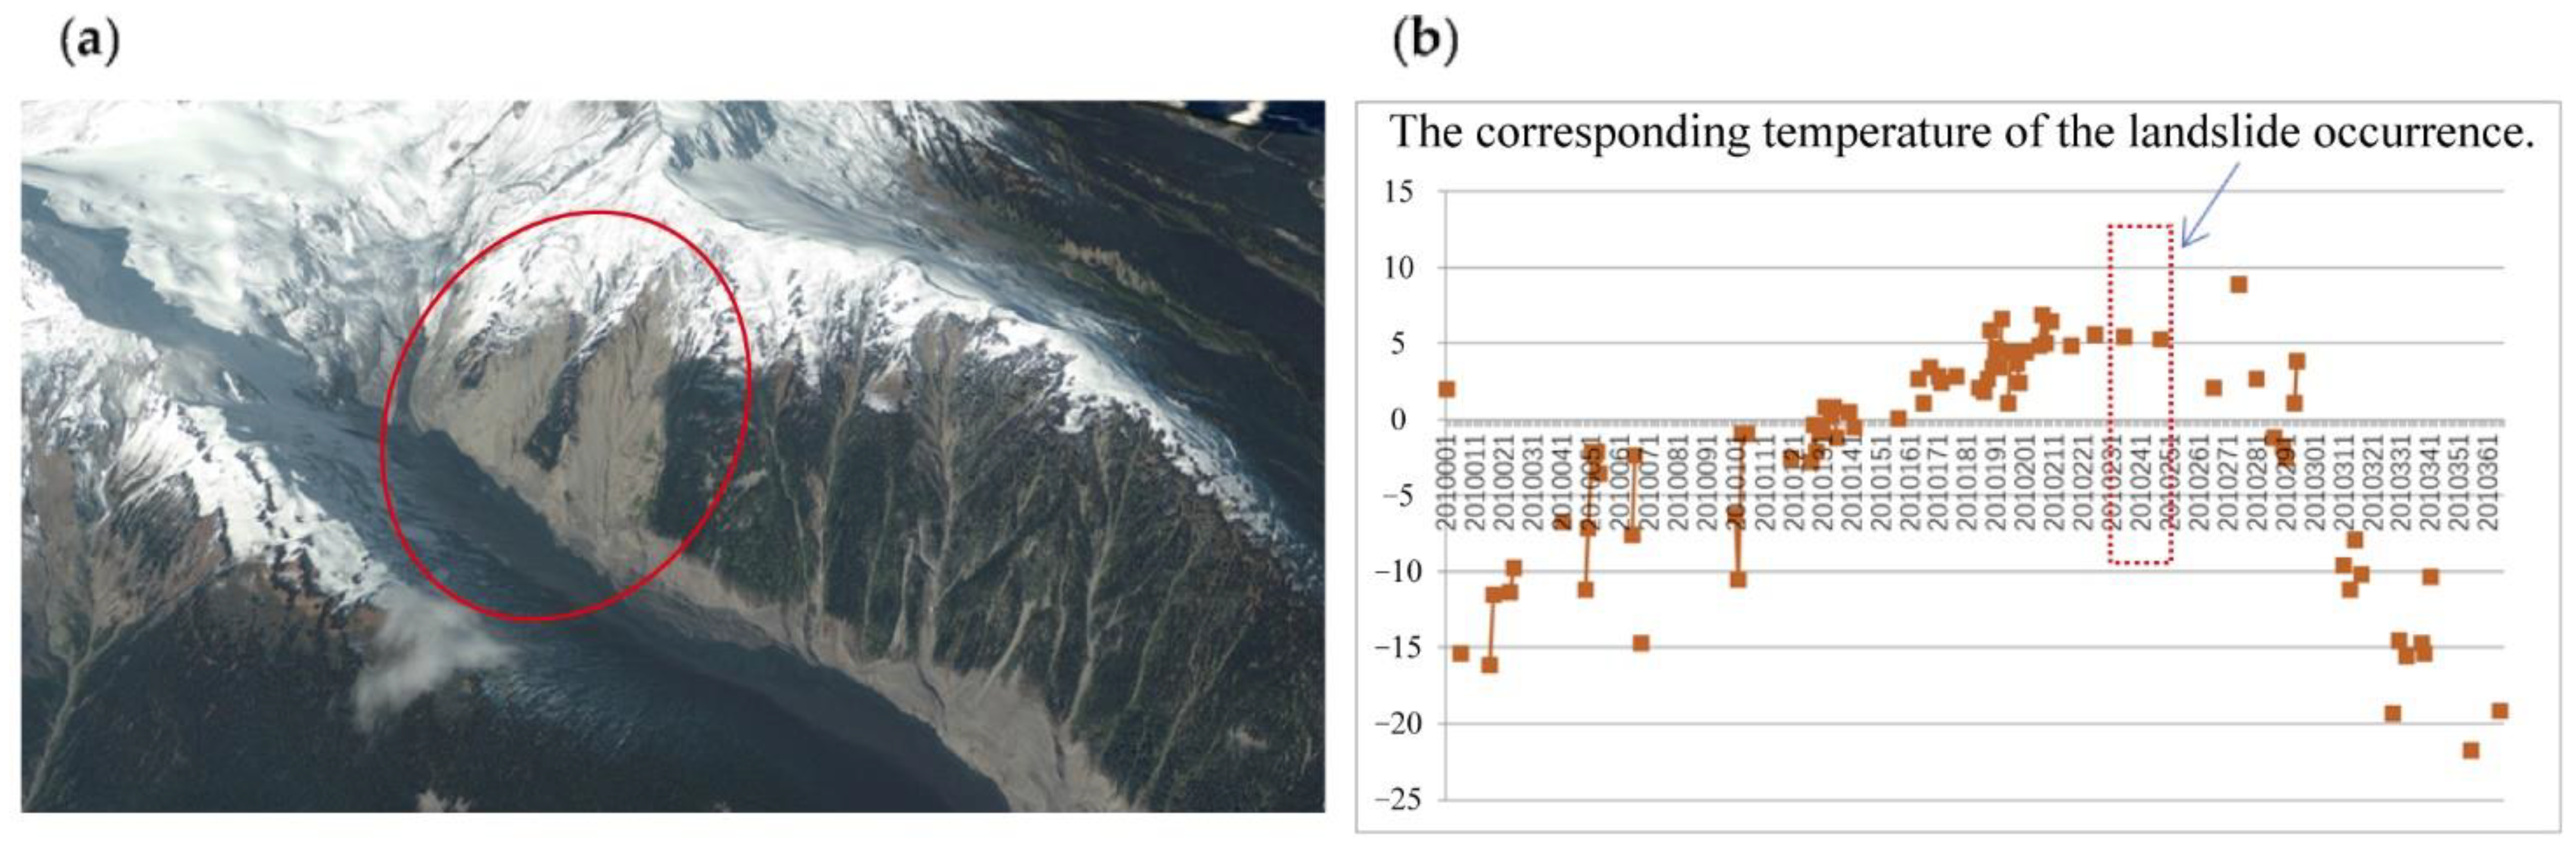
4.3.1. The Pink Mountain Landslide

Pink Mountain is located adjacent to the Alberta Plateau on the eastern edge of the Rocky Mountains [150]. The Pink Mountain landslide, which occurred in June 2002 sometime between June 30 and 6 July 2002, is situated on the west slope of the Pink Mountain anticline in Northeastern British Columbia (57°04′N, 122°52′W), with its crown and tip at elevations of 1460 and 1010 m, respectively, yielding a height difference (H) of 400 m. The landslide, which comprises 1.04 million m3 of soil and rock, is 1950 m long (L), up to 320 m wide, and covers an area spanning 43.4 ha (Figure 6a).
Pink Mountain is bounded by back thrust faults on its western slope, which is overlain by Jurassic, Lower Cretaceous, and older sedimentary rock. The landslide involved jointed sandstone and shale of the Monteith Formation [151] and is located within the Spruce Willow Birch biogeoclimatic zone [152]. This zone is characterized by a cold continental climate with a mean annual temperature that ranges between −0.7 and −3 °C. Winters in this zone are long and cold, whereas summers are brief and cool. In the summer, moist Pacific air often causes sudden, violent storms. The glacial history of the area has been described by Mathews [153] and Bednarski [154,155], whose maps show that Pink Mountain was once covered by the Cordilleran Ice Sheet, albeit near its eastern limit, 35 km west of the boundary with the Laurentide Ice Sheet, which covered most of continental Canada. The timing of deglaciation at Pink Mountain has not been accurately determined, and there is some controversy as to whether the two ice sheets coalesced in this region [156,157].
The occurrence of the Pink Mountain landslide was strongly correlated with the change in temperature. The red dotted line in Figure 6b represents the corresponding date of the landslide [158]. Note that the temperature continually increases before the landslide, with the temperature peaking immediately before the landslide occurred. A substantial warm period in the second week of June resulted in an extremely rapid runoff, with the majority of snowmelt taking place over a 10-day period in mid-June. The most plausible time for this landslide to have occurred is during this rapid snowmelt period, during which the continuous rise in temperature would have led to the rapid melting of an above-average volume of snow and the rapid rise in the high pore water pressure, under which landslides occur [158]. Another possible date is shortly after snowmelt; five days of intense rainfall was recorded at the Kwadacha River snow pillow station (with an elevation of 1620 m). This continuous high-intensity rainfall event that endured five days before the landslide further increased the pore water pressure. Notably, the Zymoetz and Harold Price rock avalanches also occurred in June 2002 [159], and they may have been related to the rising temperatures, whose influence cannot be ruled out [160]. It was speculated that the triggering factor of the Pink Mountain landslide may have been the Ms 2.9 earthquake that occurred 150 km southeast of Pink Mountain on 25 June 2002. However, the magnitude of this small earthquake would not have been sufficient to cause a ground acceleration strong enough to affect the slope of Pink Mountain [161].
We conclude that the causes of this landslide may have been the continuously rising temperature before the landslide and the temperature peak that was reached before the landslide. Therefore, the rising temperature constitutes the precursor information of this landslide’s occurrence. If monitoring can be implemented before a landslide, the landslide warning will be more effective, and the landslide risk can be reduced.
Figure 6. (a) Pink Mountain landslide. (b) Graph showing a substantial warm period in the second week of June resulting in rapid runoff. Source: Kawadacha-4A27P, BC Government, Ministry of Water, Land, and Air Protection (adapted with permission from [160]. 2006, Geertsema et al.).
Remotesensing 14 04399 g006

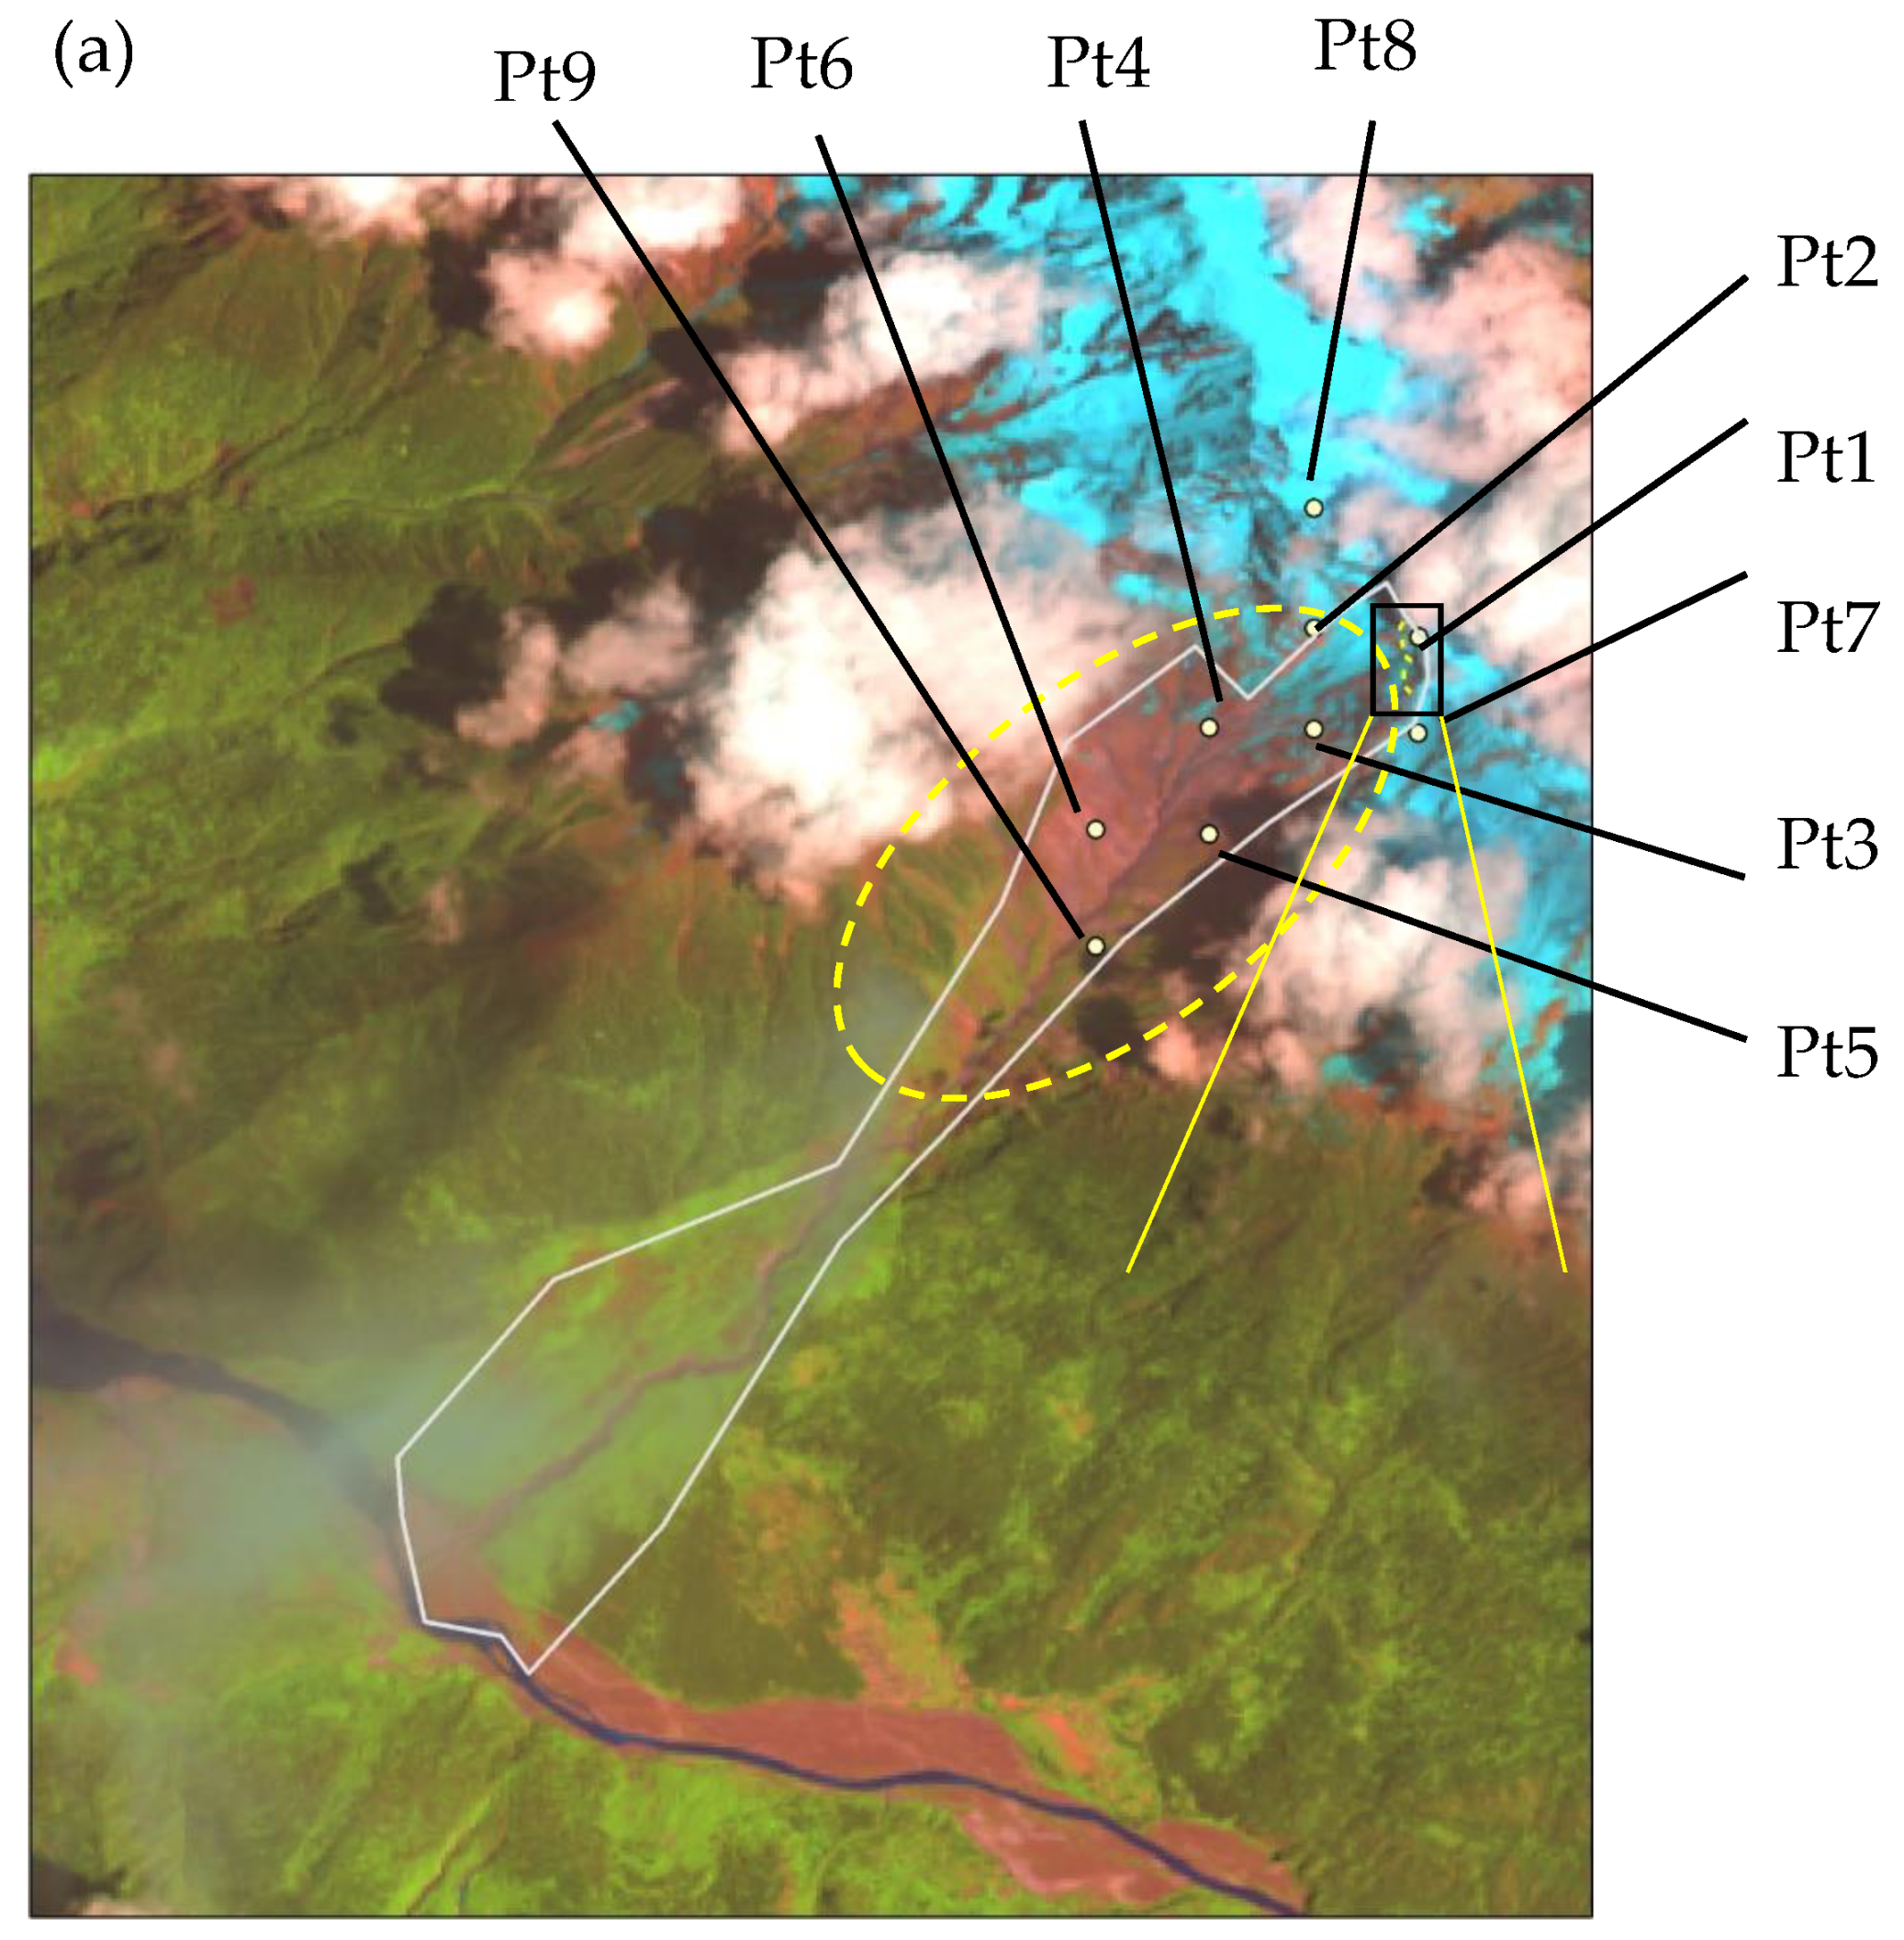
4.3.2. The Mount Meager Landslide

On 6 August 2010, the 48.5 × 10⁶ m3 Mount Meager landslide was initiated (50.623° N, 123.501° W) in the Coast Mountains of British Columbia (Figure 7a). The source volume was composed of the steep gendarme, forming the secondary peak of Mount Meager, as well as the adjacent southern flank of the mountain. The Mount Meager volcano is a partially glacier-covered volcanic complex 60 km northwest of the town of Pemberton. It is a coalescent group of volcanic centers of the Pliocene to Holocene age that have been built on top of Mesozoic granitic and metamorphic basement rocks (Read 1978, 1990). The last eruption, near Plinth Peak, occurred approximately 2400 years ago and reached as far east as the Alberta Rocky Mountains [162,163]. Parts of the volcanic pile have been hydrothermally altered, and active fumaroles and hot springs are present on the flanks of the massif. The area was repeatedly glaciated by ice caps and the Cordilleran Ice Sheet during the Pleistocene [164] and presently supports numerous small glaciers. The volcanic and basement rocks have been deeply dissected by glacial and fluvial erosion and by mass movements, leaving steep slopes and a current local relief of up to 2200 m.
The time-series temperature data of the Mount Meager landslide area were selected to analyze the influence of temperature changes on the Mount Meager landslide. The temperature time-series data range from 1 January 2010 to 31 December 2010, including approximately 37 scenes of imagery. The temperatures at the Mount Meager landslide monitoring points were extracted, as shown by the orange squares in Figure 7b (the lines connecting some squares denote the corresponding temperature ranges at the landslide monitoring points). The red dotted rectangle delineates the timing of the landslide. Note again that the temperature continually increased before the landslide occurred, reached its peak, and tended to be stable. The landslide occurred after these high temperatures had persisted for a certain time and before the temperature could decrease, which indicates that the change in temperature was related to the occurrence of the landslide.
The failure area was historically covered in part by glaciers. Much of this ice was lost due to climate warming during the twentieth and early twenty-first centuries [165,166]; at present, the flanks of Mount Meager are largely ice-free. The 2010 event and other giant landslides around the Mount Meager volcano originated, in part, from glacial erosion and retreat [166,167]. Furthermore, with the recent continuous increase in temperature and sustained high temperatures, the thawing of alpine permafrost may have also contributed to the slope instability through the loss of ice cohesion and the expulsion of water from near-surface rocks and sediments [168].
Elevated pore water pressures may have triggered the 2010 landslide because it occurred at the end of a lengthy late summer heatwave that exacerbated glacier melting and permafrost thawing. The link between the rapid melting of snow and ice during hot weather has been noted in the cases of other giant landslides at Mount Meager [167,168,169] and in other alpine areas [169,170,171,172,173].

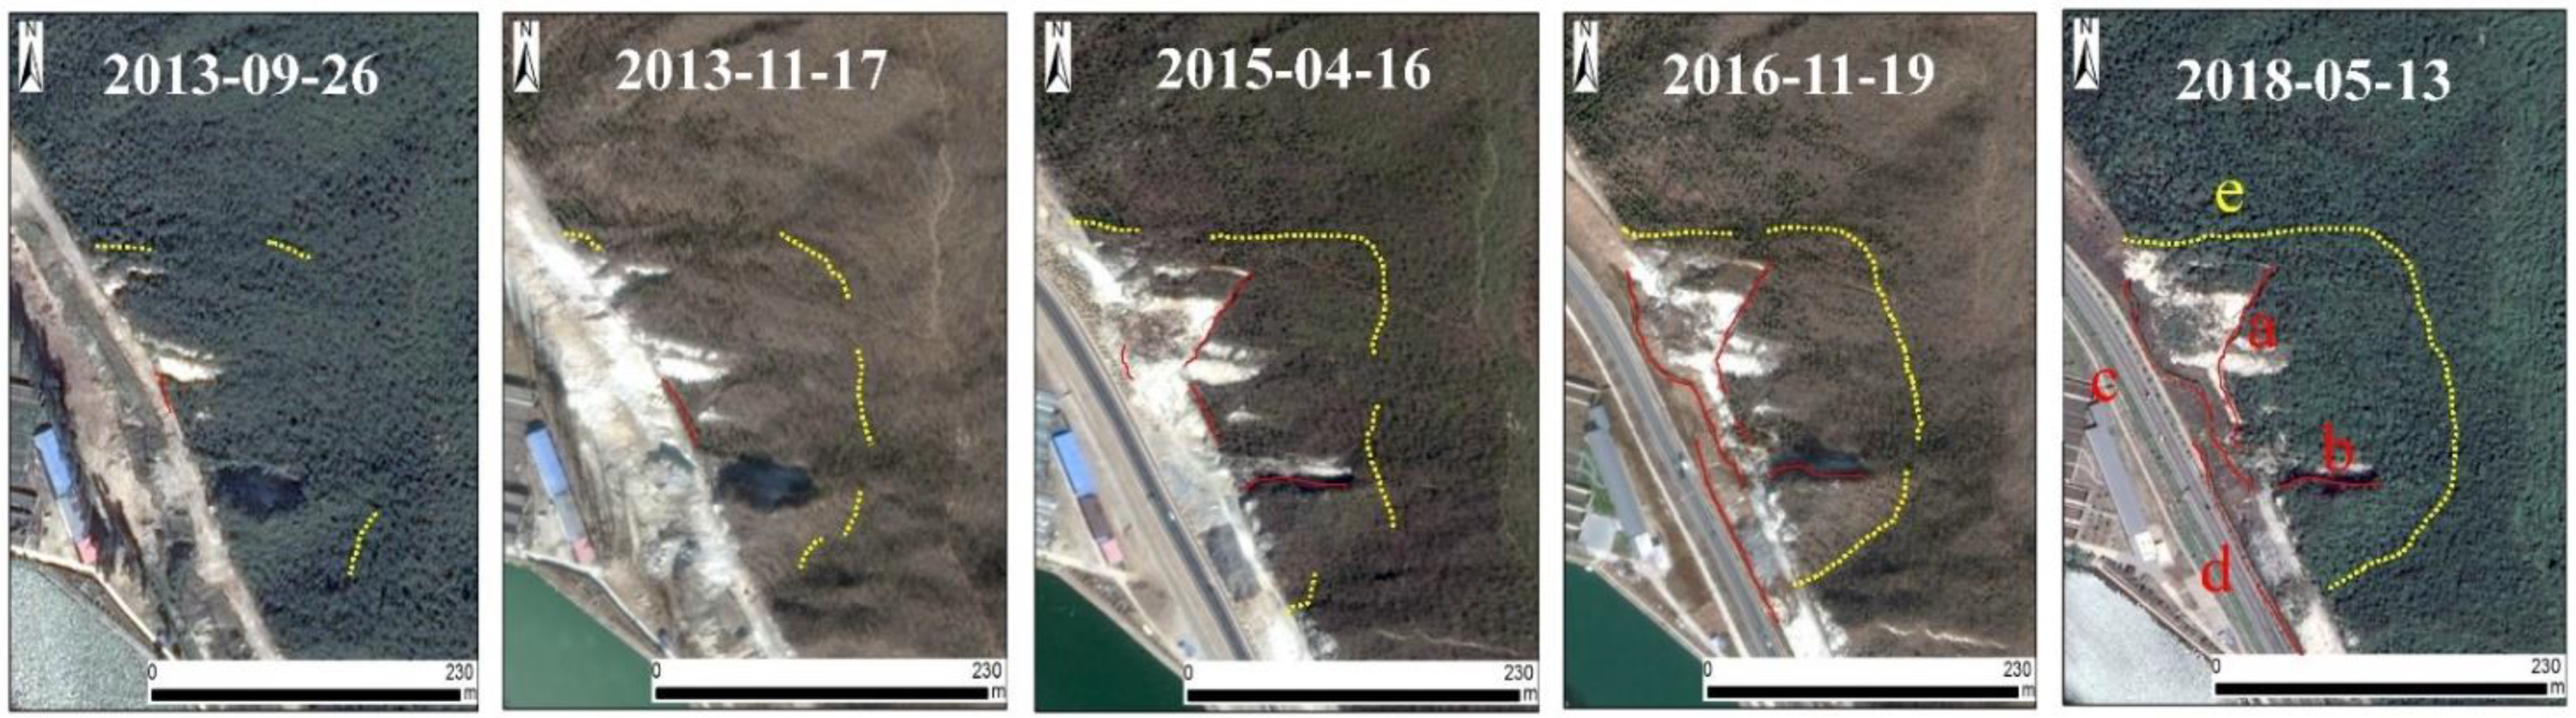
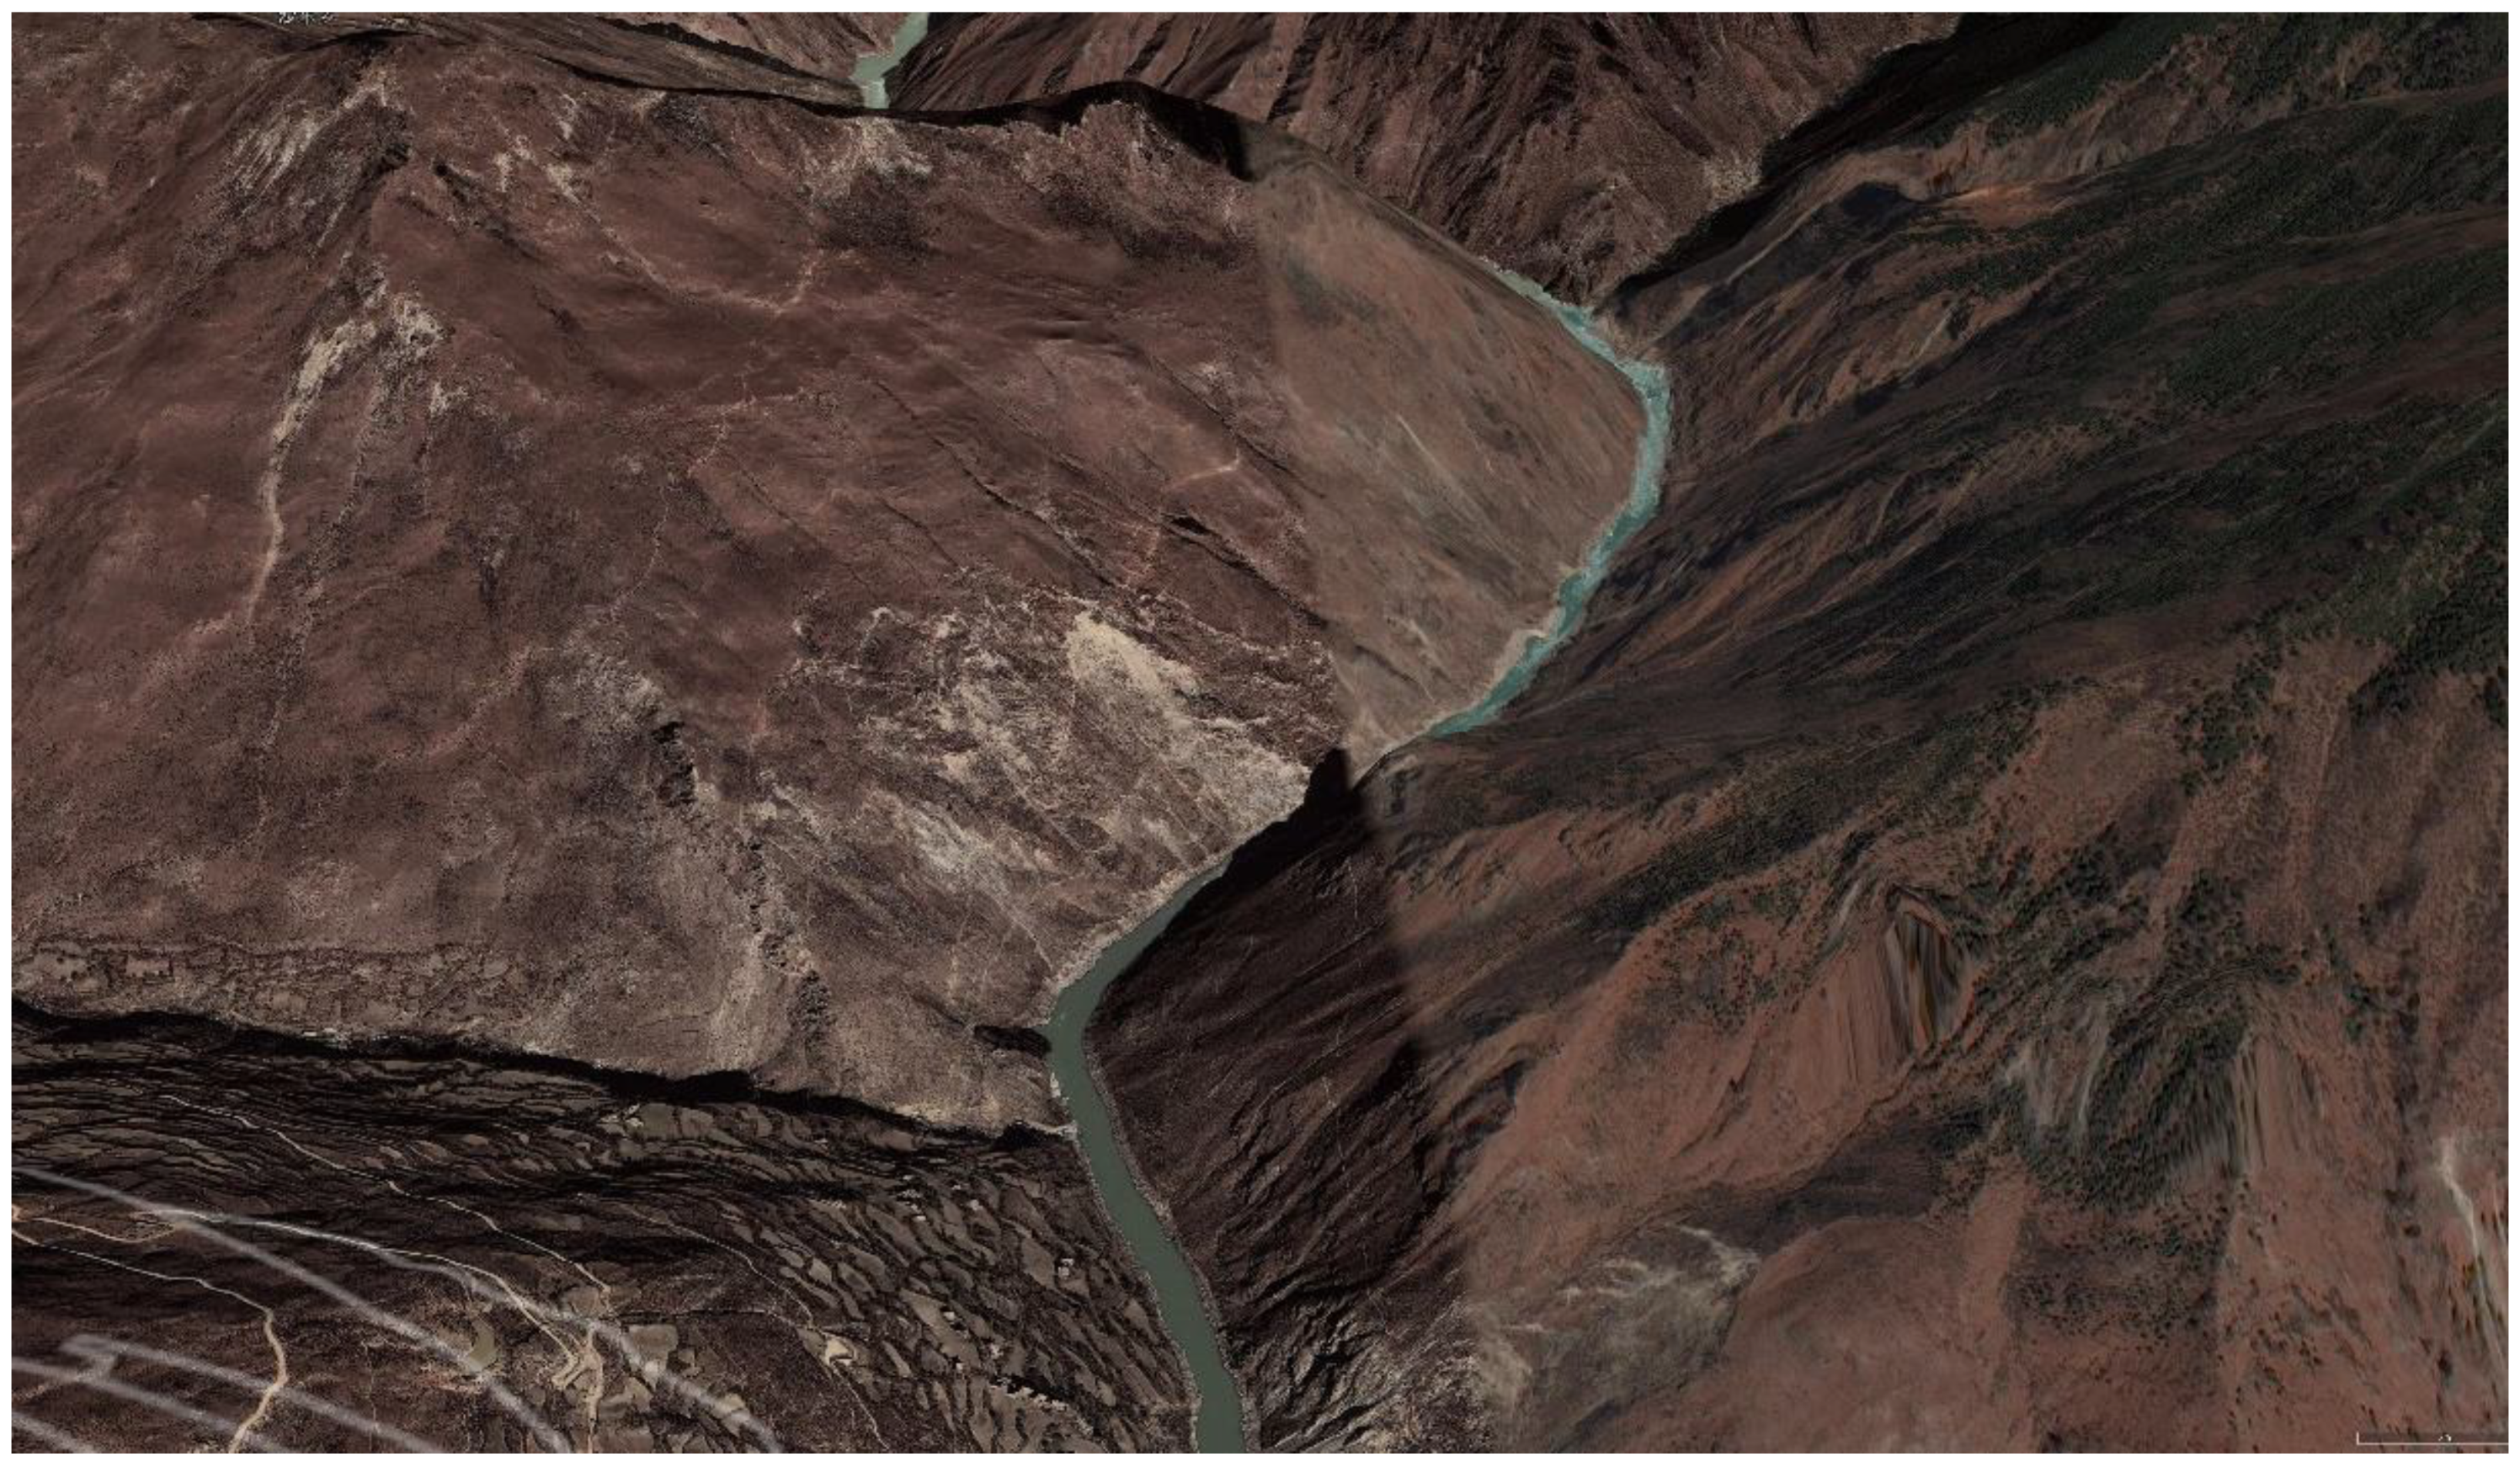
4.3.3. The Yigong Landslide

The Yigong landslide occurred at approximately 20:00 on 9 April 2000, in the southeastern part of the Nyainqentanglha Range in Southeastern Tibet [174] when a large-scale rock avalanche with a total volume of approximately 9.1 × 10⁷ m3, including more than 100 million m3 of granular materials [175], traveled along Zhamu Creek. These granular materials descended from on high and completely obstructed the downstream region of the Yigong River. An irregularly shaped sediment deposit formed a landslide dam with the height ranging from 55.1 to 90 m. After this dam formed, water in Yigong Lake began to rapidly accumulate on the dam’s upstream surface until the dam was breached. The resulting flood destroyed agricultural land, downstream municipalities, and transportation systems, and led to the flooding of the Yarlung–Siang–Brahmaputra River system, which affected over 10,000 people [143,174,175,176,177].
The landslide site, within a narrow valley surrounded by steep and high mountains, was from tens to hundreds of kilometers from surrounding villages [178]. The landslide was initiated at a site with a maximum elevation of 2915 m. The horizontal distance from the source zone to the bed of the Yigong River is approximately 10 km with a mean longitudinal slope of 31°. Zhamu Creek, which became the landslide drainage site, is approximately 9.7 km long with a total watershed area of 20.2 km2. The upper section of Zhamu Creek is covered with 2.2 km2 of permanent glaciers and snow, spans an elevation range of 3700–5520 m, is approximately 2.6 km long, and has side angles of approximately 40° [145,177,178]. During the 2000 Yigong landslide, the cumulative amount of rain that fell during 1–9 April was measured to be over 50 mm [179], and the total rainfall in April was approximately 100 mm, 50–90% more than the mean value during 1–9 April in this area [177]. The four main types of rocks in the research area are granite, marble, slate, and limestone, each of which exhibits different degrees of weathering and variability [143,174]. In the upper segment of Zhamu Creek, the rock masses are composed mainly of granite and steep slate. Large volumes of loose landslide deposits consisting of sandy silt, fragmented gravels, and other landslide debris materials also exist on the channel bed in the middle segment. The lower segment consists of thick accumulated deposits from 1900-year-old landslides and new debris flows [175,180]. Ultimately, the geoenvironmental characteristics of the Yigong landslide listed above, such as the permanent glacier snow cover, the temperature rise in April, and the accompanying heavy rainfall, were conducive to the occurrence of the Yigong landslide [93].
To determine the relationship between the evolution of the Yigong landslide and the changes in its geothermal environment, nine monitoring points were uniformly distributed across the upper part of the Yigong landslide, named Pt1–Pt9 (Figure 8a), and data from a MODIS multitemporal thermal infrared remote sensing product (MOD21A1D) were selected to extract the temperature at each monitoring point in the time series. The MODIS thermal infrared time-series data ranges from 27 March 2000 to 2 January 2001, including approximately 150 scenes of available images. Considering a uniform time series distribution and upon screening the quality of the data, 38 MODIS temperature images were selected from among the 150 images. The temperatures at the nine monitoring points were extracted, and the temperature change characteristics were fitted. The red line and black line in Figure 8b are the fitting curves of the temperatures at the monitoring points.
Figure 8b shows that, during the period from March 2000 to January 2001, the temperature in the monitoring area showed a trend of first increasing and then decreasing. The red circle in Figure 8b denotes the corresponding temperature range of the monitoring area when the Yigong landslide occurred. These results show that slope failure occurred as the temperature in the monitoring area continued to rise and the maximum temperature was about to be reached. This finding implies that the occurrence of this landslide was largely due to the melting of glaciers or the thawing of frozen soil caused by continuous heating, which causes surface deformation. This case further indicates that changes in the thermal environment are a major precursor to the occurrence of giant landslides; hence, thermal infrared remote sensing monitoring in key areas should receive sufficient attention.

5. Discussion

The basic theories, main methods of capture, and representative cases of these three main landslide precursors were analyzed in this study. Optical, synthetic aperture radar (SAR), and infrared remote sensing were found to be best suited for capturing the geomorphological precursors, geotechnical precursors, and thermal environment precursors of giant landslides, respectively. We here further discuss the future applications of remote sensing techniques in the analysis of these three particular types of landslide precursors, respectively, including the capture accuracy, advantages and limitations, and the potential priority (Table 2).
Surface discontinuities (such as cracks and erosion ditches) in the slope are important geomorphological precursors to giant landslides. Optical remote sensing technology can be used to obtain abundant information on the geometric shapes of and changes in landforms for detecting the geomorphological precursors of landslides. Continuous time-series satellite data were selected to detect the crack extension trends in the source areas of the Xinmo landslide and the Baige landslide, as well as the stretching characteristics of the cracks and erosion ditches on the unstable slopes where these landslides did not occur, thereby demonstrating the geomorphological precursors contributing to the formation of landslides. Optical remote sensing data are the most frequent source of information for detecting the geomorphological precursors of landslides, as such data yield abundant in-formation on the geometric shapes and changes in landforms. High-resolution optical images can provide more clear details of geomorphological landslide precursors and offer more superior capture accuracy. The time-series information of medium-resolution remote sensing imagery has the advantages of providing the evolution characteristics of the precursors, which can be used to speculate on the landslide formation mechanics. However, the differences in the spectral features of geomorphic precursors of landslides and surrounding environmental factors are the basis for extracting landslide precursor information. The geotechnical composition of landslides varies greatly in different regions, and a single spectral feature is not enough to extract landslide precursors accurately; fused multi-source spectral information data are more valuable in actual landslide precursor capture. In addition, differences in satellite imaging angles and solar altitude angles cause image signal bias, and it is difficult to interpret remote sensing images of landslide-prone mountainous areas due to cloud cover occlusion. This series of unavoidable problems means that remote sensing images for landslide precursor capture must be processed by image pre-processing and image enhancement, which brings more obstacles to the application of optical images in giant landslide precursor capture.
The deformation of the slope and even the sliding of blocks as a result of weak structural planes and unfavorable geological structures are also major determining factors in the occurrence of landslides. Slope deformation contributes to the occurrence of landslides by accumulating energy. InSAR time-series imagery can be used to discover the slight displacements at the initial stage of slope deformation, and the landslide can be identified through the annual deformation rate. PSInSAR technology has been developed to more efficiently obtain displacement data and has significant advantages in large-scale surface displacement monitoring and landslide precursor detection. Multitemporal image data from Sentinel-1 and ALOS-2 were used to analyze the ground deformation processes of the Xinmo landslide and the Baige landslide, respectively, revealing that if InSAR had been used to actively monitor the surface displacement in the target area, the precursor information of imminent failure would have been discovered before the landslides had occurred. Excessively long revisit periods and the limited availability of satellite radar data for interferometric analysis have been the main reasons limiting the use of SAR sensors as a tool for monitoring ground deformation over large areas in the past. However, the continuous launch of new satellites in the past decade has greatly increased the frequency of InSAR data acquisition, and the available long-term time-series surface deformation data are a significant advantage for large-scale surface deformation monitoring and landslide precursor capture. Meanwhile, the development of technologies such as permanent scatterer interferometry (PSI) has further improved the efficiency of InSAR technology for landslide precursor capture.
Temperature changes in permafrost regions trigger freeze–thaw cycles and snowmelt, which affect the stability of the ground and induce landslides. Changes in the thermal environment as precursors to landslides can be monitored using time-series thermal infrared image data, especially in areas where glaciers are widely distributed. Thermal infrared time-series image data of the Pink Mountain, Mount Meager, and Yigong landslides all show that the temperature continually increased before each landslide and that the landslides occurred near the peak temperature. Thermal infrared image data also have the advantage of a long time series and a large area collection, and the development of thermal infrared satellites and sensors in terms of magnitude and diversity facilitates the high-speed update of thermal infrared data. The advantages of thermal infrared technology have promoted the evolution of the monitoring mode of thermal environmental precursors for giant landslides from traditional static fixed-point observations to current real-time and continuous dynamic observations over a large area, which further contributes to more efficient landslide prediction and prevention. Nevertheless, the advantage of using thermal infrared remote sensing to capture landslide precursors is limited to glacier and snow areas, where landslide-prone freeze–thaw phenomena are temperature-sensitive, thus constituting a prerequisite for landslide precursors to be captured by monitoring temperature changes. Furthermore, some necessary steps, such as atmospheric correction and the separation of temperature from specific emissivity, must be implemented in the retrieval of the surface temperature using thermal infrared remote sensing data. The commonly employed inversion algorithms involve multiple categories and significantly different accuracies regarding thermal infrared data from different satellite sources. Therefore, the selection of thermal infrared data and temperature inversion algorithms should fully consider the characteristics of landslide precursor information in different regions and scales, so as to capture landslide precursors with high accuracy and efficiency.
In summary, the combined techniques of optical, SAR, and thermal infrared remote sensing over a large spatial and temporal range offer a promising toolkit for capturing detailed signals of slope failure, that is, landslide precursors, to predict the time and place of landslide occurrence. However, the accuracy of landslide precursor capture is a particularly important factor to be considered, which not only depends on the quality and resolution of remote sensing data, but also is limited by the signal noise arising from the complex mountain environment that is unfavorable to the modeling and identification of landslide precursor features. These errors in the accuracy of the capturing signals of slope movement features will inevitably result in the misreporting or omission of landslide predictions and warnings. For geomorphic precursors, meter-scale fractures can be dynamically monitored using high-resolution optical remote sensing, but there is a deficiency in slope creep monitoring in terms of insufficient coupling between data related to the short-term and long-term evolution of individual potentially unstable slopes. The fused multi-source spectral databases will then be expected to significantly improve the recognition accuracy of geomorphic precursors. The large amount of spatial data from the SAR sensors is capable of providing stable displacement detection with millimeter-level accuracy based on the improved data processing algorithms and the use of permanent scatterers. Weak or unstable radar signals for specific land use types, such as water areas and high vegetation cover, result in missed landslide precursor monitoring and the omission of landslide warnings in these areas, and the spatial coverage uniformity of the deformation signal is a potential priority in the future. The freeze–thaw state of glaciers and snow can be accurately revealed by the surface temperature. The freeze–thaw state of glaciers and snow can be reflected by the surface temperature, and the temperature increase leads to the melting of snow and thus the increase in the soil water content and the decrease in soil cohesion, and it is found from the above cases that the threshold of landslide occurs when the temperature rises above 5 °C or 10°C. However, the mechanical response of soil to freeze–thaw cycles varies greatly depending on the thickness of the permafrost layer or snowpack, and regional peculiarities should be primarily considered in the future study of the response mechanism of landslide susceptibility to temperature.

6. Conclusions

Monitoring and early-warning systems for landslides are urgently needed worldwide to effectively reduce the losses of life and property caused by these natural disasters. The detection of precursor information of giant landslides constitutes the premise of landslide monitoring and early warning, and remote sensing technology is a powerful means to achieve this goal. Optical, SAR, and thermal infrared methods are the three main types of remote sensing techniques and are best suited to capturing the geomorphological precursors, geotechnical precursors, and thermal environment precursors, respectively, of giant landslides. Based on a review of the literature and an analysis of remote sensing imagery, this paper clarifies these three precursors of giant landslides using these three remote sensing technologies from three perspectives: the theory, the methods, and typical cases. Ultimately, optical remote sensing, microwave remote sensing, and thermal remote sensing possess unique advantages and, therefore, play separate roles in the analysis of different giant landslide precursors. Thus, the comprehensive application of optical, SAR, and thermal infrared remote sensing to obtain synthetic landslide precursors, including geomorphological, geotechnical, and thermal environment precursors, will greatly promote the development of landslide early warning systems. The extended use of fused multi-source optical data and phase-gradient-refined SAR data, progressively optimized radiometric correction and spectral enhancement techniques, temperature inversion algorithms, and extensive and timely access to high spatial and temporal resolution information are expected to be the priorities for the future development of remote sensing technology for the capture of giant landslide precursors.

Author Contributions

Conceptualization, H.L.; paper writing, X.L.; data curation, L.L.; software, Q.L.; formal analysis, N.T.; supervision, J.P.; funding acquisition, H.L. All authors have read and agreed to the published version of the manuscript.

Funding

This research was funded by the Strategic Priority Research Program of the Chinese Academy of Sciences (Grant No. XDA23090301), the Second Tibetan Plateau Scientific Expedition and Research (STEP) program (Grant No. 2019QZKK0904), the National Natural Science Foundation of China (Grant Nos. 41941019 and 42177150), and the Fundamental Research Funds for the Central Universities, CHD (Grant No. 300102262901).

Data Availability Statement

Not applicable.

Conflicts of Interest

The authors declare no conflict of interest.

References

  1. Varnes, D.J.; Cruden, D. Landslide types and processes. In Landslides: Investigation and Mitigation; Special Report; Transportation Research Board, National Academy Press: Washington, DC, USA, 1996; p. 247. [Google Scholar]
  2. Cruden, D.M.; Varnes, D.J.; Turner, A. Landslides: Investigation and Mitigation; National Academy Press: Washington, DC, USA, 1996. [Google Scholar]
  3. Klose, M.; Highland, L.; Damm, B.; Terhorst, B. Estimation of direct landslide costs in industrialized countries: Challenges, concepts, and case study. In Landslide Science for a Safer Geoenvironment; Springer: Copenhagen, Denmark, 2014; pp. 661–667. [Google Scholar]
  4. Schuster, R.L. Socioeconomic significance of landslides. In Landslides: Investigation and Mitigation; National Academy Press: Washington, DC, USA, 1996; Volume 247, pp. 12–35. [Google Scholar]
  5. Canuti, P.; Casagli, N.; Ermini, L.; Fanti, R.; Farina, P. Landslide activity as a geoindicator in Italy: Significance and new perspectives from remote sensing. Environ. Geol. 2004, 45, 907–919. [Google Scholar] [CrossRef]
  6. TAKADA, M. On the ground deformation and phenomena forerunning natural disasters (earthquake, rock-falling and landslide). Bull. Disaster Prev. Res. Inst. 1965, 14, 1–26. [Google Scholar]
  7. Siebert, L. Large volcanic debris avalanches: Characteristics of source areas, deposits, and associated eruptions. J. Volcanol. Geotherm. Res. 1984, 22, 163–197. [Google Scholar] [CrossRef]
  8. Voight, B.; Elsworth, D. Failure of volcano slopes. Geotechnique 1997, 47, 1–31. [Google Scholar] [CrossRef]
  9. Lombardo, L.; Tanyas, H.; Huser, R.; Guzzetti, F.; Castro-Camilo, D. Landslide size matters: A new data-driven, spatial prototype. Eng. Geol. 2021, 293, 106288. [Google Scholar] [CrossRef]
  10. Dai, K.; Li, Z.; Xu, Q.; Bürgmann, R.; Milledge, D.G.; Tomas, R.; Fan, X.; Zhao, C.; Liu, X.; Peng, J. Entering the era of earth observation-based landslide warning systems: A novel and exciting framework. IEEE Geosci. Remote Sens. Mag. 2020, 8, 136–153. [Google Scholar] [CrossRef]
  11. Intrieri, E.; Raspini, F.; Fumagalli, A.; Lu, P.; Del Conte, S.; Farina, P.; Allievi, J.; Ferretti, A.; Casagli, N. The Maoxian landslide as seen from space: Detecting precursors of failure with Sentinel-1 data. Landslides 2018, 15, 123–133. [Google Scholar] [CrossRef]
  12. Carla, T.; Intrieri, E.; Raspini, F.; Bardi, F.; Farina, P.; Ferretti, A.; Colombo, D.; Novali, F.; Casagli, N. Perspectives on the prediction of catastrophic slope failures from satellite InSAR. Sci. Rep. 2019, 9, 14137. [Google Scholar] [CrossRef]
  13. Du, J.; Glade, T.; Woldai, T.; Chai, B.; Zeng, B. Landslide susceptibility assessment based on an incomplete landslide inventory in the Jilong Valley, Tibet, Chinese Himalayas. Eng. Geol. 2020, 270, 105572. [Google Scholar] [CrossRef]
  14. Handwerger, A.L.; Fielding, E.J.; Huang, M.-H.; Bennett, G.L.; Liang, C.; Schulz, W.H. Widespread Initiation, Reactivation, and Acceleration of Landslides in the Northern California Coast Ranges due to Extreme Rainfall. J. Geophys. Res. Earth Surf. 2019, 124, 1782–1797. [Google Scholar] [CrossRef]
  15. Dewitte, O.; Jasselette, J.C.; Cornet, Y.; Van Den Eeckhaut, M.; Collignon, A.; Poesen, J.; Demoulin, A. Tracking landslide displacements by multi-temporal DTMs: A combined aerial stereophotogrammetric and LIDAR approach in western Belgium. Eng. Geol. 2008, 99, 11–22. [Google Scholar] [CrossRef]
  16. Schulz, W.H.; McKenna, J.P.; Kibler, J.D.; Biavati, G. Relations between hydrology and velocity of a continuously moving landslide-evidence of pore-pressure feedback regulating landslide motion? Landslides 2009, 6, 181–190. [Google Scholar] [CrossRef]
  17. Froese, C.; Murray, C.; Cavers, D.; Anderson, W.; Bidwell, A.; Read, R.; Cruden, D.; Langenberg, W. Development and implementation of a warning system for the South Peak of Turtle Mountain. In Landslide Risk Management; CRC Press: Boca Raton, FL, USA, 2005; pp. 715–722. [Google Scholar]
  18. Gallo, F.; Lave, J. Evolution of a large landslide in the High Himalaya of central Nepal during the last half-century. Geomorphology 2014, 223, 20–32. [Google Scholar] [CrossRef]
  19. Guo, C.; Zhang, Y.; Montgomery, D.R.; Du, Y.; Zhang, G.; Wang, S. How unusual is the long-runout of the earthquake-triggered giant Luanshibao landslide, Tibetan Plateau, China? Geomorphology 2016, 259, 145–154. [Google Scholar] [CrossRef]
  20. Ruch, C. Georisiken. Akt. Massenbewegungen Am. Albtrauf. LGRB Nachr. 2009, 8, 1–2. [Google Scholar]
  21. Michoud, C.; Bazin, S.; Blikra, L.H.; Derron, M.-H.; Jaboyedoff, M. Experiences from site-specific landslide early warning systems. Nat. Hazards Earth Syst. Sci. 2013, 13, 2659–2673. [Google Scholar] [CrossRef]
  22. Clark, A.R.; Moore, R.; Palmer, J.S. Slope monitoring and early warning systems: Application to coastal landslide on the south and east coast of England, UK. In Proceedings of the Seventh International Symposium on Landslides, Trondheim, Norway, 17–21 June 1996; pp. 1531–1538. [Google Scholar]
  23. McKean, J.; Roering, J. Objective landslide detection and surface morphology mapping using high-resolution airborne laser altimetry. Geomorphology 2004, 57, 331–351. [Google Scholar] [CrossRef]
  24. Moine, M.; Puissant, A.; Malet, J.-P. Detection of landslides from aerial and satellite images with a semi-automatic method. Application to the Barcelonnette basin (Alpes-de-Hautes-Provence, France). In Proceedings of the Landslide Processes-from Geomorphologic Mapping to Dynamic Modelling, Strasbourg, France, 6–7 February 2009; pp. 63–68. [Google Scholar]
  25. Melton, F.A. Aerial photographs and structural geomorphology. J. Geol. 1959, 67, 351–370. [Google Scholar] [CrossRef]
  26. Pollard, D.; Pollard, D.D.; Fletcher, R.C.; Fletcher, R.C. Fundamentals of Structural Geology; Cambridge University Press: New York, NY, USA, 2005. [Google Scholar]
  27. Davis, G.H.; Reynolds, S.J.; Kluth, C.F. Structural Geology of Rocks and Regions; John Wiley & Sons: New York, NY, USA, 2011. [Google Scholar]
  28. Passchier, C.W.; Trouw, R.A. Microtectonics; Springer Science & Business Media: Berlin, Germany, 2005. [Google Scholar]
  29. Fahnestock, M.; Scambos, T.; Moon, T.; Gardner, A.; Haran, T.; Klinger, M. Rapid large-area mapping of ice flow using Landsat 8. Remote Sens. Environ. 2016, 185, 84–94. [Google Scholar] [CrossRef]
  30. Kovalskyy, V.; Roy, D.P. The global availability of Landsat 5 TM and Landsat 7 ETM + land surface observations and implications for global 30 m Landsat data product generation. Remote Sens. Environ. 2013, 130, 280–293. [Google Scholar] [CrossRef]
  31. Wulder, M.A.; White, J.C.; Loveland, T.R.; Woodcock, C.E.; Belward, A.S.; Cohen, W.B.; Fosnight, E.A.; Shaw, J.; Masek, J.G.; Roy, D.P. The global Landsat archive: Status, consolidation, and direction. Remote Sens. Environ. 2016, 185, 271–283. [Google Scholar] [CrossRef]
  32. Corominas, J.; Moya, J. A review of assessing landslide frequency for hazard zoning purposes. Eng. Geol. 2008, 102, 193–213. [Google Scholar] [CrossRef]
  33. Metternicht, G.; Hurni, L.; Gogu, R. Remote sensing of landslides: An analysis of the potential contribution to geo-spatial systems for hazard assessment in mountainous environments. Remote Sens. Environ. 2005, 98, 284–303. [Google Scholar] [CrossRef]
  34. Biswajeet, P.; Saro, L. Utilization of optical remote sensing data and GIS tools for regional landslide hazard analysis using an artificial neural network model. Earth Sci. Front. 2007, 14, 143–151. [Google Scholar] [CrossRef]
  35. Delacourt, C.; Allemand, P.; Berthier, E.; Raucoules, D.; Casson, B.; Grandjean, P.; Pambrun, C.; Varel, E. Remote-sensing techniques for analysing landslide kinematics: A review. Bull. Soc. Geol. Fr. 2007, 178, 89–100. [Google Scholar] [CrossRef]
  36. Gao, J.; Maro, J. Topographic controls on evolution of shallow landslides in pastoral Wairarapa, New Zealand, 1979-2003. Geomorphology 2010, 114, 373–381. [Google Scholar] [CrossRef]
  37. Scaioni, M.; Longoni, L.; Melillo, V.; Papini, M. Remote sensing for landslide investigations: An overview of recent achievements and perspectives. Remote Sens. 2014, 6, 9600–9652. [Google Scholar] [CrossRef]
  38. Frodella, W.; Gigli, G.; Morelli, S.; Lombardi, L.; Casagli, N. Landslide mapping and characterization through infrared thermography (IRT): Suggestions for a methodological approach from some case studies. Remote Sens. 2017, 9, 1281. [Google Scholar] [CrossRef]
  39. Anbalagan, R. Landslide hazard evaluation and zonation mapping in mountainous terrain. Eng. Geol. 1992, 32, 269–277. [Google Scholar] [CrossRef]
  40. Guzzetti, F.; Cardinali, M.; Reichenbach, P. The influence of structural setting and lithology on landslide type and pattern. Environ. Eng. Geosci. 1996, 2, 531–555. [Google Scholar] [CrossRef]
  41. Li, L.; Lan, H.; Peng, J. Loess erosion patterns on a cut-slope revealed by LiDAR scanning. Eng. Geol. 2020, 268, 105516. [Google Scholar] [CrossRef]
  42. Lan, H.; Zhao, X.; Macciotta, R.; Peng, J.; Li, L.; Wu, Y.; Zhu, Y.; Liu, X.; Zhang, N.; Liu, S.; et al. The cyclic expansion and contraction characteristics of a loess slope and implications for slope stability. Sci. Rep. 2021, 11, 2250. [Google Scholar] [CrossRef] [PubMed]
  43. Hoek, E.; Bray, J.D. Rock Slope Engineering; CRC Press: London, UK, 1981. [Google Scholar]
  44. Matheson, G. Rock Stability Assessment in Preliminary Site Investigations—Graphical Methods; Transport and Road Research Laboratory (TRRL): Crowthorne, UK, 1983; ISSN 0266-7045. [Google Scholar]
  45. Priest, S.D. Discontinuity Analysis for Rock Engineering; Springer Science & Business Media: Berlin/Heidelberg, Germany, 1993. [Google Scholar]
  46. Selby, M.J. Mass wasting of soils. In Hillslope Material Processes, 2nd ed.; Oxford University Press: Oxford, UK, 1993; pp. 249–355. [Google Scholar]
  47. Gunther, A.; Carstensen, A.; Pohl, W. Automated sliding susceptibility mapping of rock slopes. Nat. Hazards Earth Syst. Sci. 2004, 4, 95–102. [Google Scholar]
  48. Jaboyedoff, M.; Baillifard, F.; Couture, R.; Locat, J.; Locat, P. Toward preliminary hazard assessment using DEM topographic analysis and simple mechanical modeling by means of sloping local base level. Landslides Eval. Stab. Balkema 2004, 15, 199–205. [Google Scholar]
  49. Glenn, N.F.; Streutker, D.R.; Chadwick, D.J.; Thackray, G.D.; Dorsch, S.J. Analysis of LiDAR-derived topographic information for characterizing and differentiating landslide morphology and activity. Geomorphology 2006, 73, 131–148. [Google Scholar] [CrossRef]
  50. Krauskopf, K.B.; Feitler, S.; Griggs, A.B. Structural features of a landslide near Gilroy, California. J. Geol. 1939, 47, 630–648. [Google Scholar] [CrossRef]
  51. Chowdhury, R.; Zhang, S. Tension cracks and slope failure. In Proceedings of the International Conference: Slope Stability Engineering, Developments and Applications, Thomas Telford, London, UK, 15–18 April 1991; pp. 27–32. [Google Scholar]
  52. Abramson, L.W.; Lee, T.S.; Sharma, S.; Boyce, G.M. Slope Stability and Stabilization Methods; John Wiley & Sons: Hoboken, NJ, USA, 2001. [Google Scholar]
  53. Khattak, G.A.; Owen, L.A.; Kamp, U.; Harp, E.L. Evolution of earthquake-triggered landslides in the Kashmir Himalaya, northern Pakistan. Geomorphology 2010, 115, 102–108. [Google Scholar] [CrossRef]
  54. Shreve, R.L. Sherman landslide, Alaska. Science 1966, 154, 1639–1643. [Google Scholar]
  55. Malet, J.P.; Auzet, A.V.; Maquaire, O.; Ambroise, B.; Descroix, L.; Esteves, M.; Vandervaere, J.P.; Truchet, E. Soil surface characteristics influence on infiltration in black marls: Application to the Super-Sauze earthflow (southern Alps, France). Earth Surf. Process. Landf. J. Br. Geomorphol. Res. Group 2003, 28, 547–564. [Google Scholar]
  56. Malet, J.-P.; Van Asch, T.W.; Beek, R.v.; Maquaire, O. Forecasting the behaviour of complex landslides with a spatially distributed hydrological model. Nat. Hazards Earth Syst. Sci. 2005, 5, 71–85. [Google Scholar]
  57. van Asch, T.W.; Van Beek, L.; Bogaard, T. The diversity in hydrological triggering systems of landslides. In Proceedings of the First Italian Workshop on Landslides, Naples, Italy, 8–10 June 2009; pp. 8–10. [Google Scholar]
  58. Yang, W.; Wang, M.; Shi, P. Using MODIS NDVI time series to identify geographic patterns of landslides in vegetated regions. IEEE Geosci. Remote Sens. Lett. 2012, 10, 707–710. [Google Scholar]
  59. Behling, R.; Roessner, S.; Golovko, D.; Kleinschmit, B. Derivation of long-term spatiotemporal landslide activity-A multi-sensor time series approach. Remote Sens. Environ. 2016, 186, 88–104. [Google Scholar] [CrossRef]
  60. Othman, A.A.; Gloaguen, R. Automatic Extraction and Size Distribution of Landslides in Kurdistan Region, NE Iraq. Remote Sens. 2013, 5, 2389–2410. [Google Scholar] [CrossRef]
  61. Jiang, S.; Wen, B.-P.; Zhao, C.; Li, R.-D.; Li, Z.-H. Kinematics of a giant slow-moving landslide in Northwest China: Constraints from high resolution remote sensing imagery and GPS monitoring. J. Asian Earth Sci. 2016, 123, 34–46. [Google Scholar] [CrossRef]
  62. Barazzetti, L.; Gianinetto, M.; Scaioni, M. A New Approach to Satellite Time-series Co-registration for Landslide Monitoring. In Modern Technologies for Landslide Monitoring and Prediction; Springer: Berlin/Heidelberg, Germany, 2015; pp. 233–249. [Google Scholar]
  63. Boisvenue, C.; Smiley, B.P.; White, J.C.; Kurz, W.A.; Wulder, M.A. Integration of Landsat time series and field plots for forest productivity estimates in decision support models. For. Ecol. Manag. 2016, 376, 284–297. [Google Scholar] [CrossRef]
  64. Kennedy, R.E.; Yang, Z.; Braaten, J.; Copass, C.; Antonova, N.; Jordan, C.; Nelson, P. Attribution of disturbance change agent from Landsat time-series in support of habitat monitoring in the Puget Sound region, USA. Remote Sens. Environ. 2015, 166, 271–285. [Google Scholar] [CrossRef]
  65. Dutrieux, L.P.; Jakovac, C.C.; Latifah, S.H.; Kooistra, L. Reconstructing land use history from Landsat time-series Case study of a swidden agriculture system in Brazil. Int. J. Appl. Earth Obs. Geoinf. 2016, 47, 112–124. [Google Scholar] [CrossRef]
  66. Halabisky, M.; Moskal, L.M.; Gillespie, A.; Hannam, M. Reconstructing semi-arid wetland surface water dynamics through spectral mixture analysis of a time series of Landsat satellite images (1984–2011). Remote Sens. Environ. 2016, 177, 171–183. [Google Scholar] [CrossRef]
  67. Schwieder, M.; Leitao, P.J.; da Cunha Bustamante, M.M.; Ferreira, L.G.; Rabe, A.; Hostert, P. Mapping Brazilian savanna vegetation gradients with Landsat time series. Int. J. Appl. Earth Obs. Geoinf. 2016, 52, 361–370. [Google Scholar] [CrossRef]
  68. Goswami, R.; Mitchell, N.C.; Brocklehurst, S.H. Distribution and causes of landslides in the eastern Peloritani of NE Sicily and western Aspromonte of SW Calabria, Italy. Geomorphology 2011, 132, 111–122. [Google Scholar] [CrossRef]
  69. Mwaniki, M.W.; Agutu, N.O.; Mbaka, J.G.; Ngigi, T.G.; Waithaka, E.H. Landslide scar/soil erodibility mapping using Landsat TM/ETM+ bands 7 and 3 Normalised Difference Index: A case study of central region of Kenya. Appl. Geogr. 2015, 64, 108–120. [Google Scholar] [CrossRef]
  70. Townshend, J.R.; Justice, C. Analysis of the dynamics of African vegetation using the normalized difference vegetation index. Int. J. Remote Sens. 1986, 7, 1435–1445. [Google Scholar]
  71. Li, M.; Zhang, L.; Ding, C.; Li, W.; Luo, H.; Liao, M.; Xu, Q. Retrieval of historical surface displacements of the Baige landslide from time-series SAR observations for retrospective analysis of the collapse event. Remote Sens. Environ. 2020, 240, 111695. [Google Scholar]
  72. Zhan, J.; Chen, J.; Zhang, W.; Han, X.; Sun, X.; Bao, Y. Mass movements along a rapidly uplifting river valley: An example from the upper Jinsha River, southeast margin of the Tibetan Plateau. Environ. Earth Sci. 2018, 77, 1–18. [Google Scholar]
  73. Dandan, Z.; Zhiwei, Z. Biodiversity of arbuscular mycorrhizal fungi in the hot-dry valley of the Jinsha River, southwest China. Appl. Soil Ecol. 2007, 37, 118–128. [Google Scholar]
  74. Ouyang, C.; An, H.; Zhou, S.; Wang, Z.; Su, P.; Wang, D.; Cheng, D.; She, J. Insights from the failure and dynamic characteristics of two sequential landslides at Baige village along the Jinsha River, China. Landslides 2019, 16, 1397–1414. [Google Scholar]
  75. Shao, C.; Li, Y.; Lan, H.; Li, P.; Zhou, R.; Ding, H.; Yan, Z.; Dong, S.; Yan, L.; Deng, T. The role of active faults and sliding mechanism analysis of the 2017 Maoxian postseismic landslide in Sichuan, China. Bull. Eng. Geol. Environ. 2019, 78, 5635–5651. [Google Scholar]
  76. Lan, H.; Zhou, C.; Lee, C.; Wang, S.; Wu, F. Rainfall-induced landslide stability analysis in response to transient pore pressure-A case study of natural terrain landslide in Hong Kong. Sci. China Ser. E Technol. Sci. 2003, 46. [Google Scholar] [CrossRef]
  77. Yin, Y.; Wang, W.; Zhang, N.; Yan, J.; Wei, Y. The June 2017 Maoxian landslide: Geological disaster in an earthquake area after the Wenchuan Ms 8.0 earthquake. Sci. China Technol. Sci. 2017, 60, 1–5. [Google Scholar]
  78. Jiang, H.; Mao, X.; Xu, H.; Yang, H.; Ma, X.; Zhong, N.; Li, Y. Provenance and earthquake signature of the last deglacial Xinmocun lacustrine sediments at Diexi, East Tibet. Geomorphology 2014, 204, 518–531. [Google Scholar]
  79. Su, L.-j.; Hu, K.-h.; Zhang, W.-f.; Wang, J.; Lei, Y.; Zhang, C.-l.; Cui, P.; Pasuto, A.; Zheng, Q.-h. Characteristics and triggering mechanism of Xinmo landslide on 24 June 2017 in Sichuan, China. J. Mt. Sci. 2017, 14, 1689–1700, Erratum in J. Mt. Sci., 2017, 14, 2134–2135. [Google Scholar] [CrossRef]
  80. Yin, Y.; Cheng, Y.; Liang, J.; Wang, W. Heavy-rainfall-induced catastrophic rockslide-debris flow at Sanxicun, Dujiangyan, after the Wenchuan Ms 8.0 earthquake. Landslides 2016, 13, 9–23. [Google Scholar]
  81. Yan, Y.; Cui, Y.; Liu, D.; Tang, H.; Li, Y.; Tian, X.; Zhang, L.; Hu, S. Seismic signal characteristics and interpretation of the 2020 “6.17” Danba landslide dam failure hazard chain process. Landslides 2021, 18, 2175–2192. [Google Scholar]
  82. Guo, C.; Xu, Q.; Dong, X.; Li, W.; Zhao, K.; Lu, H.; Ju, Y. Geohazard Recognition and Inventory Mapping Using Airborne LiDAR Data in Complex Mountainous Areas. J. Earth Sci. 2021, 32, 1079–1091. [Google Scholar]
  83. Yamada, M.; Mangeney, A.; Matsushi, Y.; Matsuzawa, T. Estimation of dynamic friction and movement history of large landslides. Landslides 2018, 15, 1963–1974. [Google Scholar]
  84. Yamada, M.; Mangeney, A.; Matsushi, Y.; Moretti, L. Estimation of dynamic friction of the Akatani landslide from seismic waveform inversion and numerical simulation. Geophys. J. Int. 2016, 206, 1479–1486. [Google Scholar]
  85. Yamada, M.; Matsushi, Y.; Chigira, M.; Mori, J. Seismic recordings of landslides caused by Typhoon Talas (2011), Japan. Geophys. Res. Lett. 2012, 39. [Google Scholar] [CrossRef]
  86. Wang, Y.; Zhao, B.; Li, J. Mechanism of the catastrophic June 2017 landslide at Xinmo village, Songping river, Sichuan province, China. Landslides 2018, 15, 333–345. [Google Scholar]
  87. Huang, F.; Yin, K.; Zhang, G.; Gui, L.; Yang, B.; Liu, L. Landslide displacement prediction using discrete wavelet transform and extreme learning machine based on chaos theory. Environ. Earth Sci. 2016, 75, 1–18. [Google Scholar]
  88. Xia, M.; Ren, G.M.; Yang, X.L. Mechanism of a catastrophic landslide occurred on May 12, 2019, Qinghai Province, China. Landslides 2021, 18, 707–720. [Google Scholar]
  89. De Oliveira Andrades Filho, C.; De FáTima Rossetti, D. Effectiveness of SRTM and ALOS-PALSAR data for identifying morphostructural lineaments in northeastern Brazil. Int. J. Remote Sens. 2012, 33, 1058–1077. [Google Scholar]
  90. Cogan, J.; Gratchev, I. A study on the effect of rainfall and slope characteristics on landslide initiation by means of flume tests. Landslides 2019, 16, 2369–2379. [Google Scholar]
  91. Zhao, S.; Chigira, M.; Wu, X. Gigantic rockslides induced by fluvial incision in the Diexi area along the eastern margin of the Tibetan Plateau. Geomorphology 2019, 338, 27–42. [Google Scholar]
  92. Yang, Y.; Xu, D.; Liu, F.; Zheng, H. Modeling the entire progressive failure process of rock slopes using a strength-based criterion. Comput. Geotech. 2020, 126, 103726. [Google Scholar]
  93. Zhou, G.G.; Roque, P.J.C.; Xie, Y.; Song, D.; Zou, Q.; Chen, H. Numerical study on the evolution process of a geohazards chain resulting from the Yigong landslide. Landslides 2020, 17, 2563–2576. [Google Scholar]
  94. Zhao, X.; Lan, H.; Li, L.; Zhang, Y.; Zhou, C. A multiple-regression model considering deformation information for atmospheric phase screen compensation in ground-based SAR. IEEE Trans. Geosci. Remote Sens. 2019, 58, 777–789. [Google Scholar]
  95. Ouyang, W.; Wu, Y.; Hao, Z.; Zhang, Q.; Bu, Q.; Gao, X. Combined impacts of land use and soil property changes on soil erosion in a mollisol area under long-term agricultural development. Sci. Total Environ. 2018, 613, 798–809. [Google Scholar]
  96. Cen, D.; Huang, D.; Ren, F. Shear deformation and strength of the interphase between the soil–rock mixture and the benched bedrock slope surface. Acta Geotech. 2017, 12, 391–413. [Google Scholar]
  97. Stark, T.D.; Choi, H.; McCone, S. Drained shear strength parameters for analysis of landslides. J. Geotech. Geoenviron. Eng. 2005, 131, 575–588. [Google Scholar]
  98. Li, L.; Zhao, C.; Huang, J.; Huan, C.; Wu, H.; Xu, P.; Yuan, L.; Chen, Y. Complex Surface Deformation of the Coalfield in the Northwest Suburbs of Xuzhou from 2015 to 2020 Revealed by Time Series InSAR. Can. J. Remote Sens. 2021, 47, 697–718. [Google Scholar] [CrossRef]
  99. Intrieri, E.; Gigli, G.; Casagli, N.; Nadim, F. Brief communication" Landslide Early Warning System: Toolbox and general concepts". Nat. Hazards Earth Syst. Sci. 2013, 13, 85–90. [Google Scholar]
  100. Massonnet, D.; Feigl, K.; Rossi, M.; Adragna, F. Radar interferometric mapping of deformation in the year after the Landers earthquake. Nature 1994, 369, 227–230. [Google Scholar] [CrossRef]
  101. Fielding, E.J.; Blom, R.G.; Goldstein, R.M. Rapid subsidence over oil fields measured by SAR interferometry. Geophys. Res. Lett. 1998, 25, 3215–3218. [Google Scholar] [CrossRef]
  102. Singhroy, V.; Mattar, K.E.; Gray, A.L. Landslide characterisation in Canada using interferometric SAR and combined SAR and TM images. Adv. Space Res. 1998, 21, 465–476. [Google Scholar]
  103. Zhou, C.; Lan, H.; Gong, H.; Zhang, Y.; Warner, T.A.; Clague, J.J.; Wu, Y. Reduced rate of land subsidence since 2016 in Beijing, China: Evidence from Tomo-PSInSAR using RadarSAT-2 and Sentinel-1 datasets. Int. J. Remote Sens. 2020, 41, 1259–1285. [Google Scholar]
  104. Lan, H.; Gao, X.; Liu, H.; Yang, Z.; Li, L. Integration of TerraSAR-X and PALSAR PSI for detecting ground deformation. Int. J. Remote Sens. 2013, 34, 5393–5408. [Google Scholar]
  105. Izumi, Y.; Nico, G.; Sato, M. Time-Series Clustering Methodology for Estimating Atmospheric Phase Screen in Ground-Based InSAR Data. IEEE Trans. Geosci. Remote Sens. 2021, 60, 1–9. [Google Scholar]
  106. Ferretti, A.; Monti-Guarnieri, A.; Prati, C.; Rocca, F.; Massonnet, D.; Lichtenegger, J. ESA/ESRIN (Retired); ESA Publications: Frascati, Italy, 2007. [Google Scholar]
  107. Liu, P.; Li, Z.; Hoey, T.; Kincal, C.; Zhang, J.; Zeng, Q.; Muller, J.-P. Using advanced InSAR time series techniques to monitor landslide movements in Badong of the Three Gorges region, China. Int. J. Appl. Earth Obs. Geoinf. 2013, 21, 253–264. [Google Scholar] [CrossRef]
  108. Ferretti, A.; Prati, C.; Rocca, F. Permanent scatterers in SAR interferometry. IEEE Trans. Geosci. Remote Sens. 2001, 39, 8–20. [Google Scholar]
  109. Kampes, B.M. Radar Interferometry; Springer: Dordrecht, The Netherlands, 2006; Volume 12. [Google Scholar]
  110. Prati, C.; Ferretti, A.; Perissin, D. Recent advances on surface ground deformation measurement by means of repeated space-borne SAR observations. J. Geodyn. 2010, 49, 161–170. [Google Scholar]
  111. Ferretti, A.; Fumagalli, A.; Novali, F.; Prati, C.; Rocca, F.; Rucci, A. A New Algorithm for Processing Interferometric Data-Stacks: SqueeSAR. IEEE Trans. Geosci. Remote Sens. 2011, 49, 3460–3470. [Google Scholar] [CrossRef]
  112. Lan, H.; Li, L.; Liu, H.; Yang, Z. Complex Urban Infrastructure Deformation Monitoring Using High Resolution PSI. IEEE J. Sel. Top. Appl. Earth Obs. Remote Sens. 2012, 5, 643–651. [Google Scholar] [CrossRef]
  113. Ferretti, A.; Prati, C.; Rocca, F. Nonlinear subsidence rate estimation using permanent scatterers in differential SAR interferometry. IEEE Trans. Geosci. Remote Sens. 2000, 38, 2202–2212. [Google Scholar]
  114. Berardino, P.; Costantini, M.; Franceschetti, G.; Iodice, A.; Pietranera, L.; Rizzo, V. Use of differential SAR interferometry in monitoring and modelling large slope instability at Maratea (Basilicata, Italy). Eng. Geol. 2003, 68, 31–51. [Google Scholar] [CrossRef]
  115. Colesanti, C.; Ferretti, A.; Novali, F.; Prati, C.; Rocca, F. SAR monitoring of progressive and seasonal ground deformation using the permanent scatterers technique. IEEE Trans. Geosci. Remote Sens. 2003, 41, 1685–1701. [Google Scholar]
  116. Hilley, G.E.; Burgmann, R.; Ferretti, A.; Novali, F.; Rocca, F. Dynamics of slow-moving landslides from permanent scatterer analysis. Science 2004, 304, 1952–1955. [Google Scholar] [CrossRef]
  117. Tofani, V.; Raspini, F.; Catani, F.; Casagli, N. Persistent Scatterer Interferometry (PSI) Technique for Landslide Characterization and Monitoring. Remote Sens. 2013, 5, 1045–1065. [Google Scholar] [CrossRef]
  118. Komac, M.; Holley, R.; Mahapatra, P.; van der Marel, H.; Bavec, M. Coupling of GPS/GNSS and radar interferometric data for a 3D surface displacement monitoring of landslides. Landslides 2015, 12, 241–257. [Google Scholar] [CrossRef]
  119. Carla, T.; Raspini, F.; Intrieri, E.; Casagli, N. A simple method to help determine landslide susceptibility from spaceborne InSAR data: The Montescaglioso case study. Environ. Earth Sci. 2016, 75, 1492. [Google Scholar] [CrossRef]
  120. Frodella, W.; Ciampalini, A.; Gigli, G.; Lombardi, L.; Raspini, F.; Nocentini, M.; Scardigli, C.; Casagli, N. Synergic use of satellite and ground based remote sensing methods for monitoring the San Leo rock cliff (Northern Italy). Geomorphology 2016, 264, 80–94. [Google Scholar] [CrossRef]
  121. Kuang, J.; Ge, L.; Ng, A.H.-M.; Du, Z.; Zhang, Q. Detection of Pre-Failure Deformation of the 2017 Maoxian Landslide with Time-Series Insar and Multi-Temporal Optical Datasets. In Proceedings of the IGARSS 2020—2020 IEEE International Geoscience and Remote Sensing Symposium, Waikoloa, HI, USA, 26 September–2 October 2020; pp. 5139–5142. [Google Scholar]
  122. Moretto, S.; Bozzano, F.; Mazzanti, P. The role of satellite InSAR for landslide forecasting: Limitations and openings. Remote Sens. 2021, 13, 3735. [Google Scholar] [CrossRef]
  123. Intrieri, E.; Bardi, F.; Fanti, R.; Gigli, G.; Fidolini, F.; Casagli, N.; Costanzo, S.; Raffo, A.; Massa, G.D.; Capparelli, G. Big data managing in a landslide early warning system: Experience from a ground-based interferometric radar application. Nat. Hazards Earth Syst. Sci. 2017, 17, 1713–1723. [Google Scholar] [CrossRef] [Green Version]
  124. Fan, X.; Xu, Q.; Alonso-Rodriguez, A.; Subramanian, S.S.; Li, W.; Zheng, G.; Dong, X.; Huang, R. Successive landsliding and damming of the Jinsha River in eastern Tibet, China: Prime investigation, early warning, and emergency response. Landslides 2019, 16, 1003–1020. [Google Scholar] [CrossRef]
  125. Larsen, I.J.; Montgomery, D.R. Landslide erosion coupled to tectonics and river incision. Nat. Geosci. 2012, 5, 468–473. [Google Scholar] [CrossRef]
  126. Cui, Y.; Bao, P.; Xu, C.; Fu, G.; Jiao, Q.; Luo, Y.; Shen, L.; Xu, X.; Liu, F.; Lyu, Y.; et al. A big landslide on the Jinsha River, Tibet, China: Geometric characteristics, causes, and future stability. Nat. Hazards 2020, 104, 2051–2070. [Google Scholar] [CrossRef]
  127. Li, Y.; Jiao, Q.; Hu, X.; Li, Z.; Li, B.; Zhang, J.; Jiang, W.; Luo, Y.; Li, Q.; Ba, R. Detecting the slope movement after the 2018 Baige Landslides based on ground-based and space-borne radar observations. Int. J. Appl. Earth Obs. Geoinf. 2020, 84. [Google Scholar] [CrossRef]
  128. Yang, W.; Liu, L.; Shi, P. Detecting precursors of an imminent landslide along the Jinsha River. Nat. Hazards Earth Syst. Sci. 2020, 20, 3215–3224. [Google Scholar] [CrossRef]
  129. Zhang, S.-l.; Yin, Y.-p.; Hu, X.-w.; Wang, W.-p.; Zhu, S.-n.; Zhang, N.; Cao, S.-h. Initiation mechanism of the Baige landslide on the upper reaches of the Jinsha River, China. Landslides 2020, 17, 2865–2877. [Google Scholar] [CrossRef]
  130. Cao, P.; Chen, Z.; Zhang, S.; Li, Y.; Li, Z.; Ba, R. Locking effect of granodiorite porphyry veins on the deformation of Baige landslide (eastern Tibetan plateau, Tibet). Arab. J. Geosci. 2021, 14, 2224. [Google Scholar] [CrossRef]
  131. Chen, Z.; Zhou, H.; Ye, F.; Liu, B.; Fu, W. The characteristics, induced factors, and formation mechanism of the 2018 Baige landslide in Jinsha River, Southwest China. Catena 2021, 203, 105337. [Google Scholar] [CrossRef]
  132. Liu, X.; Zhao, C.; Zhang, Q.; Lu, Z.; Li, Z. Deformation of the Baige landslide, Tibet, China, revealed through the integration of cross-platform ALOS/PALSAR-1 and ALOS/PALSAR-2 SAR observations. Geophys. Res. Lett. 2020, 47, e2019GL086142. [Google Scholar] [CrossRef]
  133. Jia, H.; Wang, Y.; Ge, D.; Deng, Y.; Wang, R. Improved offset tracking for predisaster deformation monitoring of the 2018 Jinsha River landslide (Tibet, China). Remote Sens. Environ. 2020, 247, 111899. [Google Scholar] [CrossRef]
  134. Saito, M. Forecasting time of slope failure by tertiary creep. In Proceedings of the 7th International Conference on Soil Mechanics and Foundation Engineering, Mexico City, Mexico, 25–29 August 1969; pp. 677–683. [Google Scholar]
  135. Zhou, H.; Zheng, G.; Yin, X.; Jia, R.; Yang, X. The bearing capacity and failure mechanism of a vertically loaded strip footing placed on the top of slopes. Comput. Geotech. 2018, 94, 12–21. [Google Scholar] [CrossRef]
  136. Zhao, C.; Xu, M. Deformation and instability mechanism of reservoir landslide: A case study. In Proceedings of the China-Europe Conference on Geotechnical Engineering, Vienna, Austria, 13–16 August 2018; pp. 1579–1582. [Google Scholar]
  137. Wang, P.; Ren, X.; Yin, H.; Qin, Z. The study of monitoring Qinghai-Tibet plateau frozen ground motion from PALSAR data. Geotech. Investig. Surv. 2010, 38, 55–58,62. [Google Scholar]
  138. Wu, Q.; Hou, Y.; Yun, H.; Liu, Y. Changes in active-layer thickness and near-surface permafrost between 2002 and 2012 in alpine ecosystems, Qinghai-Xizang (Tibet) Plateau, China. Glob. Planet. Chang. 2015, 124, 149–155. [Google Scholar] [CrossRef]
  139. Jin, L.; Wang, S.; Chen, J.; Dong, Y. Study on the height effect of highway embankments in permafrost regions. Cold Reg. Sci. Technol. 2012, 83–84, 122–130. [Google Scholar] [CrossRef]
  140. Chang, L.; Hanssen, R.F. Detection of permafrost sensitivity of the Qinghai-Tibet railway using satellite radar interferometry. Int. J. Remote Sens. 2015, 36, 691–700. [Google Scholar] [CrossRef]
  141. Liu, X.; Qin, H.; Lan, H. On the relationship between soil strength and wave velocities of sandy loess subjected to freeze-thaw cycling. Soil Dyn. Earthq. Eng. 2020, 136, 106216. [Google Scholar] [CrossRef]
  142. Meng, Y.; Lan, H.; Li, L.; Wu, Y.; Li, Q. Characteristics of surface deformation detected by X-band SAR Interferometry over Sichuan-Tibet grid connection project area, China. Remote Sens. 2015, 7, 12265–12281. [Google Scholar] [CrossRef]
  143. Xu, Q.; Shang, Y.; van Asch, T.; Wang, S.; Zhang, Z.; Dong, X. Observations from the large, rapid Yigong rock slide - debris avalanche, southeast Tibet. Can. Geotech. J. 2012, 49, 589–606. [Google Scholar] [CrossRef]
  144. Quattrochi, D.A.; Luvall, J.C. Thermal infrared remote sensing for analysis of landscape ecological processes: Methods and applications. Landsc. Ecol. 1999, 14, 577–598. [Google Scholar] [CrossRef]
  145. Weng, Q.; Lu, D.; Schubring, J. Estimation of land surface temperature–vegetation abundance relationship for urban heat island studies. Remote Sens. Environ. 2004, 89, 467–483. [Google Scholar] [CrossRef]
  146. Qin, Z.; Karnieli, A.; Berliner, P. A mono-window algorithm for retrieving land surface temperature from Landsat TM data and its application to the Israel-Egypt border region. Int. J. Remote Sens. 2001, 22, 3719–3746. [Google Scholar] [CrossRef]
  147. Qin, Z.; Gao, M.; Qin, X.; Li, W.; Xu, B. Methodology to retrieve land surface temperature from MODIS data for agricultural drought monitoring in China. J. Nat. Disasters 2005, 14, 64–71. [Google Scholar]
  148. Sobrino, J.A.; Gomez, M.; Jimenez-Munoz, J.C.; Olioso, A.; Chehbouni, G. A simple algorithm to estimate evapotranspiration from DAIS data: Application to the DAISEX campaigns. J. Hydrol. 2005, 315, 117–125. [Google Scholar] [CrossRef]
  149. Duan, S.; Ru, C.; Li, Z.; Wang, M.; Xu, H.; Li, H.; Wu, P.; Zhan, W.; Zhou, J.; Zhao, W.; et al. Reviews of methods for land surface temperature retrieval from Landsat thermal infrared data. J. Remote Sens. 2021, 25, 1591–1617. [Google Scholar]
  150. Holland, R. Landforms of British Columbia: A physiographic outline. Br. Columbia Dept. Mines Pet. Res. Bull. 1976, 48, 138. [Google Scholar]
  151. Hinds, S.J.; Cecile, M.; Spratt, D.A. Geology, Pink Mountain and Northwest Cypress Creek Map Areas (94G/2 and NW 94B/15) British Columbia; Geological Survey of Canada: Ottawa, ON, Canada, 2003.
  152. Meidinger, D.; Pojar, J. Ecosystems of British Columbia; Special Report Series; Ministry of Forests: Clearwater, BC, Canada, 1991.
  153. Mathews, W.H. Retreat of the last Ice Sheets in Northeastern British Columbia and Adjacent Alberta. 1980. Available online: https://www.semanticscholar.org/paper/Retreat-of-the-last-ice-sheets-in-northeastern-and-Mathews/1e345f512be3f9791ff13ece6fa1df63efbf547a (accessed on 3 July 2022).
  154. Bednarski, J. Preliminary report on mapping surficial geology of Trutch map area, northeastern British Columbia. Curr. Res. 1999, 35–43. [Google Scholar]
  155. Bednarski, J. Drift composition and surficial geology of the Trutch map area (94G), northeastern British Columbia. Open File D 2001, 3815. [Google Scholar]
  156. Dyke, A.; Andrews, J.; Clark, P.; England, J.; Miller, G.; Shaw, J.; Veillette, J. The Laurentide and Innuitian ice sheets during the last glacial maximum. Quat. Sci. Rev. 2002, 21, 9–31. [Google Scholar] [CrossRef]
  157. Bobrowsky, P.; Rutter, N. The quaternary geologic history of the Canadian Rocky Mountains. Géogr. Phys. Quat. 1992, 46, 5–50. [Google Scholar]
  158. Geertsema, M.; Hungr, O.; Schwab, J.W.; Evans, S.G. A large rockslide-debris avalanche in cohesive soil at Pink Mountain, northeastern British Columbia, Canada. Eng. Geol. 2006, 83, 64–75. [Google Scholar] [CrossRef]
  159. Schwab, J.; Geertsema, M.; Evans, S. Catastrophic rock avalanches, west-central BC, Canada. In Proceedings of the 3rd Canadian Conference on Geotechnique and Natural Hazards, Edmonton, AB, Canada, 8–10 June 2003; pp. 252–259. [Google Scholar]
  160. Geertsema, M.; Clague, J.J.; Schwab, J.W.; Evans, S.G. An overview of recent large catastrophic landslides in northern British Columbia, Canada. Eng. Geol. 2006, 83, 120–143. [Google Scholar] [CrossRef]
  161. Keefer, D.K. Landslides caused by earthquakes. Geol. Soc. Am. Bull. 1984, 95, 406–421. [Google Scholar]
  162. Clague, J.J.; Evans, S.G.; Rampton, V.N.; Woodsworth, G.J. Improved age estimates for the White River and Bridge River tephras, western Canada. Can. J. Earth Sci. 1995, 32, 1172–1179. [Google Scholar]
  163. Hickson, C.; Russell, J.; Stasiuk, M. Volcanology of the 2350 BP eruption of Mount Meager volcanic complex, British Columbia, Canada: Implications for hazards from eruptions in topographically complex terrain. Bull. Volcanol. 1999, 60, 489–507. [Google Scholar]
  164. Clague, J.J.; Ward, B. Pleistocene glaciation of british Columbia. In Developments in Quaternary Sciences; Elsevier: Amsterdam, The Netherlands, 2011; Volume 15, pp. 563–573. [Google Scholar]
  165. Bovis, M.J.; Jakob, M. The July 29, 1998, debris flow and landslide dam at Capricorn Creek, Mount Meager Volcanic Complex, southern Coast Mountains, British Columbia. Can. J. Earth Sci. 2000, 37, 1321–1334. [Google Scholar]
  166. Holm, K.; Bovis, M.; Jakob, M. The landslide response of alpine basins to post-Little Ice Age glacial thinning and retreat in southwestern British Columbia. Geomorphology 2004, 57, 201–216. [Google Scholar]
  167. Evans, S.G.; Clague, J.J. Recent climatic change and catastrophic geomorphic processes in mountain environments. In Geomorphology and Natural Hazards; Elsevier: Amsterdam, The Netherlands, 1994; pp. 107–128. [Google Scholar]
  168. Allen, S.K.; Gruber, S.; Owens, I.F. Exploring Steep Bedrock Permafrost and its Relationship with Recent Slope Failures in the Southern Alps of New Zealand. Permafr. Periglac. Process. 2009, 20, 345–356. [Google Scholar] [CrossRef]
  169. Gruber, S.; Haeberli, W. Permafrost in steep bedrock slopes and its temperature-related destabilization following climate change. J. Geophys. Res. Earth Surf. 2007, 112, F02S18. [Google Scholar] [CrossRef]
  170. Chleborad, A.F. Temperature, Snowmelt, and the Onset of Spring Season Landslides in the Central Rocky Mountains; US Department of the Interior, US Geological Survey: Reston, VA, USA, 1997.
  171. Gruber, S.; Hoelzle, M.; Haeberli, W. Permafrost thaw and destabilization of Alpine rock walls in the hot summer of 2003. Geophys. Res. Lett. 2004, 31, L13504. [Google Scholar] [CrossRef]
  172. Harris, C.; Arenson, L.U.; Christiansen, H.H.; Etzelmuller, B.; Frauenfelder, R.; Gruber, S.; Haeberli, W.; Hauck, C.; Hoelzle, M.; Humlum, O.; et al. Permafrost and climate in Europe: Monitoring and modelling thermal, geomorphological and geotechnical responses. Earth Sci. Rev. 2009, 92, 117–171. [Google Scholar] [CrossRef]
  173. Keiler, M.; Knight, J.; Harrison, S. Climate change and geomorphological hazards in the eastern European Alps. Philos. Trans. R. Soc. A-Math. Phys. Eng. Sci. 2010, 368, 2461–2479. [Google Scholar] [CrossRef]
  174. Shang, Y.J.; Yang, Z.F.; Li, L.H.; Liu, D.; Liao, Q.L.; Wang, Y.C. A super-large landslide in Tibet in 2000: Background, occurrence, disaster, and origin. Geomorphology 2003, 54, 225–243. [Google Scholar] [CrossRef]
  175. Delaney, K.B.; Evans, S.G. The 2000 Yigong landslide (Tibetan Plateau), rockslide-dammed lake and outburst flood: Review, remote sensing analysis, and process modelling. Geomorphology 2015, 246, 377–393. [Google Scholar]
  176. Yin, Y. Characteristics of Bomi-Yigong huge high speed landslide in Tibet and the research on disaster prevention. Hydrogeol. Eng. Geol 2000, 27, 8–11. [Google Scholar]
  177. Zhou, Z. Large scale sand flow with wind in north and heavy rainfall in South China in April 2000. Weather 2000, 26, 58–59. [Google Scholar]
  178. Xu, Q.; Fan, X.-M.; Huang, R.-Q.; Westen, C.V. Landslide dams triggered by the Wenchuan Earthquake, Sichuan Province, south west China. Bull. Eng. Geol. Environ. 2009, 68, 373–386. [Google Scholar]
  179. Liu, G.; Lu, X. Analyses on Yigong huge high velocity landslide in Tibet and the cause of formation of debris flows. Tibet Sci. Technol. 2000, 04, 15–17. [Google Scholar]
  180. Wang, Z. The scientist in Beijing predicted the burst of Yigong Lake correctly. Knowl. Geogr. 2000, 7, 24–26. [Google Scholar]
  181. Samsonov, S.; Dille, A.; Dewitte, O.; Kervyn, F.; d’Oreye, N. Satellite interferometry for mapping surface deformation time series in one, two and three dimensions: A new method illustrated on a slow-moving landslide. Eng. Geol. 2020, 266, 105471. [Google Scholar]
Figure 1. Will a landslide happen here?
Remotesensing 14 04399 g001
Figure 2. Evolution of tensile cracks. The red (ad) and yellow (e) lines represent the tensile cracks that near the toe and crown of the landslide, respectively.
Remotesensing 14 04399 g002
Figure 3. (a) Before and after the landslide. (b) Erosion ditch evolution to a landslide. (c) Change in the length of the erosion ditch before the landslide. (d) Area of erosion before the landslide.
Remotesensing 14 04399 g003
Figure 4. (a) Field photo of the Xinmo landslide. (b) Prefailure ground deformation map for the Xinmo landslide. (c) Representative deformation time series at measurement points in the source area (adapted with permission from [11]. 2018, Intrieri, E. et al.
Remotesensing 14 04399 g004
Figure 5. (a) Baige landslide (inside the red circle on the Google Earth image). (b) Temporal displacement patterns of the displacement rate as creep curves. (c) Temporal displacement patterns of the standard landslide model. The red circle on (b,c) indicate that the landslide entered a critical sliding stage and would soon enter the stage of failure. ((b,c) are adapted with permission from [133]. 2020, Jia et al.).
Remotesensing 14 04399 g005
Figure 7. (a) Mount Meager landslide (inside the red circle on the Google Earth image). (b) Temperature range of the Mount Meager landslide. The red square on (b) indicates the corresponding temperature at the landslide occurrence.
Remotesensing 14 04399 g007
Figure 8. Thermal infrared monitoring points (a) and temperature change range (b) of the Yigong landslide. The red line and the black line in (b) are the fitting curve of the temperature data for the nine monitoring points, and the red circle indicates that the corresponding temperature range of landslide occurrence.
Remotesensing 14 04399 g008aRemotesensing 14 04399 g008b
Table 1. Landslide precursor types and methods of capture.
Precursor TypePhenomenaMethods of CaptureRemote Sensing Methods
GeomorphologicalScarp extension, rupture, cracking, ditchesField surveys, remote sensingOptical/microwave remote sensing
GeologicalLithology, geological structureField surveys, remote sensingMainly optical remote sensing
Geotechnical (movement)Slope deformation, change in the cover characteristicsGround stations and remote sensingOptical/microwave remote sensing
HydrologicalWater color, flow speed, water contentMainly field surveys and monitoringOptical/microwave remote sensing
Geoenvironmental (thermal changes)Temperature and snow line variationsField surveys, remote sensing, and monitoringThermal remote sensing
OtherSeismic waves, etc.In situ investigation___
Table 2. Outline of the advantages and limitations of main remote sensing methods for capturing landslide precursors.
Precursor TypesRemote Sensing MethodsAdvantagesLimitationsPotential PriorityReference
Geomorphological precursors (cracking, erosion ditches)Optical
  • Superior capture accuracy with high-resolution optical images.
  • Continuous time-series evolution characteristics with medium-resolution optical images.
  • Single spectral information is inadequate to characterize landslide precursors.
  • Unavoidable bias and blur in spectral imaging.
  • Fused multi-source spectral databases.
  • Well-established radiation correction and spectral enhancement techniques.
Yang, W. et al., 2012 [58];
Behling, R. et al., 2016 [59];
Barazzetti, L. et al., 2015 [62];
Schwieder, M. et al., 2016 [67];
Yin, Y. et al., 2017 [77];
Li, M. et al., 2020 [71].
Geotechnical precursor (movements)SAR
  • Large-scale and long time series surface deformation data from InSAR.
  • Detection of early deformed slopes and prediction of potential failure slopes.
  • The magnitude and extent of captured deformation features are limited by the phase gradients of SAR data.
  • Weak or unstable radar signals for specific land use types such as water areas and high vegetation cover.
  • Higher spatial and temporal resolution images with more pixels, yielding finer phase gradients and simpler phase unwrapping.
Massonnet, D. et al., 1994 [100];
Fielding, E.J. et al., 1998 [101];
Ferretti, A. et al., 2001 and 2011 [109,112];
Kampes, B.M., 2006 [110];
Zhao, X. et al., 2020 [106];
Samsonov, S. et al., 2020 [181].
Environmental (thermal) precursorsInfrared
  • Large-range and long time series of the surface temperature data.
  • Sustained temperature rises trends and peaks provide the initiation time of landslides.
  • Superiority of capturing landslide precursors is regionally significant in glaciers and snowfields.
  • Algorithm-influenced variations in temperature inversion accuracy may cause errors in capturing landslide precursor information.
  • Implementation of dedicated temperature inversion algorithms for individual study scales and specific landslide-prone zones.
Mokievsky-Zubok, O. et al., 1977 [169];
Evans, S.G. et al.,1994 [170];
Holm, K. et al., 2004 [168];
Geertsema, M. et al., 2006 [160,162];
Allen, S.K. et al., 2009 [171];
Keiler, M. et al., 2010 [176];
Duan, S. et al., 2021 [151].
Publisher’s Note: MDPI stays neutral with regard to jurisdictional claims in published maps and institutional affiliations.

