Technical Note

Method on Early Identification of Low-Frequency Debris Flow Gullies along the Highways in the Chuanxi Plateau

1
Key Lab of Mountain Hazards and Surface Processes, Institute of Mountain Hazards and Environment, Chinese Academy of Sciences, Chengdu 610041, China
2
Academy of Plateau Science and Sustainability, Xining 810016, China
3
Kathmandu Center for Research and Education, Chinese Academy of Sciences-Tribhuvan University, Beijing 100101, China
4
University of Chinese Academy of Sciences, Beijing 100049, China
5
Department of Civil Engineering, International University of Business Agriculture and Technology (IUBAT), Dhaka 1230, Bangladesh
6
Faculty of Public Safety and Emergency Management, Kunming University of Science and Technology, Kunming 650093, China
*
Author to whom correspondence should be addressed.
Remote Sens. 2023, 15(5), 1183; https://doi.org/10.3390/rs15051183
Submission received: 21 December 2022 / Revised: 1 February 2023 / Accepted: 20 February 2023 / Published: 21 February 2023
(This article belongs to the Special Issue Geological Applications of Remote Sensing and Photogrammetry)

Abstract

:
Low-frequency debris flows are characterized by strong concealment, high potential danger, and difficulty achieving an early warning; hence early identification of low-frequency debris flow gullies is crucial to mitigation. Here, an identification system for low-frequency debris flow gullies along the traffic arteries in the Chuanxi Plateau is proposed based on the identification and stability calculation of colluvium deposits in a hollow region (CDH) and the quantitative roundness analysis for the stones in a deposit fan. At first, for the watershed without a deposit fan, the CDH is identified and analyzed using the geomorphologic change point detection method combined with high-precision remote sensing images and field investigation. The watershed can be identified as a low-frequency debris flow gully with the safety factors (Fs) of all CDHs greater than 1. Then, the roundness of stones in the deposit fan is quantitatively analyzed. The watershed can also be identified as a low-frequency debris flow gully with the average roundness of the stones ranging from 0.30 to 0.41. Lastly, the identification system was tested and verified based on another ten watersheds along three traffic arteries. It shows that the method proposed in this paper has good applicability and high accuracy. Here we try to achieve the accurate early identification of low-frequency debris flow gullies by combining remote sensing interpretation and field investigation, which can provide theoretical support for predicting and mitigating debris flows in mountainous areas.

1. Introduction

As the economic carrier, the highway is important in driving the local economy along mountainous areas. According to the Sichuan Traffic Yearbook, with the upgrading of the Great Western Development Strategy, the mileage of expressways in Sichuan province exceeded 8000 km in 2020, and the total mileage built and under construction exceeded 10,000 km in 2019. There are more than 30 traffic arteries, such as G318, G108, G351, and G345; 29 newly built expressways, including Wenma and Lexi expressways; and 9 new construction expressways, including the Majiu expressway in the Chuanxi Plateau. All have been damaged and threatened by geological hazards in different degrees. One of the most important hazards is debris flow, which is a significant threat to the roadbed, tunnel, culvert, and bridge across the deposit fan, especially the low-frequency debris flow with a large mass of solid material. For a linear project such as a highway, once the damage is caused, the traffic of the whole line is often paralyzed, and the traffic interruption caused by debris flow accounts for 30~40% of the highway traffic time [1]. For example, the low-frequency debris flow disaster in Chenghuangmiao gully, Xiaojin County, Sichuan, on 7 July 2020, caused four deaths and disruption of National Highway G350 [2]. On 8 August 2017, a low-frequency debris flow in Puge County, Sichuan, killed 25 people and destroyed 5 km of roads and five bridges [3]. After the 2008 Wenchuan earthquake, the regional geological environment was damaged, producing a large amount of loose soil mass and providing abundant materials for debris flow. The large-scale low-frequency debris flow has become the main “killer” on the highway in the mountainous area of the Chuanxi Plateau [4,5,6].
The recurrence period classifies debris flows into high-frequency, medium-frequency, and low-frequency debris flows [7]. A low-frequency debris flow refers to debris flows with a recurrence period longer than 50 years [8,9,10]. It has the characteristics of strong concealment, large energy release, and large scale. Local residents and observers of community-based warning systems are not highly sensitive to such debris flows [10]. Once the low-frequency debris flow occurs, it often causes huge economic losses and mass casualties. For instance, on 8 May 2016, a low-frequency debris flow disaster occurred in several watersheds of the Chi-tan Hydropower Station in Taining County, Fujian province, and 36 people died from the most considerable debris flow in the Luankeng gully [11]. On 7 August 2010, the once-in-a-century low-frequency debris flow in Zhouqu County, Gansu Province, China, killed more than 1700 people and caused direct economic losses of hundreds of millions of CNY [12]. In December 1999, a once-in-three-centuries debris flow broke out in Venezuela, killing more than 30,000 people [13].
At present, the main methods for identifying debris flow gullies are field investigation [14,15,16], critical value identification [17,18,19], statistical models [20,21,22], and machine learning [9,23], etc. Field investigations can only identify low-frequency debris flow gullies that have already occurred and are often restricted by the inaccessible regions. Regarding factor selection, the critical value identification and statistical models mainly focus on topographic and geomorphologic factors. The consideration of the solid mass that initiates debris flows and the methods specifically for the identification of low-frequency debris flow gullies are still lacking. Furthermore, the machine learning method requires many cases to train the model. Therefore, for watersheds with high vegetation coverage, no recent debris flows, and insignificant gully characteristics, it is difficult to effectively identify potential low-frequency debris flow gullies by the above methods. In addition, previous studies have shown that two representative characteristics of low-frequency debris flow are the roundness value of stones in the watershed and colluvium deposits in a hollow region (CDH) [24,25]. CDH refers to colluvial deposits in the geomorphic hollow at the gully head [26,27]. This kind of soil mass refers to the residual soil that falls and accumulates in the hollow, which forms relatively stable soil with a certain thickness under continuous rainfall erosion. It is the first unstable soil mass of low-frequency debris flows [11]. The roundness value of the stones in the deposit fan can reflect the time that the angular stones stayed in the deposition area, before being carried by the last debris flow in the watershed [28]. In summary, there is a lack of systematic identification methods for low-frequency debris flow gullies. Therefore, based on the watershed along the traffic arteries in the Chuanxi Plateau, this paper tries to propose an identification system for low-frequency debris flow gullies through the identification and stable analysis of CDH and quantitative roundness analysis of the stones in the deposit fan. Moreover, the method was verified in ten other watersheds in the Chuanxi Plateau. The identification method of low-frequency debris flow along highways can give theoretical support for early monitoring, warning, and prevention of debris flows, provide a strong guarantee for highway construction, and improve the level of debris flow disaster prevention and mitigation in mountainous areas.

2. Materials and Methods
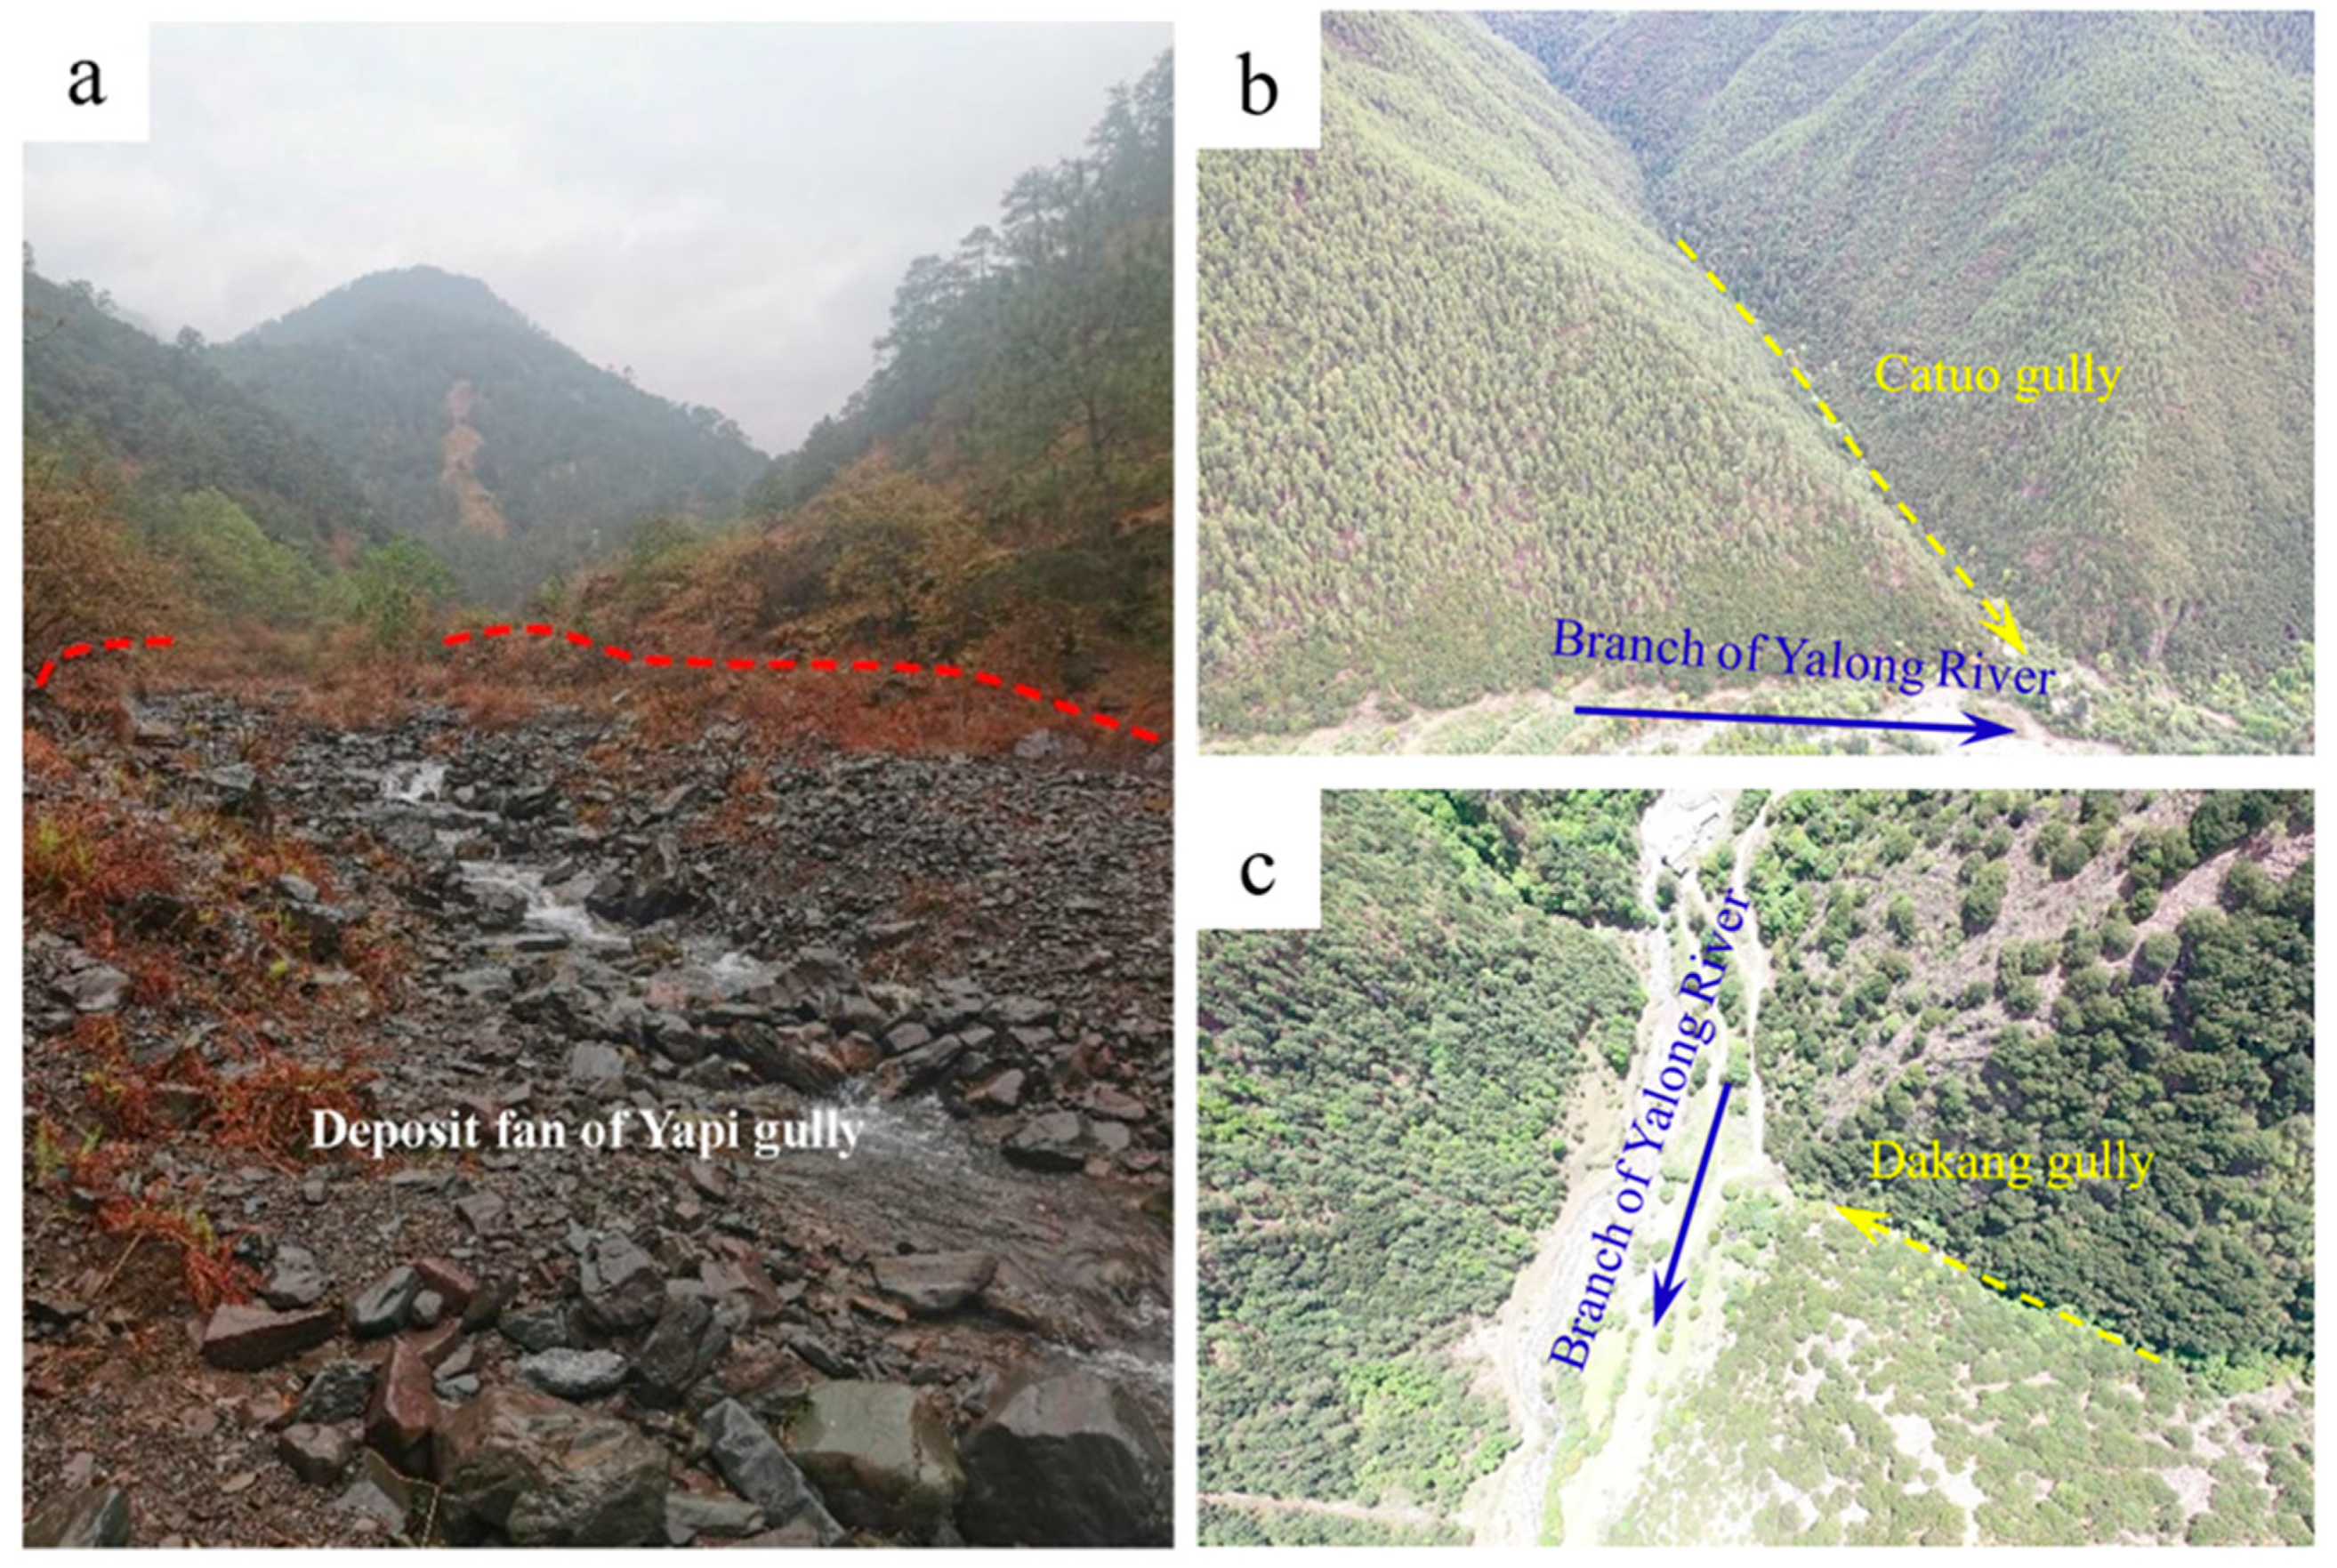
2.1. Study Area

The Chuanxi Plateau is located in the eastern part of the Qinghai–Tibet Plateau and the middle part of the Hengduan Mountains, dominated by high mountain valley landscapes and is the intersection point of the first and second steps in China (Figure 1a,b). The altitude of the study area varies from 500 m to 4500 m, and the gradient varies between 10° and 50°. The relative height difference changes obviously, and the terrain deforms significantly. The region has strong neotectonic movements, significant uplift, and frequent earthquakes. Furthermore, the Xianshuihe Fault, Longmenshan Fault, Xiaojiang Fault, and Anninghe Fault distributed in the study area have led to significant weathering [29,30]. The Triassic strata in the study area are widely distributed, and the lithology is mainly composed of sandstone and slate. The annual rainfall is about 500–1400 mm. Under the influence of the southwest monsoon, the summer rainfall in this region is abundant and concentrated, and the rainfall from June to September accounts for 70–90% of the annual rainfall [31]. Under the combined influence of topography, geomorphology, tectonic movement, climatic conditions, and human activities, the study area is prone to debris flows.
Three typical debris flow gullies, namely, Yapi gully, Catuo gully, and Dakang gully, were selected as the case studies to construct the identification system for low-frequency debris flow along the western Sichuan traffic arteries. Yapi gully, located in Yanyuan County, China, is on the west side of the Woluo River in the watershed of the Jinsha River (Figure 1c), and the proposed expressway G7611 passes through the Yapi gully. The Catuo gully and Dakang gully are located on the east bank of the middle reaches of the Yalong River, which belongs to Yajiang County, China (Figure 1d). The Yajiang–Batang section of the road G318 runs through the Catuo gully and Dakang gully. The geometrical features of the Yapi gully, Catuo gully, and Dakang gully are shown in Table 1. The geographical location information of the three debris flow gullies is shown in Table S1. The watershed area of the three debris flow gullies varies from a few square kilometers to ten square kilometers. The vegetation coverage is high, which reflects the typical characteristics of low-frequency debris flow areas in the Chuanxi Plateau.

2.2. Methodology

Under the background of the steep topography and abundant rainfall in the Chuanxi Plateau, the low-frequency rainfall-type debris flows formed by the failure of the hollow deposits are representative in the study area [24]. The roundness value reflects the recurrence period of debris flow, and the statistical relationship between roundness value and low-frequency debris flow gully was also proposed based on the historical debris flows in similar areas as the study area [32]. Therefore, the roundness value of stones in the deposit fan and colluvium deposits in a hollow region (CDH) can be used to identify low-frequency debris flow gullies in the Chuanxi Plateau.

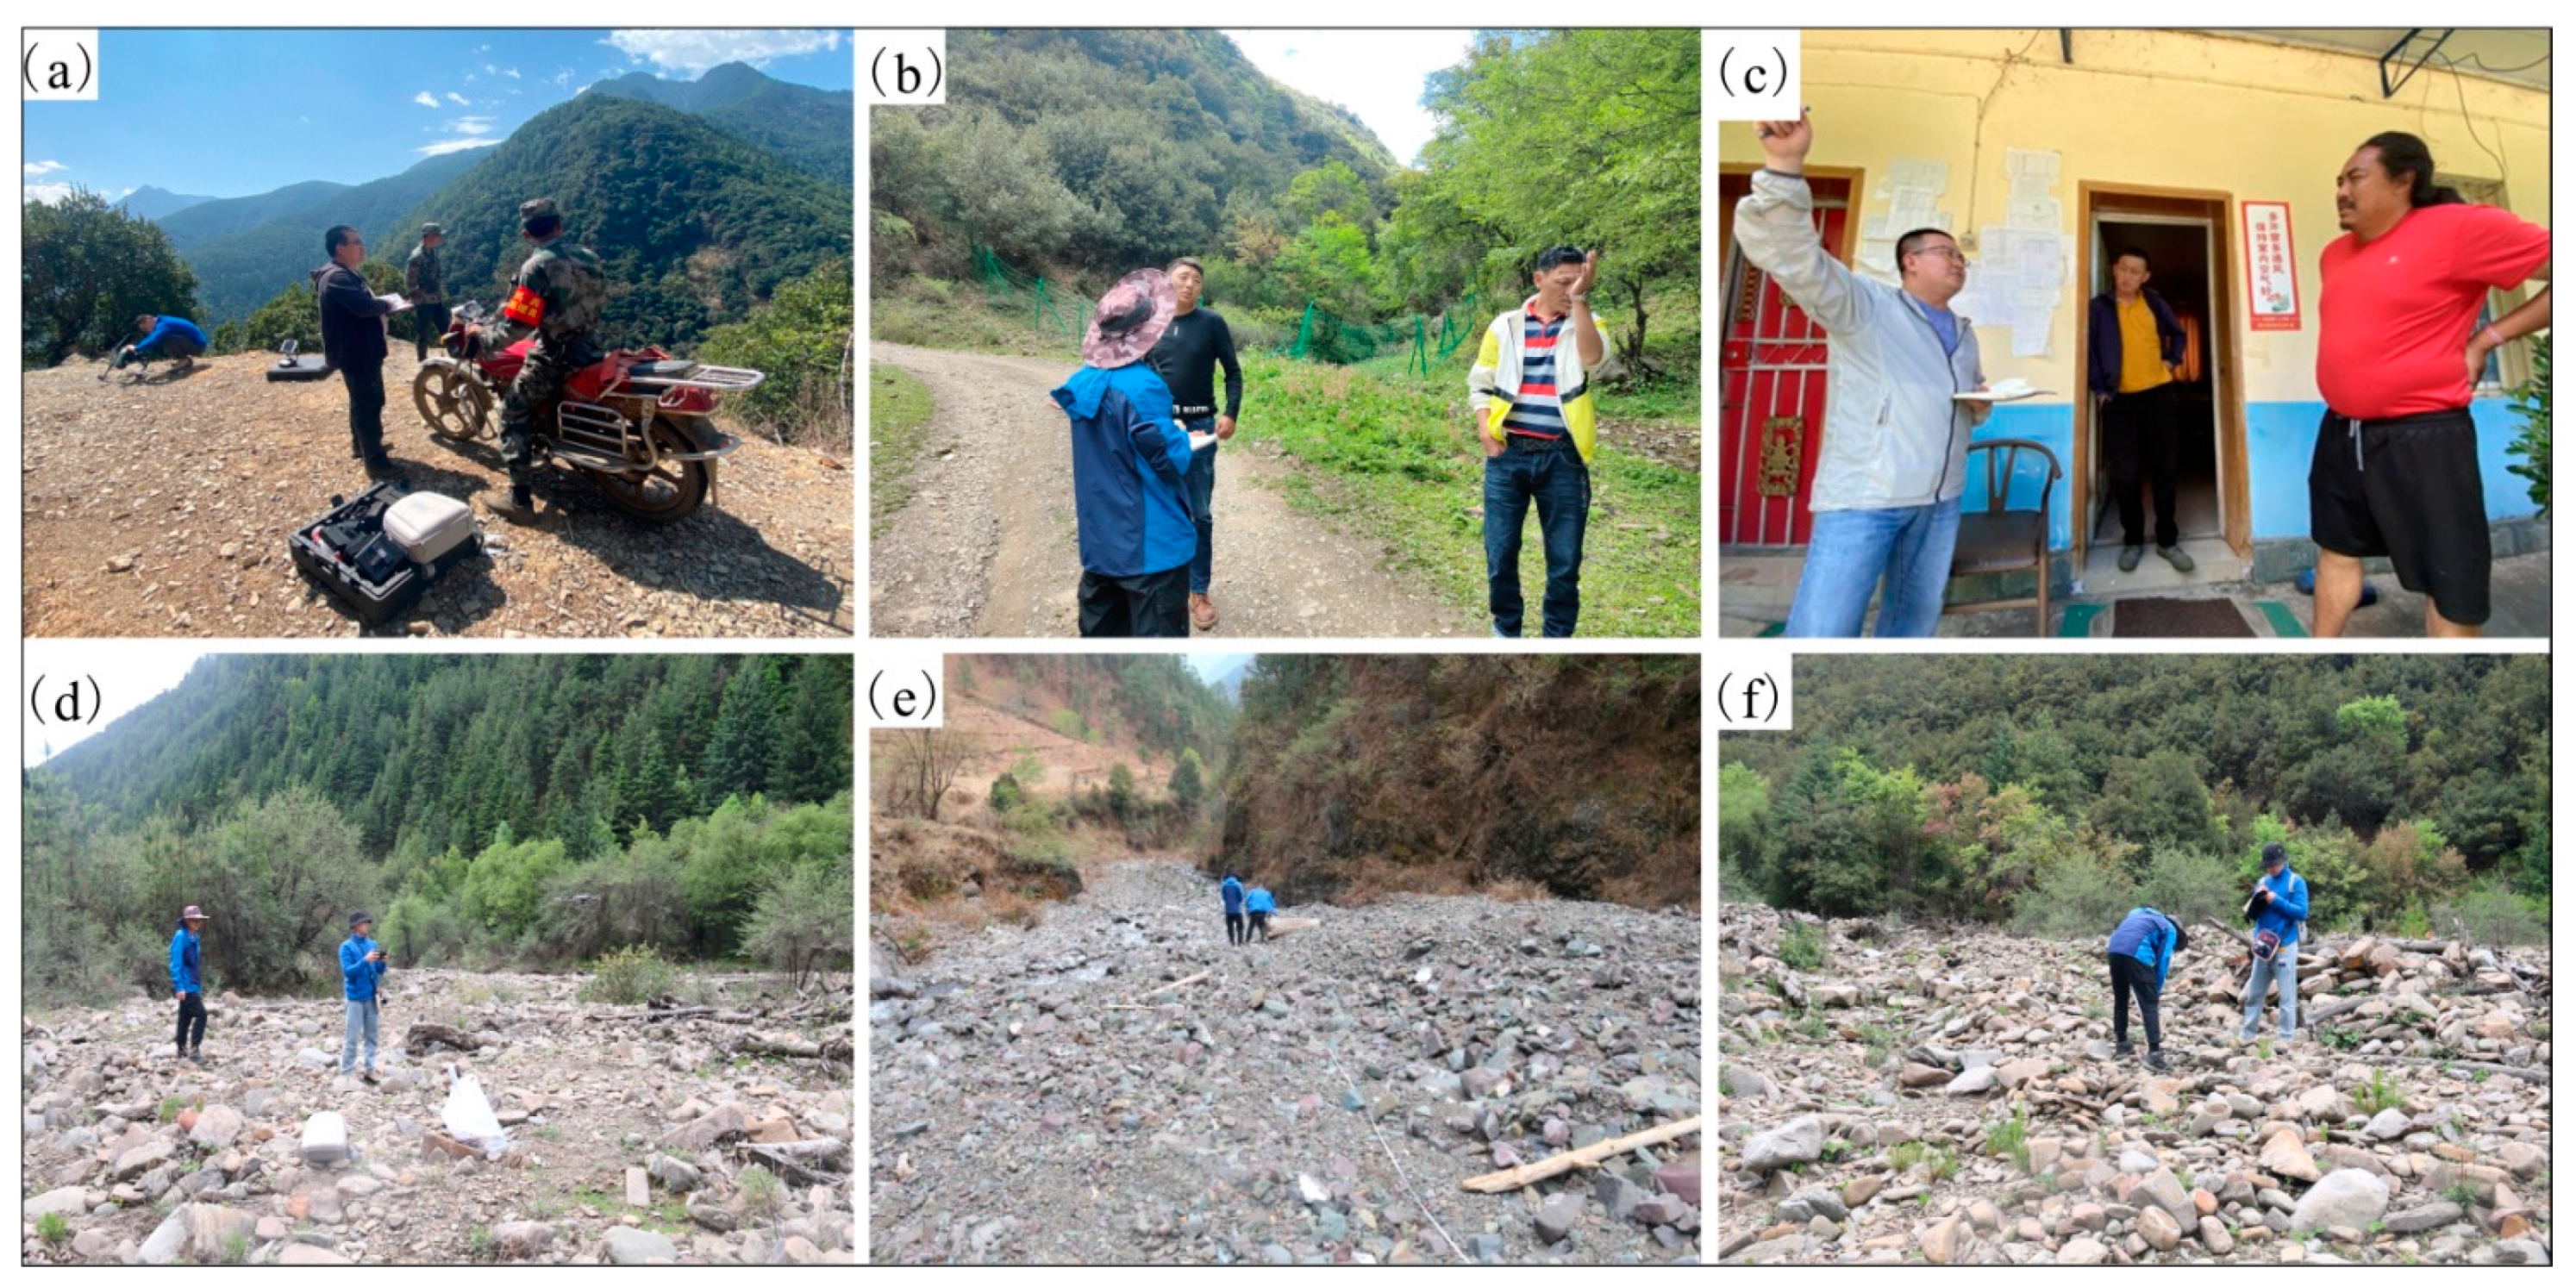
2.2.1. Field Investigation and On-Site Interviews

Detailed field investigations and on-site interviews were conducted to determine the geomorphological characteristics and recurrence period of the debris flow gullies in the study area. Two UAVs (DJI Inspire 2 and DJI Mavic 2) were used to take aerial photographs of the debris flow gullies (Figure 2a,d). Tape measures were used to measure the stones in the deposit fan of the debris flow gully (Figure 2e,f); and laser rangefinders were used to measure the gully topography (gradient, cross-section, elevation difference, etc.). On-site interviews were conducted with residents on debris flow history to determine the frequency of debris flow gullies and test the identification accuracy (Figure 2a–c).

2.2.2. Identification and Stability Calculation of CDH

(1)
Identification of CDH
CDHs developed in the geomorphic hollow regions, generally the sunken part in the channel head. Based on the calculated geomorphic parameters of the water flow path, the D8-compatible recognition method can be used to determine the location of the CDH by detecting the change points in the sequence [33]. Compared with the traditional field investigation, this method is not restricted by regional conditions. It also has a good recognition result, even for the gullies with high vegetation coverage and inconspicuous features of the hollow. Here, the combination of field investigation and high-resolution optical remote sensing images will significantly improve and verify the accuracy of the CDH location identified by the D8-compatible recognition method (Figure 3).
(2)
Stability calculation of CDH
Recent studies have found that the thickness, gradient, and area of the water confluence area at the back end of the CDH are the main factors affecting the stability of the CDH and are also the important basic conditions for initiating low-frequency debris flows [11,25,34,35]. The specific steps for the stability analysis of the CDH are as follows:
i
Determination of the average gradient (i) of the CDH.
i = arctan J = arctan ( H i 1 + H i ) l i 2 H 0 L L 2
where i is the average slope of the CDH in degrees; J is the average specific drop of the CDH in percentage; Hi is the watershed elevation in meters; H0 is the elevation of the starting point of the CDH in meters; li is the distance between two adjacent points in meters; L is the total length of the CDH.
ii
Determination of the average thickness (h) of CDH.
h = L P 4 sin i ( π i 180 sin i cos i 1 ) K
where Lp is the average width of the CDH body in meters; i is the average slope of the CDH body in degrees; K is the correction factor. According to the typical low-frequency debris flow in Chenghuangmiao gully in the study area, the correction factor K was defined as 0.7.
iii
Stability analysis
Regarding the calculation of the hollow deposit stability, the slope gradient and thickness of the hollow deposit significantly affect the variation of water content and sliding tendency in the unsaturated zone. Based on the limit equilibrium law, the relationship between slope gradient, thickness, and safety factor was obtained by numerical simulation and function fitting in the existing study [11,25,34,35]. Here, due to the insufficient number of typical cases, the relationship was cited in our study to calculate the stability coefficient Fs of the CDH in the Chuanxi Plateau. The stability coefficient Fs is obtained according to the average slope of the CDH i and the average thickness of the CDH h:
F s = Z 0 + Z 1 ( 1 + ( h x c w 1 ) 2 ) × ( 1 + ( i y c w 2 ) 2 )
where Z0 = −0.48808, Z1 = 5442.38139, xc = −5.7389, w1 = 0.34731, yc = −31.32319, and w2 = 26.04616.

2.2.3. Calculation of Roundness Value of the Stones in Debris Flow Deposit Fan

The calculation method of roundness was adopted from the quantitative calculation method proposed by M.C. POWERS [36]. The stone particle size d greater than 20 mm for roundness measurement contains coarse grains (20 mm ≤ d ≤ 60 mm), pebbles (60 mm ≤ d ≤ 200 mm), and boulders (d ≥ 200 mm) [37]. Field measurement methods are as follows: first, a well-preserved, unmodified deposit fan was selected; then, a 25 m long measurement line was determined with a tape measure, and stones were selected for measurement at 0.5 m intervals within the measurement line, and the measurement elements included roundness, grain size, and lithology of stones (Figure 2e,f). Then, the grading of the roundness of the stones was determined by comparing the model photos based on field investigation; the average of the stone roundness values determines the stone roundness grade of a specific debris flow deposit fan. This is the sum of stone roundness values divided by the number of stones. In addition, the relationship between the roundness value and the frequency of debris flows in the gully was derived from a linear fit between the recurrence of debris flows and the roundness value of the stones in the deposit fan in the Chuanxi Plateau using a large number of field surveys [32].
The flow chart of this study is shown in Figure 3.

3. Results

3.1. Identification of Low-Frequency Debris Flow Gully without Deposit Fan

Through the field investigation and remote sensing interpretation, we found no deposit fans in the Catuo gully or the Dakang gully (Figure 4b,c). Thus, the stability analysis of the CDH was used to identify whether they belong to low-frequency debris flow gullies or not. Through the geomorphologic change point detection method, we found that five CDHs (A_AC1–A_AC5) were distributed in the Catuo gully, and six CDHs (B_AC1–B_AC6) were distributed in the Dakang gully (Figure 5). The specific geometric parameters of the CDHs are shown in Table 2. The calculation results showed that the safety factors (Fs) of CDHs in Catuo gully and Dakang gully are all greater than 1 (Figure 6). This indicates the CDHs in the two watersheds have challenging transforming into debris flows during conventional rainfall. Therefore, the Catuo gully and Dakang gully are identified as low-frequency debris flow gullies.
Moreover, on-site investigations were conducted to verify the nature of the Catuo gully and Dakang gully. The results showed no signs of debris flows in the last 100 years in the Catuo and Dakang gullies, so they were confirmed as low-frequency debris flow gullies. Therefore, the identifying result of the Catuo and Dakang without deposit fans based on the identification and stability analysis of CDH was reliable.

3.2. Identification of Low-Frequency Debris Flow Gully with Deposit Fan

Field investigation showed that the Yapi gully has an obvious deposit fan (Figure 4a). Therefore, the method based on the roundness calculation was used to identify whether it belongs to a low-frequency debris flow gully or not. According to the field investigation and particle size distribution, the deposits in the Yapi gully are mainly sand and gravel grains. The grain size of the stones is mainly between 10 and 40 cm, and the lithology of the stones is mainly limestone, containing a small amount of sandstone. Furthermore, the particles’ shape was mainly sub-angular or angular (Table 3). The results showed that the average roundness value of the stones in the Yapi gully deposits was 0.29, which indicates that it belongs to the debris flow gully classification with a medium-high frequency, it is not a low-frequency debris flow gully.
In addition, on-site investigations and interviews were conducted to verify the nature of the debris flow gully. The results showed that the Yapi gully has experienced three debris flows in recent decades, and the most recent debris flow occurred in July 2005. Therefore, the identifying result of Yapi gully with deposit fan based on roundness calculation was reliable.

3.3. Identification System of Low-Frequency Debris Flow Gullies and Its Verification

According to the abovementioned results, the identification system of low-frequency debris flow gullies was established (Figure 7). Here, the debris flow watersheds were classified into two categories according to the presence or absence of a deposit fan. For the first type of debris flow watershed without a deposit fan, the early identification and stability analysis of CDHs was used to identify the low-frequency debris flow gullies. The process is as follows: First, the CDHs in the watershed are determined by the geomorphic change point detection method combined with high-resolution remote sensing images (image resolution is 0.5 m, remote sensing data are from BIGEMAP: http://www.bigemap.com/ (accessed on 13 October 2021) and field investigation. Remote sensing images and field measurements are used to determine the key parameters (average gradient and thickness of CDH). Lastly, the stability (Fs) of the CDHs is calculated. When FS > 1.0, the CDH is stable, and the watershed can be defined as a low-frequency debris flow gully. In addition, the roundness of debris flow deposits is an important basis for identifying low-frequency debris flow. It has been found that the larger the roundness value of the stones in the debris fan, the lower the debris flow frequency [32]. Therefore, the roundness of stones in the deposit fan for the second type of debris flow watershed deposit fan is calculated through field measuring. Additionally, the relationship between roundness and recurrence of debris flow (Table 4) was used for the early identification of low-frequency debris flow.
Moreover, ten debris flow gullies along the Emei–Hanyuan Expressway, Jiuzhai-Mianyang Expressway, and Lexi–Xichang Expressway in the Chuanxi Plateau were selected to assess the accuracy of the identification system. The geographical location information of ten debris flow gullies is shown in Table S1. Three debris flow gullies have intact deposit fans. The stability analysis shows that the safety factors (Fs) of the CDHs in the watersheds of the K88+230 gully, Luoduo gully, Banyang gully, Tangshang gully, and Guanba gully is greater than 1, which indicates they are all low-frequency debris flow gullies (Figures S1 and S2; Table S2). The safety factors (Fs) of the CDHs in Majingzi gully and Chenghuangmiao gully are less than 1, which indicates they are not low-frequency debris flow gullies (Figures S1 and S2; Table S2). For the other three debris flow gullies with a deposit fan, the stone roundness in Lebucun Gully is 0.28, showing that it is not a low-frequency debris flow gully (Tables S3 and S4). The stone roundness in Shitouwa gully and Wuyiwan gully is 0.33 and 0.39, respectively, which indicates that they are all low-frequency debris flow gullies (Tables S5–S8). In addition, the recurrence features of the 10 debris flow gullies were confirmed by reviewing relevant debris flow investigation reports and on-site interviews. The results showed that the low-frequency debris flow identification system proposed here is highly accurate and has good applicability (Table 5).

4. Discussion

4.1. Principles for the Identification Method of Low-Frequency Debris Flow Gullies

The three prerequisites for debris flow are steep terrain, abundant water, and sufficient loose soil masses [10,38]. It has been shown that a height difference of more significant than 300 m and a gradient greater than 15° can satisfy the initiation conditions for a debris flow [39]. Firstly, the topographic condition is easily met in the watershed on the Chuanxi Plateau. Secondly, heavy rainfall is generally the triggering factor of debris flow. Under the influence of the southwest monsoon, the rainfall in Chuanxi Plateau is heavy and concentrated, which easily meets the critical threshold for the initiation of rainfall-type debris flow [40]. However, low-frequency debris flows were often triggered by the initiation of the CDH in the watershed (Figure 8) [41], the stability of which directly determines the formation and the recurrence of debris flows. According to the relevant research, when the water confluence area reaches 20 times the area of the CDH, the gradient reaches more than 30.5°, and the thickness reaches more than 1.25 m, the CDH will easily destabilize and form a debris flow [11]. Under the effect of heavy rainfall, the unique convergent topography of the CDH significantly affects the runoff and seepage fields, resulting in significant amplification of runoff at the back end of the CDH (Figure 9a). The infiltration of rainfall causes the increase in pore water pressure and the decrease in shear strength. Then, the dilative shear damage occurs in the CDH, and eventually, the CDH is destabilized to form a landslide and transformed into a low-frequency debris flow. The mechanism of the debris flow initiated from the CDH can be summarized as follows (Figure 9b): (i) short-duration high-intensity rainfall; (ii) amplified runoff at the back end of the hollow; (iii) dilative shear failure of the CDH; (iv) formation of debris flow. Therefore, early identification and stability analysis of CDHs is vital for identifying low-frequency debris flow gullies, and the slope, thickness, and water confluence area of the CDH are the key factors controlling the stability of CDHs. Therefore, the identification model of low-frequency debris flow gullies without deposit fans can be constructed based on these three indicators of CDHs.
The deposit fan is an important trace of debris flows in debris flow gullies. The roundness of stones in the deposit fan refers to the degree to which the original edges and corners of the particles are rounded and is a record of the abrasion and re-transportation of debris particles [42]. Low-frequency debris flow has a long recurrence period, and the stones in the deposit fan are abraded and scoured by water and flood for a long time. Therefore, the roundness value is high in low-frequency gullies and is generally sub-circular. In contrast, the recurrence period of the medium-high frequency debris flow is relatively short, and the stones are abraded and scoured by water and flood for a short period. Therefore, the roundness value of the stones is low in medium-high frequency debris flow gullies, where they are mostly angular and sub-angular. Consequently, it is reasonable to identify the low-frequency gullies by calculating the roundness of the stones in the deposit fan.

4.2. Limitations

The identification system for low-frequency debris flow gullies based on the combination of CDH identification and quantitative roundness analysis of stones in a deposit fan proposed in this paper is suitable and reliable for the conventional rainfall-type low-frequency debris flow induced by the failure of hollow deposits, as well as for excluding the extremely strong and weak scouring effect of flow in the Chuanxi Plateau. However, its applicability to the non-rainfall debris flow gullies without a deposit fan and the debris flow deposit fans with the characteristics of the extremely weak scouring effect of flow, wider river bed, frequent channel diversions, etc., needs further discussion. According to the form of water supply, debris flow can be divided into the rainfall-type debris flow, snow/ice melting-type debris flow, and dam-break-type debris flow [43]. Rainfall-type debris flows are widely distributed [44]. They are mainly distributed in the southwest of China, and there is also a small amount of distribution in the north, northeast, and northwest of China. Snow/ice melting-type debris flows are formed by the melting of glacial and snow [45]. They originate in the mountainous alpine areas and are mainly distributed in the glacial and snow-covered area in southeastern Tibet. Dam-break-type debris flows are formed by the outbursts of a temporary lake [46]. The CDH stability-based identification method of low-frequency debris flow gullies proposed in this paper applies to rainfall-type debris flows without a deposit fan. For snow/ice melting-type debris flow, moraines are the main pioneer soil masses rather than CDHs. Therefore, the identification system is unsuitable for snow/ice melting-type debris flows without a deposit fan. However, in another condition with a deposit fan, the identification method based on the roundness analysis is also applicable to snow/ice melting debris flow because the stones in the gully bed are also abrased by prolonged water abrasion. The dam-break-type debris flow is a kind of sudden debris flow; it is not part of the low-frequency debris flow range discussed in this paper.
Moreover, the value of roundness is influenced by many factors such as lithology, transport distance, rock hardness, etc. Stones with different lithologies have different degrees of hardness and resistance to abrasion. In addition to the increasing roundness due to abrasion during transport, the roundness is also reduced due to crushing. Under the same hydrodynamic conditions, the roundness of hard rocks will be smaller than that of soft rocks. All these factors affect the roundness of stones in the deposit fan, which is necessary for further study.

5. Conclusions

In this paper, three typical watersheds (Yapi gully, Catuo gully, Dakang gully) along the traffic arteries in the Chuanxi Plateau were analyzed to establish the identification system of low-frequency debris flow gullies through the identification and stability calculation of CDHs and the quantitative roundness analysis of stones in the deposit fan. This research determined the method for early identification of low-frequency debris flow gullies commonly distributed along the traffic arteries in the Chuanxi Plateau. The specific methods are as follows:
(1) For the watershed without a deposit fan, the stability of the CDH directly determines the occurrence of low-frequency debris flow. According to the identification and stability analysis of the CDH, the watershed was identified as a low-frequency debris flow gully when the safety factors (Fs) of the CDH are more significant than 1.
(2) The roundness value of stones in the deposit fan was calculated for the watershed with a deposit fan. According to the relationship between the recurrence period and roundness, the watershed was identified as a low-frequency debris flow gully when the average roundness value of stones ranges from 0.3 to 0.41. Due to the prolonged recurrence of low-frequency debris flow, the stones are abraded and scoured by water flow in the gully bed for a long time, so the roundness value is high, and the shape of stones is generally sub-rounding.
(3) To test the accuracy of the identification system, 10 watersheds along the traffic arteries in the Chuanxi Plateau were selected. The identification analysis shows that all the 10 testing watersheds are correctly identified, which indicates the identification system proposed in this paper is accurate and effective. It generally applies to rainfall-type low-frequency debris flow gullies and can provide new insights for identifying rainfall-type low-frequency debris flows in other regions.

Supplementary Materials

The following are available online at https://www.mdpi.com/article/10.3390/rs15051183/s1, Figure S1: CDH profiles of seven watersheds along the Emei-Hanyuan Expressway, Jiuzhai-Mianyang Expressway, Lexi-Xichang Expressway, Figure S2: Distribution of CDH in other watersheds, Table S1: Debris flow gully numberlabel and geographical location, Table S2: Parameters of CDH in other seven watersheds along the Emei-Hanyuan Expressway, Jiuzhai-Mianyang Expressway, Lexi-Xichang Expressway, Table S3: Investigation of particles in the deposit fan of Lebucun gully (First group), Table S4: Investigation of particles in the deposit fan of Lebucun gully (Second group), Table S5: Investigation of particles in the deposit fan of Shitouwa gully (First group), Table S6: Investigation of particles in the deposit fan of Shitouwa gully (Second group), Table S7: Investigation of particles in the deposit fan of Wuyiwan gully (First group), Table S8: Investigation of particles in the deposit fan of Wuyiwan gully (Second group).

Author Contributions

Conceptualization, G.H. and S.T.; methodology, H.H.; software, H.H.; validation, G.H., H.H. and Z.Y.; investigation, G.H., H.H. and H.S.; writing—original draft preparation, G.H., H.H. and S.T.; writing—review and editing, S.T., M.R. and Z.Y.; funding acquisition, G.H. All authors have read and agreed to the published version of the manuscript.

Funding

This research was funded by the Youth Innovation Promotion Association CAS, grant number 2020367, the National Natural Science Foundation of China, grant numbers U20A20110 and 41861134008, and the International Cooperation Overseas Platform Project, CAS, grant number 131C11KYSB20200033.

Data Availability Statement

The data presented in this study are available on request from the corresponding author.

Acknowledgments

We are grateful to the editors and anonymous reviewers for their constructive comments and suggestions that improved the quality of the manuscript.

Conflicts of Interest

The authors declare no conflict of interest.

References

  1. Chen, H.; Tang, H.; Ye, S. Study on debris flows along highways in China. Chin. J. Geol. Hazard Control 2008, 19, 5–9. (In Chinese) [Google Scholar]
  2. Yan, X.F.; Xu, H.; Lu, H.; Zhou, J.W.; Wang, L. Assessment and Analysis of a Rainfall-Time-Lagging Water-Related Disaster in Mountainous Areas. Front. Earth Sci. 2021, 9, 659708. [Google Scholar] [CrossRef]
  3. Zhong, Z.; Chen, N.; Hu, G.; Han, Z.; Ni, H. Aggravation of debris flow disaster by extreme climate and engineering: A case study of the Tongzilin Gully, Southwestern Sichuan Province, China. Nat. Hazards 2021, 109, 237–253. [Google Scholar] [CrossRef]
  4. Zhu, J.; Ding, J.; Liang, J.T. Influences of the Wenchuan Earthquake on sediment supply of debris flows. J. Mt. Sci. 2011, 8, 270–277. [Google Scholar] [CrossRef]
  5. Chen, N.S.; Hu, G.S.; Deng, M.F.; Zhou, W.; Yang, C.L.; Han, D.; Deng, J.H. Impact of earthquake on debris flows—A case study on the Wenchuan earthquake. J. Earthq. Tsunami 2011, 5, 493–508. [Google Scholar] [CrossRef]
  6. Zhou, W.; Tang, C. Rainfall thresholds for debris flow initiation in the Wenchuan earthquake-stricken area, southwestern China. Landslides 2014, 11, 877–887. [Google Scholar] [CrossRef]
  7. Tie, Y.; Jiang, J.; Song, Z.; Kadetova, A.V.; Rybchenko, A.A. Frequency Difference of Debris Flows in Moxi Basin, Southwestern China. In Proceedings of the 4th World Landslide Forum, Ljubljana, Slovenia, 29 May–2 June 2017; pp. 415–420. [Google Scholar]
  8. van Steijn, H. Debris-flow magnitude—Frequency relationships for mountainous regions of Central and Northwest Europe. Geomorphology 1996, 15, 259–273. [Google Scholar] [CrossRef]
  9. Zhao, Y.; Meng, X.; Qi, T.; Qing, F.; Xiong, M.; Li, Y.; Guo, P.; Chen, G. Al-based identification of low-frequency debris flow catchments in the Bailong River basin, China. Geomorphology 2020, 359, 107125. [Google Scholar] [CrossRef]
  10. Tian, S.; Hu, G.; Chen, N.; Rahman, M.; Han, Z.; Somos-Valenzuela, M.; Maurice Habumugisha, J. Extreme climate and tectonic controls on the generation of a large-scale, low-frequency debris flow. Catena 2022, 212, 106086. [Google Scholar] [CrossRef]
  11. Zhang, Y.; Chen, N.; Liu, M.; Wang, T.; Khanal, B.R. Debris flows originating from colluvium deposits in hollow regions during a heavy storm process in Taining, southeastern China. Landslides 2019, 17, 335–347. [Google Scholar] [CrossRef]
  12. Wang, G.L. Lessons learned from protective measures associated with the 2010 Zhouqu debris flow disaster in China. Nat. Hazards 2013, 69, 1835–1847. [Google Scholar] [CrossRef]
  13. Pérez, F. Matrix granulometry of catastrophic debris flows (December 1999) in central coastal Venezuela. Catena 2001, 45, 163–183. [Google Scholar] [CrossRef]
  14. Costa, J.E.; Fleisher, P.J. Physical Geomorphology of Debris Flows; Springer: Berlin/Heidelberg, Germany, 1984; pp. 268–317. [Google Scholar] [CrossRef]
  15. Brunsden, D. Slope Instability; John Wiley & Sons: Hoboken, NJ, USA, 1984. [Google Scholar]
  16. Yang, Z.; Zhao, X.; Chen, M.; Zhang, J.; Yang, Y.; Chen, W.; Bai, X.; Wang, M.; Wu, Q. Characteristics, Dynamic Analyses and Hazard Assessment of Debris Flows in Niumiangou Valley of Wenchuan County. Appl. Sci. 2023, 13, 1161. [Google Scholar] [CrossRef]
  17. Bovis, M.J.; Jakob, M. The role of debris supply conditions in predicting debris flow activity. Earth Surf. Process. Landf. 1999, 24, 1039–1054. [Google Scholar] [CrossRef]
  18. Welsh, A.; Davies, T. Identification of alluvial fans susceptible to debris-flow hazards. Landslides 2011, 8, 183–194. [Google Scholar] [CrossRef]
  19. Smith, T.C. A method for mapping relative susceptibility debris avalanches with an example from San Mateo County. U. S. Geol. Surv. Prof. Pap. 1988, 1434, 185–194. [Google Scholar]
  20. Rowbotham, D.; Louis, S.J. The identification of debris torrent basins using morphometric measures derived within a gis. Geogr. Ann. 2005, 87, 527–537. [Google Scholar] [CrossRef]
  21. Bertrand, M.; Liébault, F.; Piégay, H. Debris-flow susceptibility of upland catchments. Nat. Hazards 2013, 67, 497–511. [Google Scholar] [CrossRef]
  22. Zhou, W.; Tang, C.; Van Asch, T.W.J.; Chang, M. A rapid method to identify the potential of debris flow development induced by rainfall in the catchments of the Wenchuan earthquake area. Landslides 2016, 13, 1243–1259. [Google Scholar] [CrossRef]
  23. Heiser, M.; Scheidl, C.; Eisl, J.; Spangl, B.; Huebl, J. Process type identification in torrential catchments in the eastern Alps. Geomorphology 2015, 232, 239–247. [Google Scholar] [CrossRef]
  24. Habumugisha, J.M.; Chen, N.S.; Rahman, M.; Habumuremyi, P.; Tuyishimire, E.; Zhong, Z.; Tian, S.F.; Islam, M.M.; Liu, E.L.; Han, Z.; et al. Determining trigger factors of soil mass failure in a hollow: A study based in the Sichuan Province, China. Catena 2022, 216, 106368. [Google Scholar] [CrossRef]
  25. Montgomery, D.R.; Schmidt, K.M.; Dietrich, W.E.; McKean, J. Instrumental record of debris flow initiation during natural rainfall: Implications for modeling slope stability. J. Geophys. Res.—Earth Surf. 2009, 114, F01031. [Google Scholar] [CrossRef] [Green Version]
  26. Tsuboyama, Y.; Sidle, R.C.; Noguchi, S.; Murakami, S.; Shimizu, T. A zero-order basin—Its contribution to catchment hydrology and internal hydrological processes. Hydrol. Process. 2000, 14, 387–401. [Google Scholar] [CrossRef]
  27. Reneau, S.L.; Dietrich, W.E. The Importance of Hollows in Debris Flow Studies; Examples from Marin County, California; Geological Society of America: Boulder, CO, USA, 1987. [Google Scholar]
  28. Pettijohn, F.J. Sedimentary Rock; Harper & Row: New York, NY, USA, 1975. [Google Scholar]
  29. Liang, X.; Zeng, L.; Ge, Y.; Du, Y.; Cao, X. The distribution characteristics of debris flow along the Luhuo-Daofu section of Xianshuihe fault, west Sichuan Province. Geol. Bull. China 2021, 40, 2061–2070. (In Chinese) [Google Scholar]
  30. Huang, H.; Shi, S.; Yang, S.; Tian, Y.; Yang, D.; Liu, J. Study on the damage of the August 8,2017 Jiuzhaigou earthquake to debris flow mitigation engineering in the national park. Chin. J. Rock Mech. Eng. 2020, 39, 1773–1786. (In Chinese) [Google Scholar] [CrossRef]
  31. Gan, L.; Liu, R.; Ji, Q.; Li, X.; You, L. Spatio-Temporal Evolution Characteristics of Extreme Precipitation in Sichuan Province, China. Mt. Res. 2021, 39, 10–24. (In Chinese) [Google Scholar]
  32. Gao, Y.; Chen, N.; Tian, S.; Hu, G.S. Frequency Identification of Debris Flow Outbreak Based on Roundness of Debris Flow Cumulative Stones. Res. Soil Water Conserv. 2018, 25, 370–374. (In Chinese) [Google Scholar]
  33. Li, J.; Li, T.; Zhang, L.; Sivakumar, B.; Fu, X.; Huang, Y.; Bai, R. A D8-compatible high-efficient channel head recognition method. Environ. Model. Softw. 2020, 125, 104624. [Google Scholar] [CrossRef]
  34. Tillery, A.C.; Rengers, F.K. Controls on debris-flow initiation on burned and unburned hillslopes during an exceptional rainstorm in southern New Mexico, USA. Earth Surf. Process. Landf. 2020, 45, 1051–1066. [Google Scholar] [CrossRef]
  35. Parker, R.N.; Hales, T.C.; Mudd, S.M.; Grieve, S.W.D.; Constantine, J.A. Colluvium supply in humid regions limits the frequency of storm-triggered landslides. Sci. Rep. 2016, 6, 34438. [Google Scholar] [CrossRef] [Green Version]
  36. Powers, M.C. A New Roundness Scale for Sedimentary Particles. J. Sediment. Res. 1953, 23, 117–119. [Google Scholar] [CrossRef]
  37. Li, Y.; Jin, Z.; Jin, T.; Shi, L. Geological Significance of Magmatic Gravel Roundness. Acta Sedimentol. Sin. 2014, 32, 189–197. (In Chinese) [Google Scholar]
  38. Iverson, R.M. The physics of debris flows. Rev. Geophys. 1997, 35, 245–296. [Google Scholar] [CrossRef] [Green Version]
  39. Tang, C.; Zhu, J.; Li, W.L.; Liang, J.T. Rainfall-triggered debris flows following the Wenchuan earthquake. Bull. Eng. Geol. Environ. 2009, 68, 187–194. [Google Scholar] [CrossRef]
  40. Chen, N.S.; Tian, S.; Zhang, Y.; Wang, Z. Soil mass domination in debris-flow disasters and strategy for hazard mitigation. Earth Sci. Front. 2021, 28, 337–348. (In Chinese) [Google Scholar]
  41. Gomi, T. Understanding processes and downstream linkages of headwater systems. Bioscience 2002, 52, 905–916. [Google Scholar] [CrossRef] [Green Version]
  42. Tao, J.; Zhang, C.; Guo, X.; Zhu, R.; Pan, J.; Tang, Y. Application of Quantitative Roundness Characterization to Identify Sedimentary Microfacies in Fan Delta Deposits: A case study of conglomerates in the Baikouquan Formation, Mahu Sag. Acta Sedimentol. Sin. 2020, 38, 956–965. (In Chinese) [Google Scholar]
  43. Kang, Z.; Li, Z.; Ainai, M.; Luo, J. Research on Debris Flow in China; Science Press: Beijing, China, 2004. [Google Scholar]
  44. Chen, H.; Dadson, S.; Chi, Y.-G. Recent rainfall-induced landslides and debris flow in northern Taiwan. Geomorphology 2006, 77, 112–125. [Google Scholar] [CrossRef]
  45. Petrakov, D.A.; Krylenko, I.V.; Chernomorets, S.S.; Tutubalina, O.V.; Krylenko, I.N.; Shakhmina, M.S. Debris flow hazard of glacial lakes in the Central Caucasus. In Proceedings of the 4th International Conference on Debris-Flow Hazards Mitigation—Mechanics, Prediction and Assessment, Chengdu, China, 10–13 September 2007; pp. 703–714. [Google Scholar]
  46. Jiang, X.; Cui, P.; Chen, H.; Guo, Y. Formation conditions of outburst debris flow triggered by overtopped natural dam failure. Landslides 2016, 14, 821–831. [Google Scholar]
Figure 1. Regional setting of the study area. (a) The study area is located in the southeastern part of the Tibet Plateau. (b) Geomorphological features and Highways in the study area. (c) Geomorphological features of Yapi gully. (d) Geomorphological features of Catuo gully and Dakang gully.
Remotesensing 15 01183 g001
Figure 2. Field investigation of three typical debris flow gullies. (ac) On-site survey and interviews in Yapi gully, Catuo gully, and Dakang gully. (d) UAV Flight in Dakang gully. (e,f) Field measurement of roundness in deposit fan.
Remotesensing 15 01183 g002
Figure 3. Flow chart of this study.
Remotesensing 15 01183 g003
Figure 4. Typical deposit fan in the study area. (a) Field investigation of the Yapi gully deposit fan, (b) UAV photography of the outlet of the Catuo gully, (c) UAV photography of the outlet of the Dakang gully.
Remotesensing 15 01183 g004
Figure 5. Distribution of CDHs (a) in Catuo gully and Dakang gully, (b) AC3 in Dakang gully, (c) AC6 in Dakang gully, (d) AC3 in Catuo gully.
Remotesensing 15 01183 g005
Figure 6. CDH profiles in the Catuo gully and the Dakang gully. (ae) A_AC1–A_AC5 in the Catuo gully. (fk) B_AC1–B_AC6 in the Dakang gully.
Remotesensing 15 01183 g006
Figure 7. Flow chart for the identification of low-frequency debris flow gullies.
Remotesensing 15 01183 g007
Figure 8. Schematic diagram of low-frequency debris flow triggered by the initiation of the CDH in the watershed.
Remotesensing 15 01183 g008
Figure 9. Process and mechanism of CDH failure. (a) Amplification of runoff at the back end of the hollow. (b) Process of destabilization of the CDH.
Remotesensing 15 01183 g009
Table 1. Geometrical features of the gullies in the Yapi gully, Catuo gully, and Dakang gully.
No.Gully NameArea
(km2)
Length
(km)
Gradient
(%)
Maximum Elevation (m)Height Difference (m)
1Yapi gully10.554.6928.935491300
2Catuo gully5.033.6442.340501080
3Dakang gully3.884.0244.438601060
Table 2. Geometric parameters of the CDH of the Catuo gully and the Dakang gully.
Gully NameHollow NumberCDHSafety Factor (Fs)
Area (m2)Average Thickness (m)Volume
(m3)
Average Slope (°)Back-End Catchment Area (m2)
Catuo
gully
A_AC16541.5 981.035.214,8971.17
A_AC28071.81452.633.713,2511.12
A_AC37221.8 1299.631.012,0771.21
A_AC410881.6 1740.834.241,5091.19
A_AC511031.6 1764.832.612,9671.26
Dakang
gully
B_AC16071.3 607.032.015,6941.42
B_AC211571.2 1388.421.811,9692.19
B_AC37781.5 1167.029.229,6071.47
B_AC46381.6 1020.831.613,9971.31
B_AC56031.3 783.938.228,2641.15
B_AC62911.2 349.239.117,3391.13
Table 3. Investigation of particles in the deposit fan of Yapi gully.
NumberGrain Size (cm)LithologyRoundnessNumberGrain Size (cm)LithologyRoundness
112 × 3 × 9LimestoneSub-angular2615 × 8 × 4SandstoneAngular
214 × 8 × 13LimestoneSub-angular2718 × 11 × 6LimestoneSub-angular
310 × 5 × 6SandstoneSub-rounding28<2\\
49 × 4 × 8LimestoneSub-angular293 × 4 × 8LimestoneSub-angular
512 × 5 × 9LimestoneSub-angular3011 × 15 × 12LimestoneSub-angular
610 × 4 × 6SandstoneSub-angular3112 × 8 × 5LimestoneSub-angular
716 × 12 × 7LimestoneSub-angular3225 × 18 × 17LimestoneSub-rounding
84 × 8 × 4Limestoneangular3387 × 65 × 30LimestoneSub-angular
921 × 10 × 8LimestoneSub-angular3416 × 11 × 19LimestoneSub-angular
109 × 3 × 7LimestoneSub-angular35<2\\
1121 × 10 × 11Sandstoneangular3634 × 21 × 10LimestoneSub-angular
1232 × 18 × 21SandstoneSub-angular377 × 6 × 14LimestoneSub-angular
1310 × 6 × 4LimestoneSub-angular3819 × 15 × 13SandstoneSub-angular
1422 × 11 × 7LimestoneSub-angular39<2\\
1519 × 10 × 8Marlangular4017 × 5 × 9LimestoneSub-angular
1632 × 20 × 11SandstoneSub-angular41<2\\
17<2\\4215 × 5 × 12LimestoneSub-angular
1822 × 12 × 13LimestoneSub-angular437 × 3 × 14Limestoneangular
1918 × 10 × 6LimestoneSub-angular4428 × 22 × 8LimestoneSub-angular
2035 × 32 × 17LimestoneSub-angular4521 × 13 × 14LimestoneSub-angular
21<2\\4615 × 17 × 8LimestoneSub-angular
2212 × 20 × 12LimestoneSub-angular4716 × 11 × 6SandstoneSub-angular
2326 × 14 × 13LimestoneSub-angular48<2\\
24<2\\4917 × 9 × 10SandstoneSub-angular
2519 × 10 × 14SandstoneSub-angular5017 × 11 × 16Sandstoneangular
Table 4. Debris flow frequency identification based on roundness.
RoundnessStone Roundness Value (R)Debris Flow Category and Frequency
Sub-rounding, rounding0.41 < R ≤ 0.59Flood
Sub-rounding dominant0.3 < R ≤ 0.41Low-frequency debris flow
Angular, sub-angular0.21 < R ≤ 0.3Medium and high-frequency debris flow
Table 5. The identification table of other low-frequency debris flows along the highways.
No.Gully NameArea
(km2)
Gradient
(%)
Deposit FanResultsLow-Frequency Debris Flow GullyCorrect or Not
V1K88+230 gully2.8144.1NoFs(min) = 1.11 > 1YesYes
V2Luoduo gully5.7038.1NoFs(min) = 1.04 > 1YesYes
V3Banyang gully3.8938.0NoFs(min) = 1.43 > 1YesYes
V4Tangshang gully 2.6843.4NoFs(min) = 1.13 > 1YesYes
V5Guanba gully2.2946.3NoFs(min) = 1.14 > 1YesYes
V6Majingzi gully8.1431.0NoFs(min) = 0.91 < 1NoYes
V7Chenghuangmiao gully6.1048.7NoFs(min) = 1.02 > 1YesYes
V8Lebucun gully4.9616.1Yesy = 0.28NoYes
V9Shitouwa Gully1.4922.4Yesy = 0.33YesYes
V10Wuyiwan Gully7.5318.7Yesy = 0.39YesYes
Disclaimer/Publisher’s Note: The statements, opinions and data contained in all publications are solely those of the individual author(s) and contributor(s) and not of MDPI and/or the editor(s). MDPI and/or the editor(s) disclaim responsibility for any injury to people or property resulting from any ideas, methods, instructions or products referred to in the content.

