


Tracking Spatiotemporal Patterns of Rwanda’s Electrification Using Multi-Temporal VIIRS Nighttime Light Imagery


Abstract
:1. Introduction
2. Materials and Methods
2.1. Study Area and Data
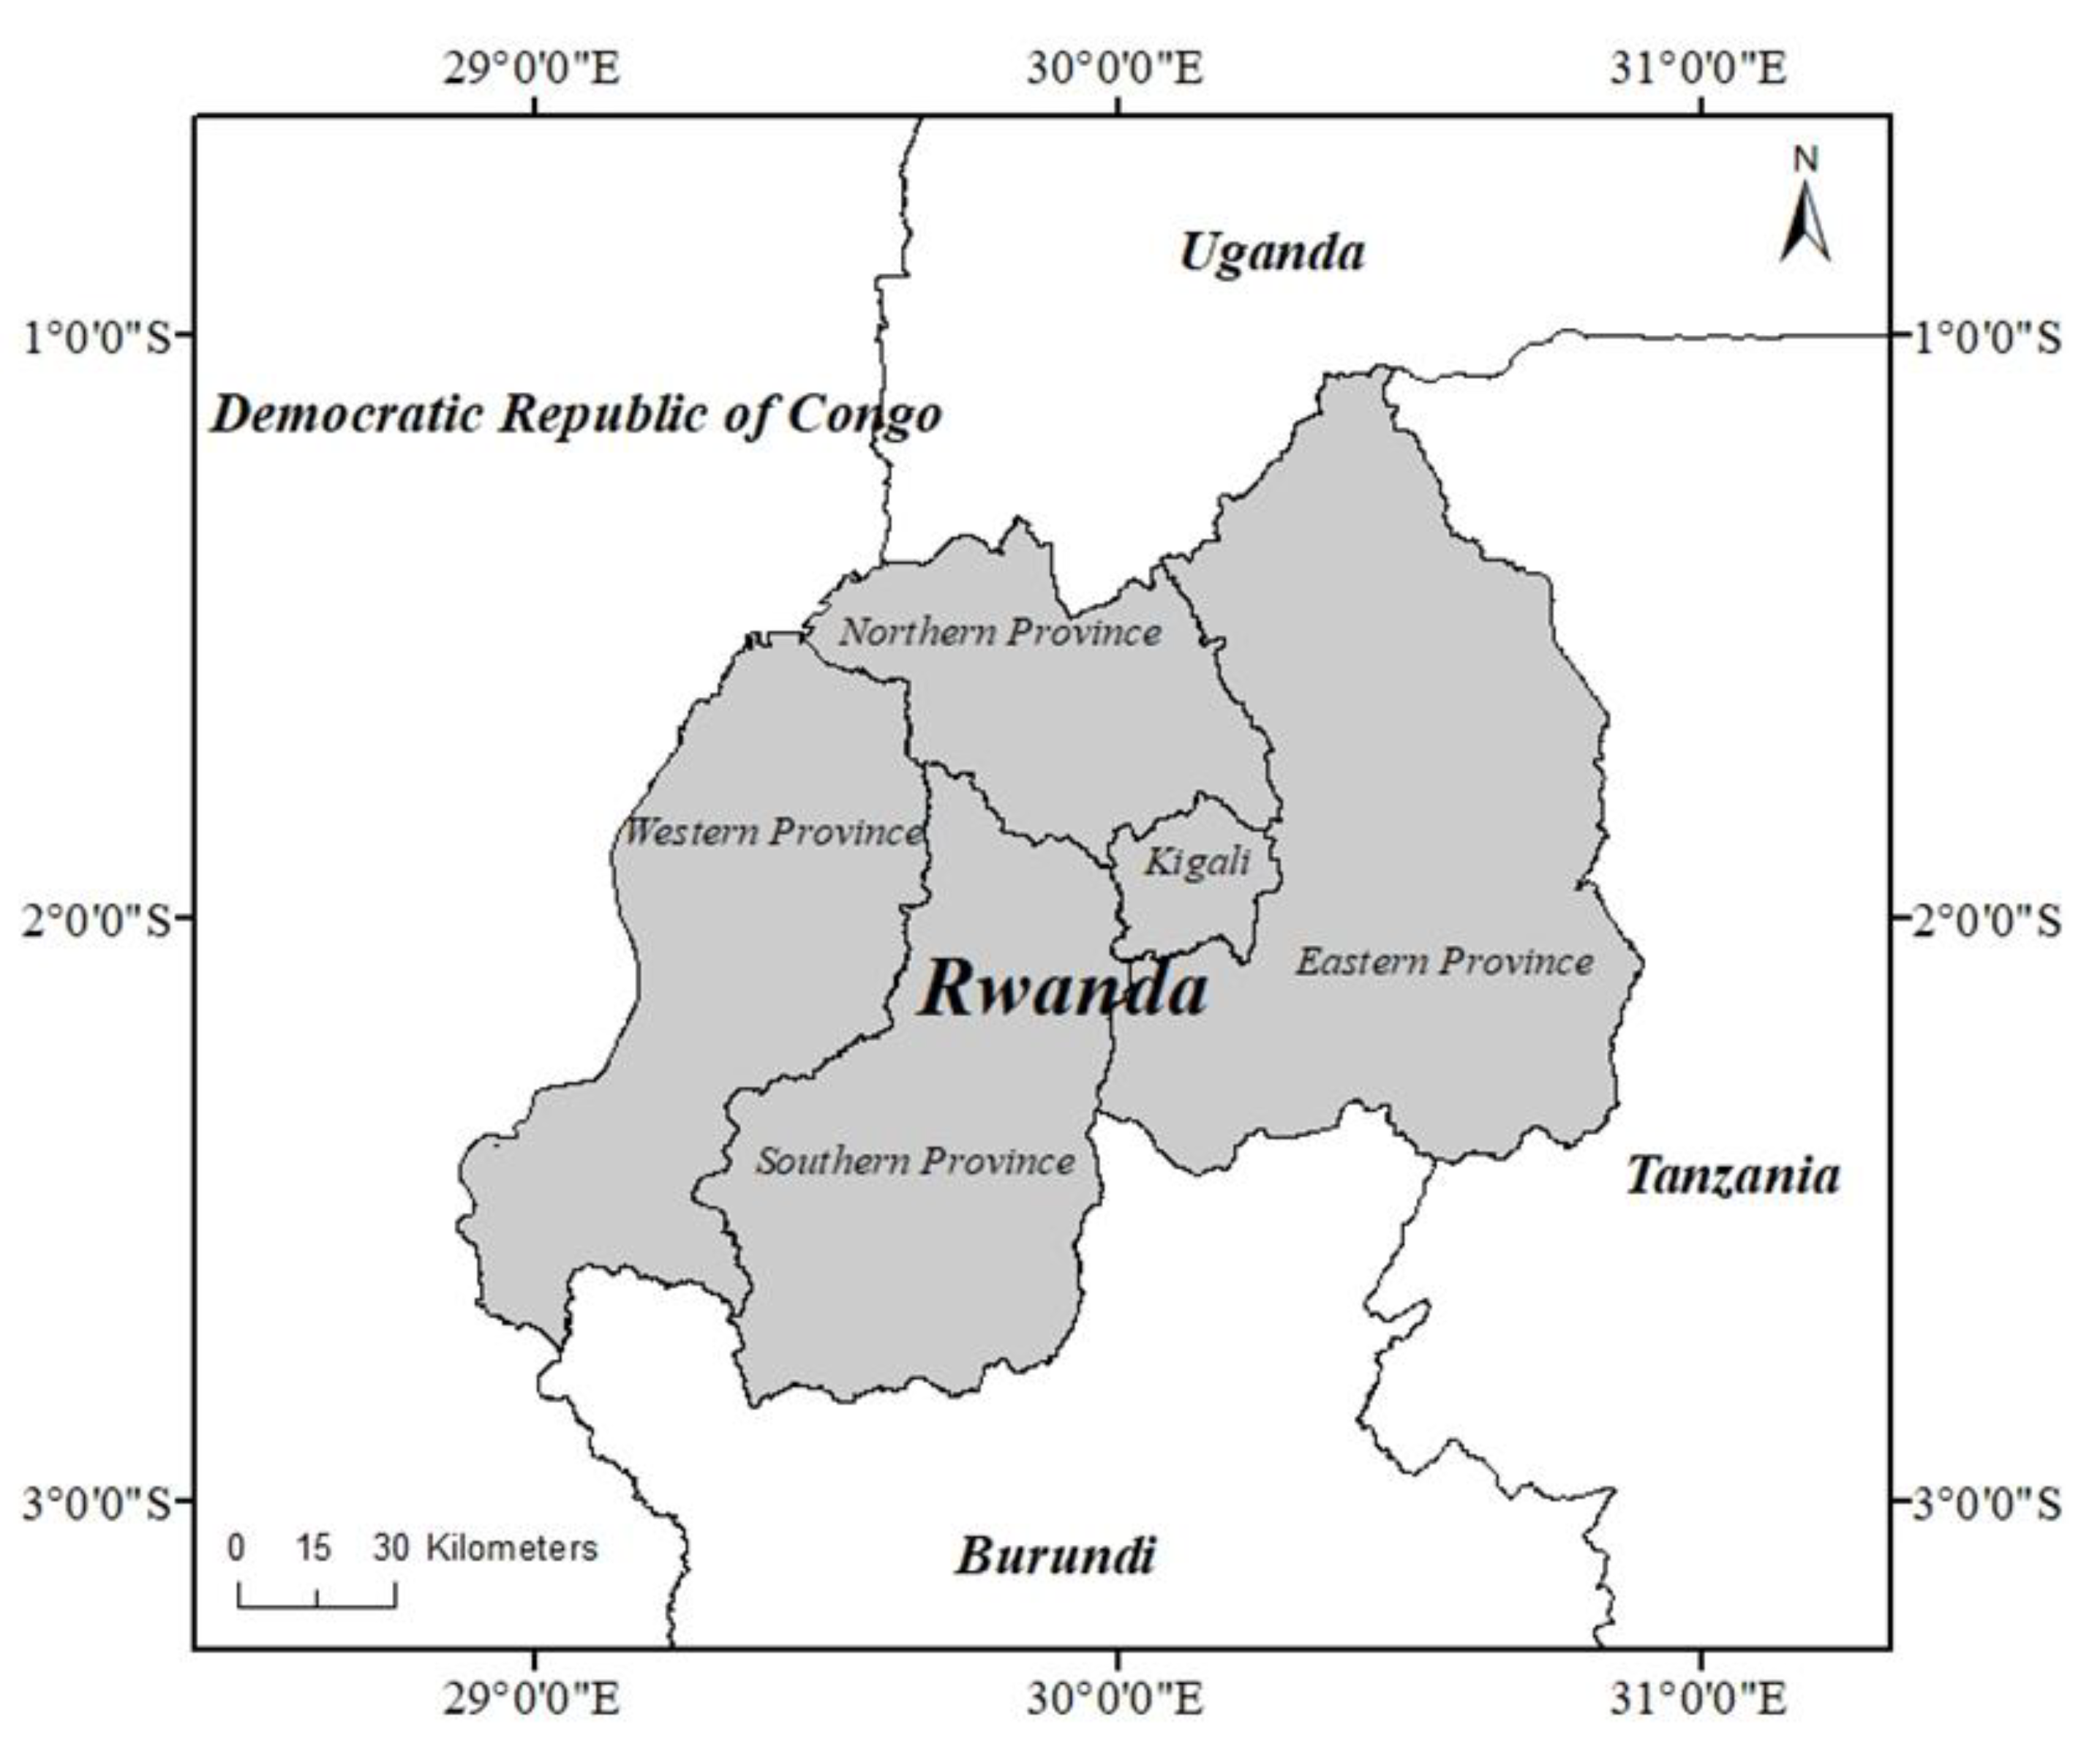
2.1.1. Study Area
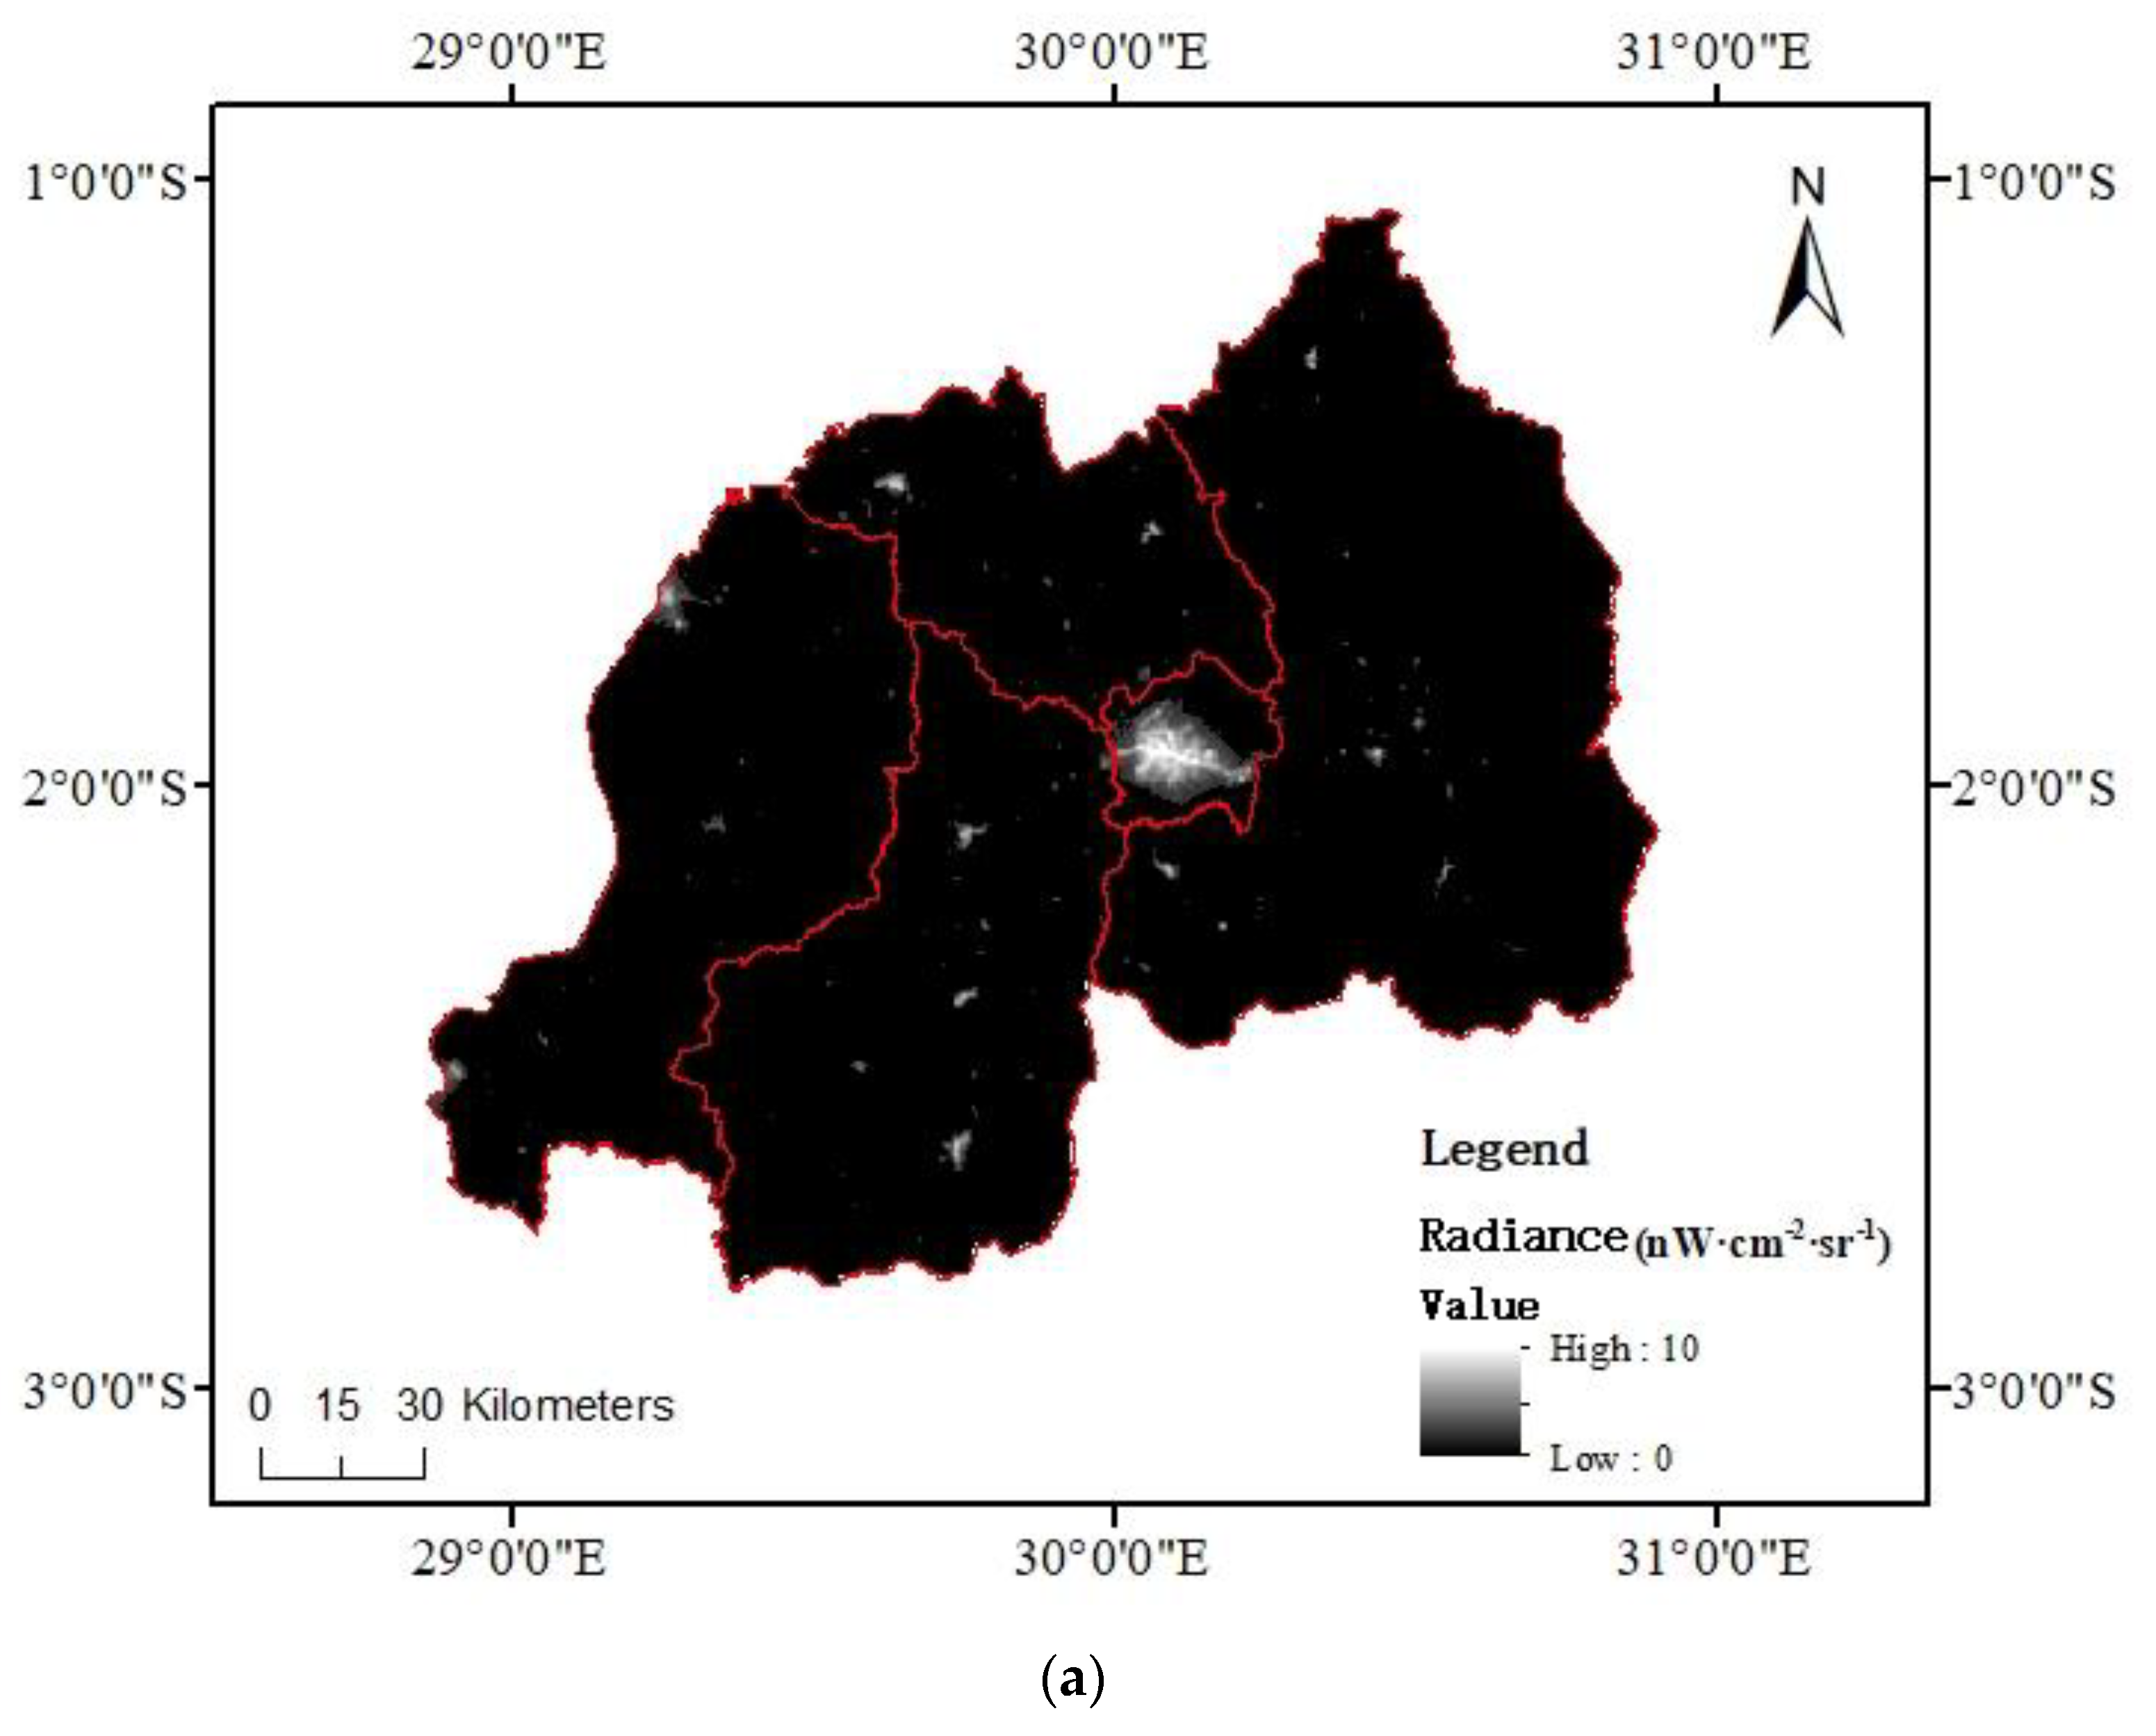
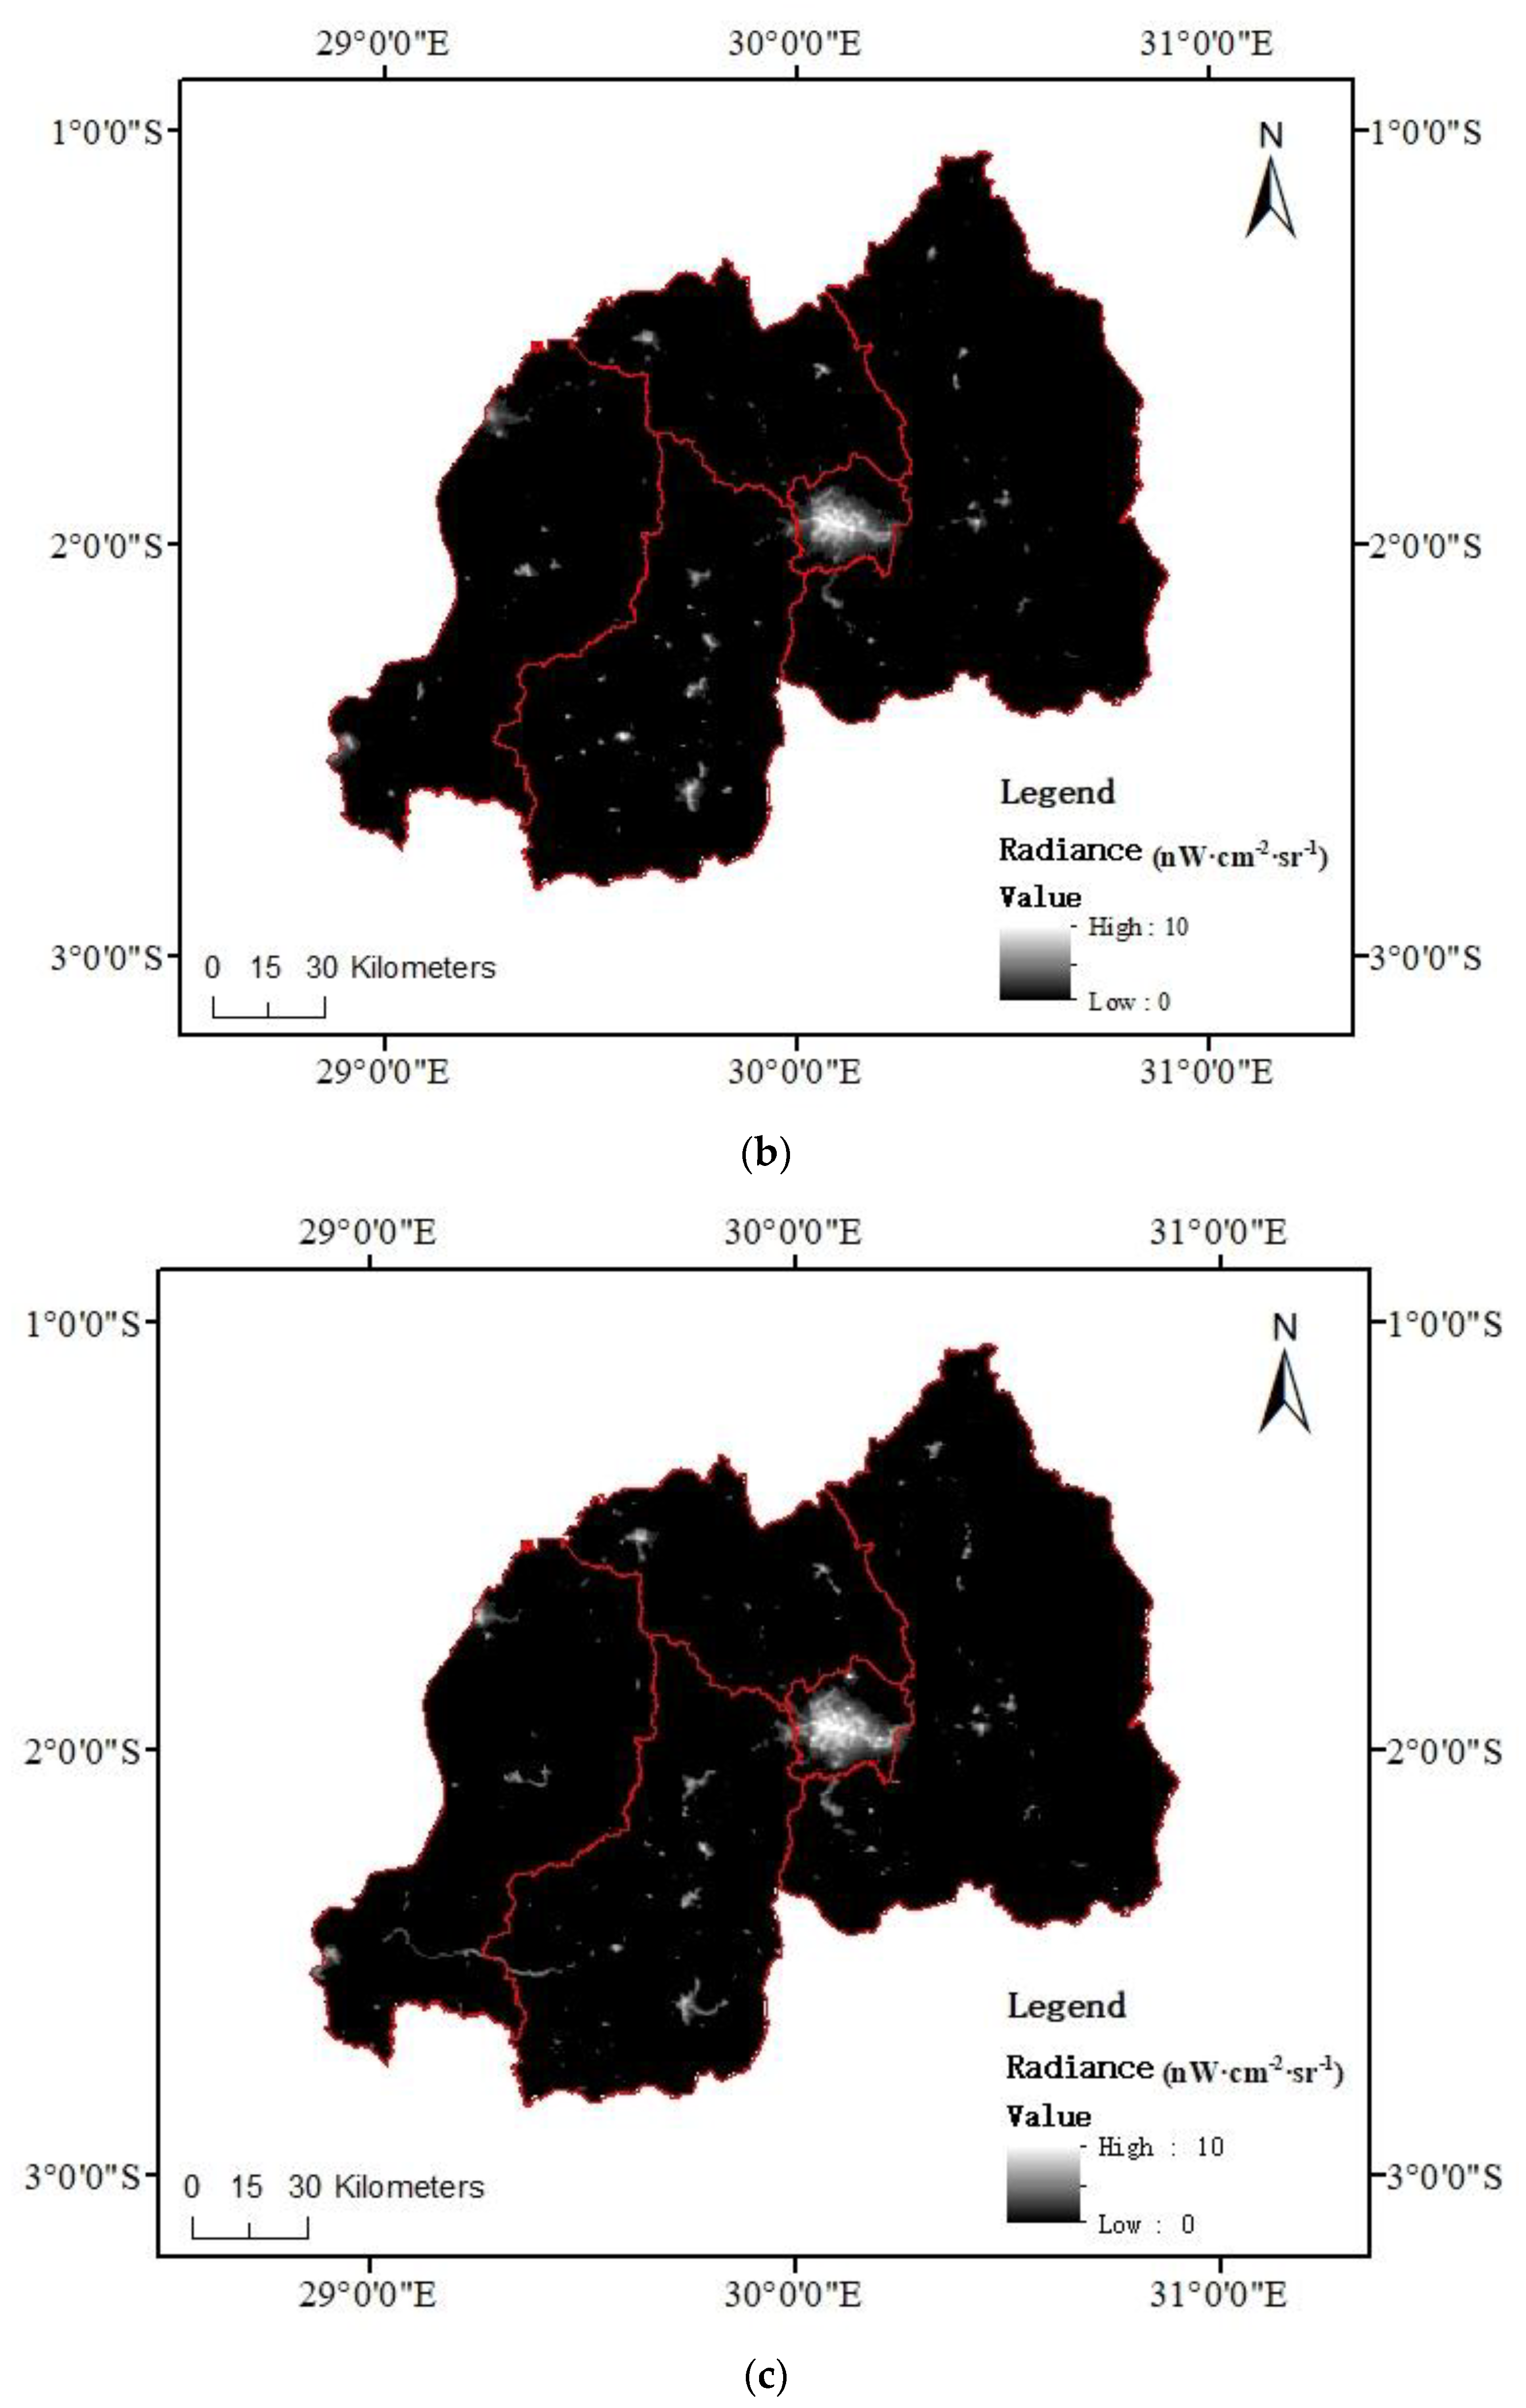
2.1.2. Nighttime Light Satellite Imagery
2.1.3. Ancillary Data
- (1)
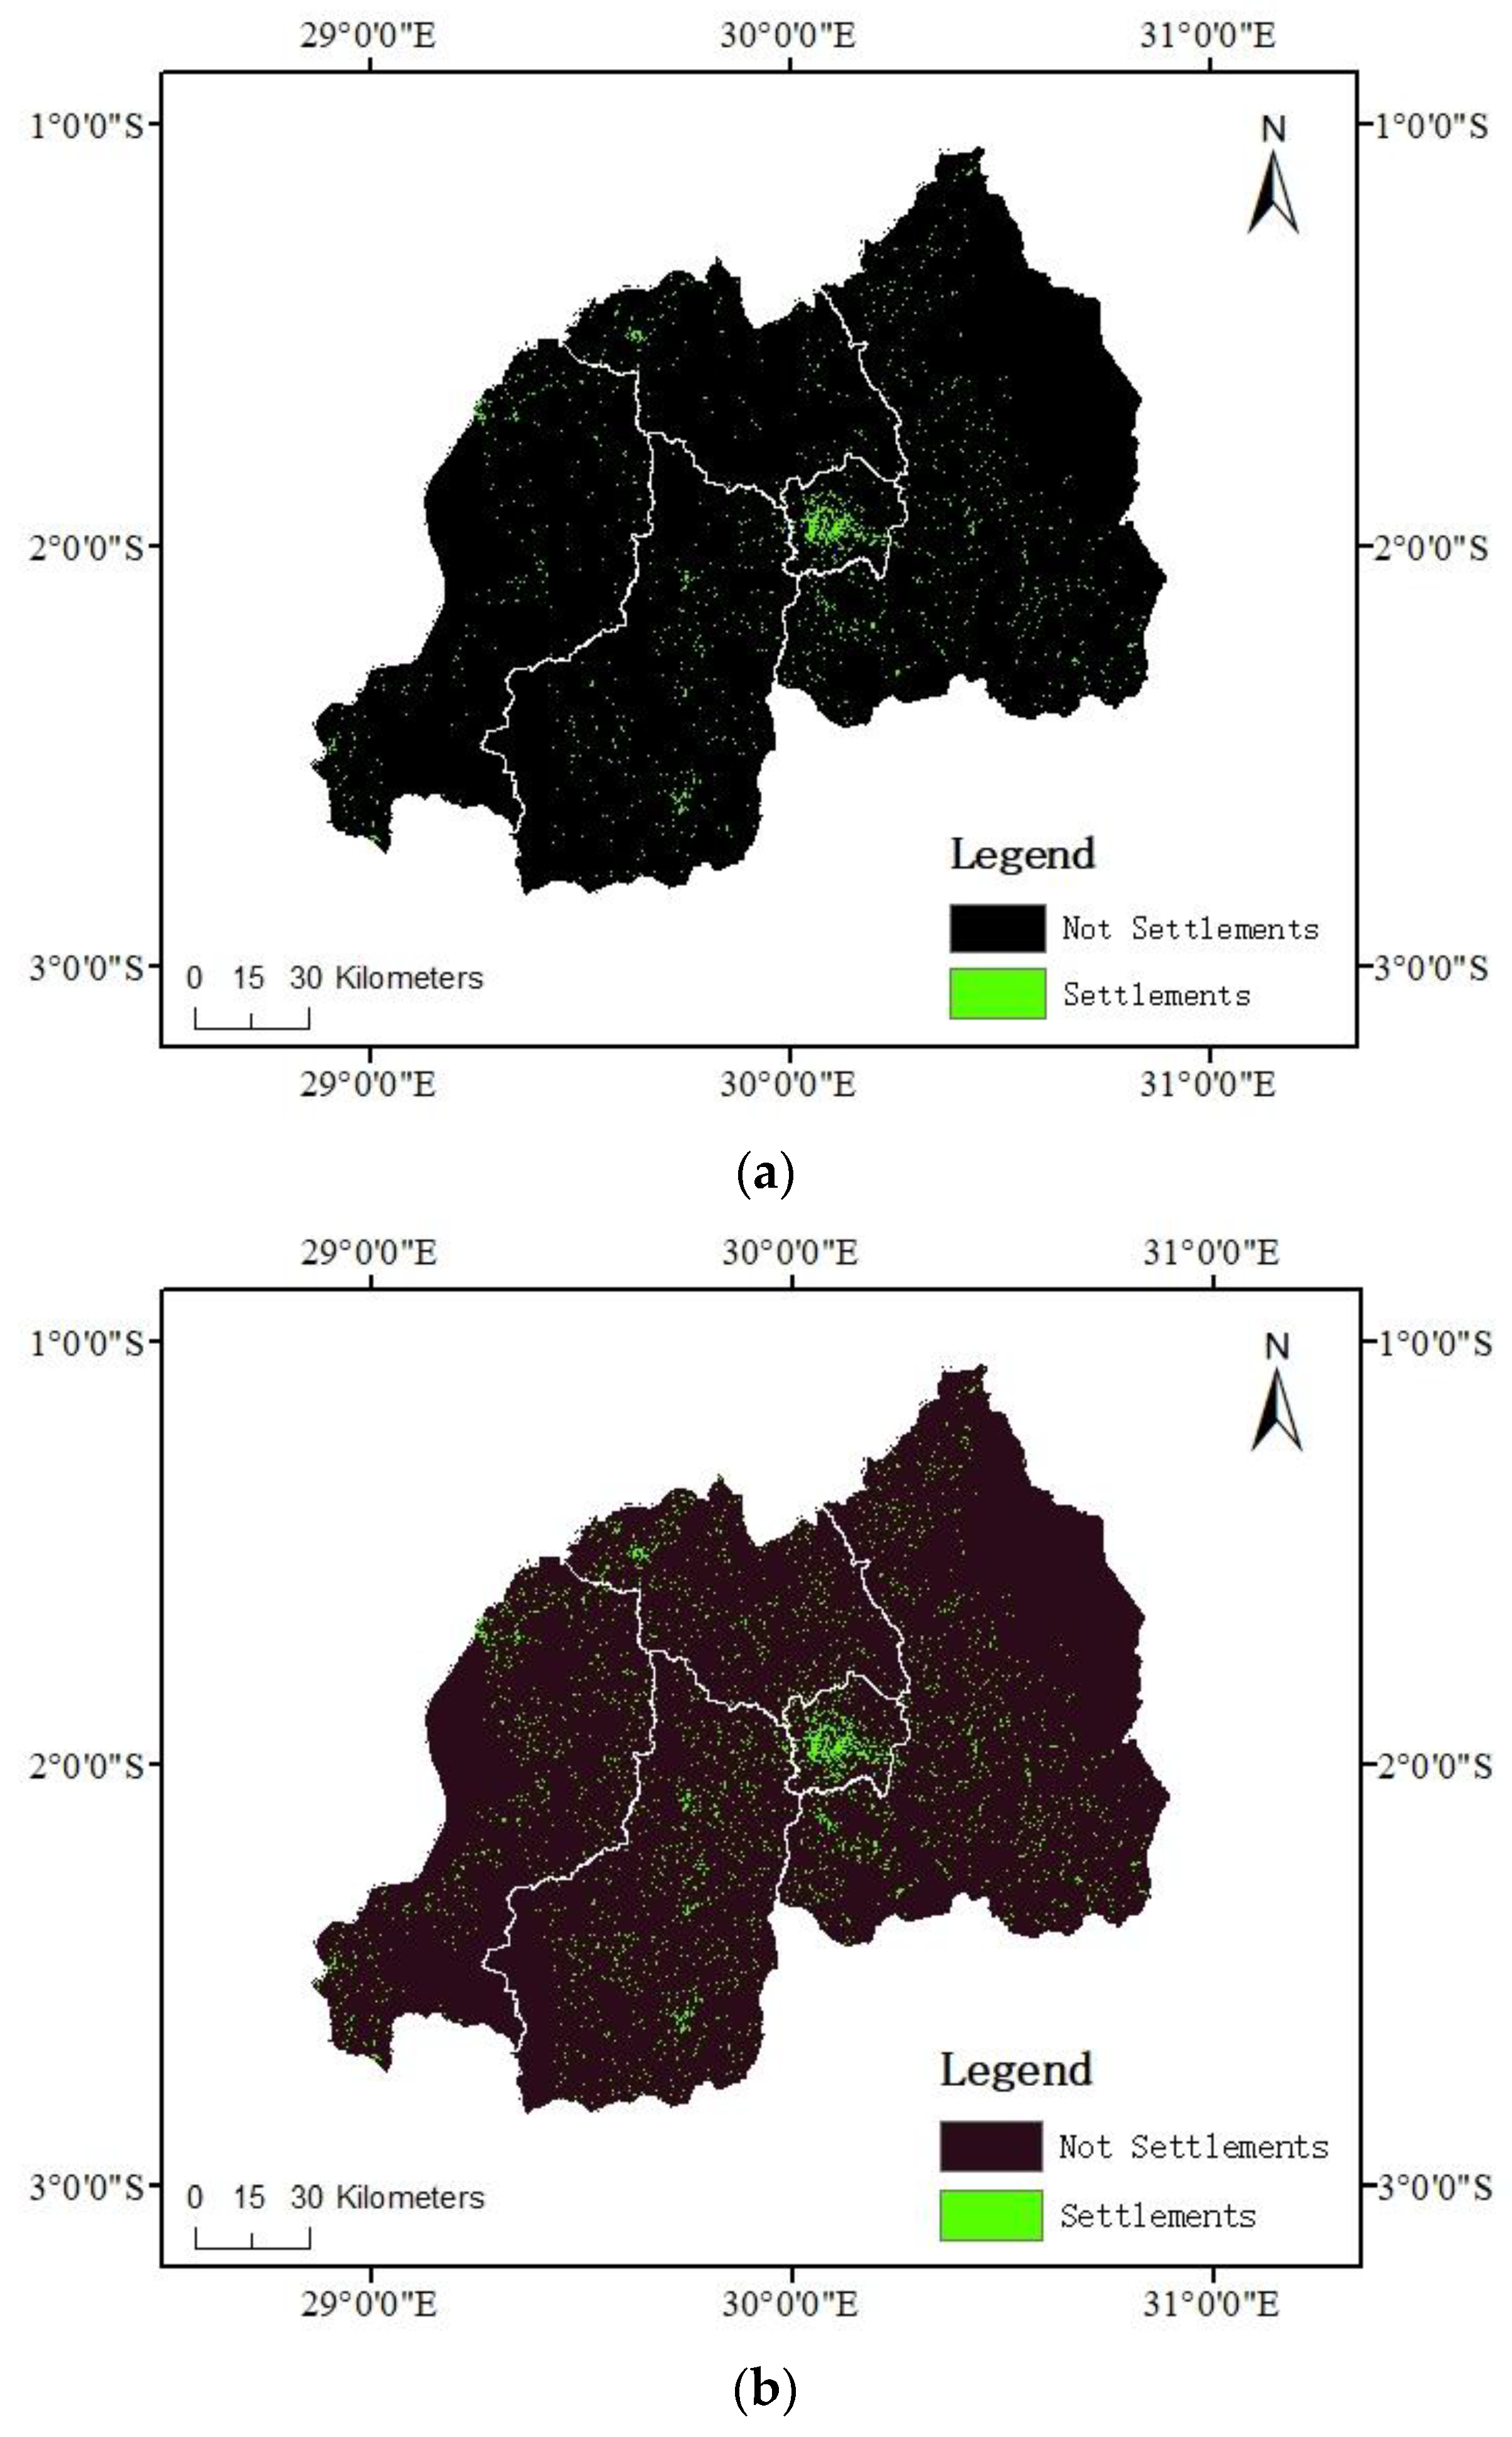
- Human settlement location data. The settlement location data of Rwanda were obtained from the World Settlement Footprint (WSF) dataset (https://geoservice.dlr.de/web/maps/eoc:guf:3857, accessed on 5 February 2022). The WSF dataset is a 10 m resolution binary mask outlining the extent of human settlements globally. In this study, we resampled the settlement data to the same spatial resolution as the nighttime light imagery (i.e., 15 arc second). Figure 3 shows the distribution of settlements in Rwanda.
- (2)
- Urban agglomeration boundary data. The boundaries of the major cities in Rwanda were obtained from the Africapolis dataset (https://africapolis.org/en, accessed on 2 March 2022). Africapolis is the only international database that systematically includes all small urban agglomerations with more than 10,000 residents. It comprises 7600 African settlements, 97% of which are home to fewer than 300,000 people.
- (3)
- Population density data. The population density distribution of Rwanda was obtained from the WorldPop United Nations adjusted population density datasets (https://www.worldpop.org/, accessed on 12 February 2022). The WorldPop population density dataset maps the global population at a high resolution, which provides annual population density data estimated at the level of cells with a resolution of 30 arc s (approximately 1 km at the equator). The units are number of people per square kilometer based on a country’s total population adjusted to match the corresponding, official United Nations population estimates.
- (4)
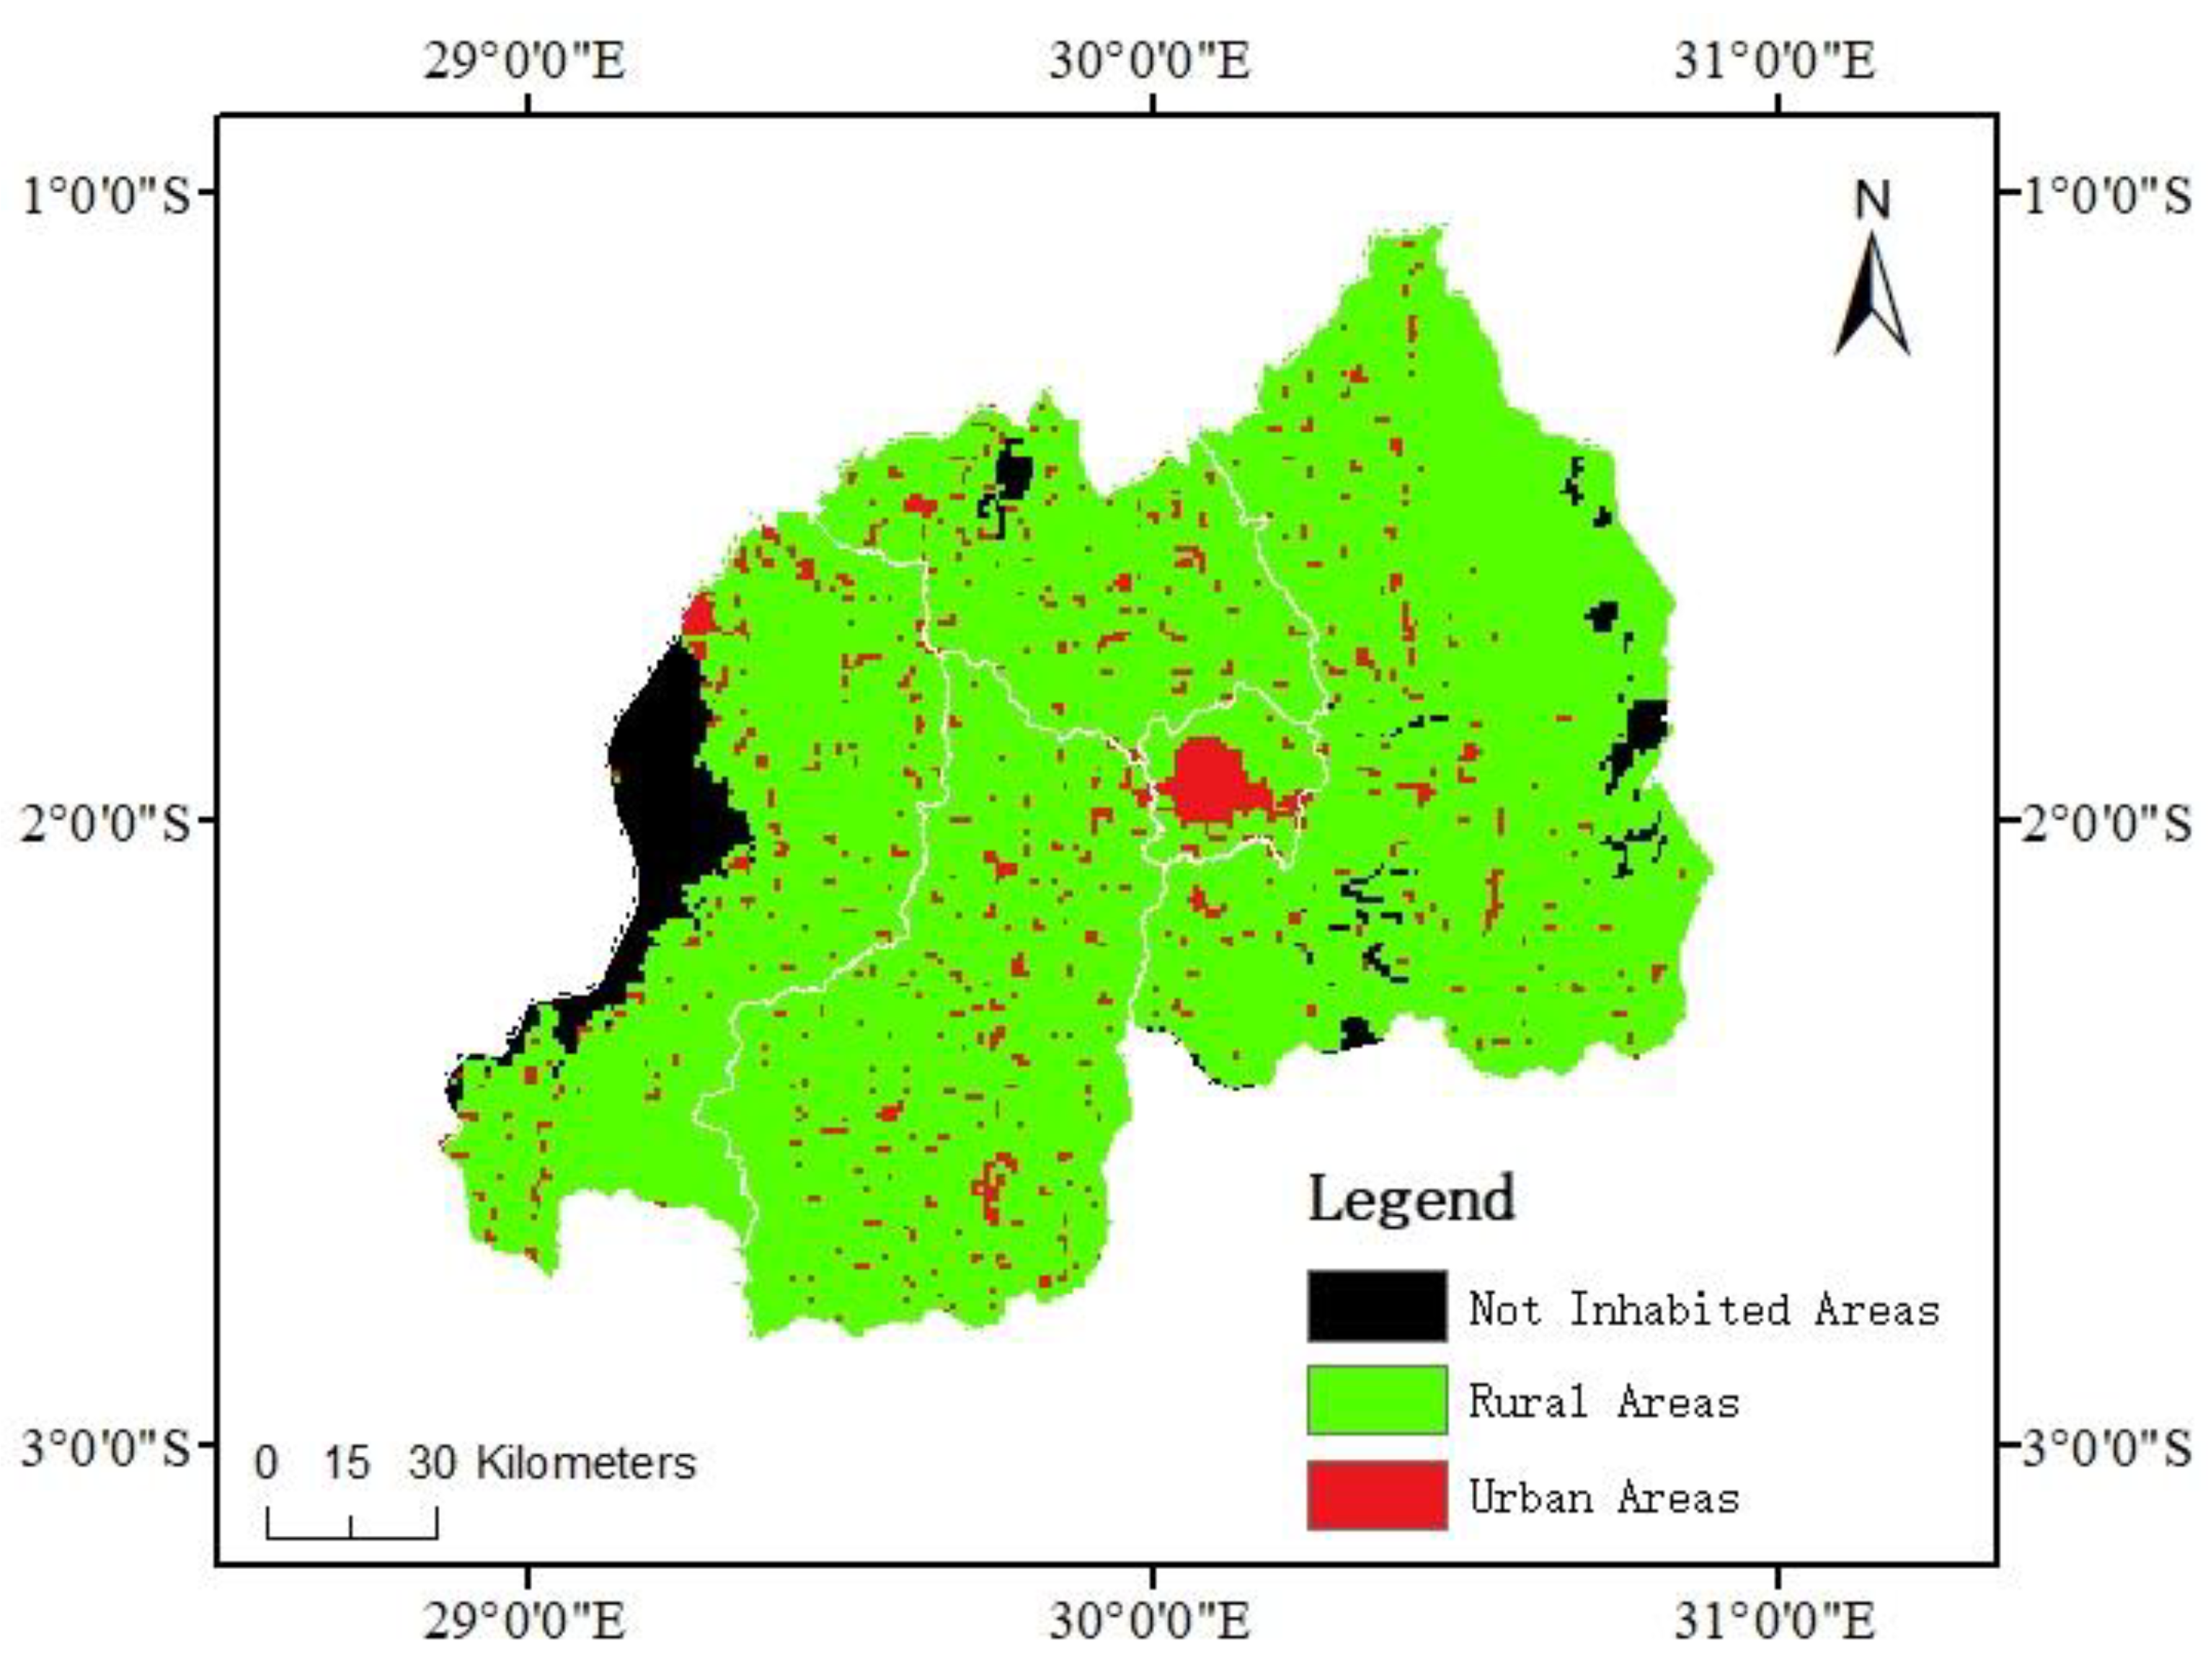
- Urban–rural settlement classification data. The Global Human Settlement Layers (GHSL) dataset was mapped based on the Landsat imagery to show the global built-up areas and population distribution from 1975 to 2014 [47]. The GHS Settlement Model (GHS-SMOD) is the urban–rural settlement classification model adopted by the GHSL [48]. The GHS-SMOD data have been generated by integrating the GHSL built-up areas and GHSL population data [48]. The GHS-SMOD dataset in 2015 (https://ghslsys.jrc.ec.europa.eu/download.php?ds=smod, accessed on 3 March 2022) was selected for dividing the urban and rural areas in Rwanda. The settlements were classified as urban, rural, or not inhabited [6]. Figure 4 shows the classification of the settlements in Rwanda.
2.1.4. Reference Data
2.2. Methods
2.2.1. Analysis of Nighttime Light Patterns in Rwanda
2.2.2. Analysis of Grid Access of Settlements in Rwanda
- (1)
- The Original Electricity Infrastructure Level
- (2)
- The spatial location
- (1)
- Generate the urban boundary by establishing buffer zones with a radius of 1 km based on the urban agglomeration vector data of the major cities in Rwanda which were obtained from the Africapolis dataset;
- (2)
- Subtract the settlement data of 2015 from those of 2019 to obtain the new settlement image;
- (3)
- Overlay the nighttime light imagery with the new settlement image to obtain the lit new settlements in Rwanda;
- (4)
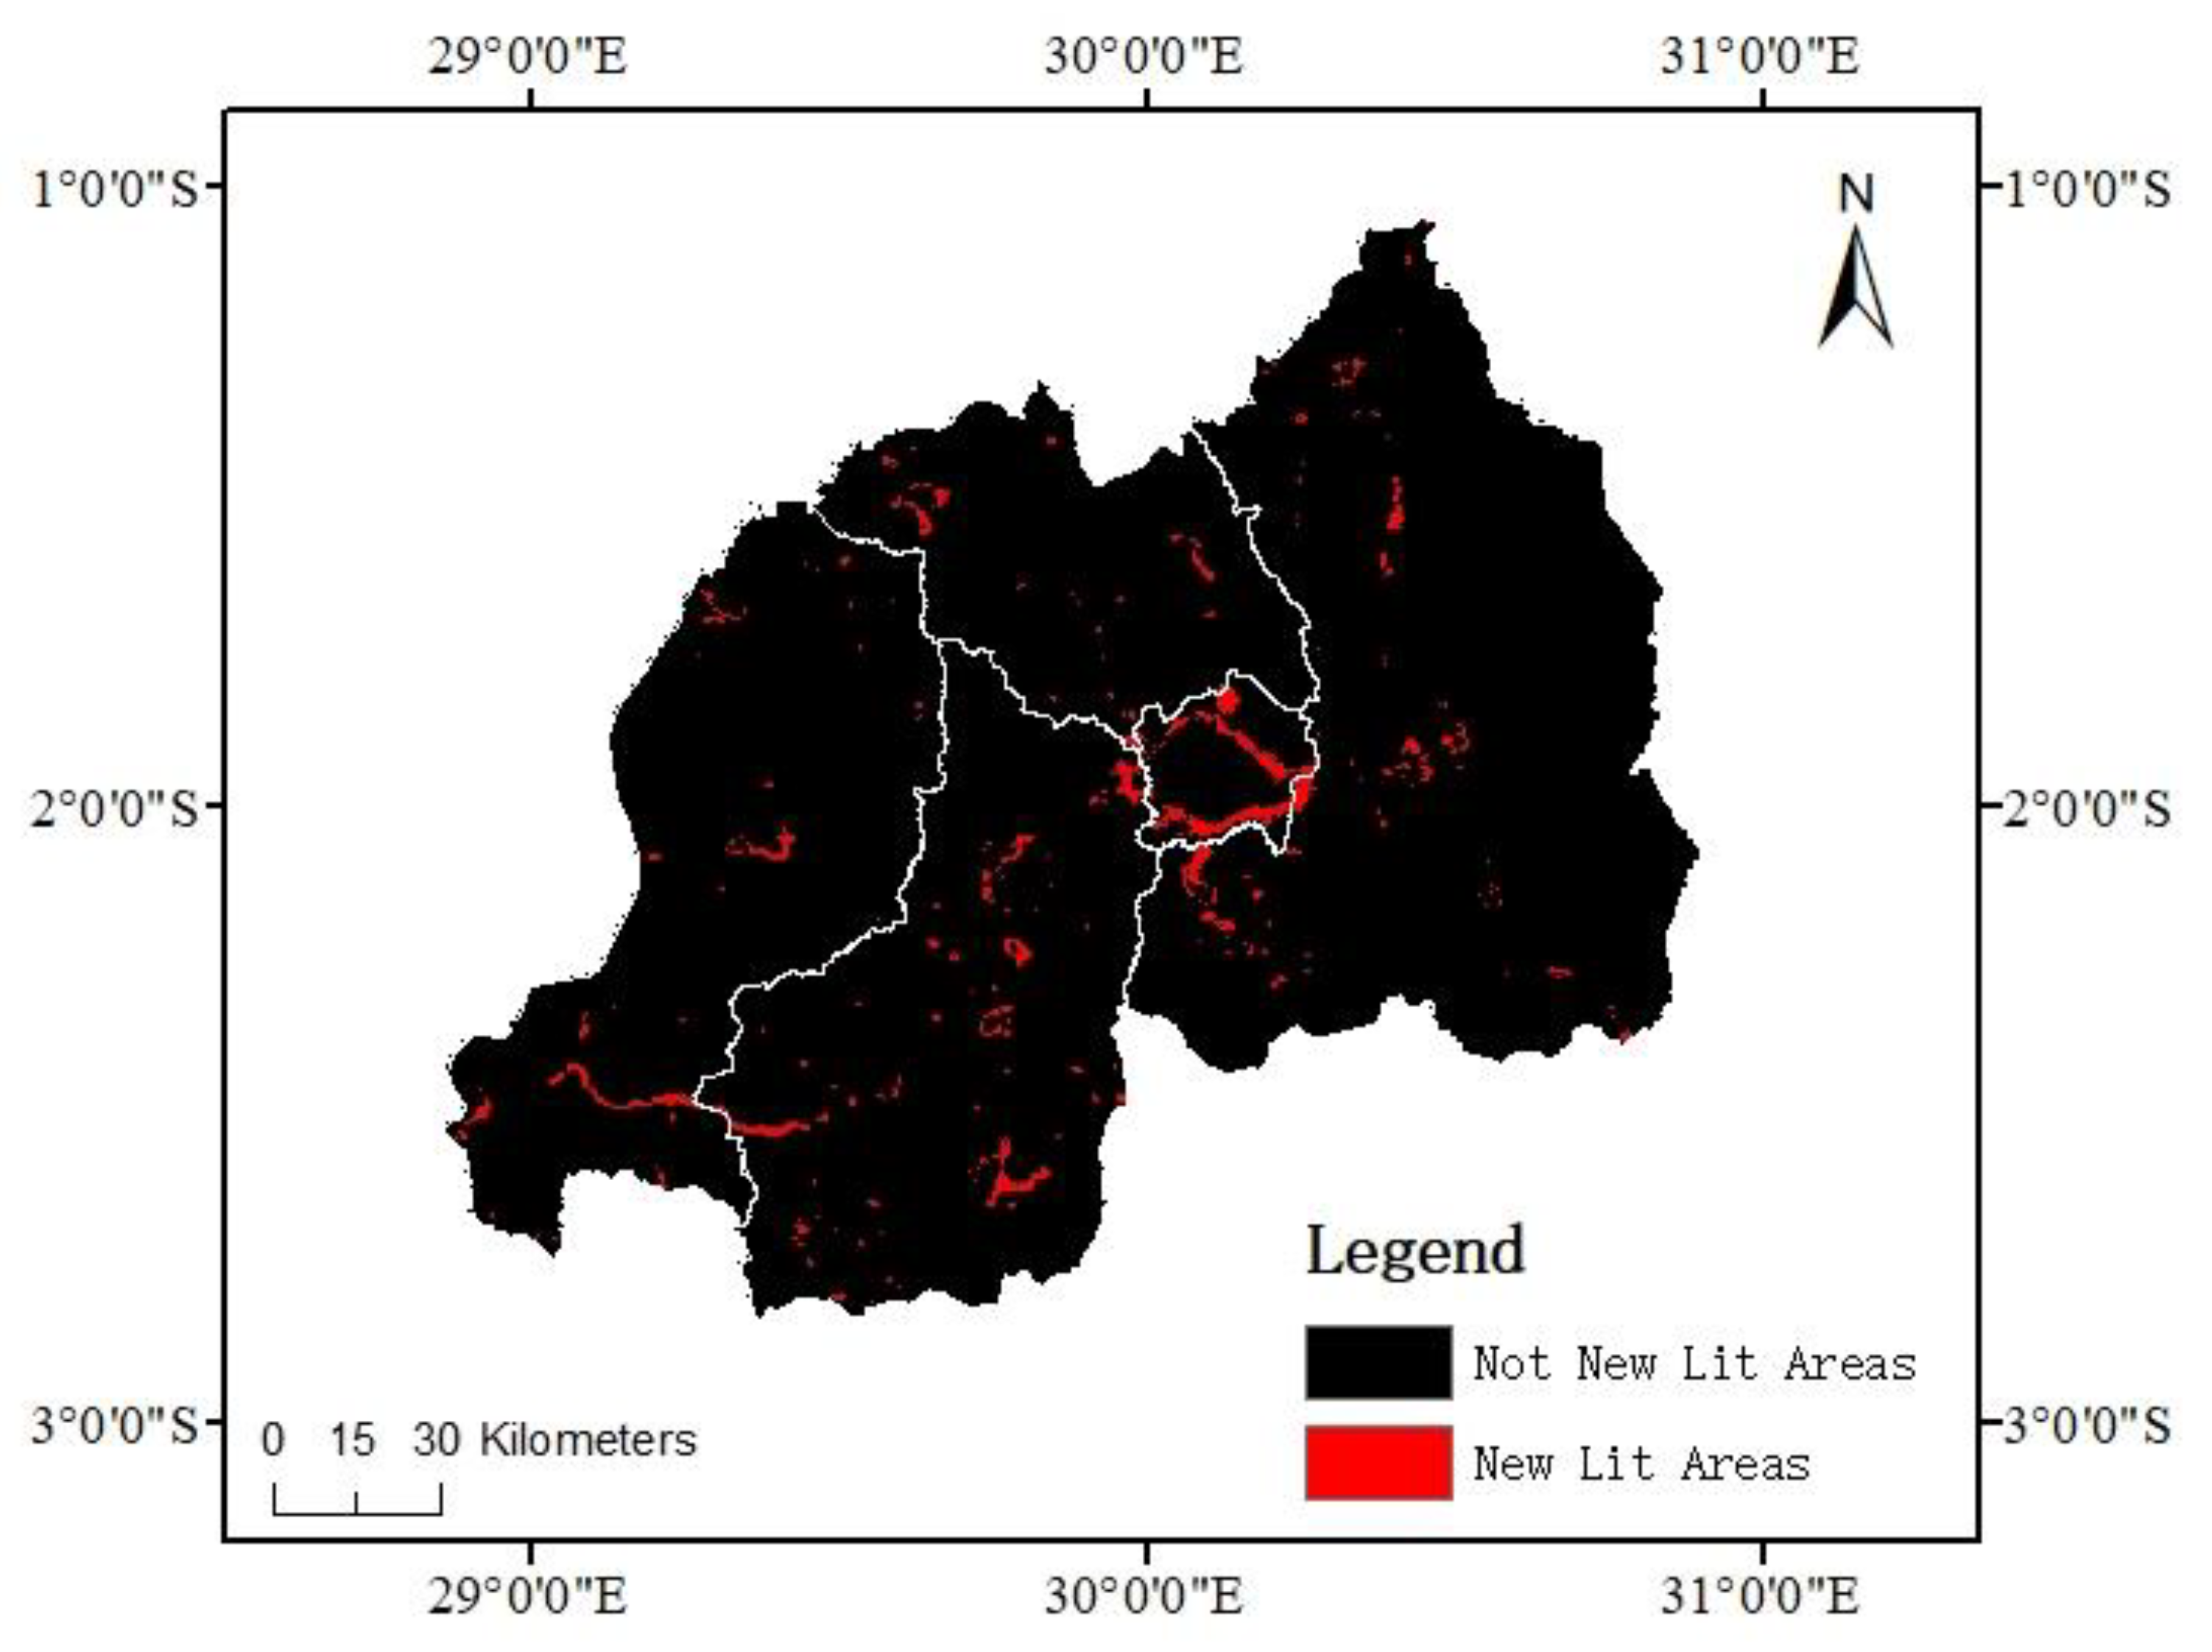
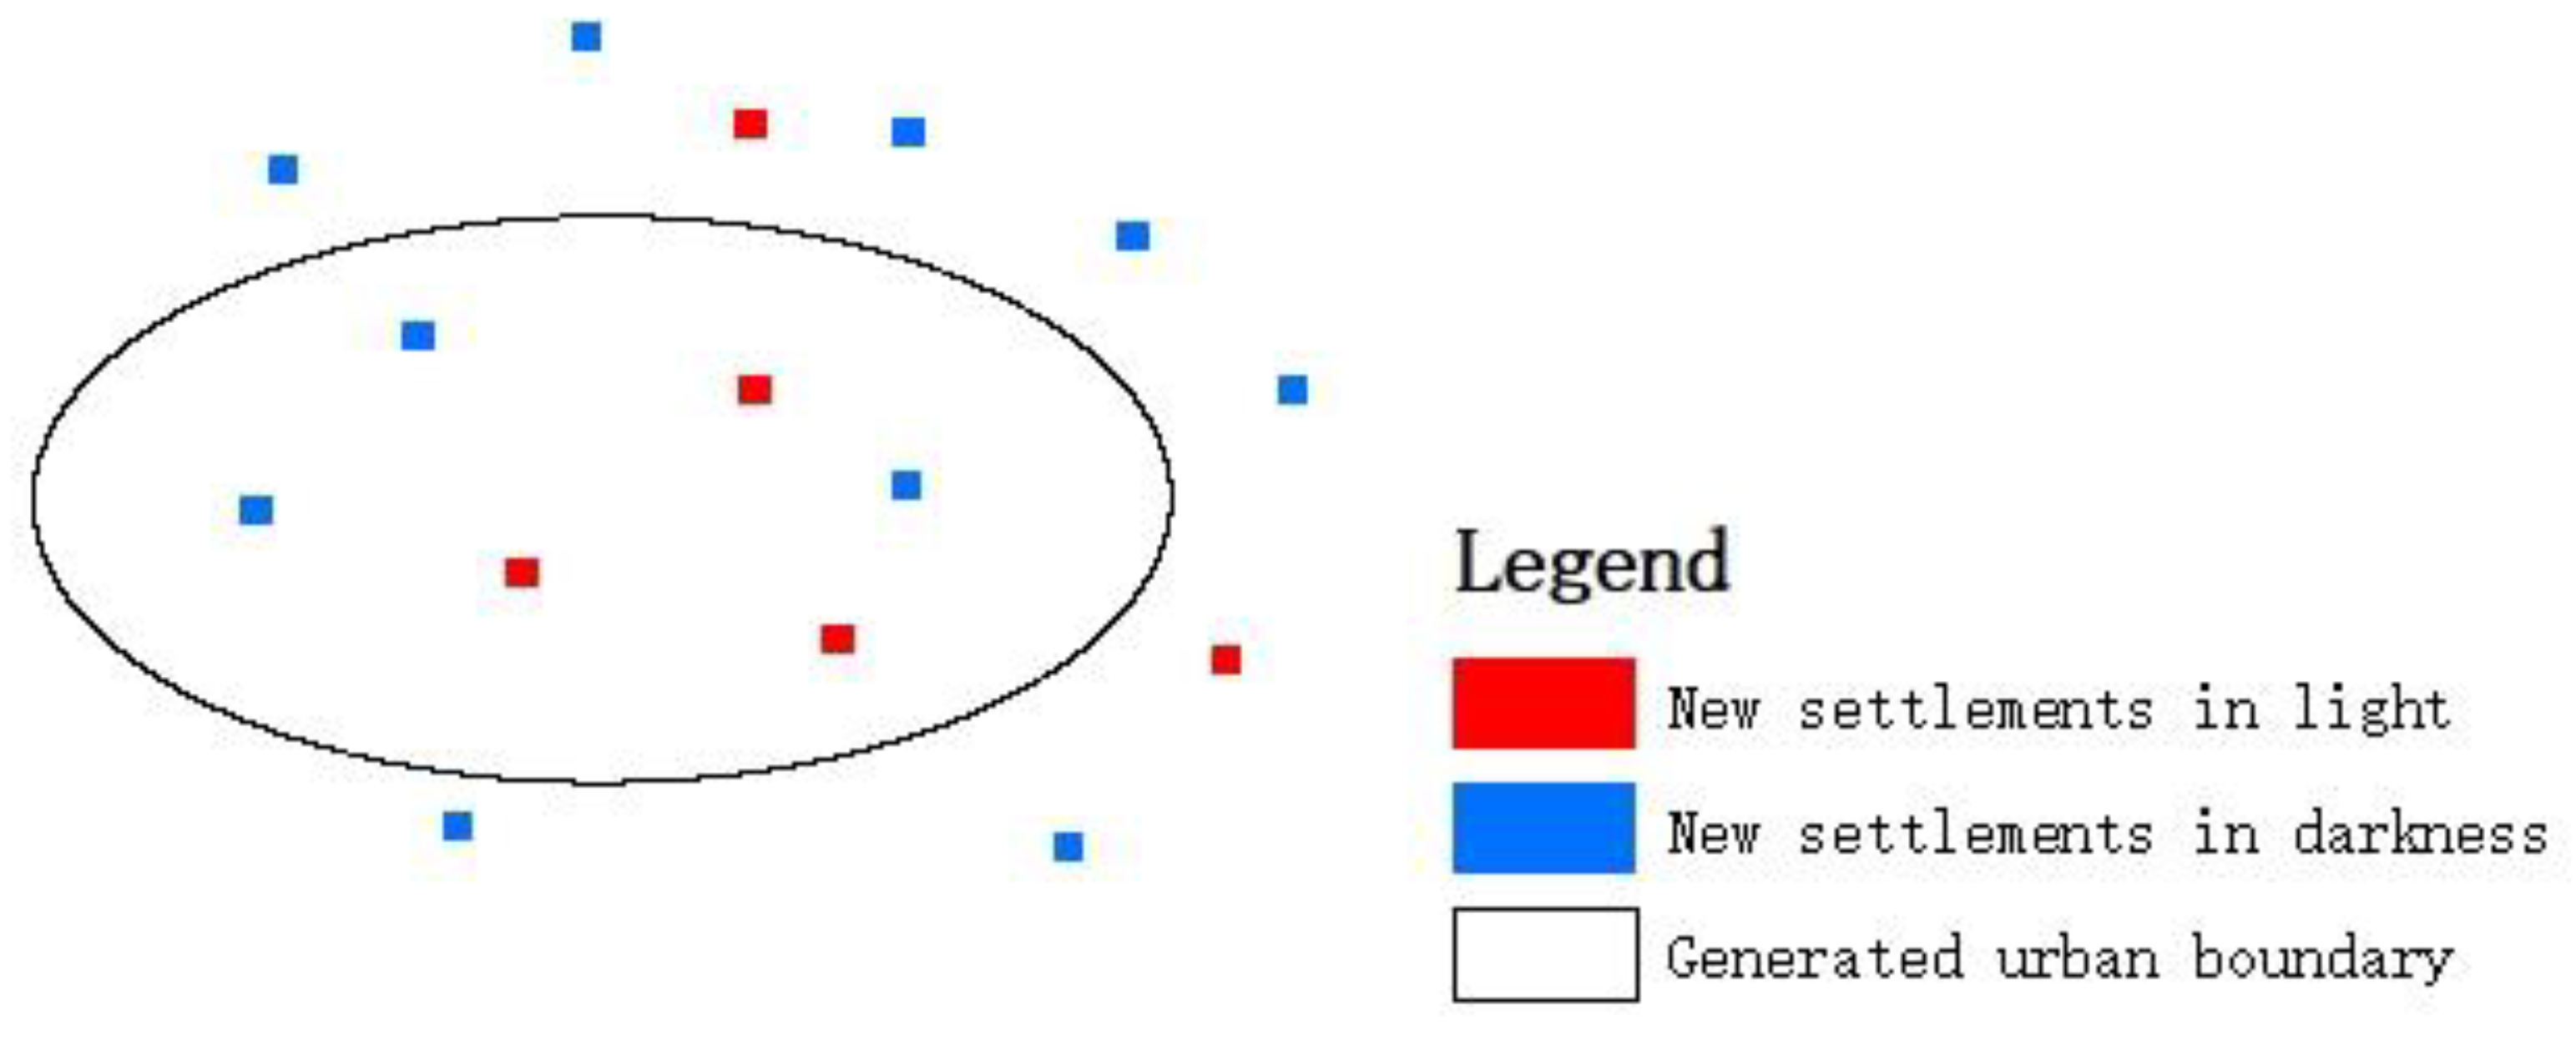
- Extract the new settlements and the lit new settlements inside and outside the urban boundary using the generated urban boundary. Figure 5 is the schematic diagram of new settlements inside and outside the urban boundary;
- (5)
- Calculate and compare the lit ratio of the new settlements inside and outside the urban boundary.
2.2.3. Calculation of the Grid Access Rates
- (1)
- By overlaying the population density data with the nighttime light imagery, the populated pixels with positive radiance were extracted and identified as ‘achieved grid access’, whereas the populated pixels with zero radiance were classified as ‘not achieved grid access’. This strategy has been successfully used for creating a binary mask of whether light is present or not in a previous study [57]. As a result, a binary image of whether grid access has been achieved in populated areas was obtained;
- (2)
- By overlaying the binary image of grid access with the population density data, a thematic map showing population with access to grid was obtained;
- (3)
- The total population and the population with access to grid were added up;
- (4)
- By dividing the population with access to grid and the total population counts, the grid access rate was calculated.
3. Results
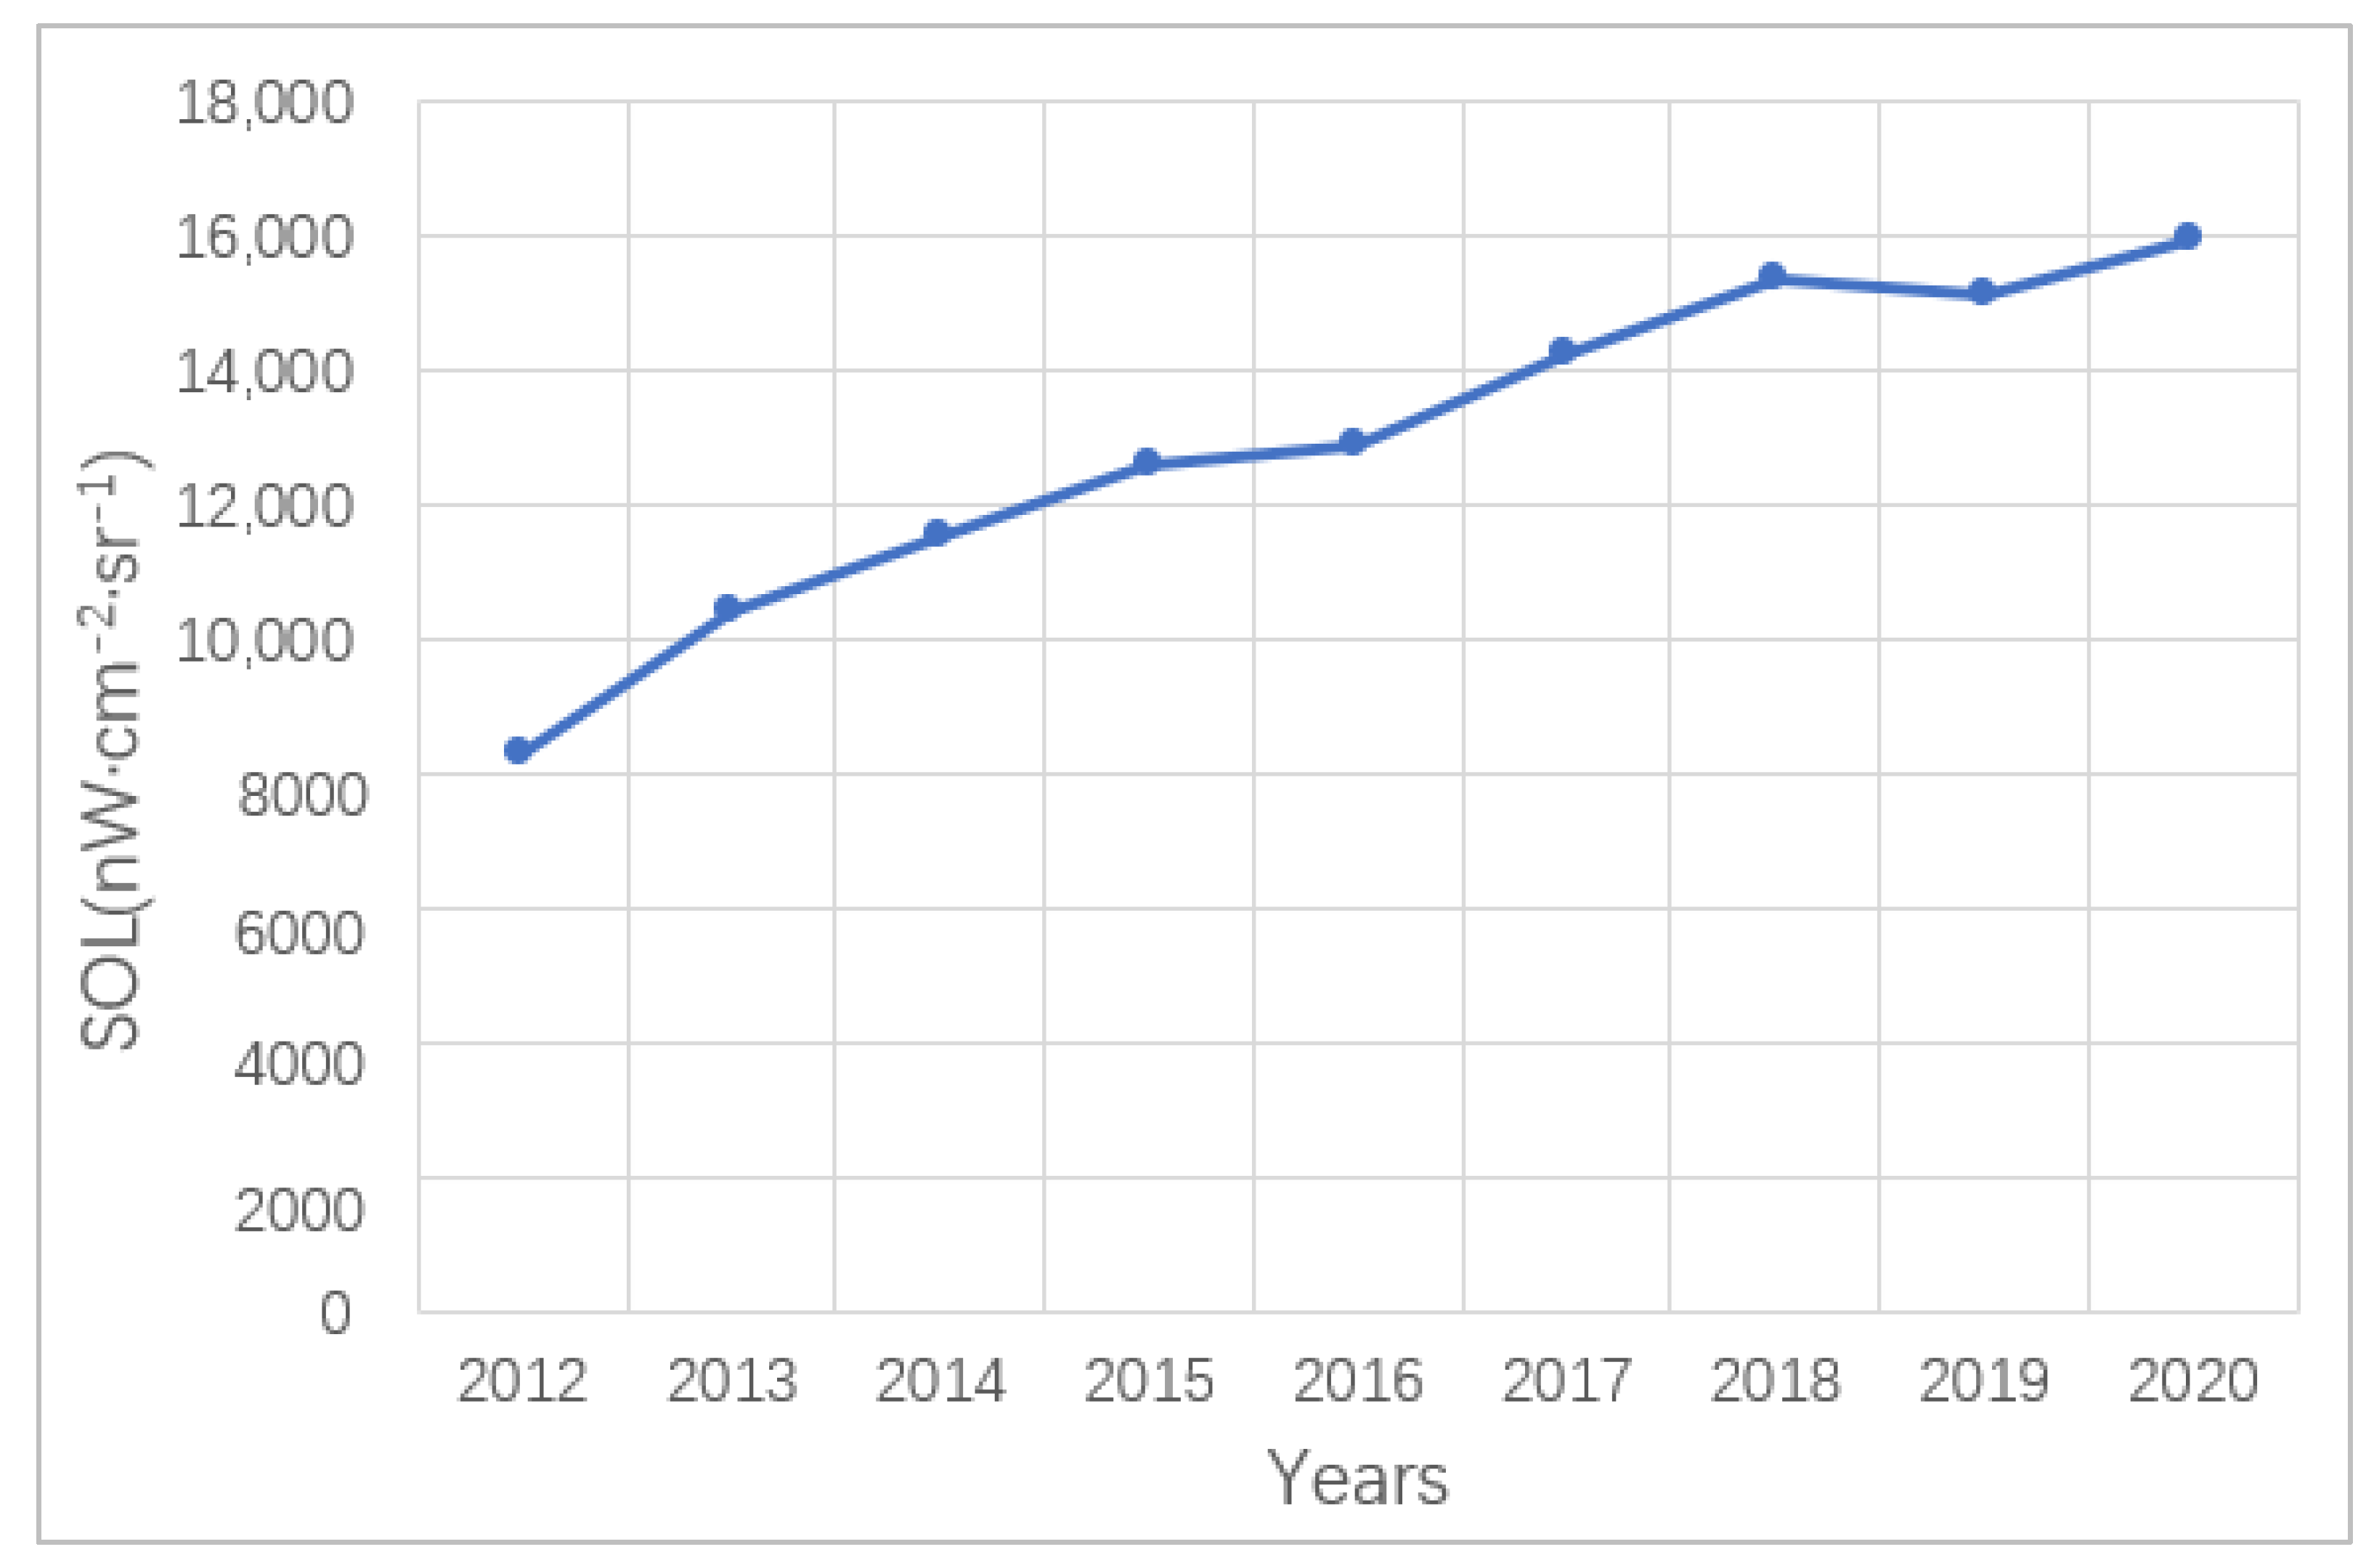
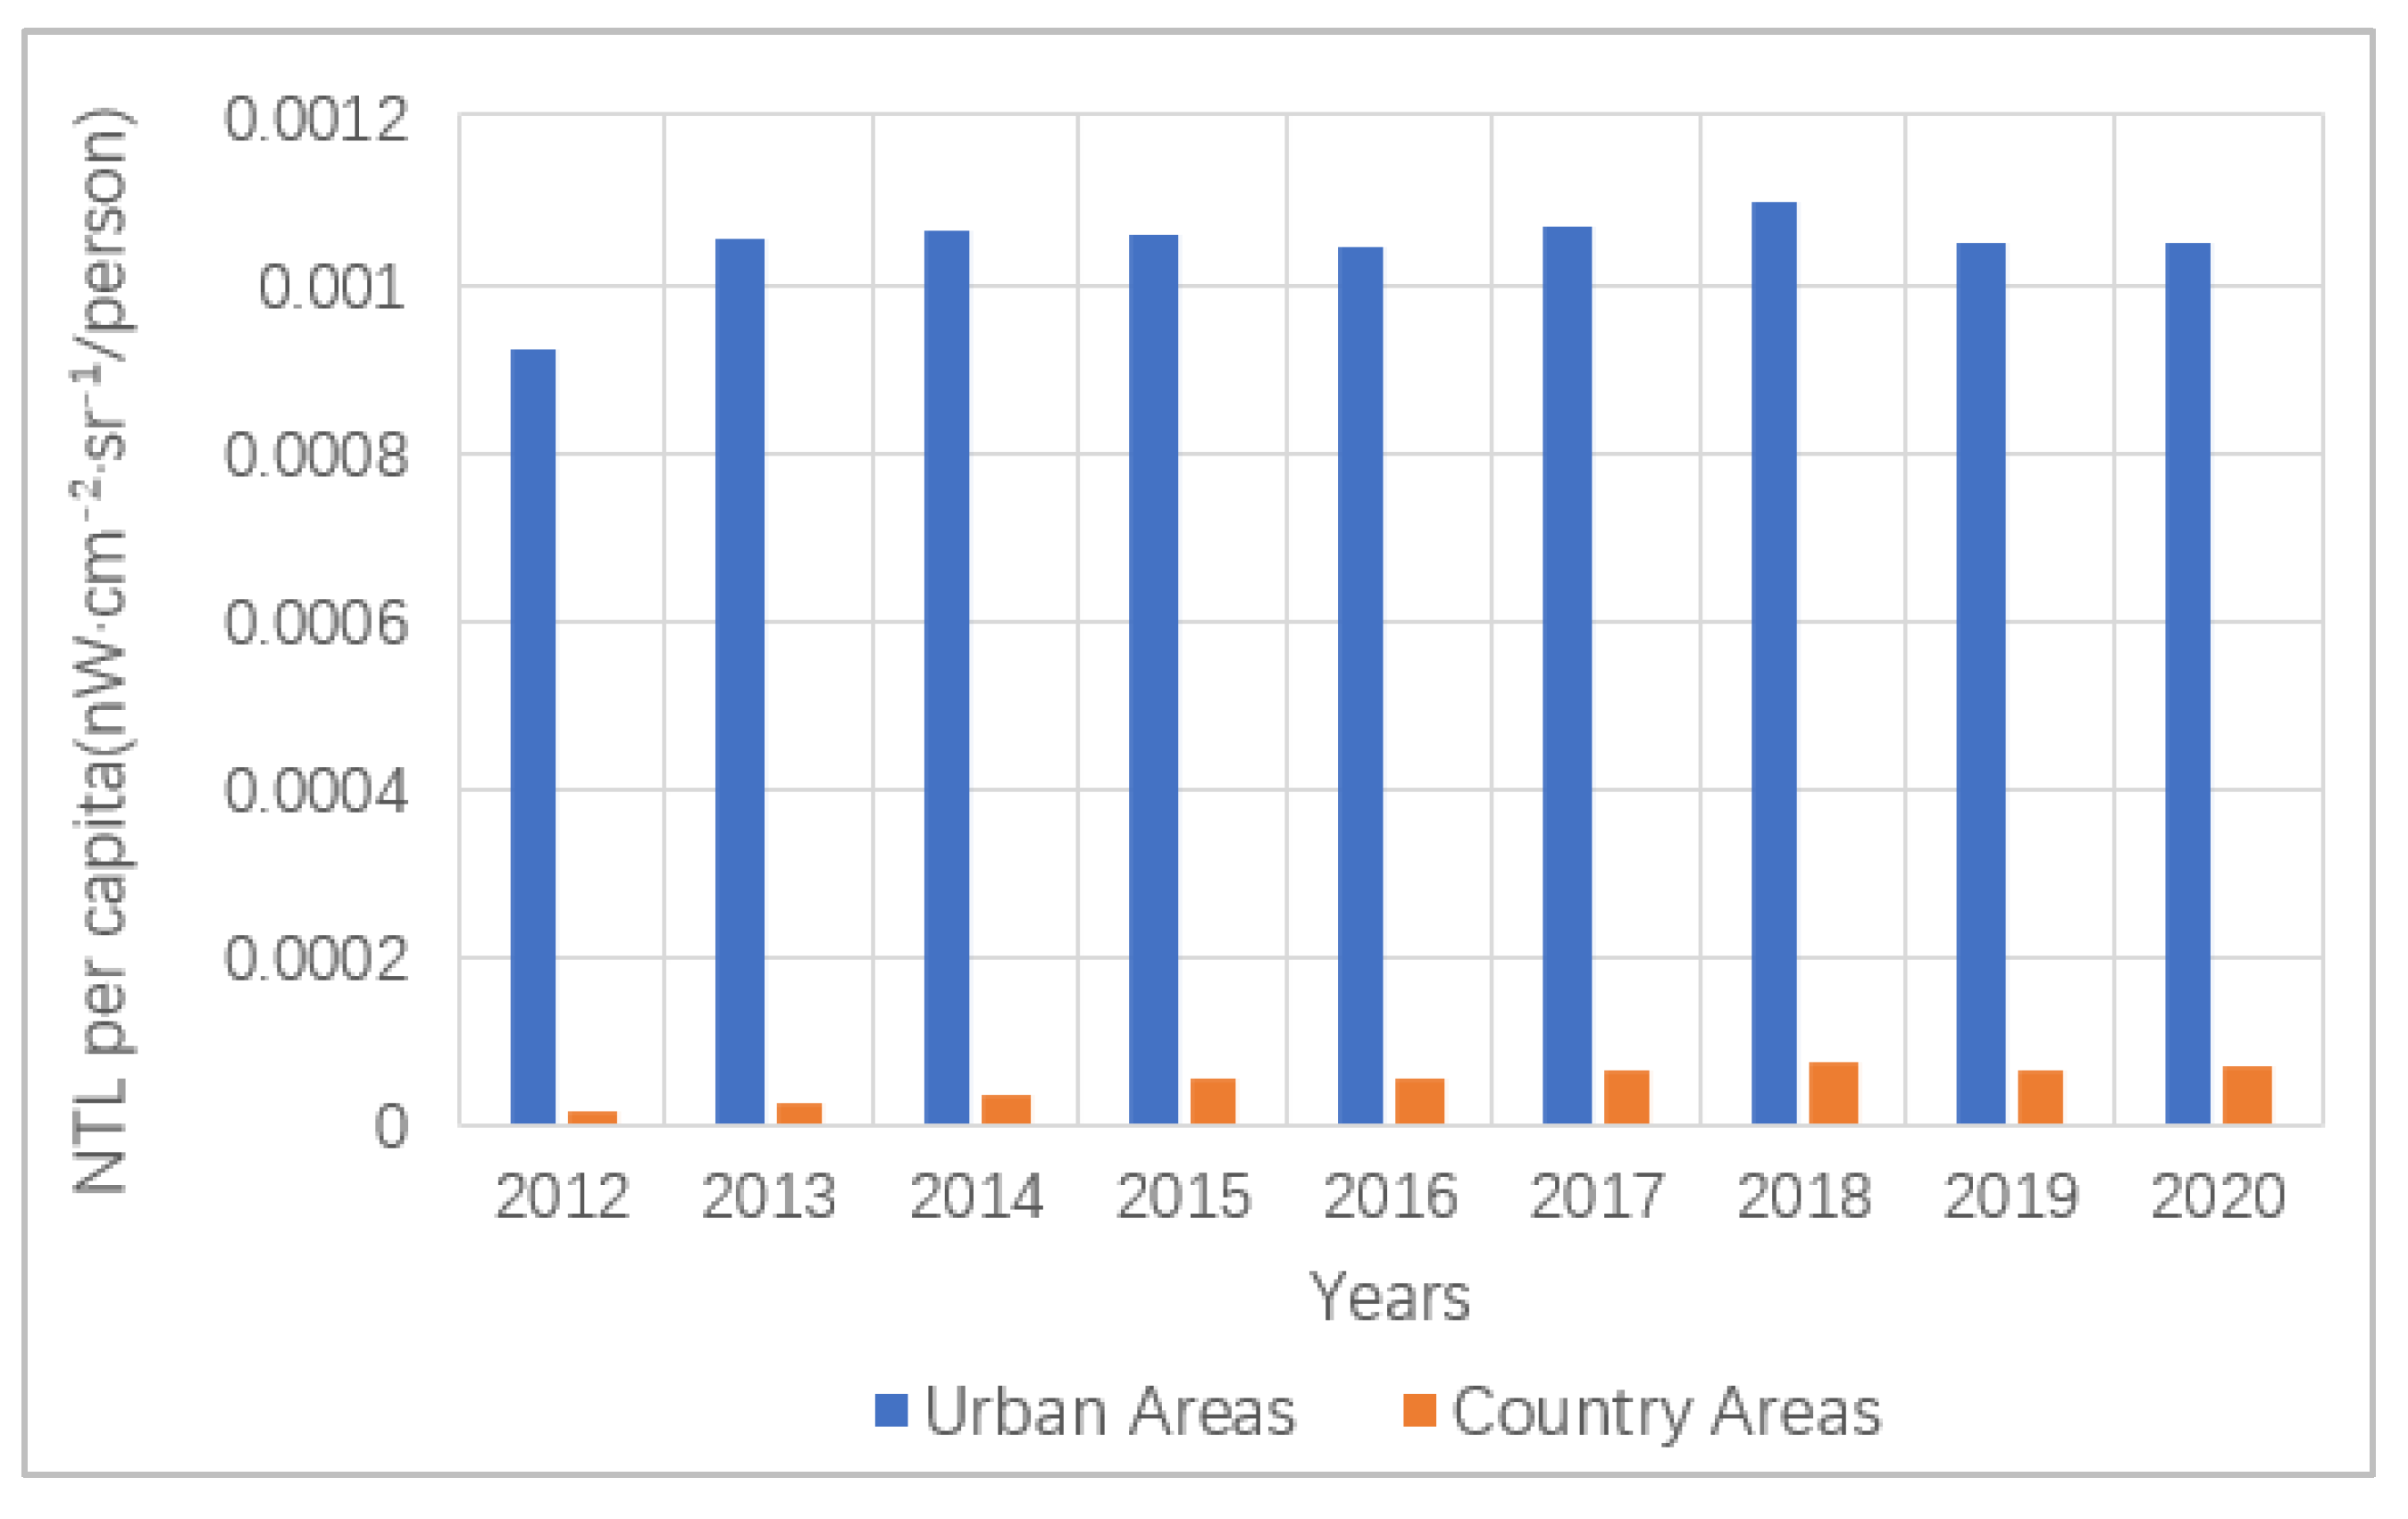
3.1. Nighttime Light Dynamics in Rwanda
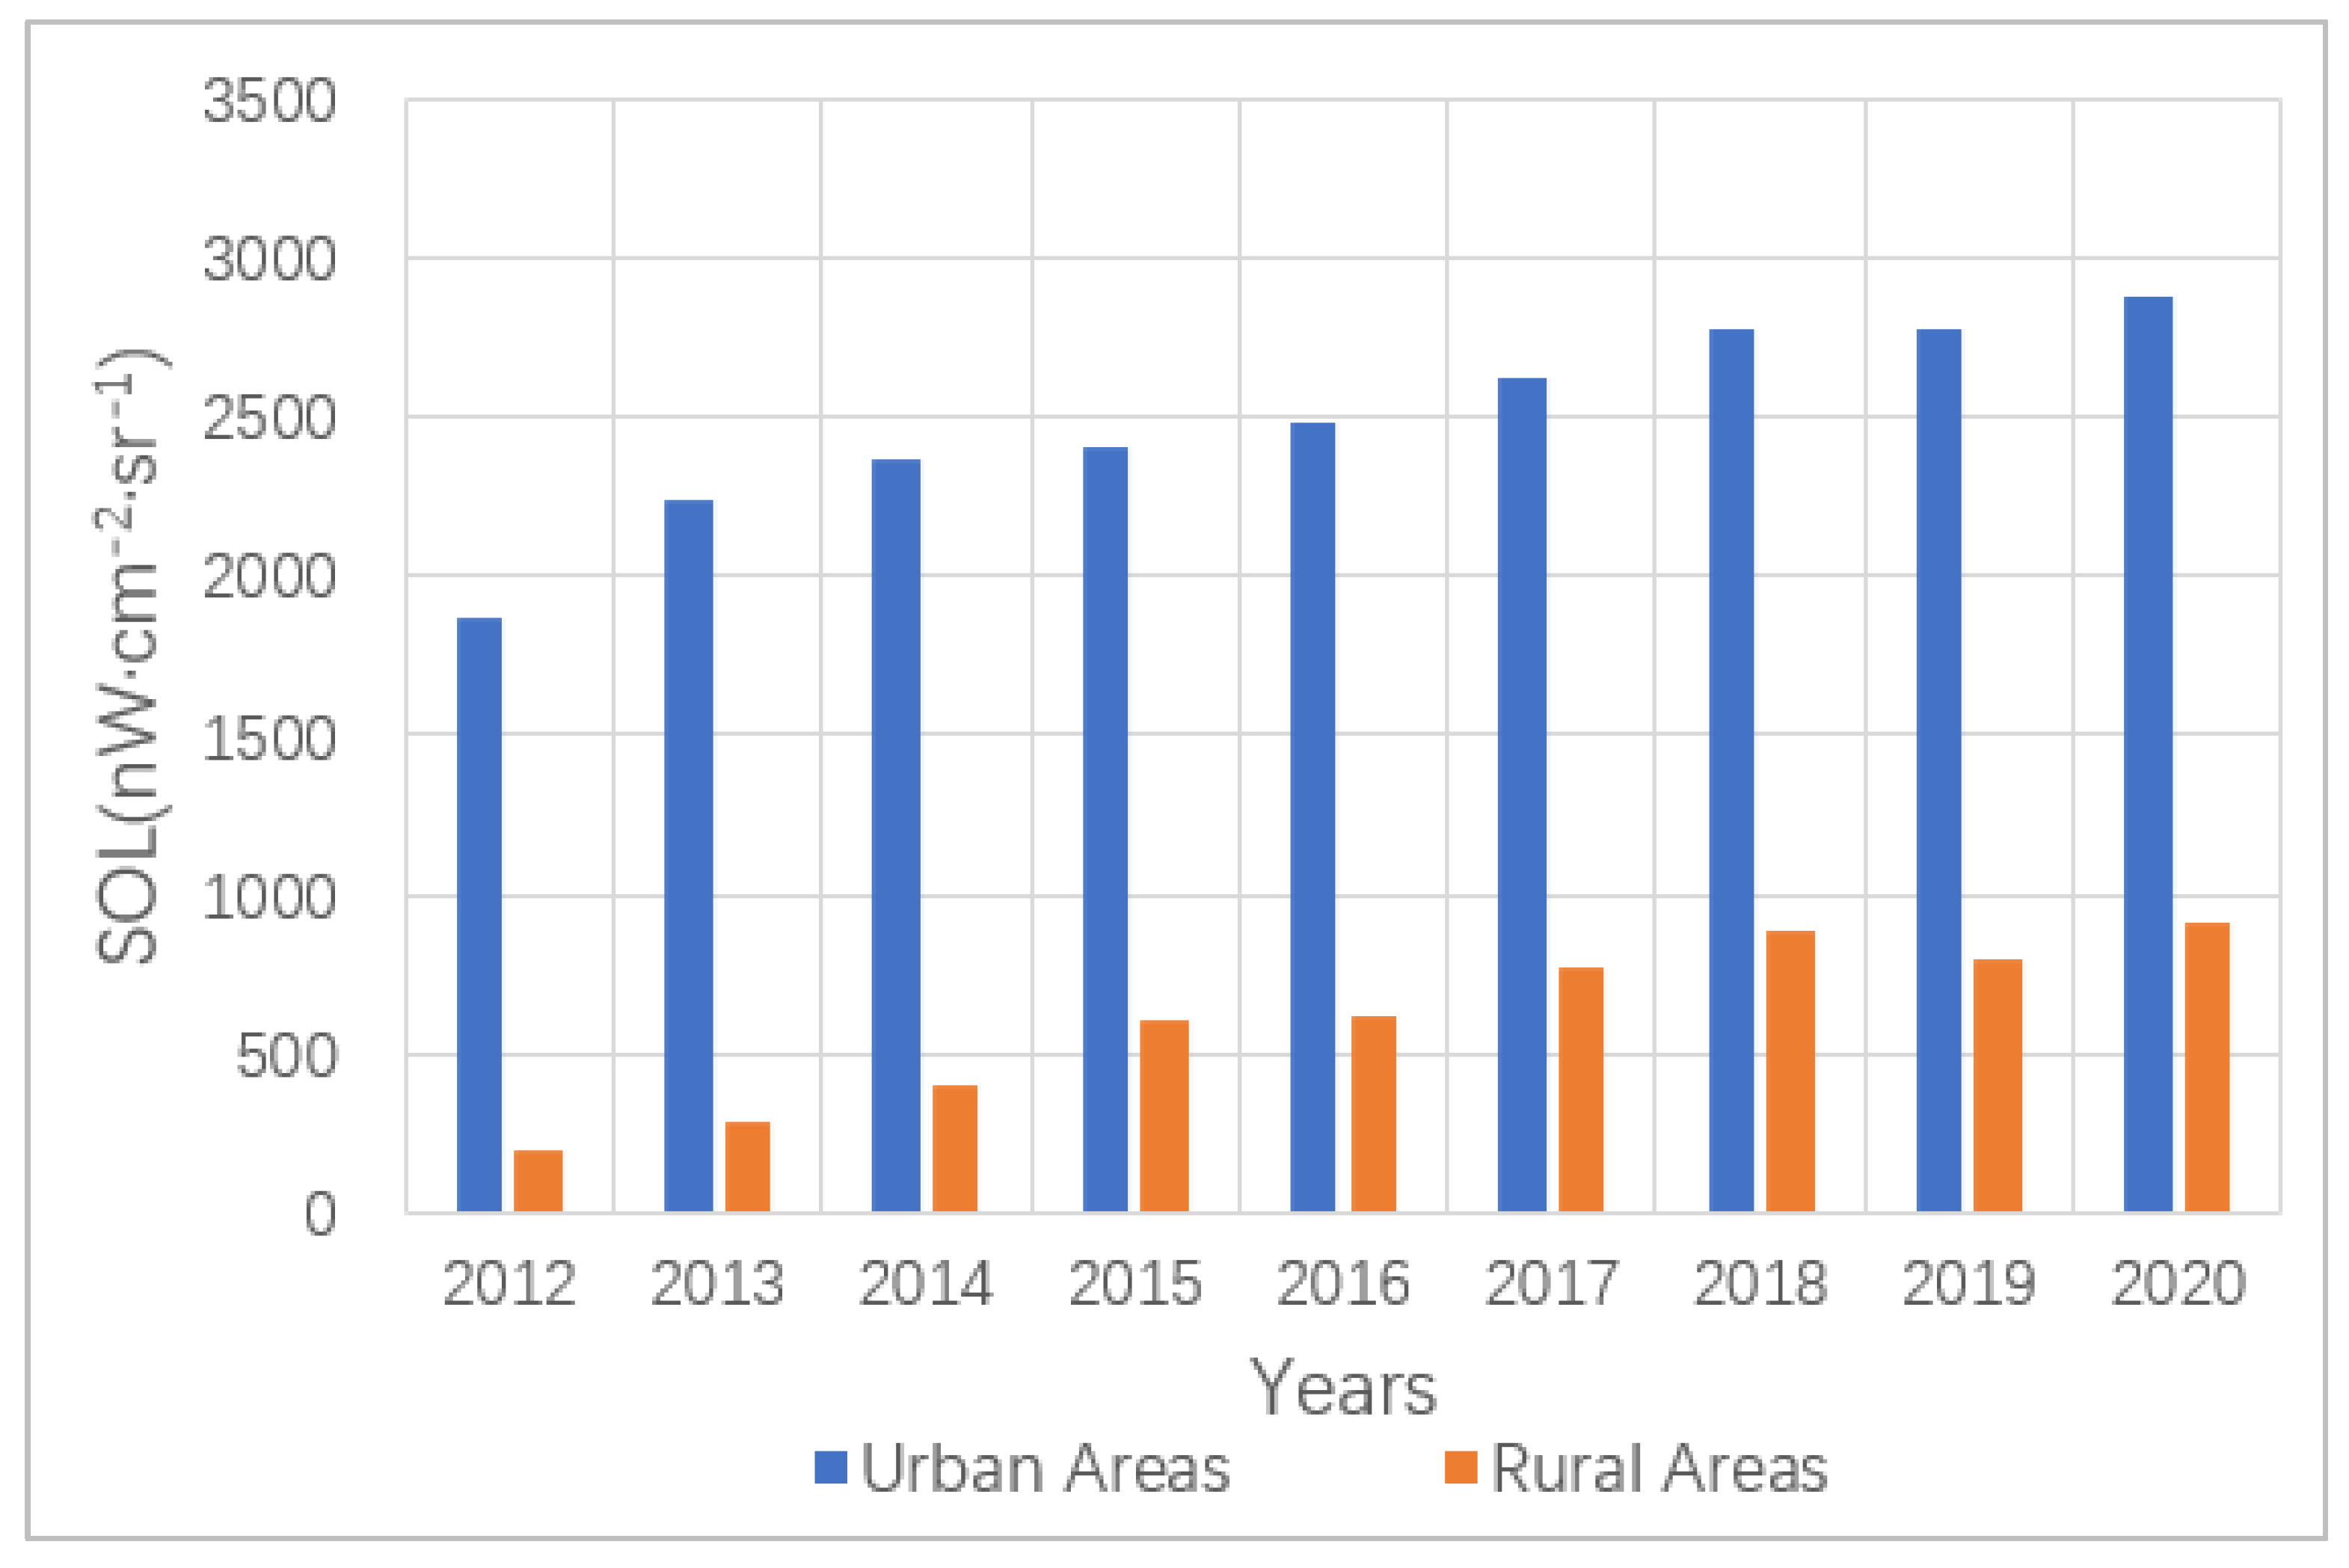
3.2. Grid Access to Settlements
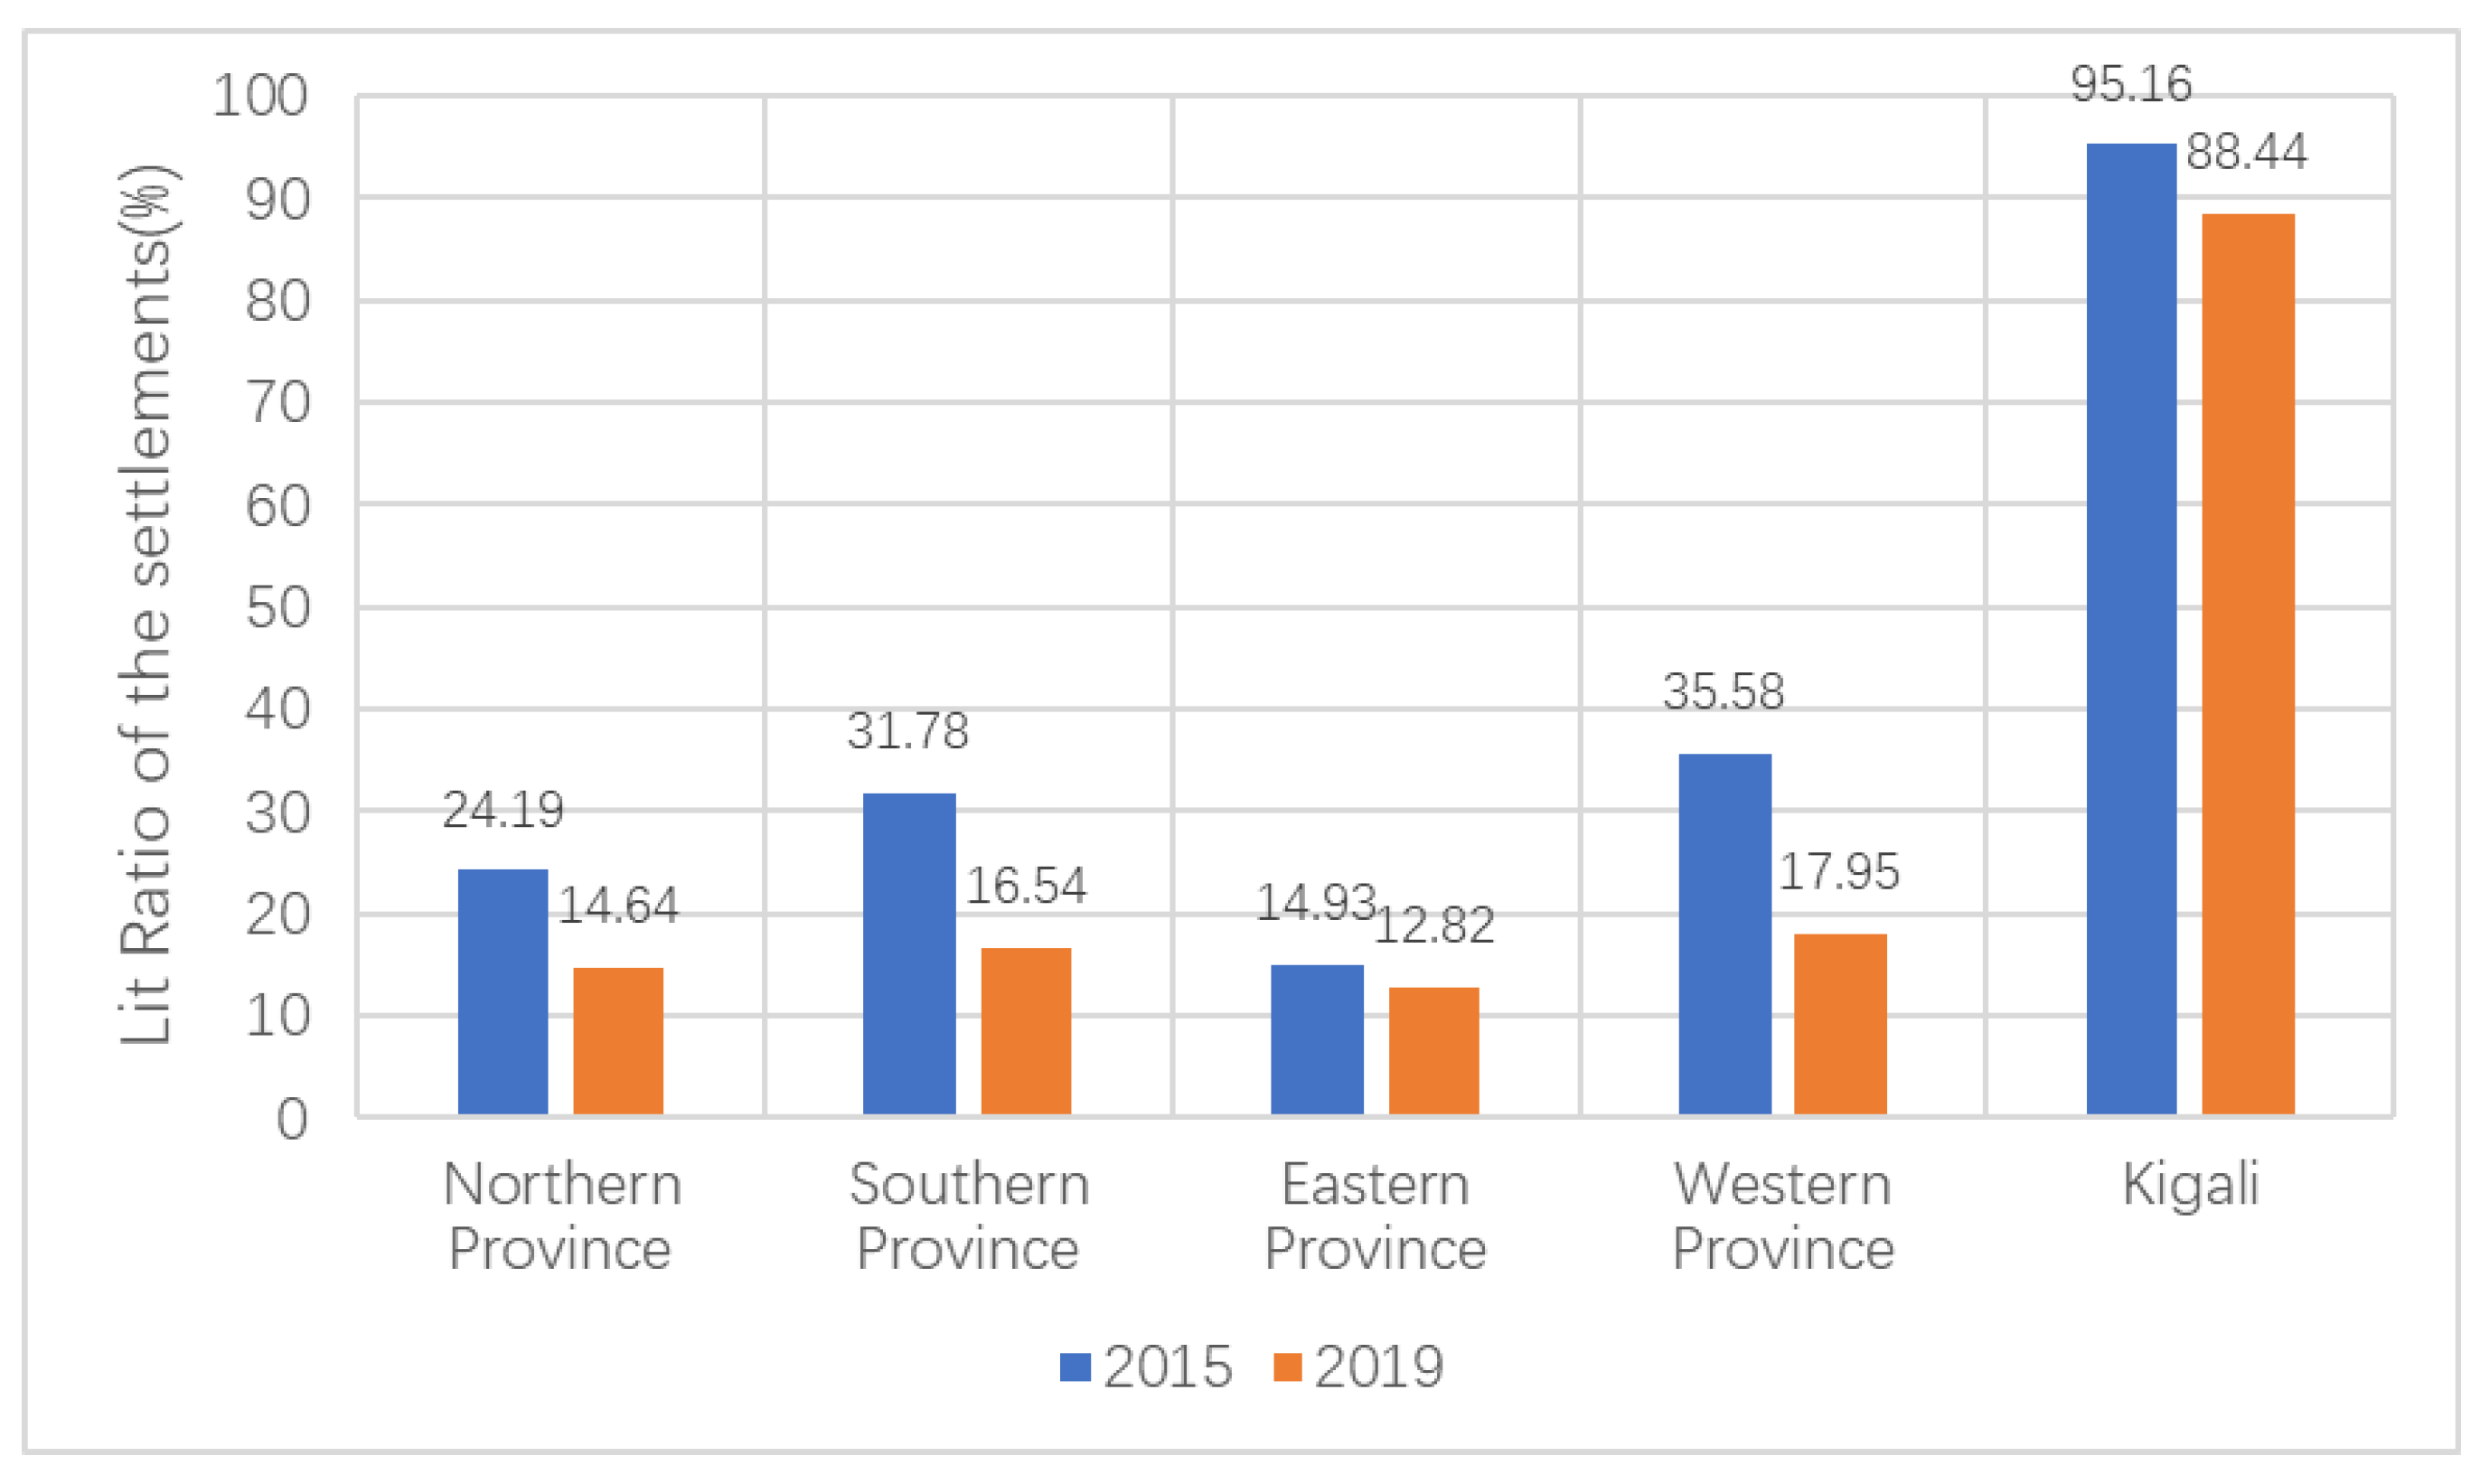
- (1)
- The lit ratio of each province in 2019 was lower than that in 2015, indicating that the electricity infrastructure construction in four provinces and Kigali fell behind the expansion of the settlements. The result illustrates that insufficient electricity infrastructure construction is a common phenomenon in Rwanda, which calls for attention;
- (2)
- Notably, the decline in the lit ratio from 2015 to 2019 in Kigali and Eastern Province was much slighter compared to that in the other three provinces. The decrease in the lit ratio in Eastern Province was about 2.1% and that in Kigali was less than 10%. The grid access of the new settlements in these two provinces was more extensive;
- (3)
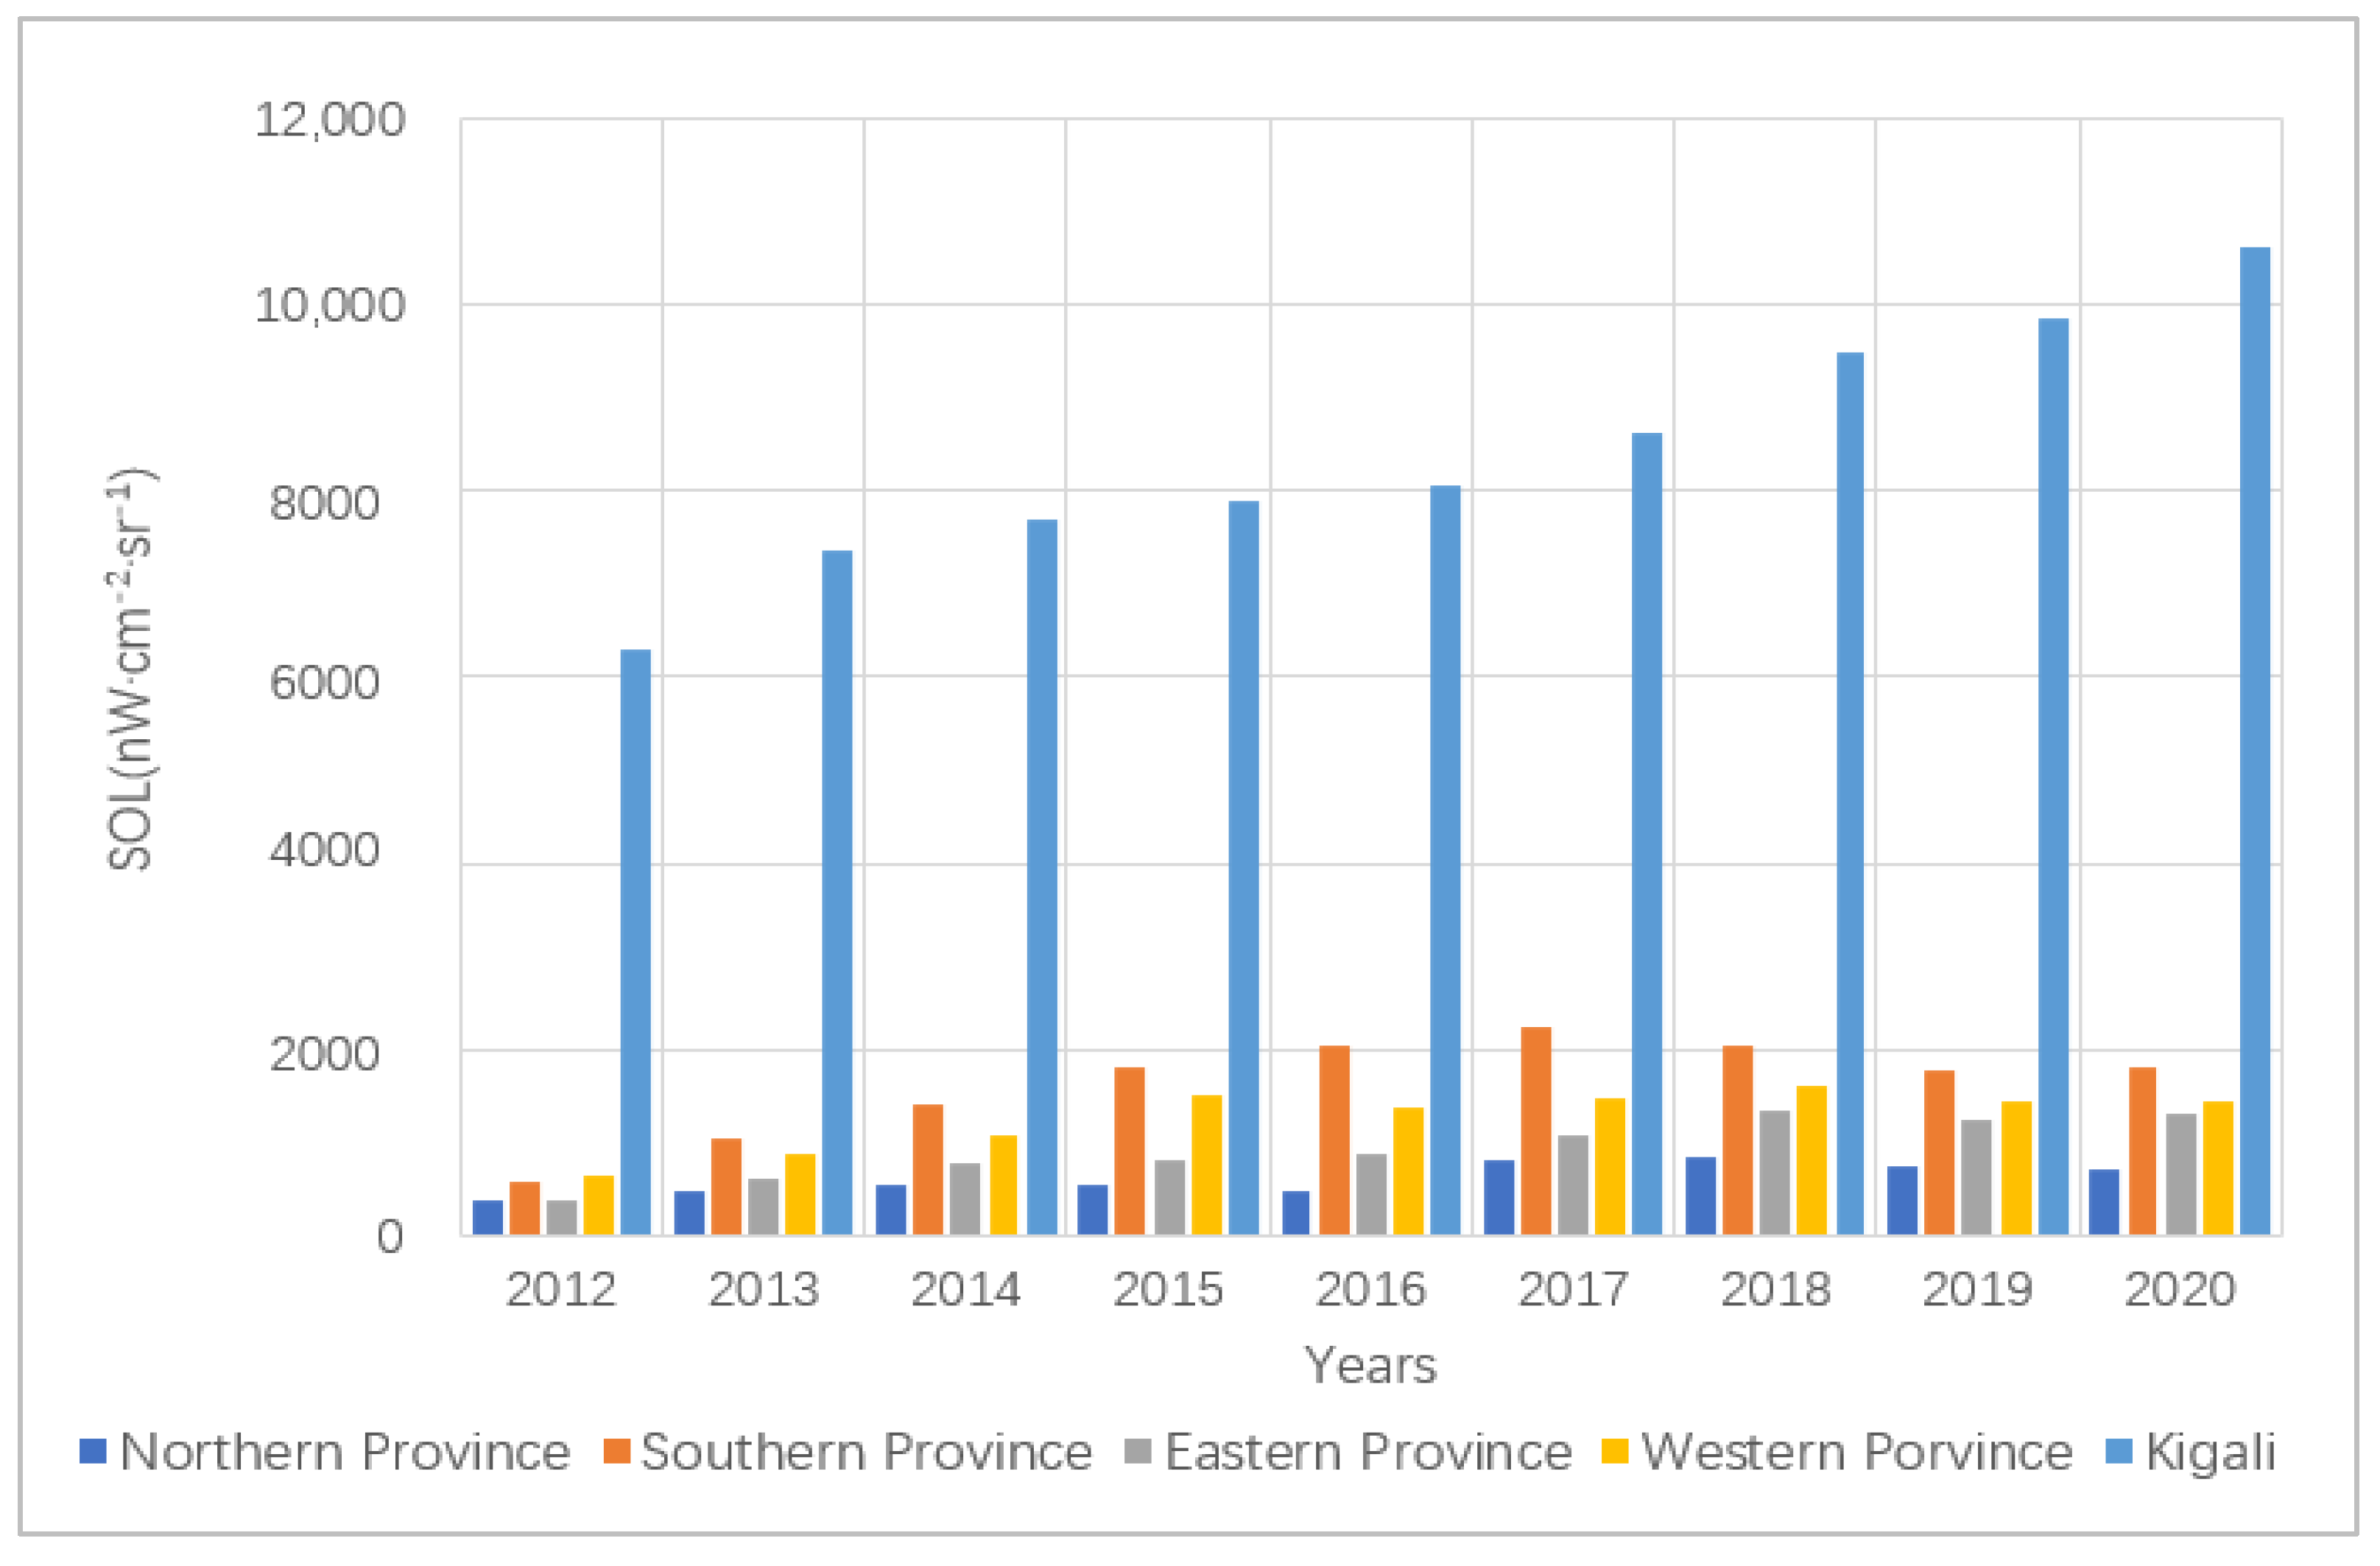
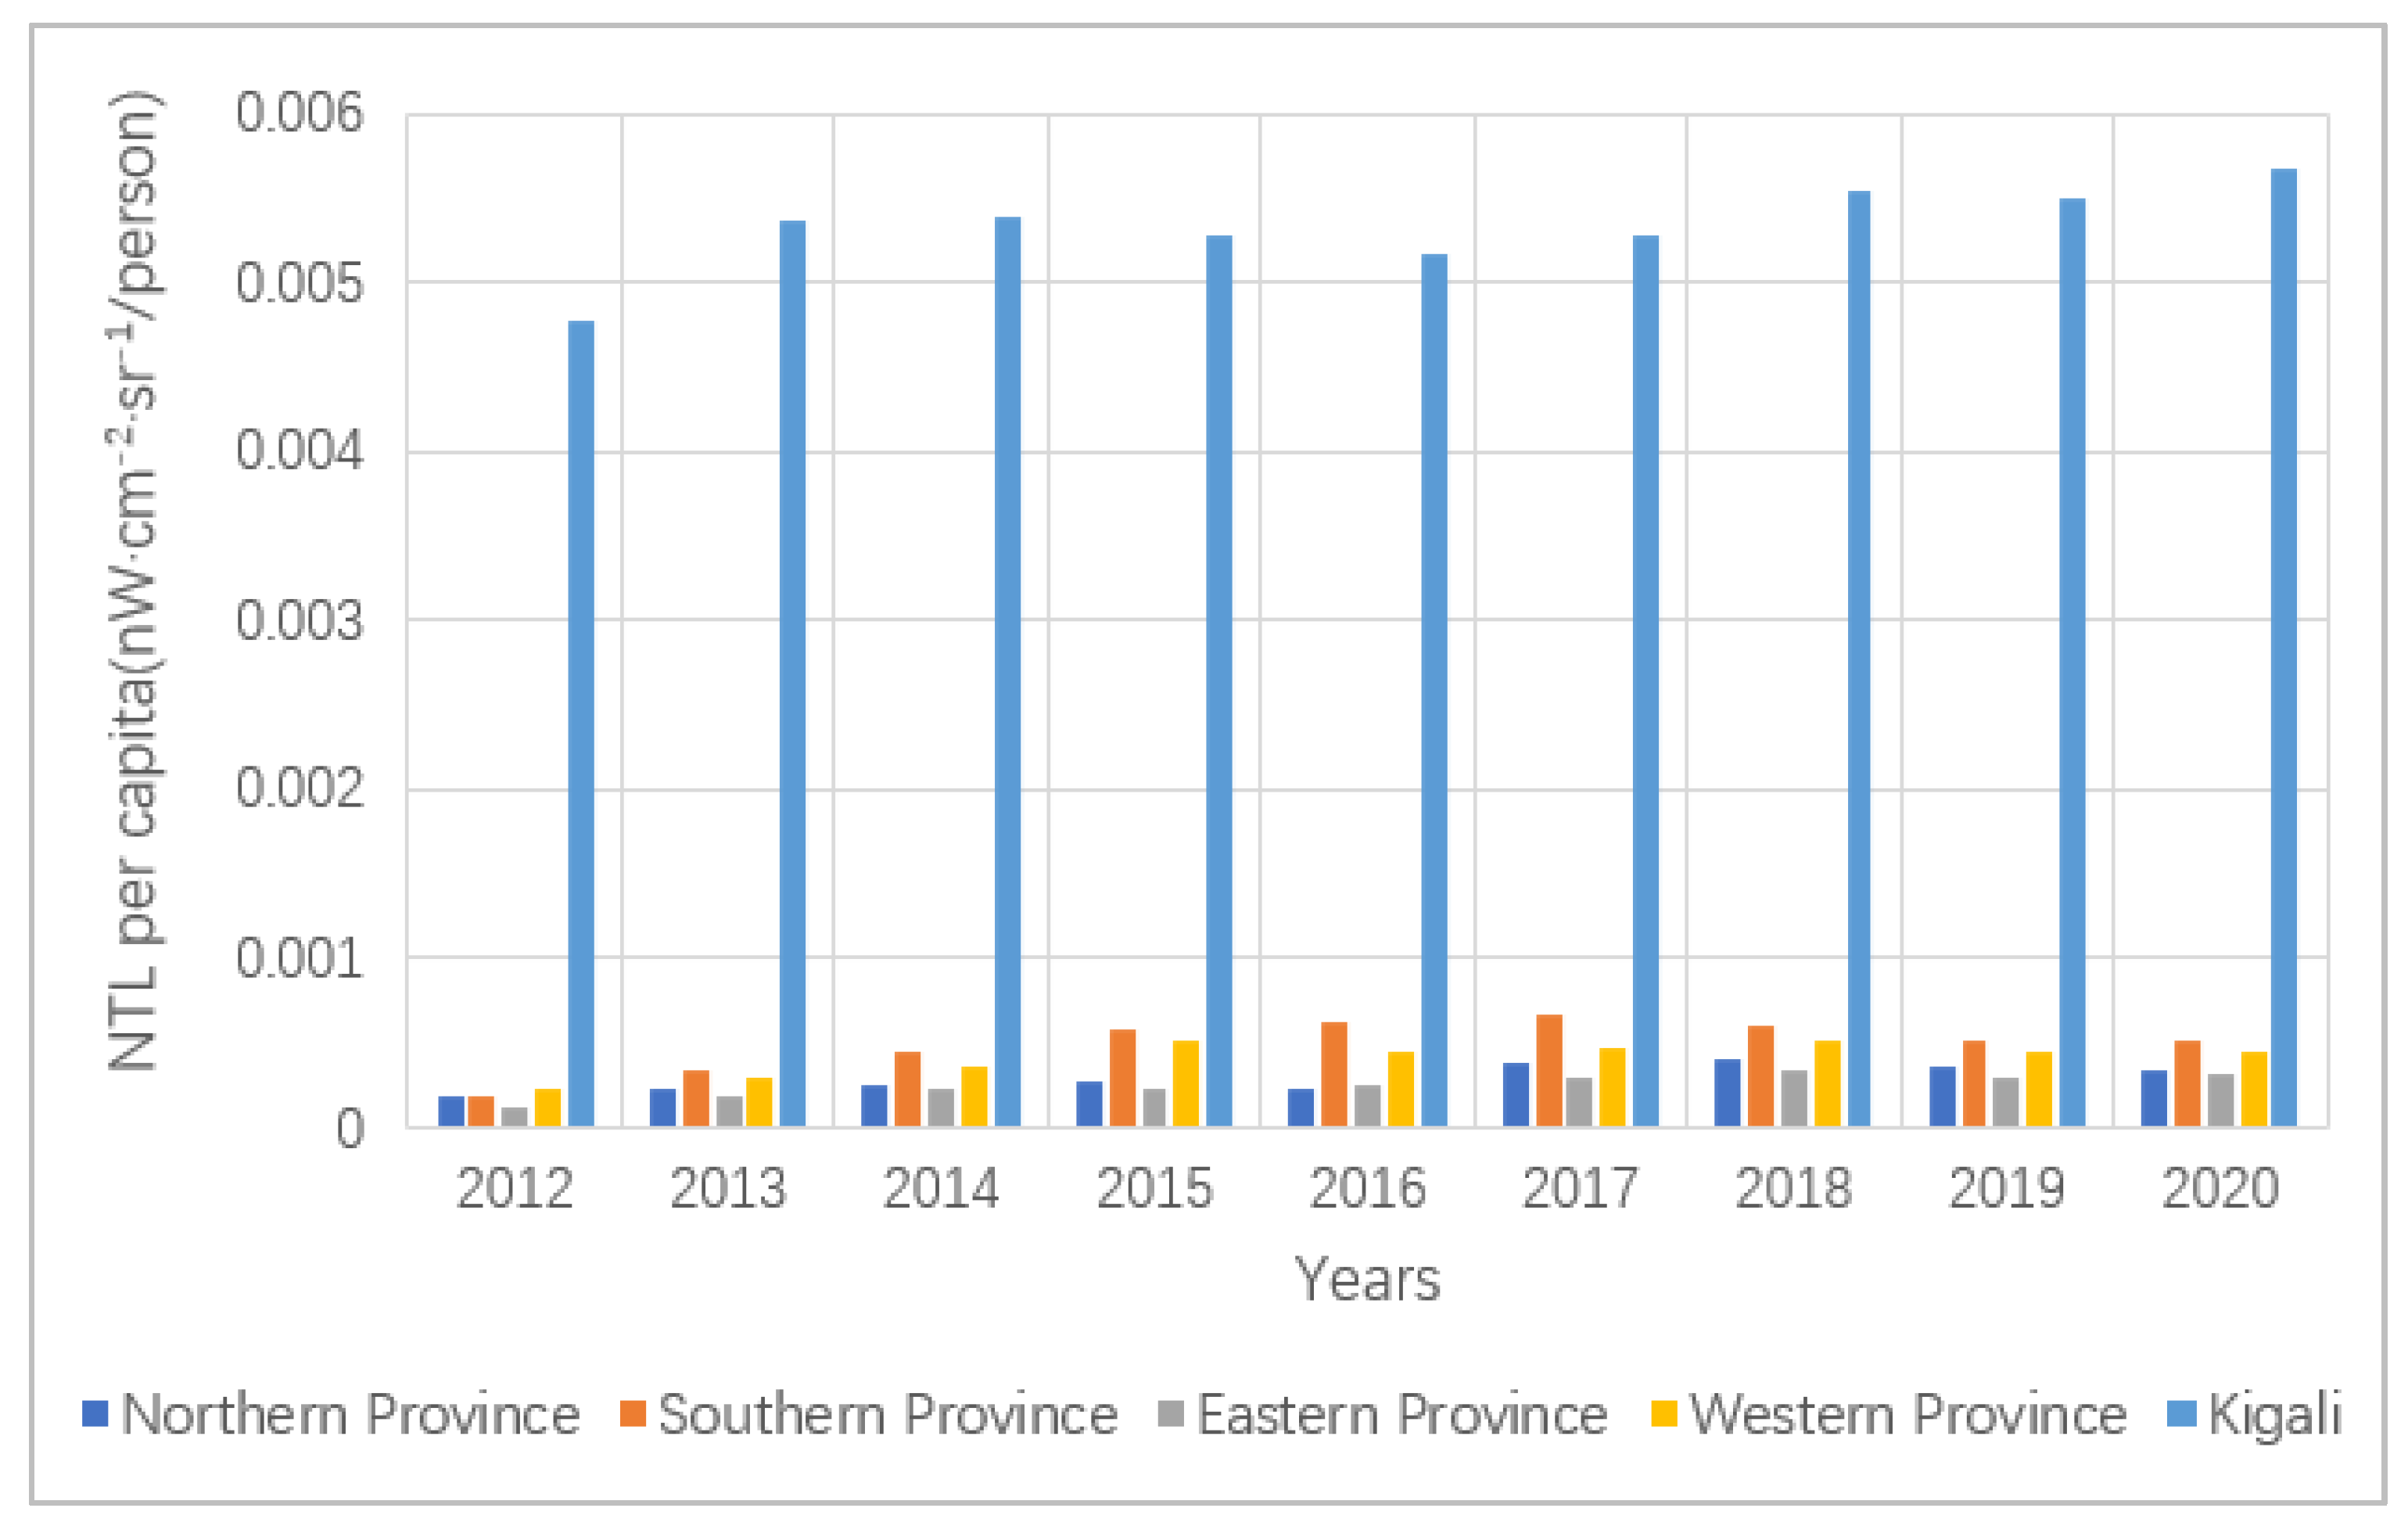
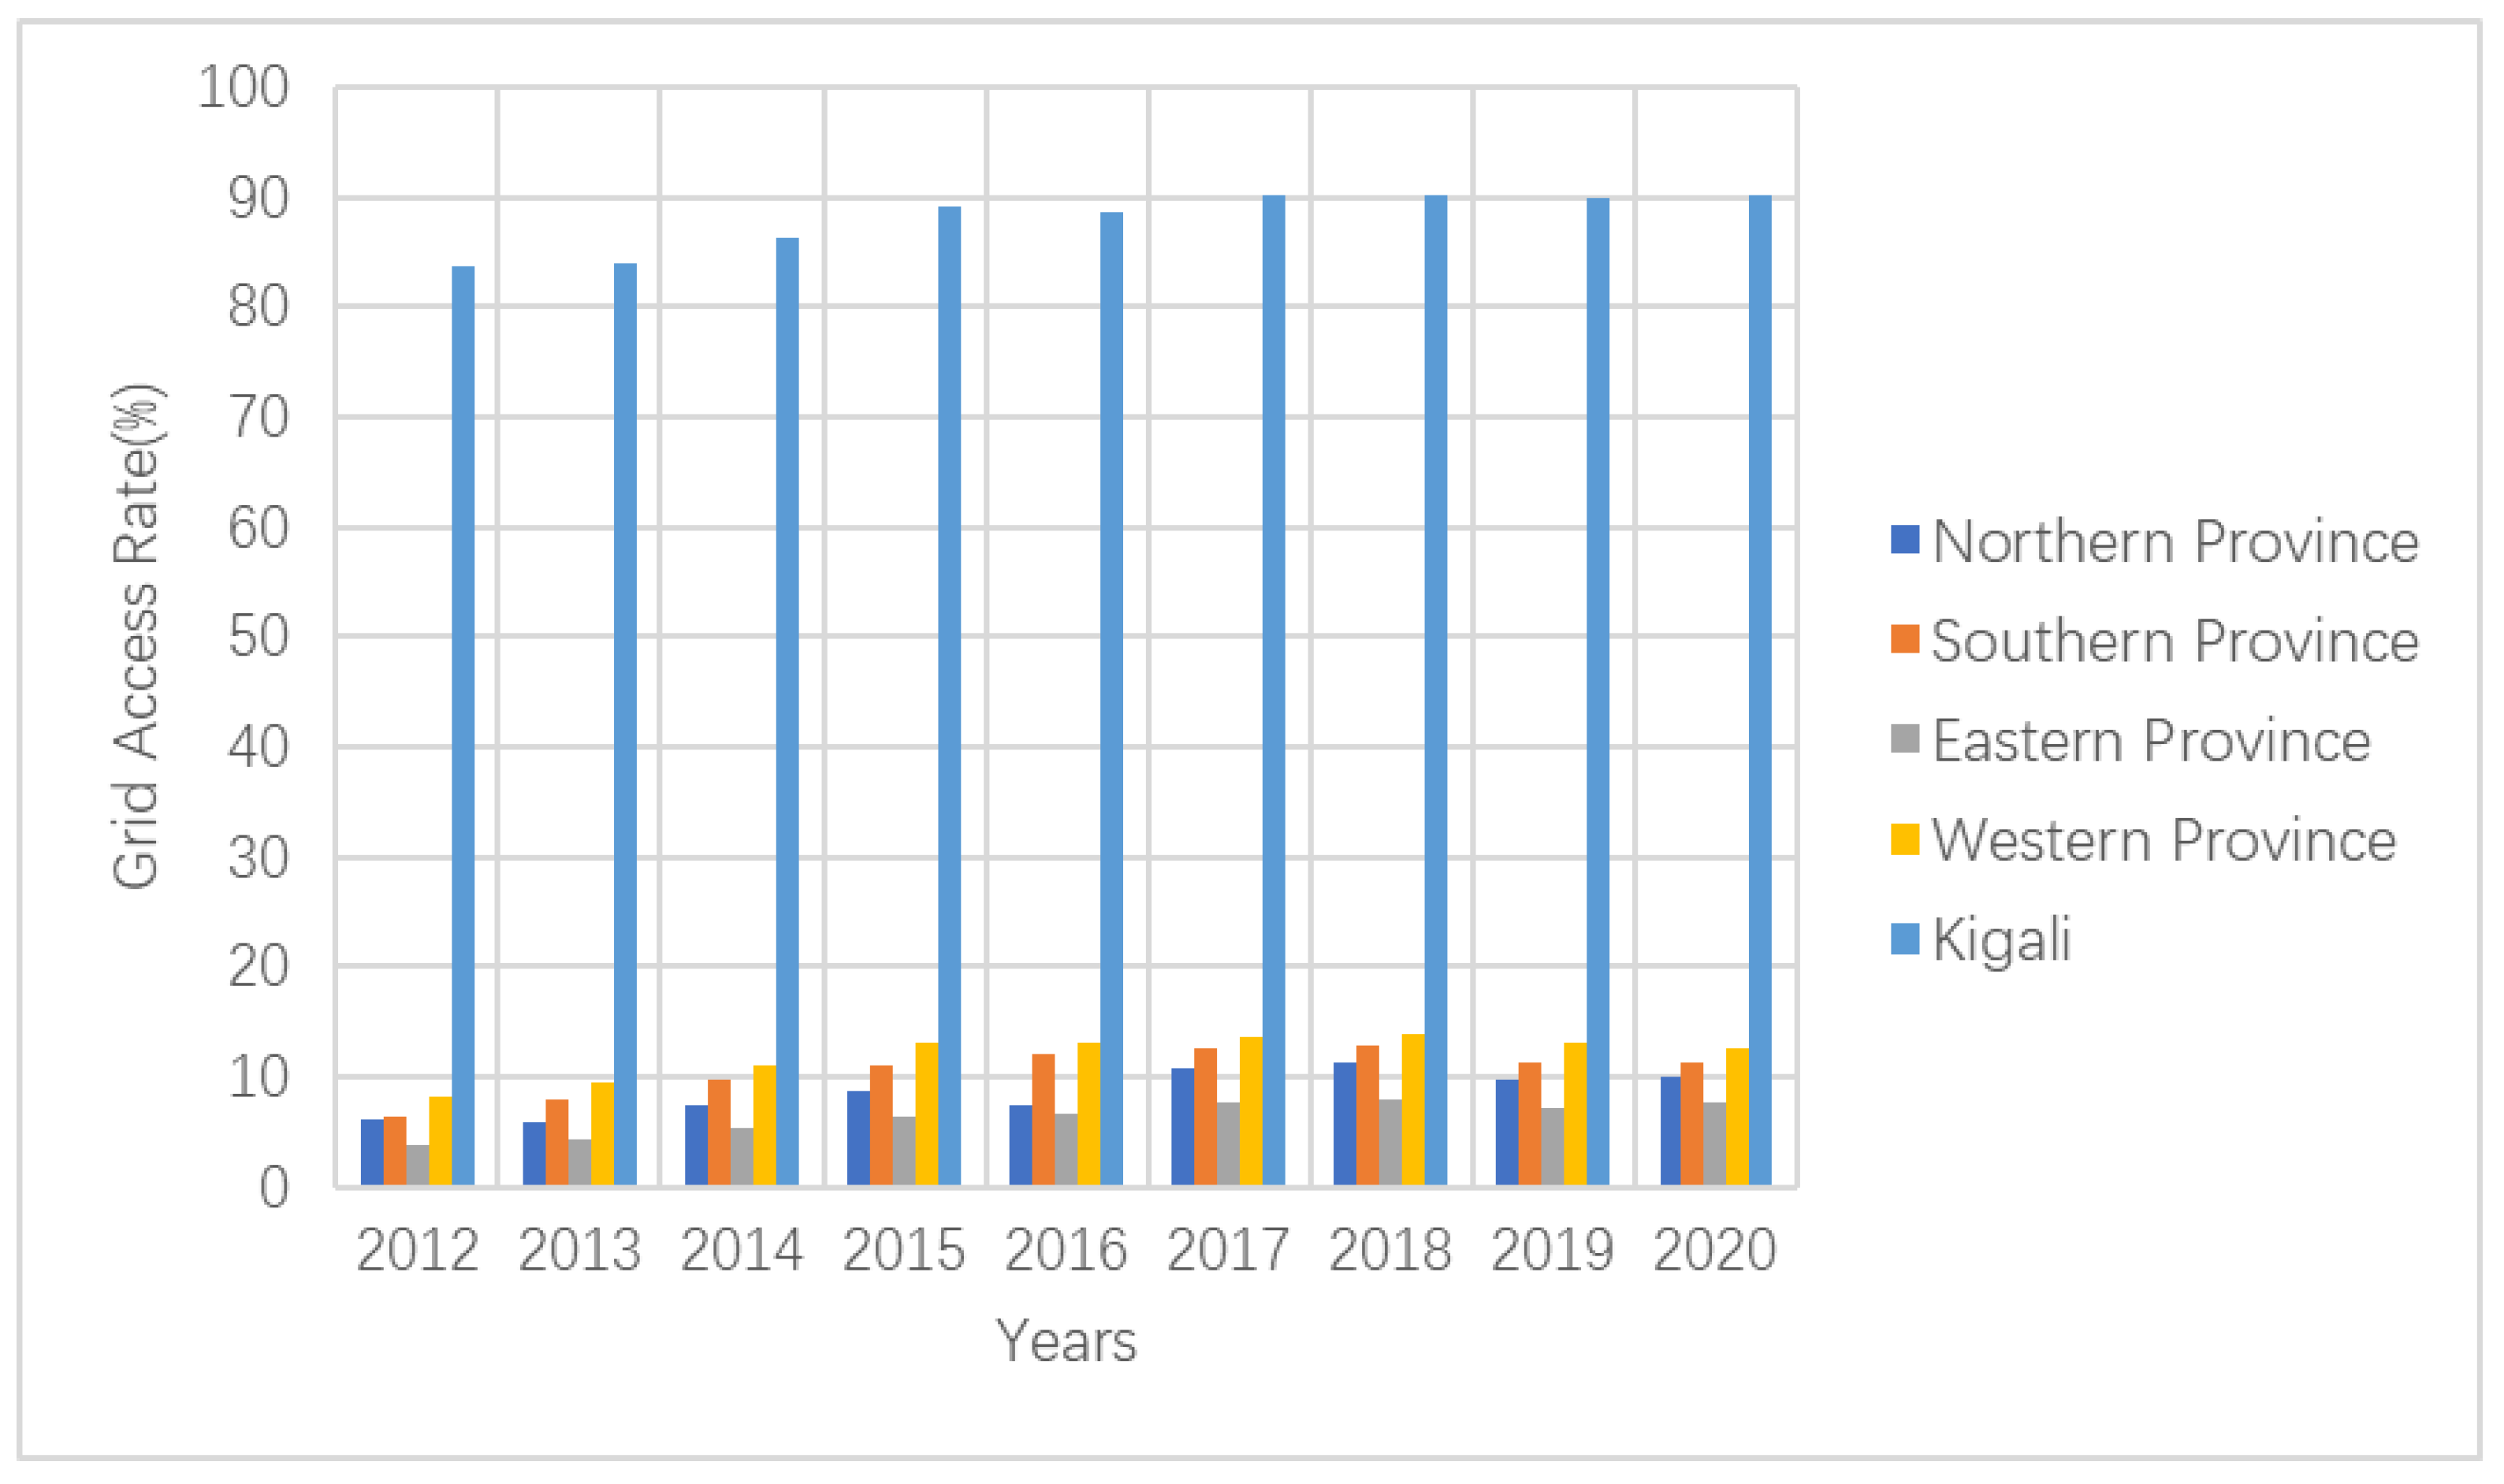
- The lit ratio of Kigali was much larger than that of the other four provinces, which reveals the serious imbalance in the electrification progress in Rwanda. The capital Kigali has a relatively high electricity infrastructure level, which can basically meet the electricity demand, while there is still a huge electricity gap in the other four provinces. In 2019, the lit ratio of Kigali was approximately 88.44%, while that of the other four provinces was below 20%.
- (1)
- The original electricity infrastructure level
- (2)
- The spatial location
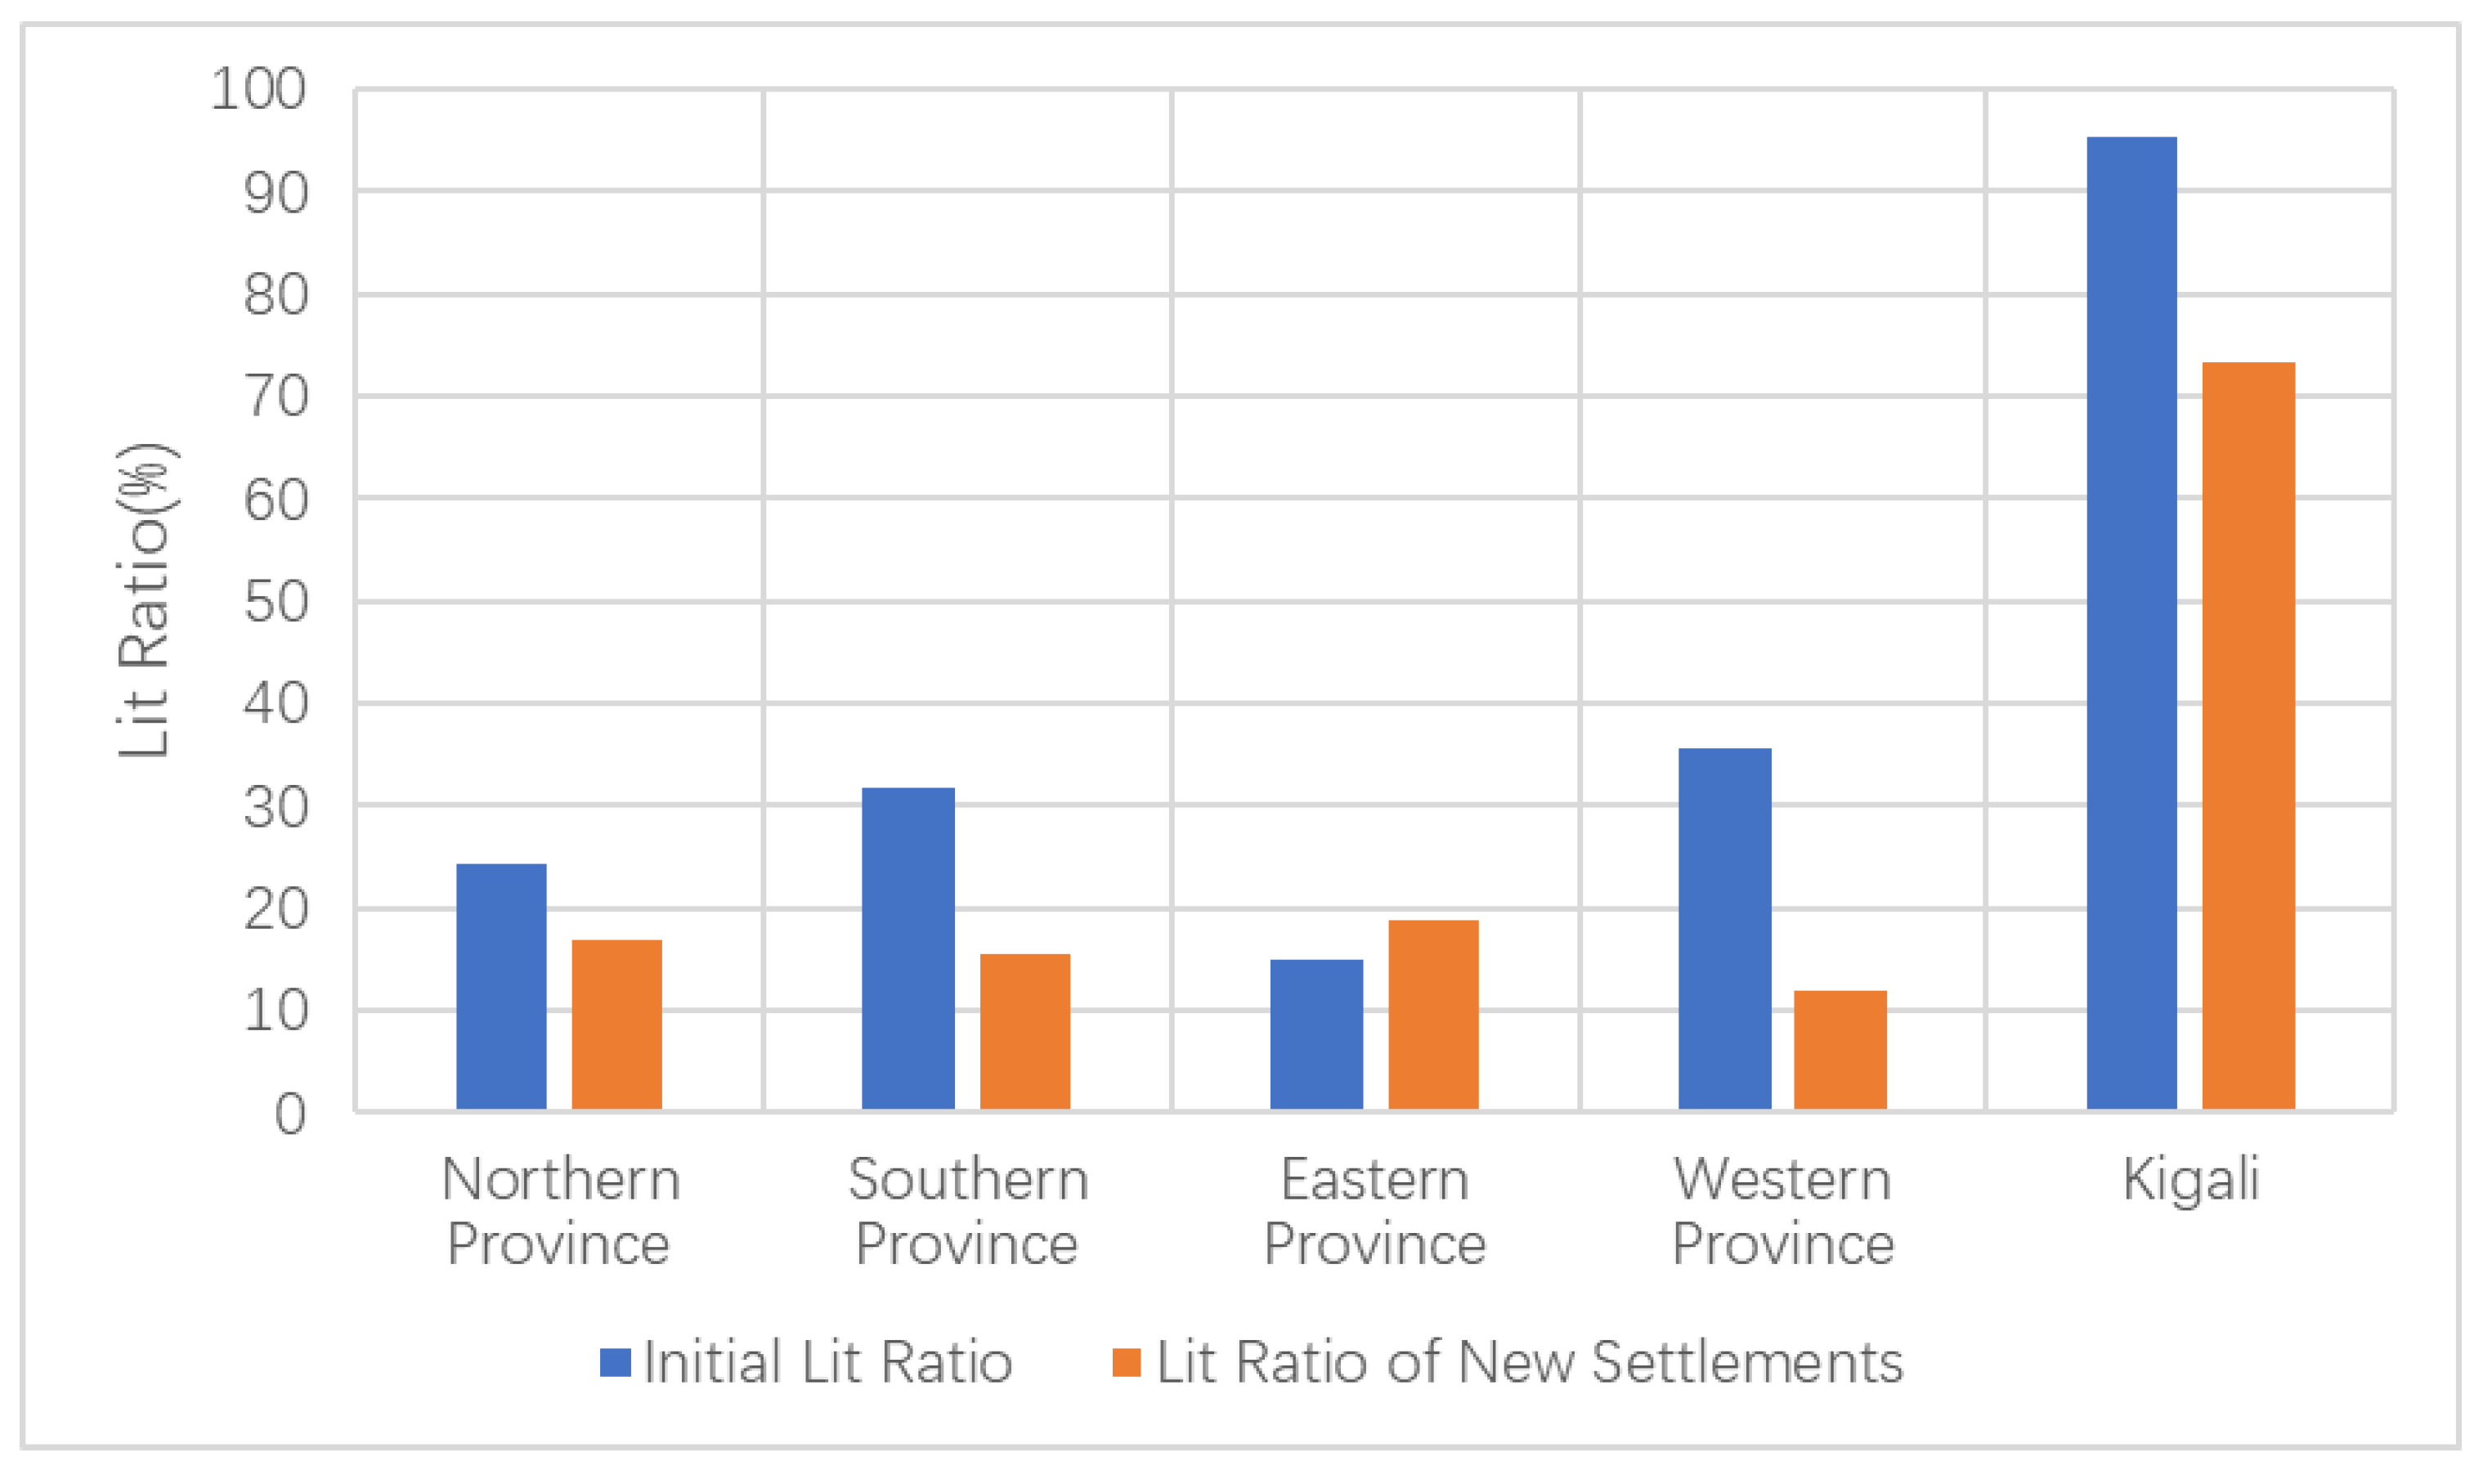
- (1)
- The change rate of the settlements outside the urban boundary was much higher than that inside the boundary, except in Eastern Province, which indicates that most of the new settlements in Rwanda are not in the urban boundary, increasing the difficulty for new settlements to achieve grid access;
- (2)
- The change rate of the settlements outside the urban boundary in Eastern Province was much lower than that in the other four provinces, which is probably conducive to it achieving extensive grid access for its new settlements;
- (3)
- The gap between the change rates of the settlements inside and outside the urban boundary in Eastern Province was small, while the change rate of the settlements outside the boundary was much higher than that inside the boundary in the other four provinces.
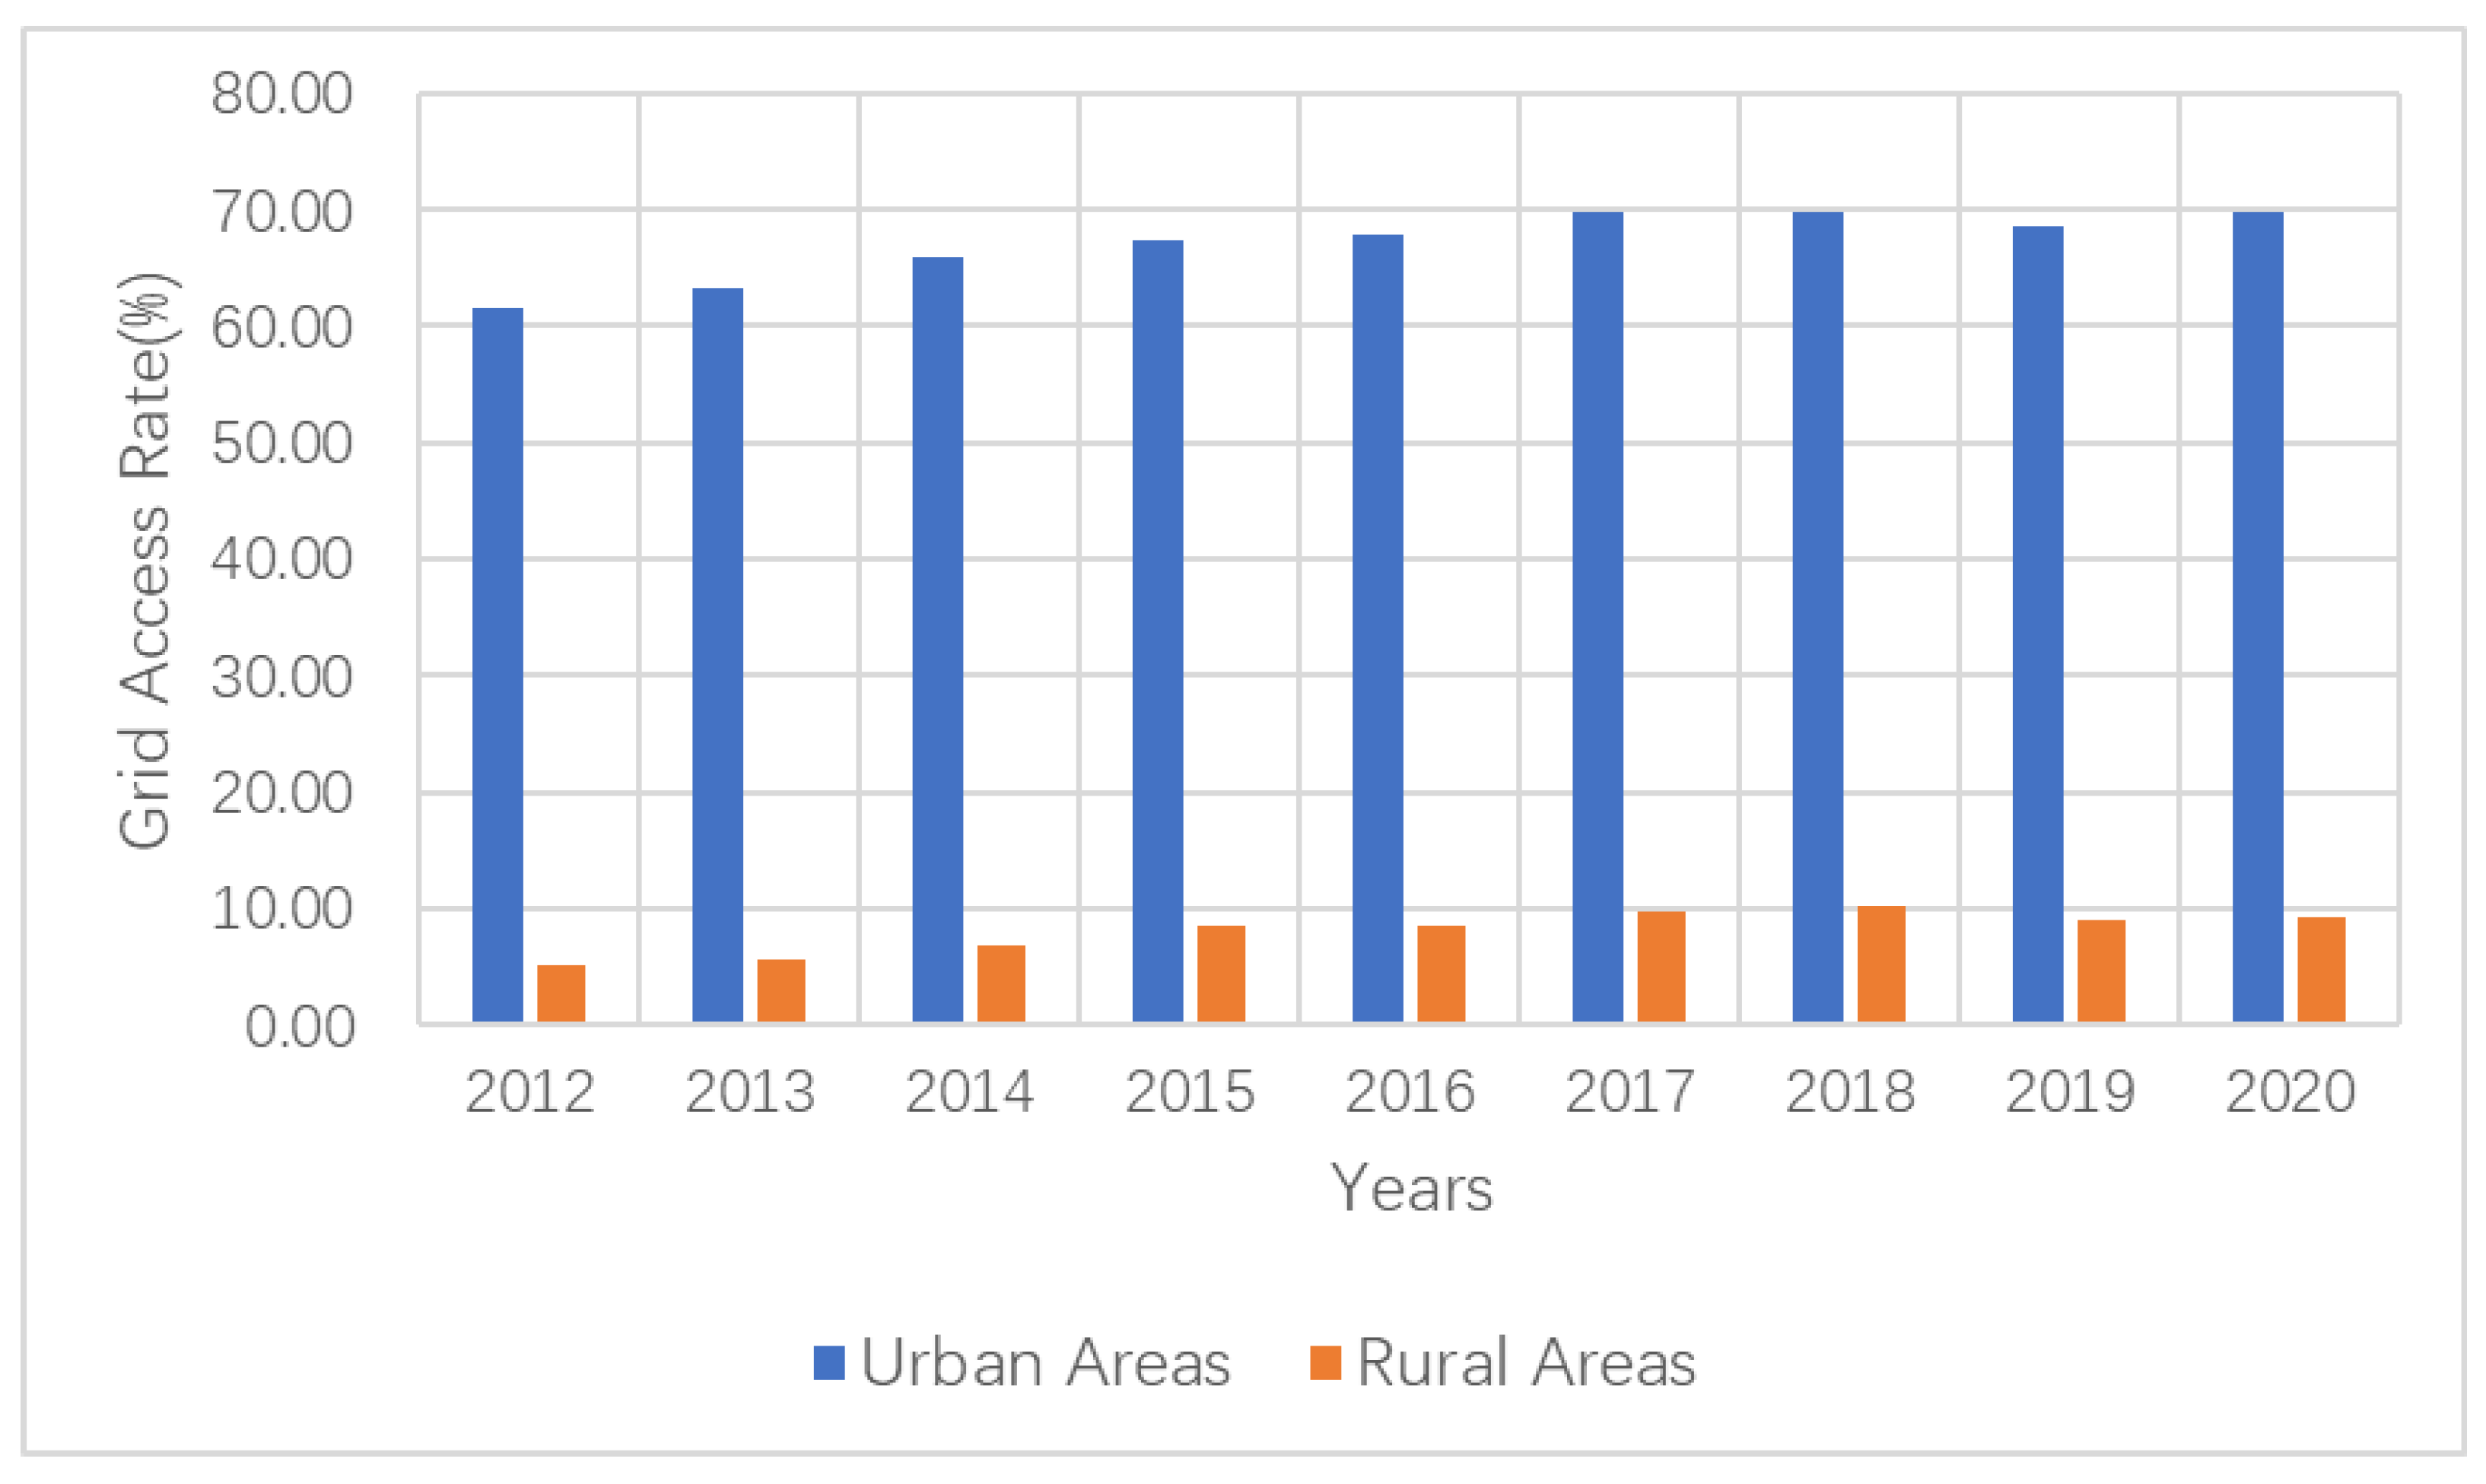
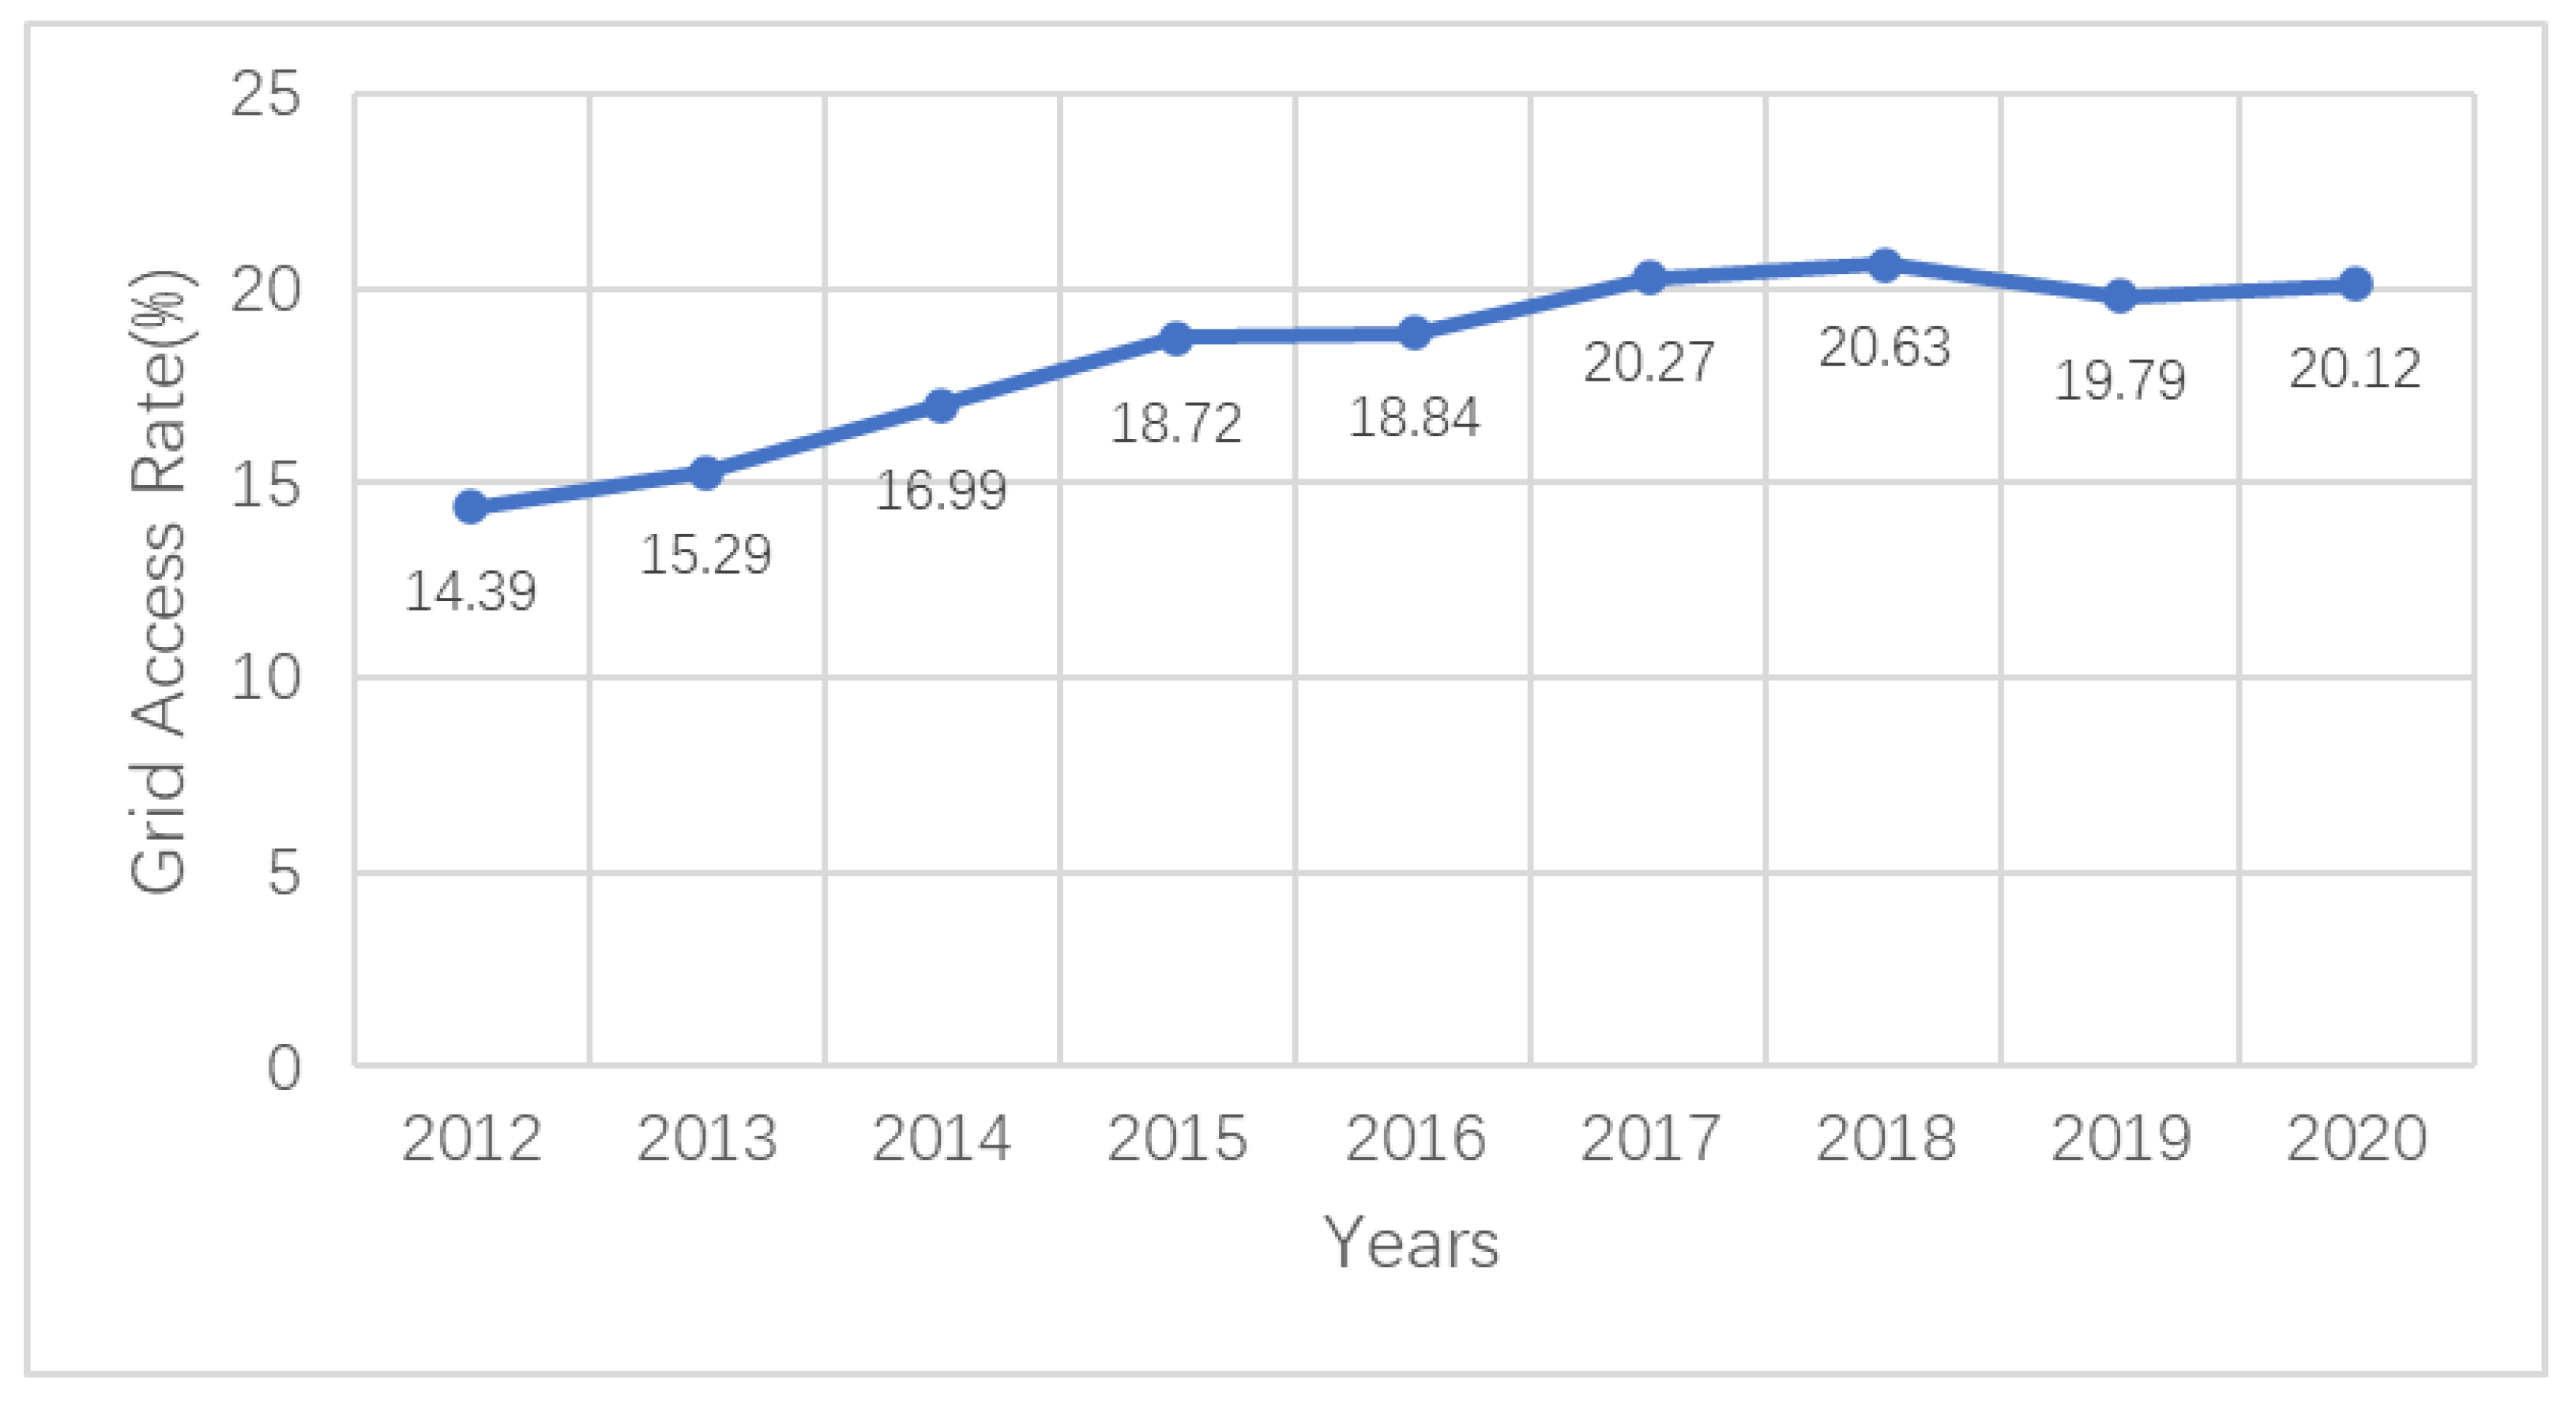
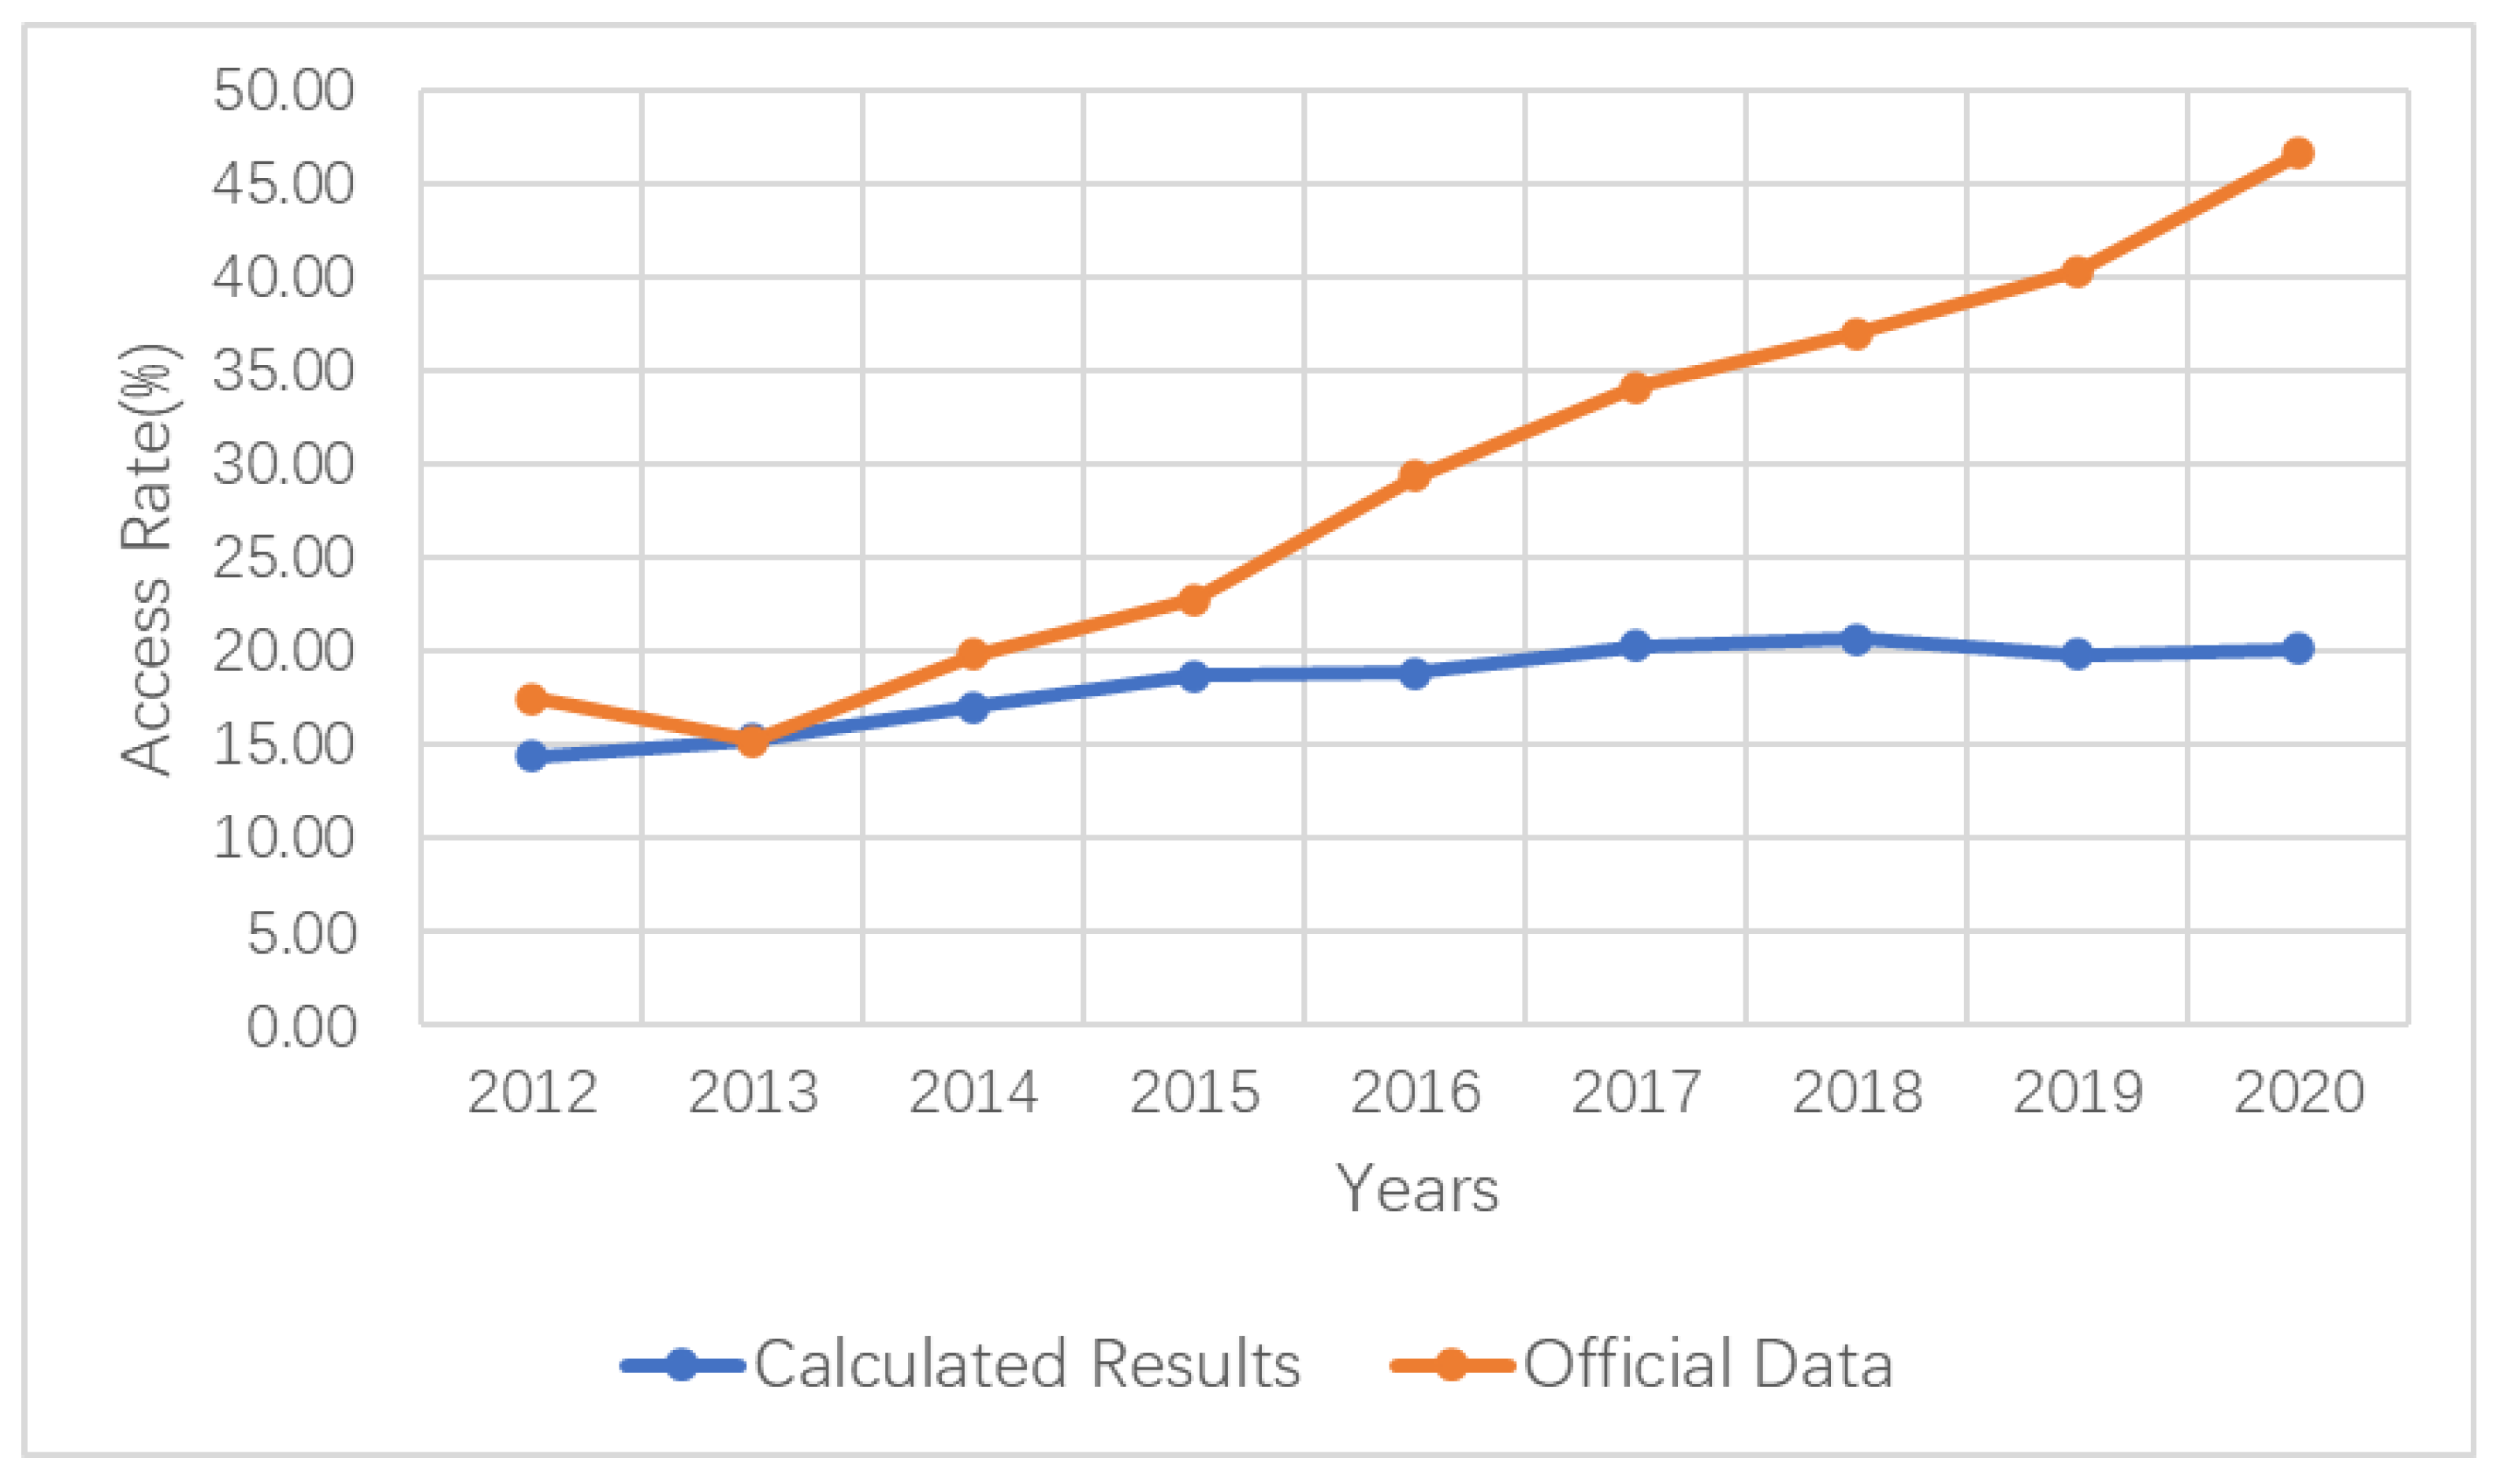
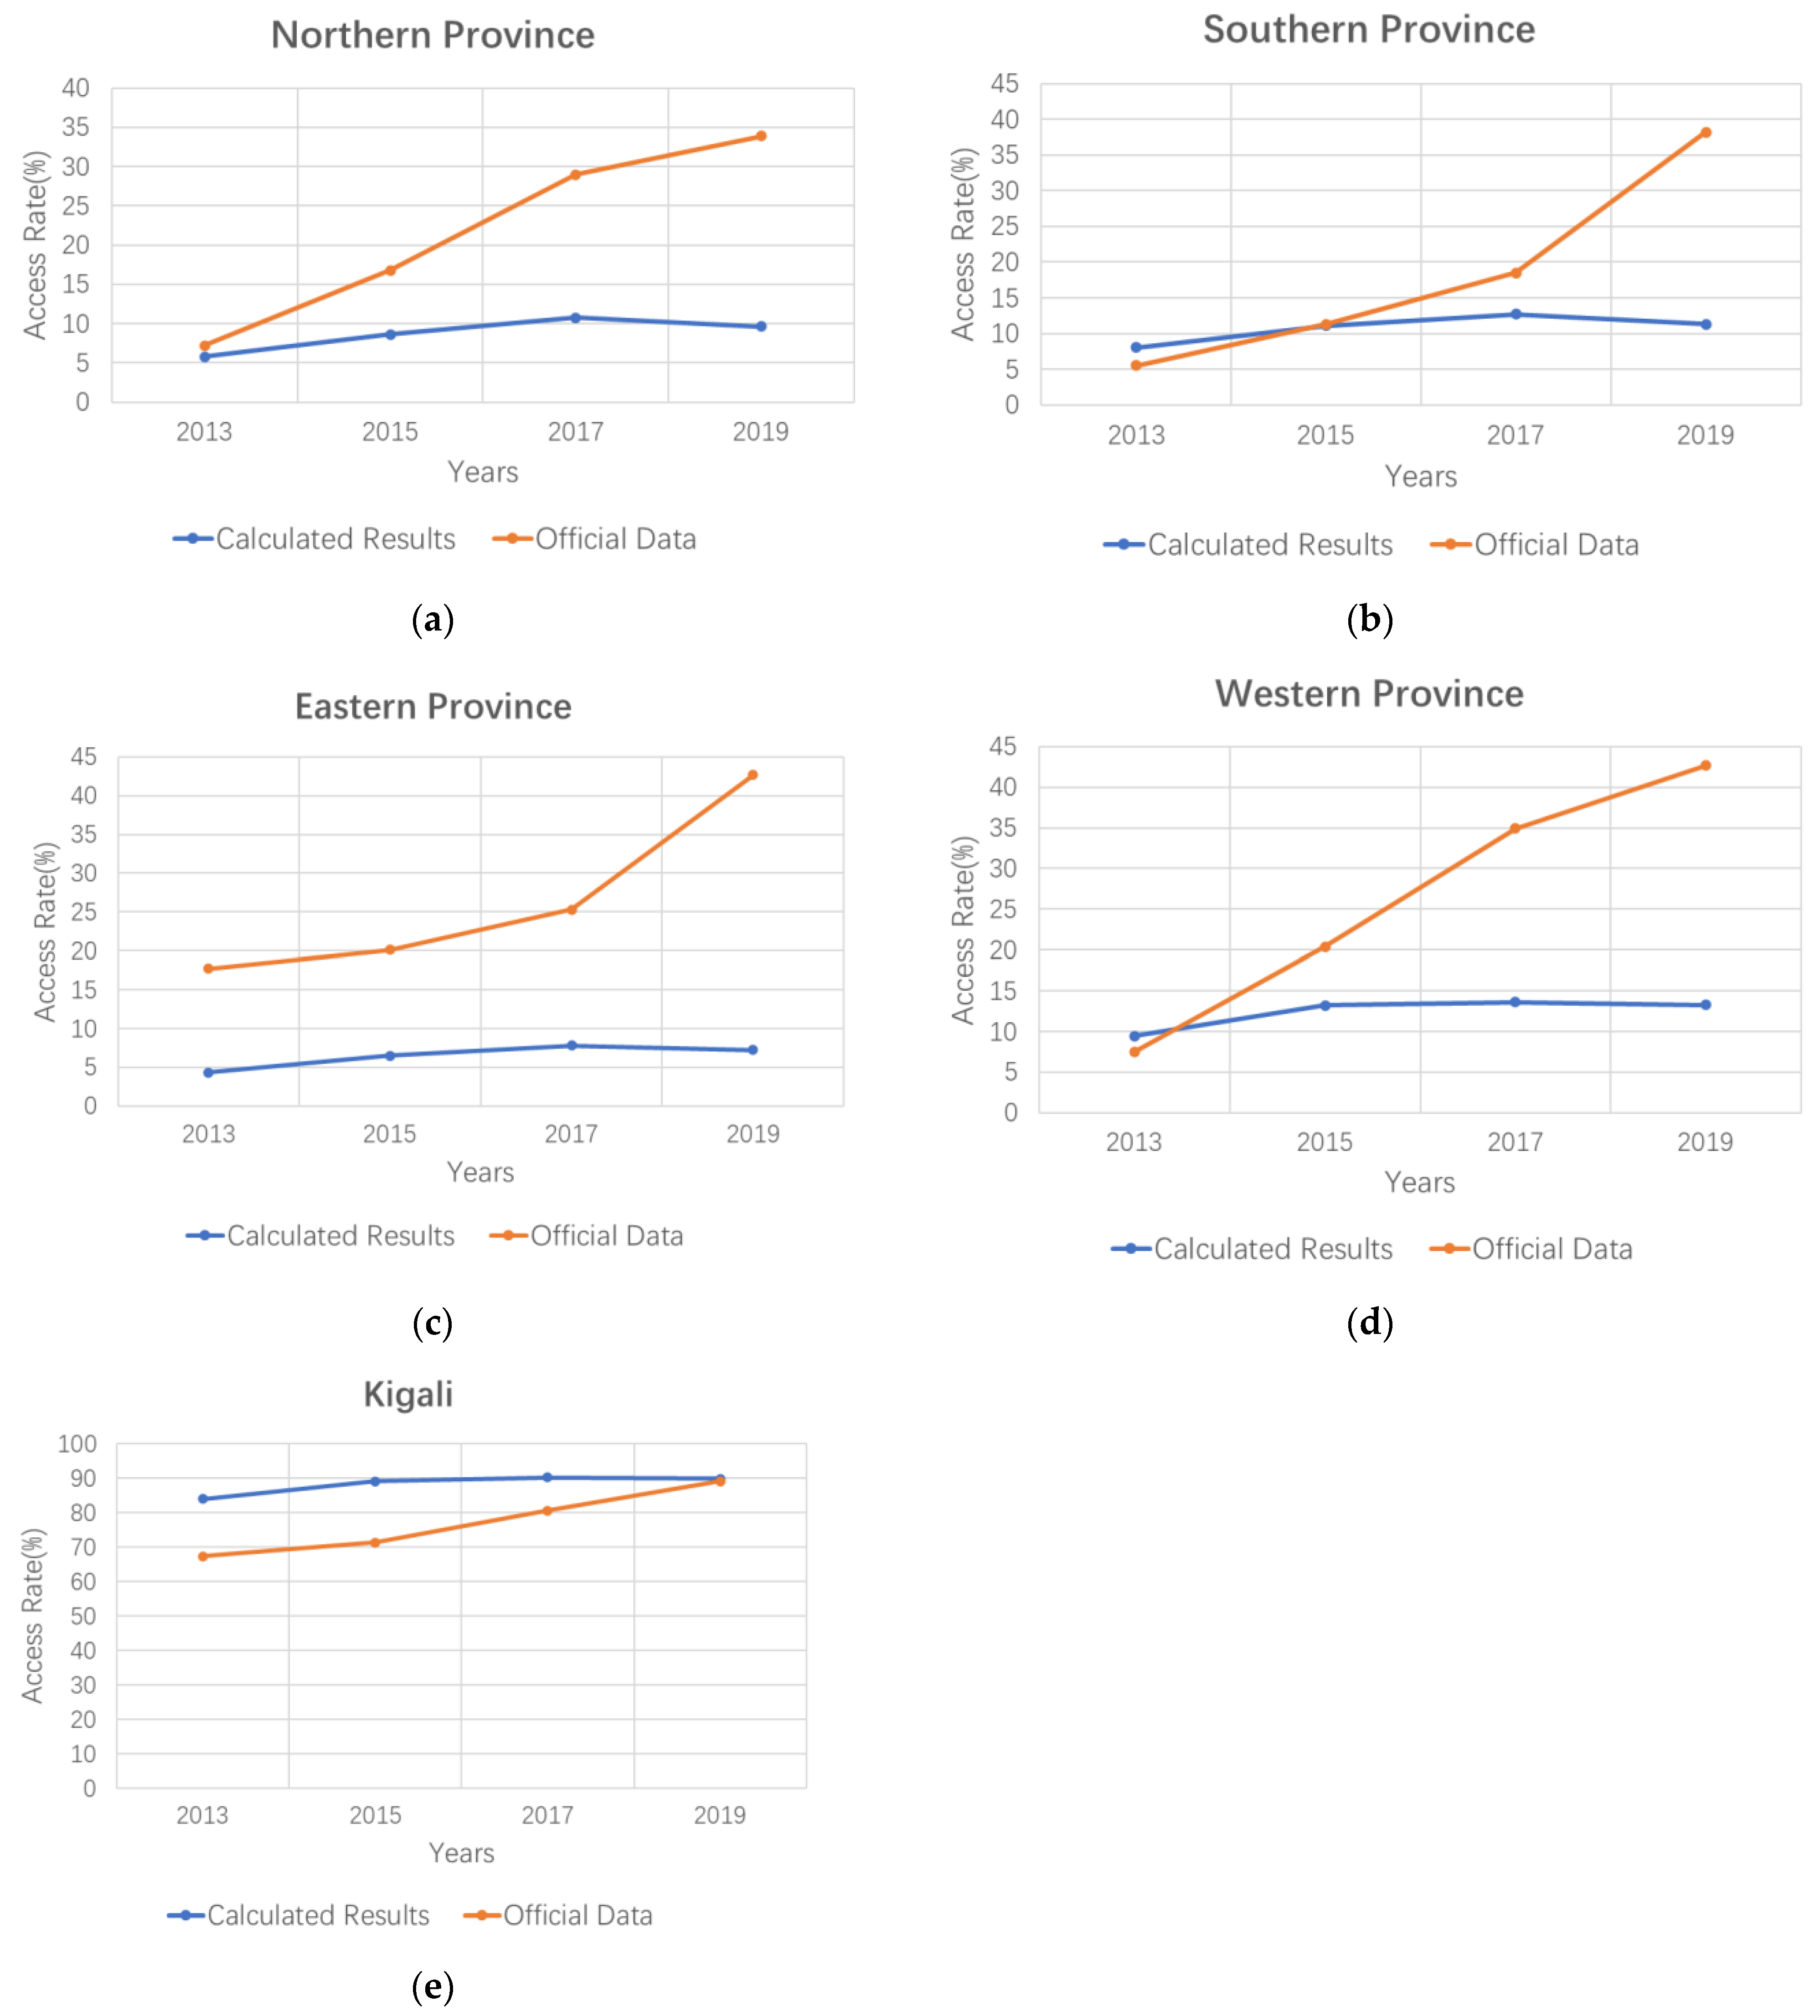
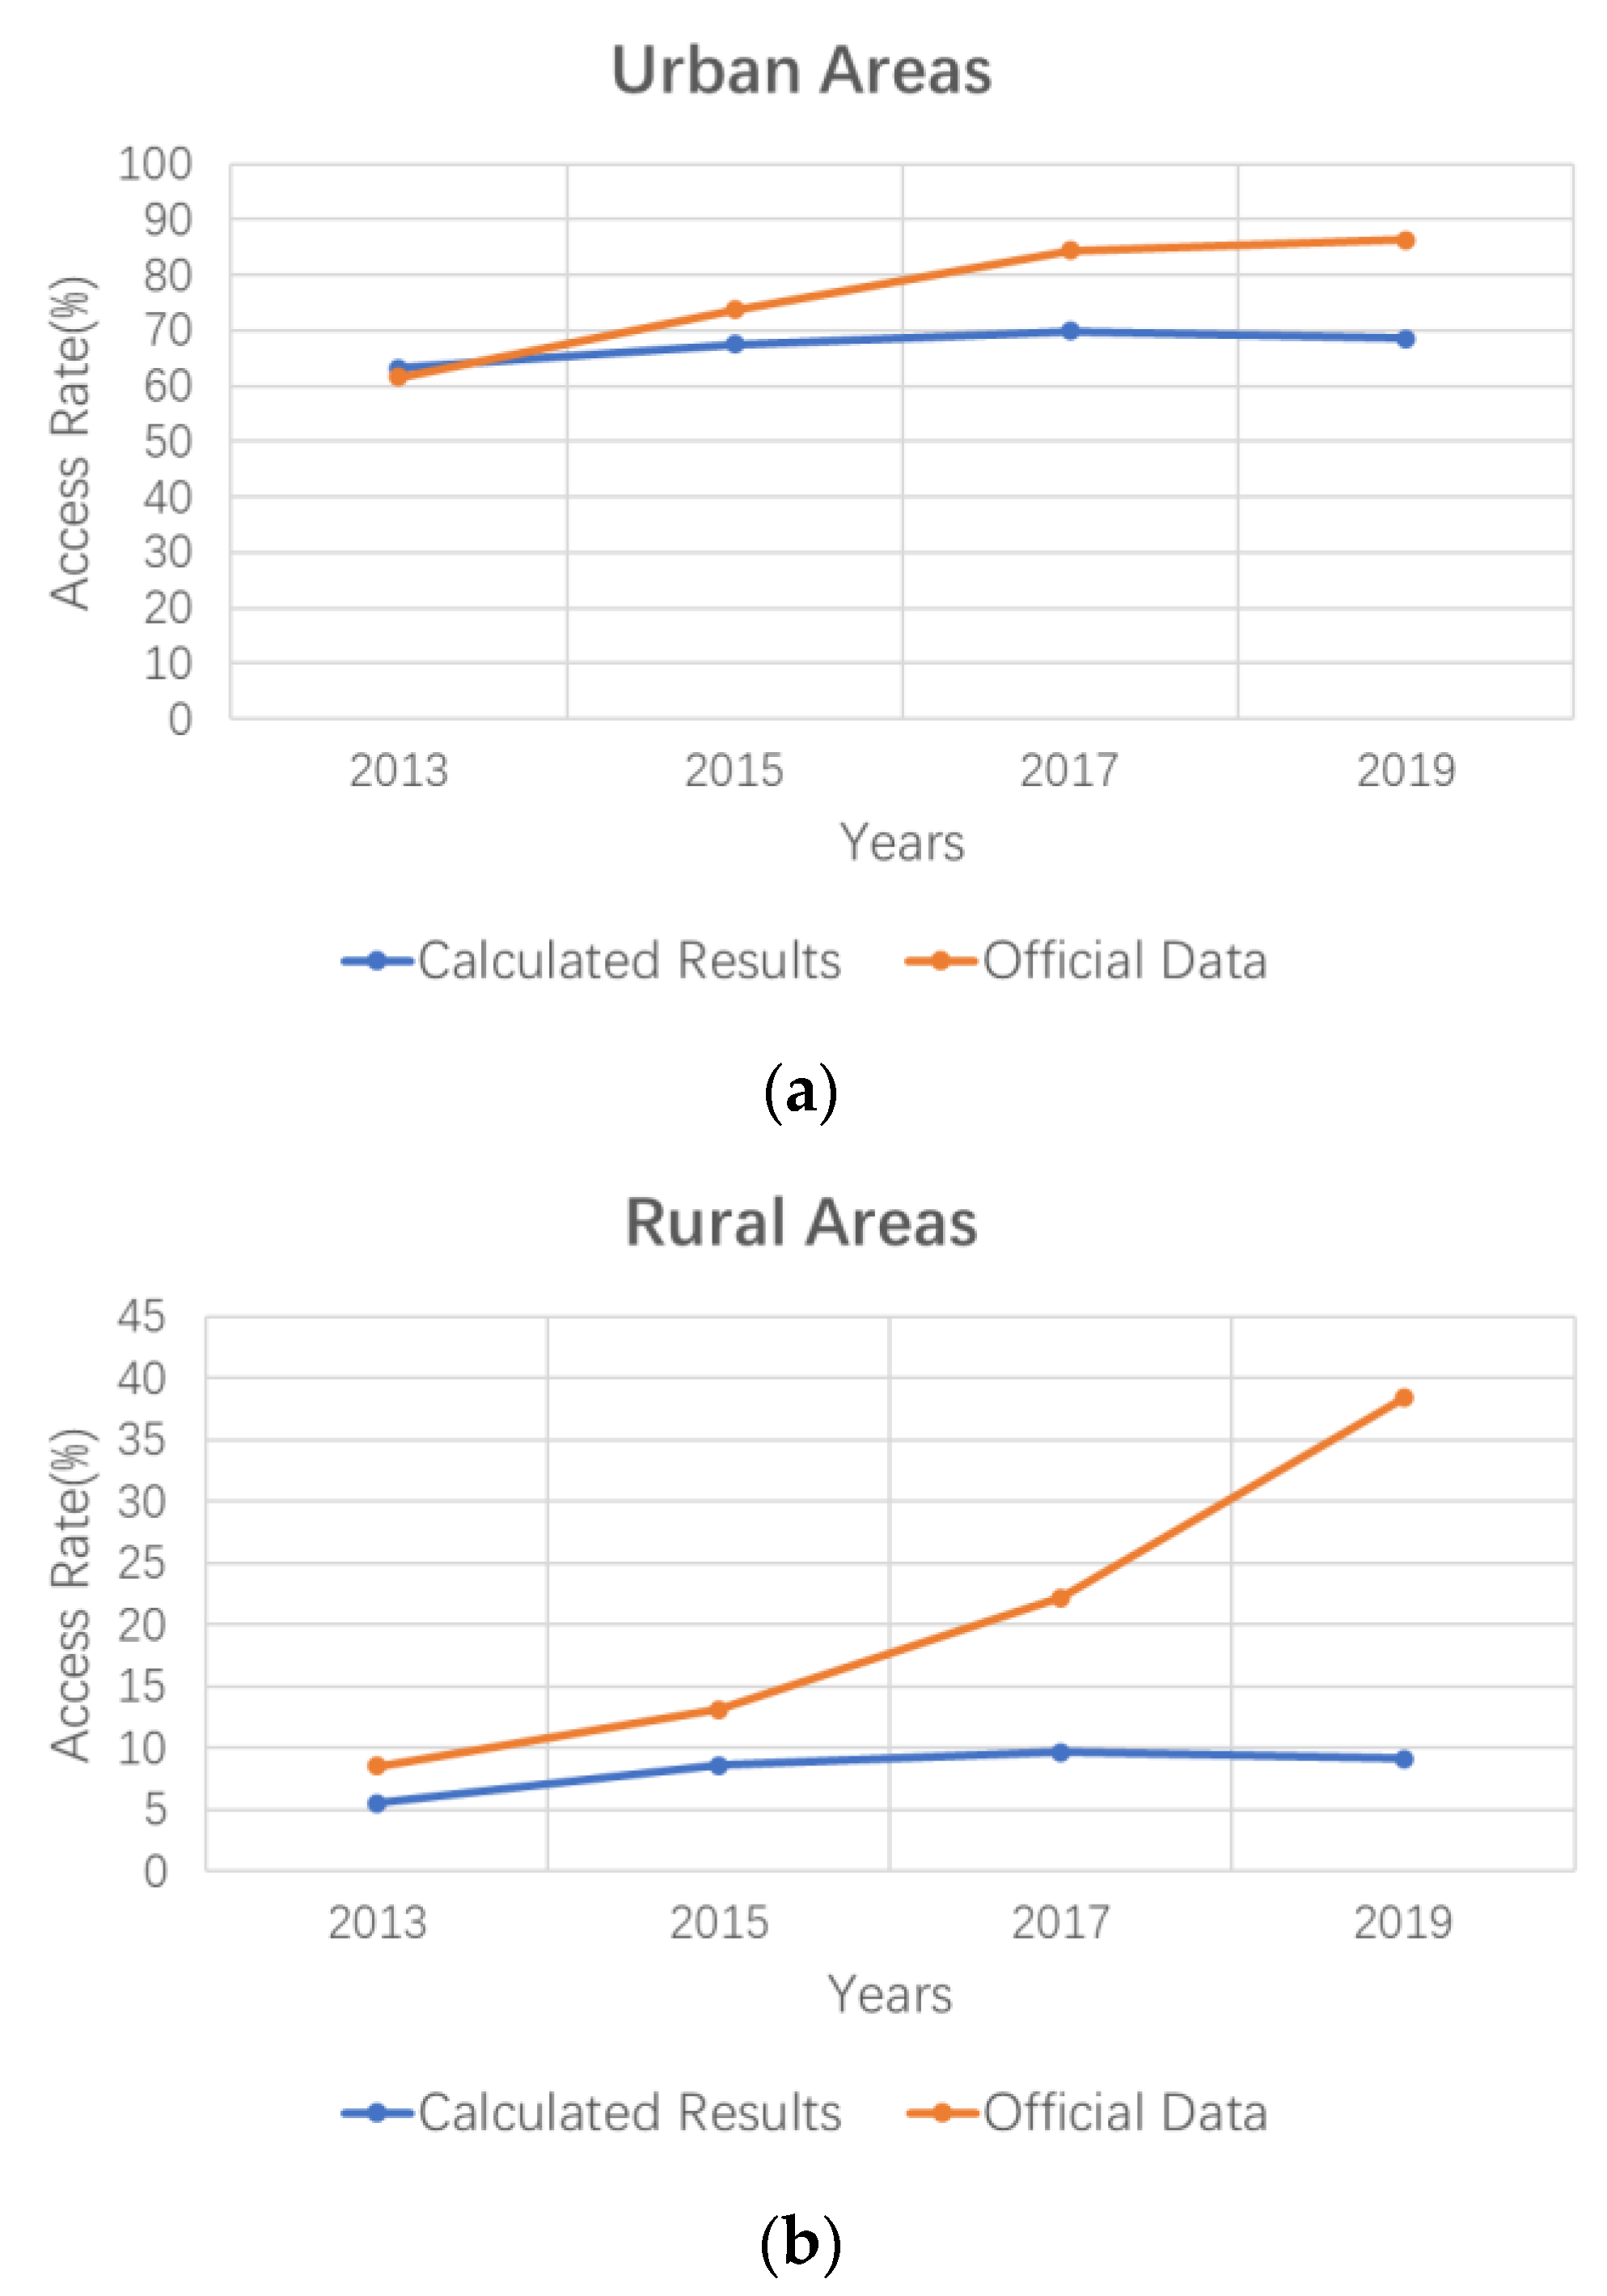
3.3. Grid Access Rates on Multi-Spatial Scales
4. Discussion
4.1. The Development of Off-Grid Access in Rwanda
4.2. The Spatial Disparity of Off-Grid Access in Rwanda
4.3. Analysis of Regional Disparity in Electrification
- (1)
- Different study purpose: Our study aimed to track the electrification progress in Rwanda at multi-spatial scales and analyze the disparity in electrification among different provinces as well as between urban and rural areas. Most of the previous studies aimed to develop an index to reflect the disparity within the region;
- (2)
- Different study methods: Our study analyzed the regional disparity in electrification in Rwanda by data comparison instead of by developing an index. For example, we evaluated the disparity in electrification by calculating and comparing the lit ratio and the grid access rate at the provincial level. In this study, it was not suitable or possible to use NLDI like the previous studies mentioned above did to analyze disparity in electrification on multi-spatial scales;
- (3)
- Multi-dimension analysis: Our study analyzed the regional disparity in electrification on multiple dimensions by using NTL imagery and ancillary data. For example, we analyzed the disparity in the electrification of settlements as well as the disparity in grid access rates. The previous studies mentioned above usually only analyzed the regional disparity in one dimension. Our study further expanded the research dimensions of regional disparity and more comprehensively evaluated the imbalance.
4.4. Limitation and Future Work
5. Conclusions
Author Contributions
Funding
Data Availability Statement
Acknowledgments
Conflicts of Interest
References
- Ministry of Infrastructure, Republic of Rwanda. Rural Electrification Strategy; Ministry of Infrastructure, Republic of Rwanda: Kigali, Rwanda, 2016.
- Niyigena, J.B.; Yongli, W. Off-grid solar market in Rwanda: Integrated SWOT analysis. In Proceedings of the 2021 International Conference on Electrical, Computer and Energy Technologies (ICECET), Cape Town, South Africa, 9–10 December 2021; pp. 1–6. [Google Scholar]
- The World Bank. World Development Indicators for Rwanda. Available online: https://data.worldbank.org/country/rwanda?view=chart (accessed on 18 July 2022).
- IEA; IRENA; UNSD; WB; WHO. Tracking SDG7: The Energy Progress Report 2019. Available online: http://trackingsdg7.esmap.org/ (accessed on 18 July 2022).
- Chen, X.; Nordhaus, W. A test of the new VIIRS lights data set: Population and economic output in Africa. Remote Sens. 2015, 7, 4937–4947. [Google Scholar] [CrossRef]
- Falchetta, G.; Pachauri, S.; Byers, E.; Danylo, O.; Parkinson, S.C. Satellite Observations Reveal Inequalities in the Progress and Effectiveness of Recent Electrification in Sub-Saharan Africa. One Earth 2020, 2, 364–379. [Google Scholar] [CrossRef]
- Elvidge, C.D.; Baugh, K.E.; Kihn, E.A.; Kroehl, H.W.; Davis, E.R.; Davis, C.W. Relation between satellite observed visible-near infrared emissions, population, economic activity and electric power consumption. Int. J. Remote Sens. 2010, 18, 1373–1379. [Google Scholar] [CrossRef]
- Li, D.; Li, X. Applications of night-time light remote sensing in evaluating of socioeconomic development. J. Macro-Qual. Res 2015, 3, 1–8. [Google Scholar]
- Rybnikova, N.A.; Portnov, B.A. Mapping geographical concentrations of economic activities in Europe using light at night (LAN) satellite data. Int. J. Remote Sens. 2014, 35, 7706–7725. [Google Scholar] [CrossRef]
- Doll, C.H.; Muller, J.-P.; Elvidge, C.D. Night-time imagery as a tool for global mapping of socioeconomic parameters and greenhouse gas emissions. AMBIO J. Hum. Environ. 2000, 29, 157–162. [Google Scholar] [CrossRef]
- Song, G.; Yu, M.; Liu, S.; Zhang, S. A dynamic model for population mapping: A methodology integrating a Monte Carlo simulation with vegetation-adjusted night-time light images. Int. J. Remote Sens. 2015, 36, 4054–4068. [Google Scholar] [CrossRef]
- Sutton, P.; Roberts, D.; Elvidge, C.; Baugh, K. Census from Heaven: An estimate of the global human population using night-time satellite imagery. Int. J. Remote Sens. 2010, 22, 3061–3076. [Google Scholar] [CrossRef]
- Elvidge, C.D.; Tuttle, B.T.; Sutton, P.S.; Baugh, K.E.; Howard, A.T.; Milesi, C.; Bhaduri, B.L.; Nemani, R. Global distribution and density of constructed impervious surfaces. Sensors 2007, 7, 1962–1979. [Google Scholar] [CrossRef]
- Chen, Z.; Yu, B.; Hu, Y.; Huang, C.; Shi, K.; Wu, J. Estimating House Vacancy Rate in Metropolitan Areas Using NPP-VIIRS Nighttime Light Composite Data. IEEE J. Sel. Top. Appl. Earth Obs. Remote Sens. 2015, 8, 2188–2197. [Google Scholar] [CrossRef]
- Cao, X.; Chen, J.; Imura, H.; Higashi, O. A SVM-based method to extract urban areas from DMSP-OLS and SPOT VGT data. Remote Sens. Environ. 2009, 113, 2205–2209. [Google Scholar] [CrossRef]
- Chen, Z.; Yu, B.; Song, W.; Liu, H.; Wu, Q.; Shi, K.; Wu, J. A new approach for detecting urban centers and their spatial structure with nighttime light remote sensing. IEEE Trans. Geosci. Remote Sens. 2017, 55, 6305–6319. [Google Scholar] [CrossRef]
- Hsu, F.-C.; Elvidge, C.D.; Matsuno, Y. Exploring and estimating in-use steel stocks in civil engineering and buildings from night-time lights. Int. J. Remote Sens. 2013, 34, 490–504. [Google Scholar] [CrossRef]
- Ma, T.; Zhou, Y.; Zhou, C.; Haynie, S.; Pei, T.; Xu, T. Night-time light derived estimation of spatio-temporal characteristics of urbanization dynamics using DMSP/OLS satellite data. Remote Sens. Environ. 2015, 158, 453–464. [Google Scholar] [CrossRef]
- Taoyang, W.; Guo, Z.; Peiran, L.; Fangting, L.; Xueyao, G. Analysis on the driving factors of urban expansion policy based on DMSP/OLS remote Sensing image. Acta Geod. Cartogr. Sin. 2018, 47, 1466. [Google Scholar]
- Chen, X.; Nordhaus, W.D. Using luminosity data as a proxy for economic statistics. Proc. Natl. Acad. Sci. USA 2011, 108, 8589–8594. [Google Scholar] [CrossRef]
- Shi, K.; Yu, B.; Huang, Y.; Hu, Y.; Yin, B.; Chen, Z.; Chen, L.; Wu, J. Evaluating the Ability of NPP-VIIRS Nighttime Light Data to Estimate the Gross Domestic Product and the Electric Power Consumption of China at Multiple Scales: A Comparison with DMSP-OLS Data. Remote Sens. 2014, 6, 1705–1724. [Google Scholar] [CrossRef]
- Zhao, N.; Ghosh, T.; Samson, E.L. Mapping spatio-temporal changes of Chinese electric power consumption using night-time imagery. Int. J. Remote Sens. 2012, 33, 6304–6320. [Google Scholar] [CrossRef]
- Chand, T.R.K.; Badarinath, K.V.S.; Elvidge, C.D.; Tuttle, B.T. Spatial characterization of electrical power consumption patterns over India using temporal DMSP-OLS night-time satellite data. Int. J. Remote Sens. 2009, 30, 647–661. [Google Scholar] [CrossRef]
- Filho, C.R.D.S.; Zullo, J., Jr.; Elvidge, C. Brazil’s 2001 energy crisis monitored from space. Int. J. Remote Sens. 2010, 25, 2475–2482. [Google Scholar] [CrossRef]
- Min, B.; Gaba, K. Tracking Electrification in Vietnam Using Nighttime Lights. Remote Sens. 2014, 6, 9511–9529. [Google Scholar] [CrossRef]
- Wang, X.; Rafa, M.; Moyer, J.D.; Li, J.; Scheer, J.; Sutton, P. Estimation and mapping of sub-national GDP in Uganda using NPP-VIIRS imagery. Remote Sens. 2019, 11, 163. [Google Scholar] [CrossRef] [Green Version]
- Min, B.; Gaba, K.M.; Sarr, O.F.; Agalassou, A. Detection of rural electrification in Africa using DMSP-OLS night lights imagery. Int. J. Remote Sens. 2013, 34, 8118–8141. [Google Scholar] [CrossRef]
- Falchetta, G.; Pachauri, S.; Parkinson, S.; Byers, E. A high-resolution gridded dataset to assess electrification in sub-Saharan Africa. Sci Data 2019, 6, 110. [Google Scholar] [CrossRef]
- Singhal, A.; Sahu, S.; Chattopadhyay, S.; Mukherjee, A.; Bhanja, S.N. Using night time lights to find regional inequality in India and its relationship with economic development. PLoS ONE 2020, 15, e0241907. [Google Scholar] [CrossRef]
- Elvidge, C.D.; Baugh, K.E.; Anderson, S.; Sutton, P.C.; Ghosh, T. The Night Light Development Index (NLDI): A spatially explicit measure of human development from satellite data. Soc. Geogr. 2012, 7, 23–35. [Google Scholar] [CrossRef]
- Ghosh, T.; Anderson, S.; Elvidge, C.D.; Sutton, P.C. Using Nighttime Satellite Imagery as a Proxy Measure of Human Well-Being. Sustainability 2013, 5, 4988–5019. [Google Scholar] [CrossRef]
- Xu, H.; Yang, H.; Li, X.; Jin, H.; Li, D. Multi-Scale Measurement of Regional Inequality in Mainland China during 2005-2010 Using DMSP/OLS Night Light Imagery and Population Density Grid Data. Sustainability 2015, 7, 13469–13499. [Google Scholar] [CrossRef]
- Chaurey, A.; Ranganathan, M.; Mohanty, P. Electricity access for geographically disadvantaged rural communities—Technology and policy insights. Energy Policy 2004, 32, 1693–1705. [Google Scholar] [CrossRef]
- Khan, H.A.; Ahmad, H.F.; Nasir, M.; Nadeem, M.F.; Zaffar, N.A. Decentralised electric power delivery for rural electrification in Pakistan. Energy Policy 2018, 120, 312–323. [Google Scholar] [CrossRef]
- Odou, O.D.T.; Bhandari, R.; Adamou, R. Hybrid off-grid renewable power system for sustainable rural electrification in Benin. Renew. Energy 2020, 145, 1266–1279. [Google Scholar] [CrossRef]
- Ouedraogo, B.I.; Kouame, S.; Azoumah, Y.; Yamegueu, D. Incentives for rural off grid electrification in Burkina Faso using LCOE. Renew. Energy 2015, 78, 573–582. [Google Scholar] [CrossRef]
- Yang, F.; Yang, M. Rural electrification in sub-Saharan Africa with innovative energy policy and new financing models. Mitig. Adapt. Strateg. Glob. Chang. 2018, 23, 933–952. [Google Scholar] [CrossRef]
- Bhattacharyya, S.C. Renewable energies and the poor: Niche or nexus? Energy Policy 2006, 34, 659–663. [Google Scholar] [CrossRef]
- Al-Ismaily, H.A.; Probert, D. Photovoltaic electricity prospects in Oman. Appl. Energy 1998, 59, 97–124. [Google Scholar] [CrossRef]
- Román, M.O.; Wang, Z.; Sun, Q.; Kalb, V.; Miller, S.D.; Molthan, A.; Schultz, L.; Bell, J.; Stokes, E.C.; Pandey, B.; et al. NASA’s Black Marble nighttime lights product suite. Remote Sens. Environ. 2018, 210, 113–143. [Google Scholar] [CrossRef]
- Wang, Z.; Román, M.; Sun, Q.; Molthan, A.; Schultz, L.; Kalb, V. Monitoring disaster-related power outages using NASA black marble nighttime light product. ISPRS Int. Arch. Photogramm. Remote Sens. Spat. Inf. Sci 2018, 2018, 1853–1856. [Google Scholar] [CrossRef]
- Zhang, X.; Gibson, J. Using Multi-Source Nighttime Lights Data to Proxy for County-Level Economic Activity in China from 2012 to 2019. Remote Sens. 2022, 14, 1282. [Google Scholar] [CrossRef]
- Stokes, E.C.; Roman, M.O.; Wang, Z.; Shrethsa, R.M.; Yao, T.; Kalb, G. Urban Applications of Nasa’s Black Marble Product Suite. In Proceedings of the 2019 Joint Urban Remote Sensing Event (JURSE), Vannes, France, 22–24 May 2019. [Google Scholar]
- Román, M.O.; Wang, Z.; Shrestha, R.; Yao, T.; Kalb, V. Black Marble User Guide Version 1.2; NASA: Washington, DC, USA, 2021. [Google Scholar]
- National Aeronautics and Space Administration. VNP46A4—VIIRS/NPP Lunar BRDF-Adjusted Nighttime Lights Yearly L3 Global 15 Arc Second Linear Lat Lon Grid. Available online: https://ladsweb.modaps.eosdis.nasa.gov/missions-and-measurements/products/VNP46A4/ (accessed on 18 July 2022).
- Zheng, Q.; Weng, Q.; Zhou, Y.; Dong, B. Impact of temporal compositing on nighttime light data and its applications. Remote Sens. Environ. 2022, 274, 113016. [Google Scholar] [CrossRef]
- Pesaresi, M.; Syrris, V.; Julea, A. A new method for earth observation data analytics based on symbolic machine learning. Remote Sens. 2016, 8, 399. [Google Scholar] [CrossRef]
- European Commision; Statistical Office of the European Union. Applying the Degree of Urbanisation: A Methodological Manual to Define Cities, Towns and Rural Areas for International Comparisons; Publications Office of the European Union: Strasbourg, France, 2021.
- The World Bank. The World Bank: What We Do. Available online: https://www.worldbank.org/en/what-we-do (accessed on 18 July 2022).
- Weidmann, N.B.; Theunissen, G. Estimating Local Inequality from Nighttime Lights. Remote Sens. 2021, 13, 4624. [Google Scholar] [CrossRef]
- Li, X.; Ge, L.L.; Chen, X.L. Quantifying Contribution of Land Use Types to Nighttime Light Using an Unmixing Model. IEEE Geosci Remote S 2014, 11, 1667–1671. [Google Scholar] [CrossRef]
- Li, X.; Levin, N.; Xie, J.L.; Li, D.R. Monitoring hourly night-time light by an unmanned aerial vehicle and its implications to satellite remote sensing. Remote Sens. Environ. 2020, 247, 111942. [Google Scholar] [CrossRef]
- Azimoh, C.L.; Klintenberg, P.; Wallin, F.; Karlsson, B. Illuminated but not electrified: An assessment of the impact of Solar Home System on rural households in South Africa. Appl. Energy 2015, 155, 354–364. [Google Scholar] [CrossRef]
- Sebitosi, A.B.; Pillay, P.; Khan, M.A. An analysis of off grid electrical systems in rural Sub-Saharan Africa. Energy Convers. Manag. 2006, 47, 1113–1123. [Google Scholar] [CrossRef]
- Thornburg, J.; Ustun, T.S.; Krogh, B. Smart microgrid operation simulator for management and electrification planning. In Proceedings of the 2016 IEEE PES PowerAfrica, Livingstone, Zambia, 28 June–3 July 2016; pp. 1–5. [Google Scholar]
- Ubilla, K.; Jiménez-Estévez, G.A.; Hernádez, R.; Reyes-Chamorro, L.; Irigoyen, C.H.; Severino, B.; Palma-Behnke, R. Smart microgrids as a solution for rural electrification: Ensuring long-term sustainability through cadastre and business models. IEEE Trans. Sustain. Energy 2014, 5, 1310–1318. [Google Scholar]
- Doll, C.N.H.; Pachauri, S. Estimating rural populations without access to electricity in developing countries through night-time light satellite imagery. Energy Policy 2010, 38, 5661–5670. [Google Scholar] [CrossRef]
- Dugoua, E.; Kennedy, R.; Urpelainen, J. Satellite data for the social sciences: Measuring rural electrification with night-time lights. Int. J. Remote Sens. 2018, 39, 2690–2701. [Google Scholar] [CrossRef]
- Elvidge, C.D.; Baugh, K.E.; Sutton, P.C.; Bhaduri, B.; Tuttle, B.T.; Ghosh, T.; Ziskin, D.; Erwin, E.H. Who’s in the dark—satellite based estimates of electrification rates. Urban Remote Sens. Monit. Synth. Modeling Urban Environ. 2011, 250, 211–224. [Google Scholar]
- Ministry of Infrastructure, Republic of Rwanda. Energy Sector Strategic Plan; Ministry of Infrastructure, Republic of Rwanda: Kigali, Rwanda, 2016.
- Li, X.; Ma, R.; Zhang, Q.; Li, D.; Liu, S.; He, T.; Zhao, L. Anisotropic characteristic of artificial light at night–Systematic investigation with VIIRS DNB multi-temporal observations. Remote Sens. Environ. 2019, 233, 111357. [Google Scholar]
- Li, X.; Shang, X.; Zhang, Q.; Li, D.; Chen, F.; Jia, M.; Wang, Y. Using radiant intensity to characterize the anisotropy of satellite-derived city light at night. Remote Sens. Environ. 2022, 271, 112920. [Google Scholar] [CrossRef]


Publisher’s Note: MDPI stays neutral with regard to jurisdictional claims in published maps and institutional affiliations. |
© 2022 by the authors. Licensee MDPI, Basel, Switzerland. This article is an open access article distributed under the terms and conditions of the Creative Commons Attribution (CC BY) license (https://creativecommons.org/licenses/by/4.0/).
Share and Cite
Ru, Y.; Li, X.; Belay, W.A. Tracking Spatiotemporal Patterns of Rwanda’s Electrification Using Multi-Temporal VIIRS Nighttime Light Imagery. Remote Sens. 2022, 14, 4397. https://doi.org/10.3390/rs14174397
Ru Y, Li X, Belay WA. Tracking Spatiotemporal Patterns of Rwanda’s Electrification Using Multi-Temporal VIIRS Nighttime Light Imagery. Remote Sensing. 2022; 14(17):4397. https://doi.org/10.3390/rs14174397
Chicago/Turabian StyleRu, Yuanxi, Xi Li, and Wubetu Anley Belay. 2022. "Tracking Spatiotemporal Patterns of Rwanda’s Electrification Using Multi-Temporal VIIRS Nighttime Light Imagery" Remote Sensing 14, no. 17: 4397. https://doi.org/10.3390/rs14174397
APA StyleRu, Y., Li, X., & Belay, W. A. (2022). Tracking Spatiotemporal Patterns of Rwanda’s Electrification Using Multi-Temporal VIIRS Nighttime Light Imagery. Remote Sensing, 14(17), 4397. https://doi.org/10.3390/rs14174397