Technical Note

Effects of Land Use and Land Cover Change on Temperature in Summer over the Yellow River Basin, China

1
Key Laboratory of Geospatial Technology for Middle and Lower Yellow River Regions, Ministry of Education, Henan University, Kaifeng 475004, China
2
Institute of Urban Big Data, College of Geography and Environmental Science, Henan University, Kaifeng 475004, China
3
Henan Key Laboratory of Integrated Air Pollution Control and Ecological Security, Henan University, Kaifeng 475004, China
*
Author to whom correspondence should be addressed.
Remote Sens. 2022, 14(17), 4352; https://doi.org/10.3390/rs14174352
Submission received: 9 August 2022 / Revised: 22 August 2022 / Accepted: 30 August 2022 / Published: 2 September 2022
(This article belongs to the Section Environmental Remote Sensing)

Abstract

:
As the main driving force of global climate change, land use and land cover change (LUCC) can affect the surface energy balance and the interaction between the surface and atmosphere. This effect will cause further surface temperature changes. The Yellow River Basin is an important ecological security barrier in China. Therefore, exploring the impact of its LUCC on temperature changes can provide certain help for future land-use planning in the Yellow River Basin. Here, we conducted two numerical simulation experiments (Case2015 and Case1995) by using the weather research and forecasting (WRF) model to quantify the effect of LUCC in the Yellow River Basin on the summer 2 m air temperature (T2 m). The results showed that LUCC led to an overall warming trend in T2 m in the Yellow River Basin. Urban expansion caused T2 m to rise by approximately 0.3 °C to 0.6 °C. A warming effect was also identified in the areas where farmland and bare areas were converted to grassland, with T2 m increasing by around 0.4 °C.

1. Introduction

Land use and land cover change (LUCC) reflect the impact of human activities on the surface to a certain extent, and are currently the main cause of temperature change [1,2,3,4,5]. LUCC can directly change a series of surface physical characteristics such as surface reflectivity, surface roughness, and vegetation coverage, thereby affecting processes such as surface energy balance, heat and moisture transfer between the surface and atmosphere [6,7,8,9,10]. This will further affect the temperature on a regional or even global scale [11,12]. Therefore, in the context of the current rapid development, it is important to explore the response mechanism of LUCC to temperature.
At present, many scholars have used different methods to prove that the LUCC can cause regional temperature changes. One of the methods is statistical data analysis. The statistical data analysis chiefly uses the observation data of meteorological stations to analyze the temperature change [13,14,15]. Nevertheless, this method is overly dependent on the observation data and features uncertainties. In addition, remote sensing satellite data can also be used to achieve the surface temperature to analyze the trend of temperature change [16,17,18,19]. However, it cannot explain the response mechanism between LUCC and temperature. Furthermore, it is not suitable for long-term stable monitoring of temperature [20,21].
In contrast, numerical simulations using climate models solve the shortcomings of the above two methods well. They can explain the mechanism of interaction between LUCC and temperature in detail by simulating long-term stability of temperature change [22,23,24,25]. Thus, more and more scholars choose it to explore the interaction between LUCC and temperature. Based on land use and land cover data in the Aral Sea region, He et al., found that LUCC caused a gradual increase in summer temperature from 1980 to 2015 by using numerical simulation [26]. Chu et al., used the gravity center model and related statistical methods to quantify the impact of LUCC on climate of the Songnen Plain in Northeast China. They found that the temperature in this region had gradually increased at a rate of 0.3 °C per decade since 1980 [27]. Wang found that farmland, forest and grassland had a cooling effect on regional temperature by using the Weather Research and Forecasting model (WRF) to study the impact of LUCC on local surface temperature in semi-arid regions of northern China in the early 21st century [28].
As one of the most important river basins in China, the Yellow River Basin plays an important role in Chinese ecological security. However, most areas in the basin are arid and semi-arid areas, with little and uneven distribution of precipitation, serious soil erosion, and fragile ecosystems [29,30]. In order to improve ecosystem services of the Yellow River Basin, the Chinese government carried out work such as returning farmland to forests, afforestation, and water conservancy projects around 2000 [31]. At the same time, with the rapid development of the Chinese social economy, cities in the Yellow River Basin were expanding rapidly, and human activities were frequent, which had a certain impact on ecosystem functions of the basin [32,33,34]. Therefore, this study selected the two periods of 1995 and 2015 to explore the impact of the aforementioned projects and human activities on the temperature of the basin. This has important practical significance for the future development of the Yellow River Basin. In recent years, many related studies have also been carried out in the Yellow River Basin, but these studies are more focused on the Yellow River tributaries or the Loess Plateau [35,36,37,38,39]. There has not been much attention paid to the impact of LUCC on temperature at the scale of the entire Yellow River Basin.
This study aims to explore the impact of LUCC on regional temperature changes based on the land use and land cover data of the Yellow River Basin in 1995 and 2015 by using the WRF model. The main objectives are: (1) to evaluate the performance of the WRF simulated climate variables; (2) to quantify the LUCC in the Yellow River Basin between 1995 and 2015; and (3) to quantify the impact of LUCC on regional temperature in Yellow River Basin.

2. Materials and Methods
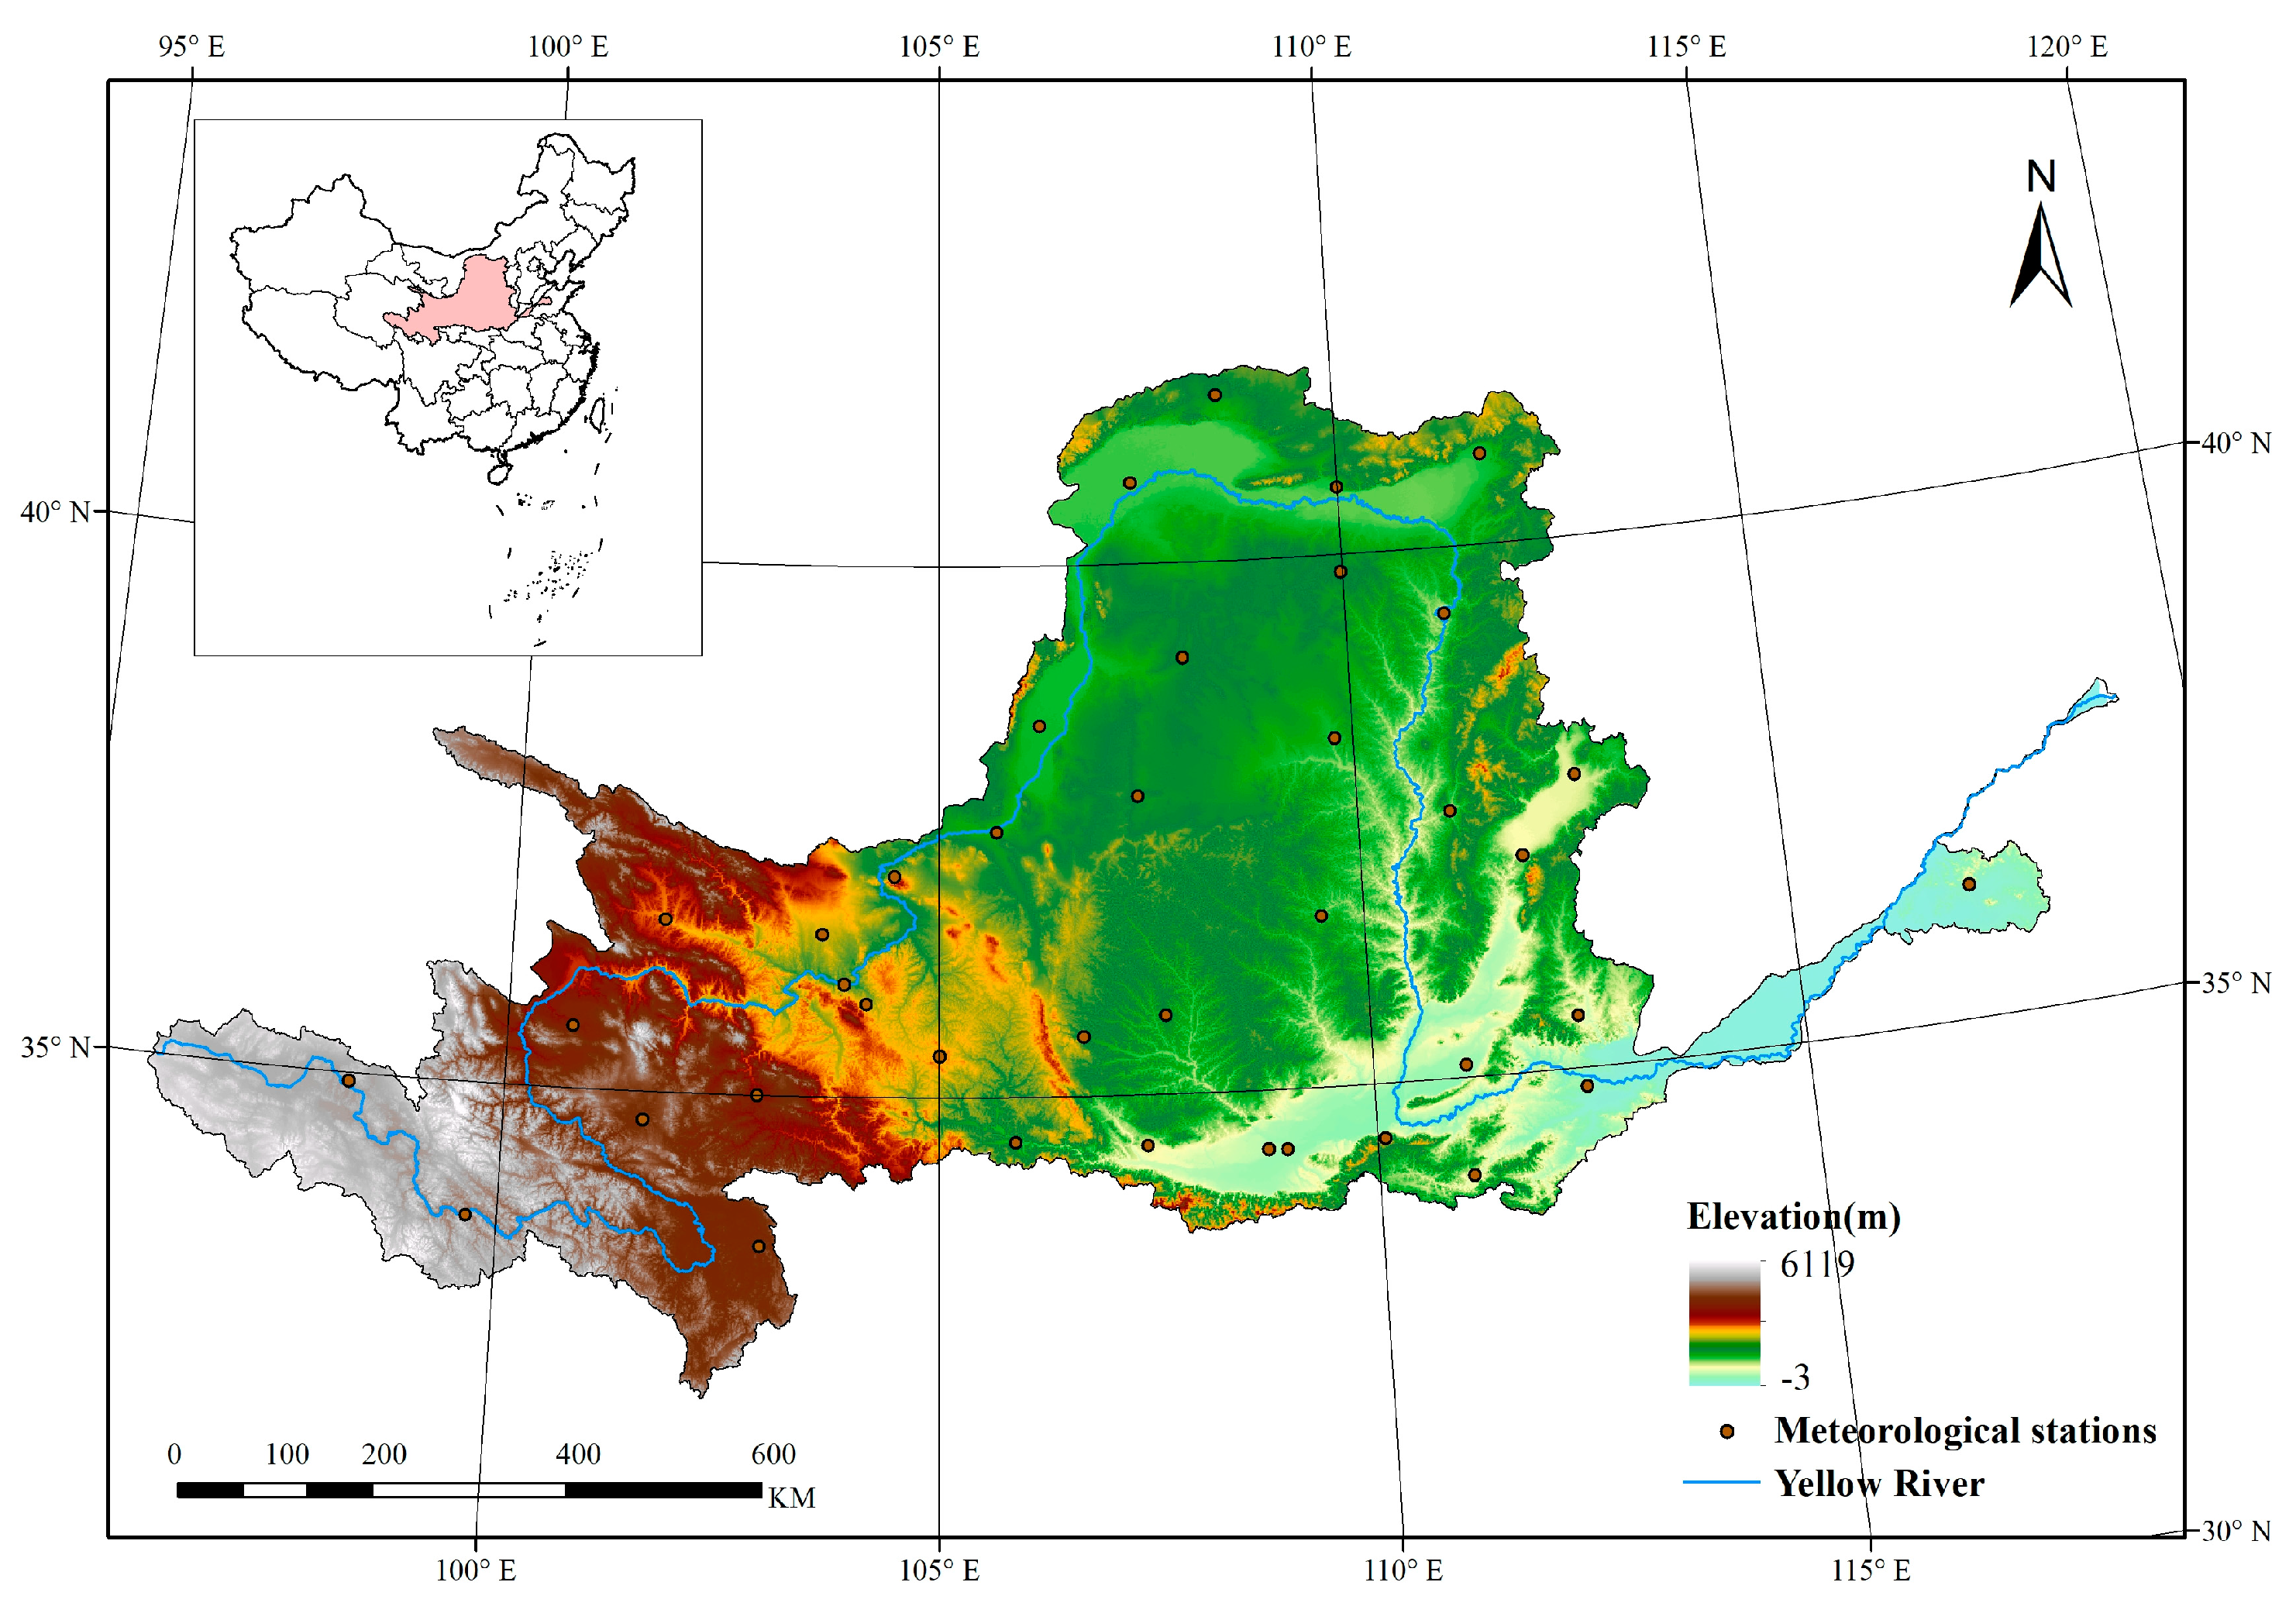
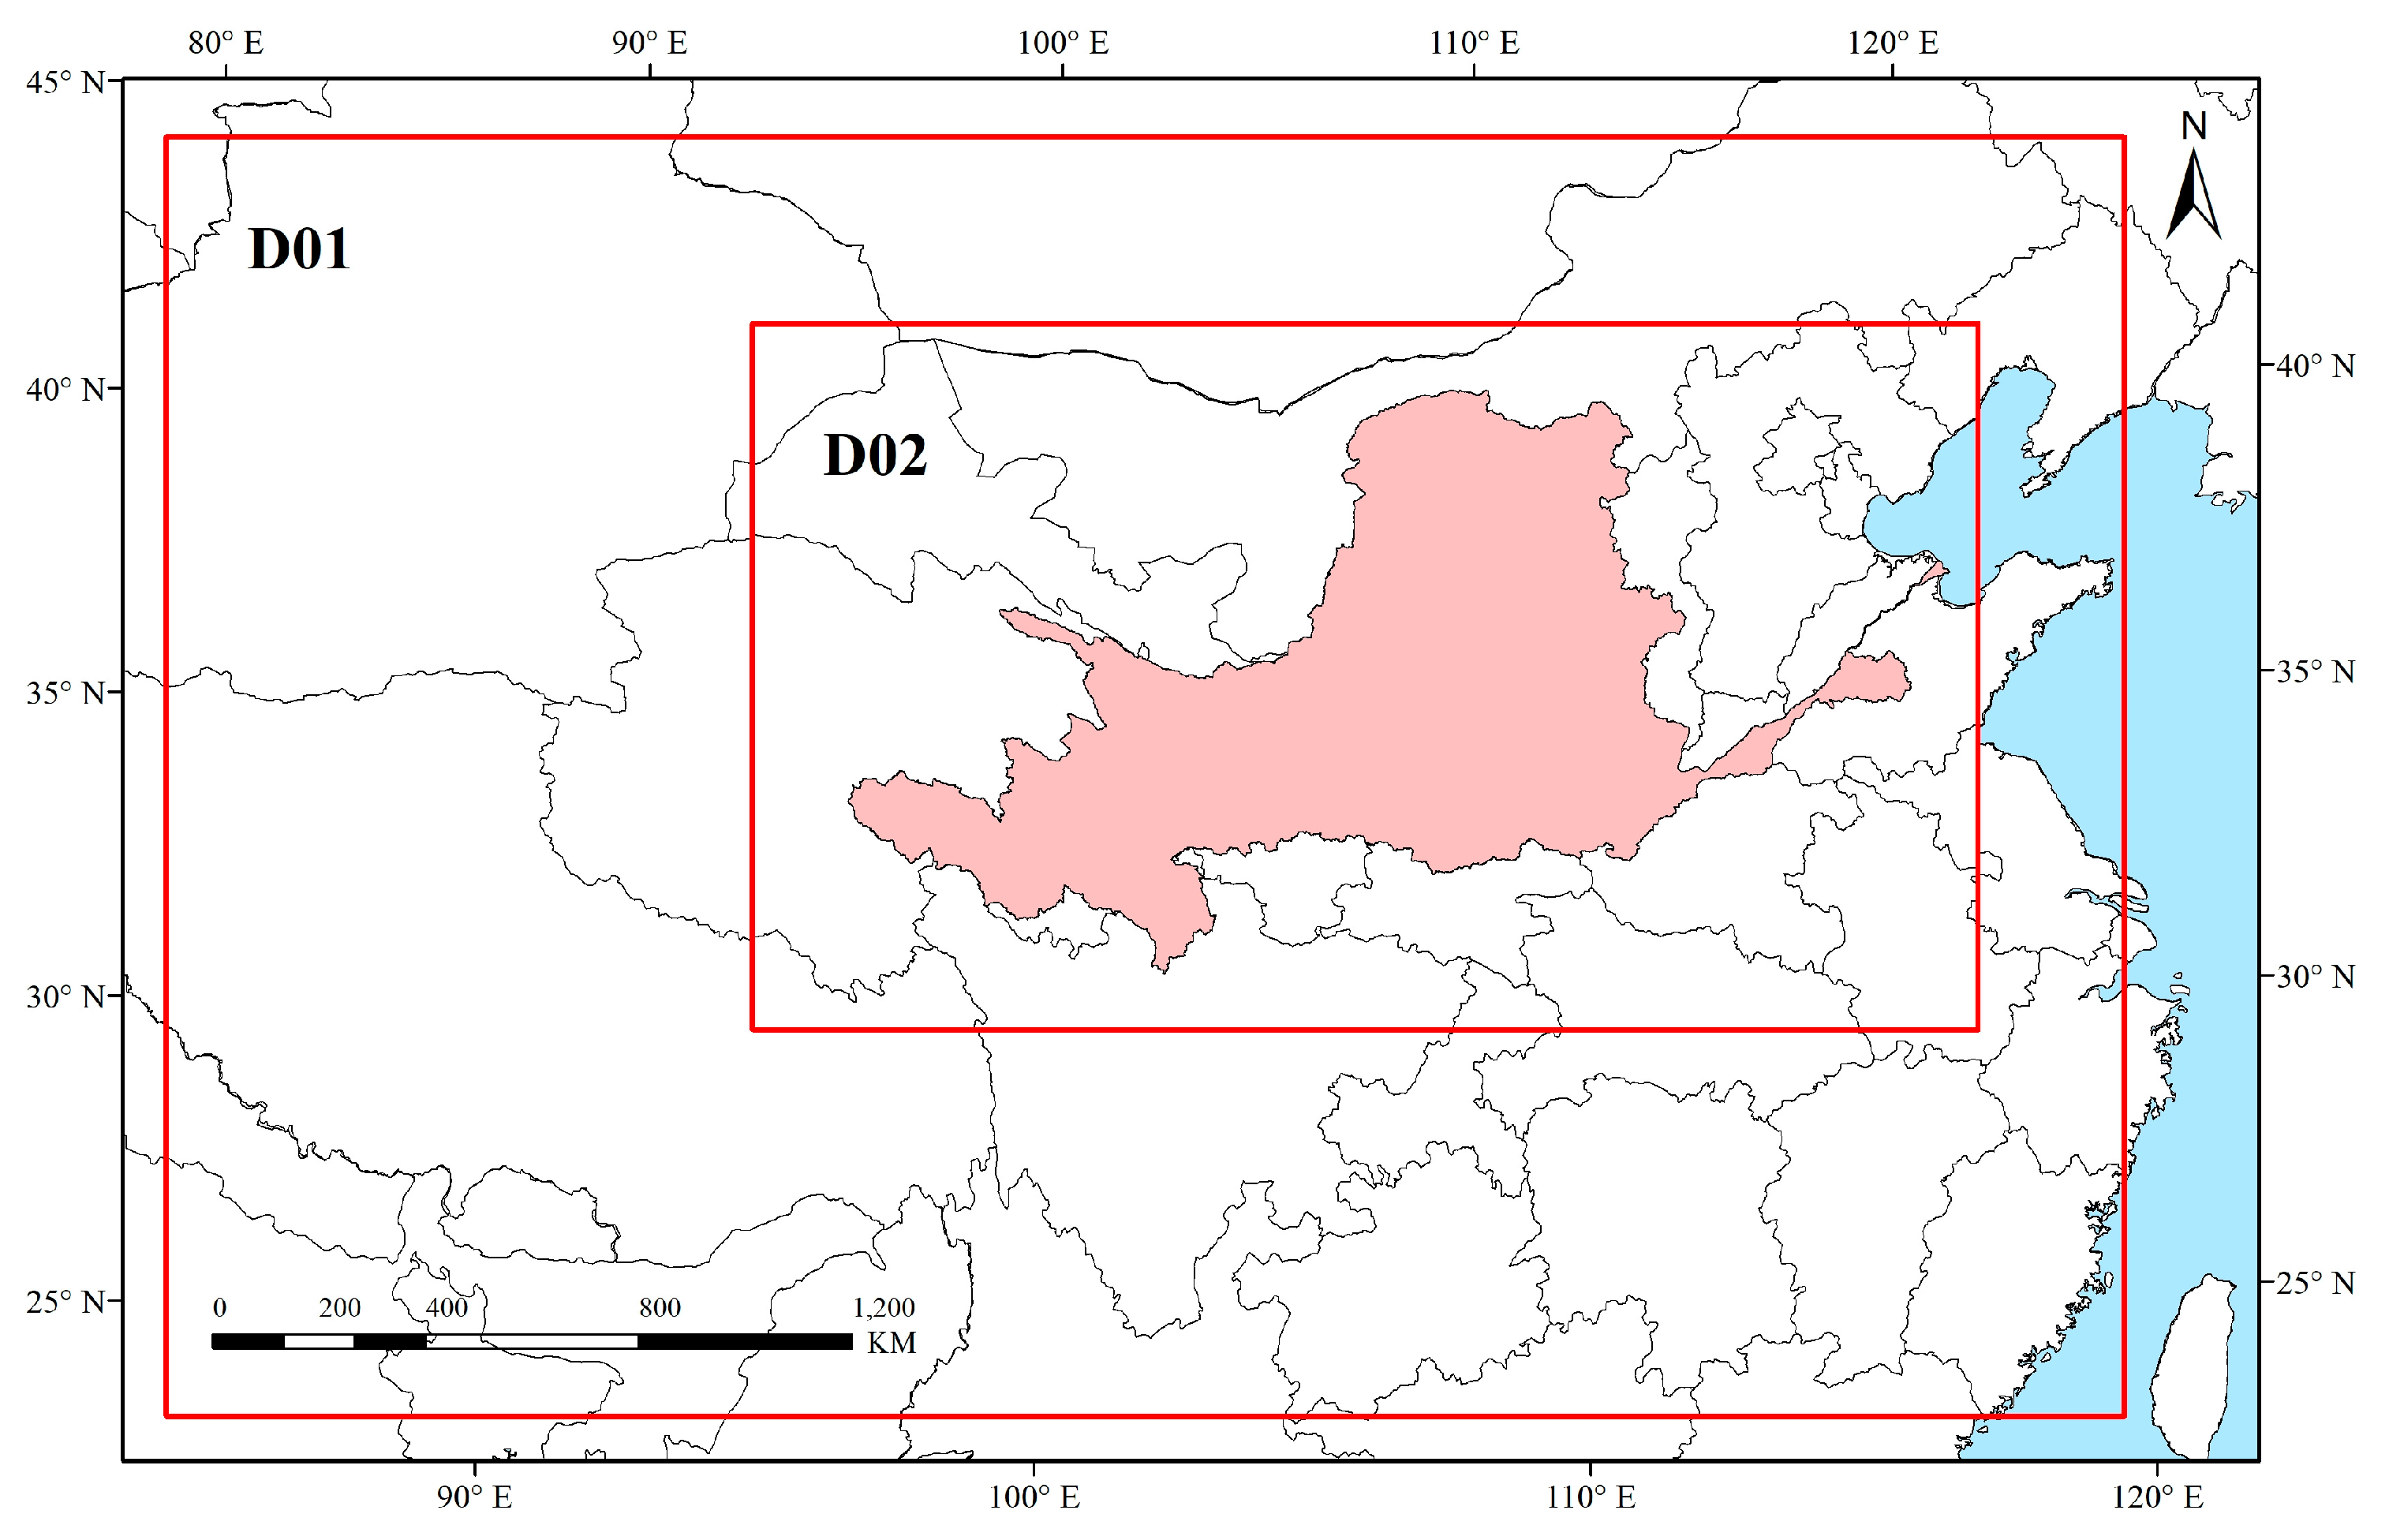
2.1. Study Area

The Yellow River Basin spans nine provinces including Qinghai, Sichuan, Gansu, Ningxia, Inner Mongolia, Shanxi, Shaanxi, Henan, Shandong, ranging from 95°53′–119°05′E, 32°10′–41°50′N (Figure 1), covering an area of 79.5 × 10⁴ km2, which plays important roles in Chinese economic and social development [40]. Its temperature has decreased from east to west and the average temperature remains at −4–14 °C [41]. The average annual precipitation is 250 to 500 mm, which is unevenly distributed [42].

2.2. Model Description and Configuration

The WRF model is a kind of next-generation mesoscale numerical weather prediction system, which was designed for both atmospheric research and operational forecasting application [43]. It was developed by the National Center for Atmospheric Research (NCAR), the National Centers for Environmental Prediction (NCEP), the Forecast systems Laboratory (FSL) and other departments [44]. Now, the WRF model has been widely used in regional climate modeling, land–atmosphere interaction, hydrological simulation, and has shown strong regional climate simulation capability [45,46,47,48,49,50].
In this study, WRF model v3.8.2 was configured with two nested domains (Figure 2), both using the Lambert projection. The outer domain (D01) is centered at 35.5°N, 102°E, covering almost all of China and the surrounding waters in eastern China, with a horizontal resolution of 25 km × 25 km and a grid number of 148 × 97. The inner domain (D02) covers the whole Yellow River Basin and its surrounding areas, with a horizontal resolution of 5 km × 5 km and a grid number of 461 × 266. Meteorological conditions were initialized using reanalysis data released by NCEP; at a grid resolution of 1° × 1°, the temporal resolution was 6 h.
Table 1 shows the main physical parameterization schemes. These physical schemes included the Noah land surface model [51], the Mellor-Yamada-Janjic (MYJ) planetary boundary layer (PBL) scheme [52], the Betts-Miller-Janjic (BMJ) cumulus parameterization scheme [53], the Lin et al. microphysics scheme [54], the Goddard shortwave radiation scheme [55], and the new Goddard longwave radiation scheme [56].

2.3. Experimental Design

LUCC can have a certain influence on the regional temperature by changing the physical properties of the underlying surface. Therefore, in order to quantify the effect of LUCC on the temperature, we designed two simulation experiments: Case2015 and Case1995. Since the ecological restoration project was implemented in the Yellow River basin around 2000, we chose the land cover data in 1995 and 2015 to represent the land cover before and after the implementation of the ecological project. Case2015 used the land use and land cover data and meteorological conditions in 2015. This corresponds to the summer temperature change in the Yellow River Basin in 2015. Case1995 served as a control experiment for Case2015, using land use and land cover data in 1995, as well as the same physical parameterization scheme and climate field data as Case2015. In this case the difference between the two experiments was caused by LUCC. The effect of LUCC on the temperature of the Yellow River Basin could be quantified by the differences between Case1995 and Case2015.
The land use and land cover data were obtained from ICDR Land Cover dataset in Copernicus Climate Change Service (https://climate.copernicus.eu/ accessed on 31 August 2022). This dataset has a spatial resolution of 300 m and its land use/cover categories use the Land Cover Classification System (LCCS) developed by the United Nations (UN) Food and Agriculture Organization (FAO), with a total of 22 categories. In addition, based on the LUCC data in 2015 and 1995, we calculated the land use transition matrix between 2015 and 1995 using ArcGIS 10.5 (https://www.esri.com accessed on 31 August 2022). Moreover, the land use and land cover change map was created to analyze the changes in the Yellow River Basin between 1995 and 2015. The simulation period of two experiments ranged from 00:00 on 21 May, to 00:00 on 1 September, and the first 10 days were treated as a spin-up period, which was excluded from the analysis.

2.4. Model Evaluation

The observed data (OBS) were obtained from the National Oceanic and Atmospheric Administration (NOAA)—National Climatic Data Center Surface’s (NCDC) hourly observed data. We compared the 2 m air temperature (T2 m) simulated by the WRF model with OBS at 127 meteorological stations to evaluate the simulation performance of the WRF model. This study adopted the mean bias (MB), normalized mean bias (NMB), normalized mean error (NME), root-mean-square error (RMSE) and correlation coefficient (R) to evaluate the model’s performance [57,58,59].

3. Results

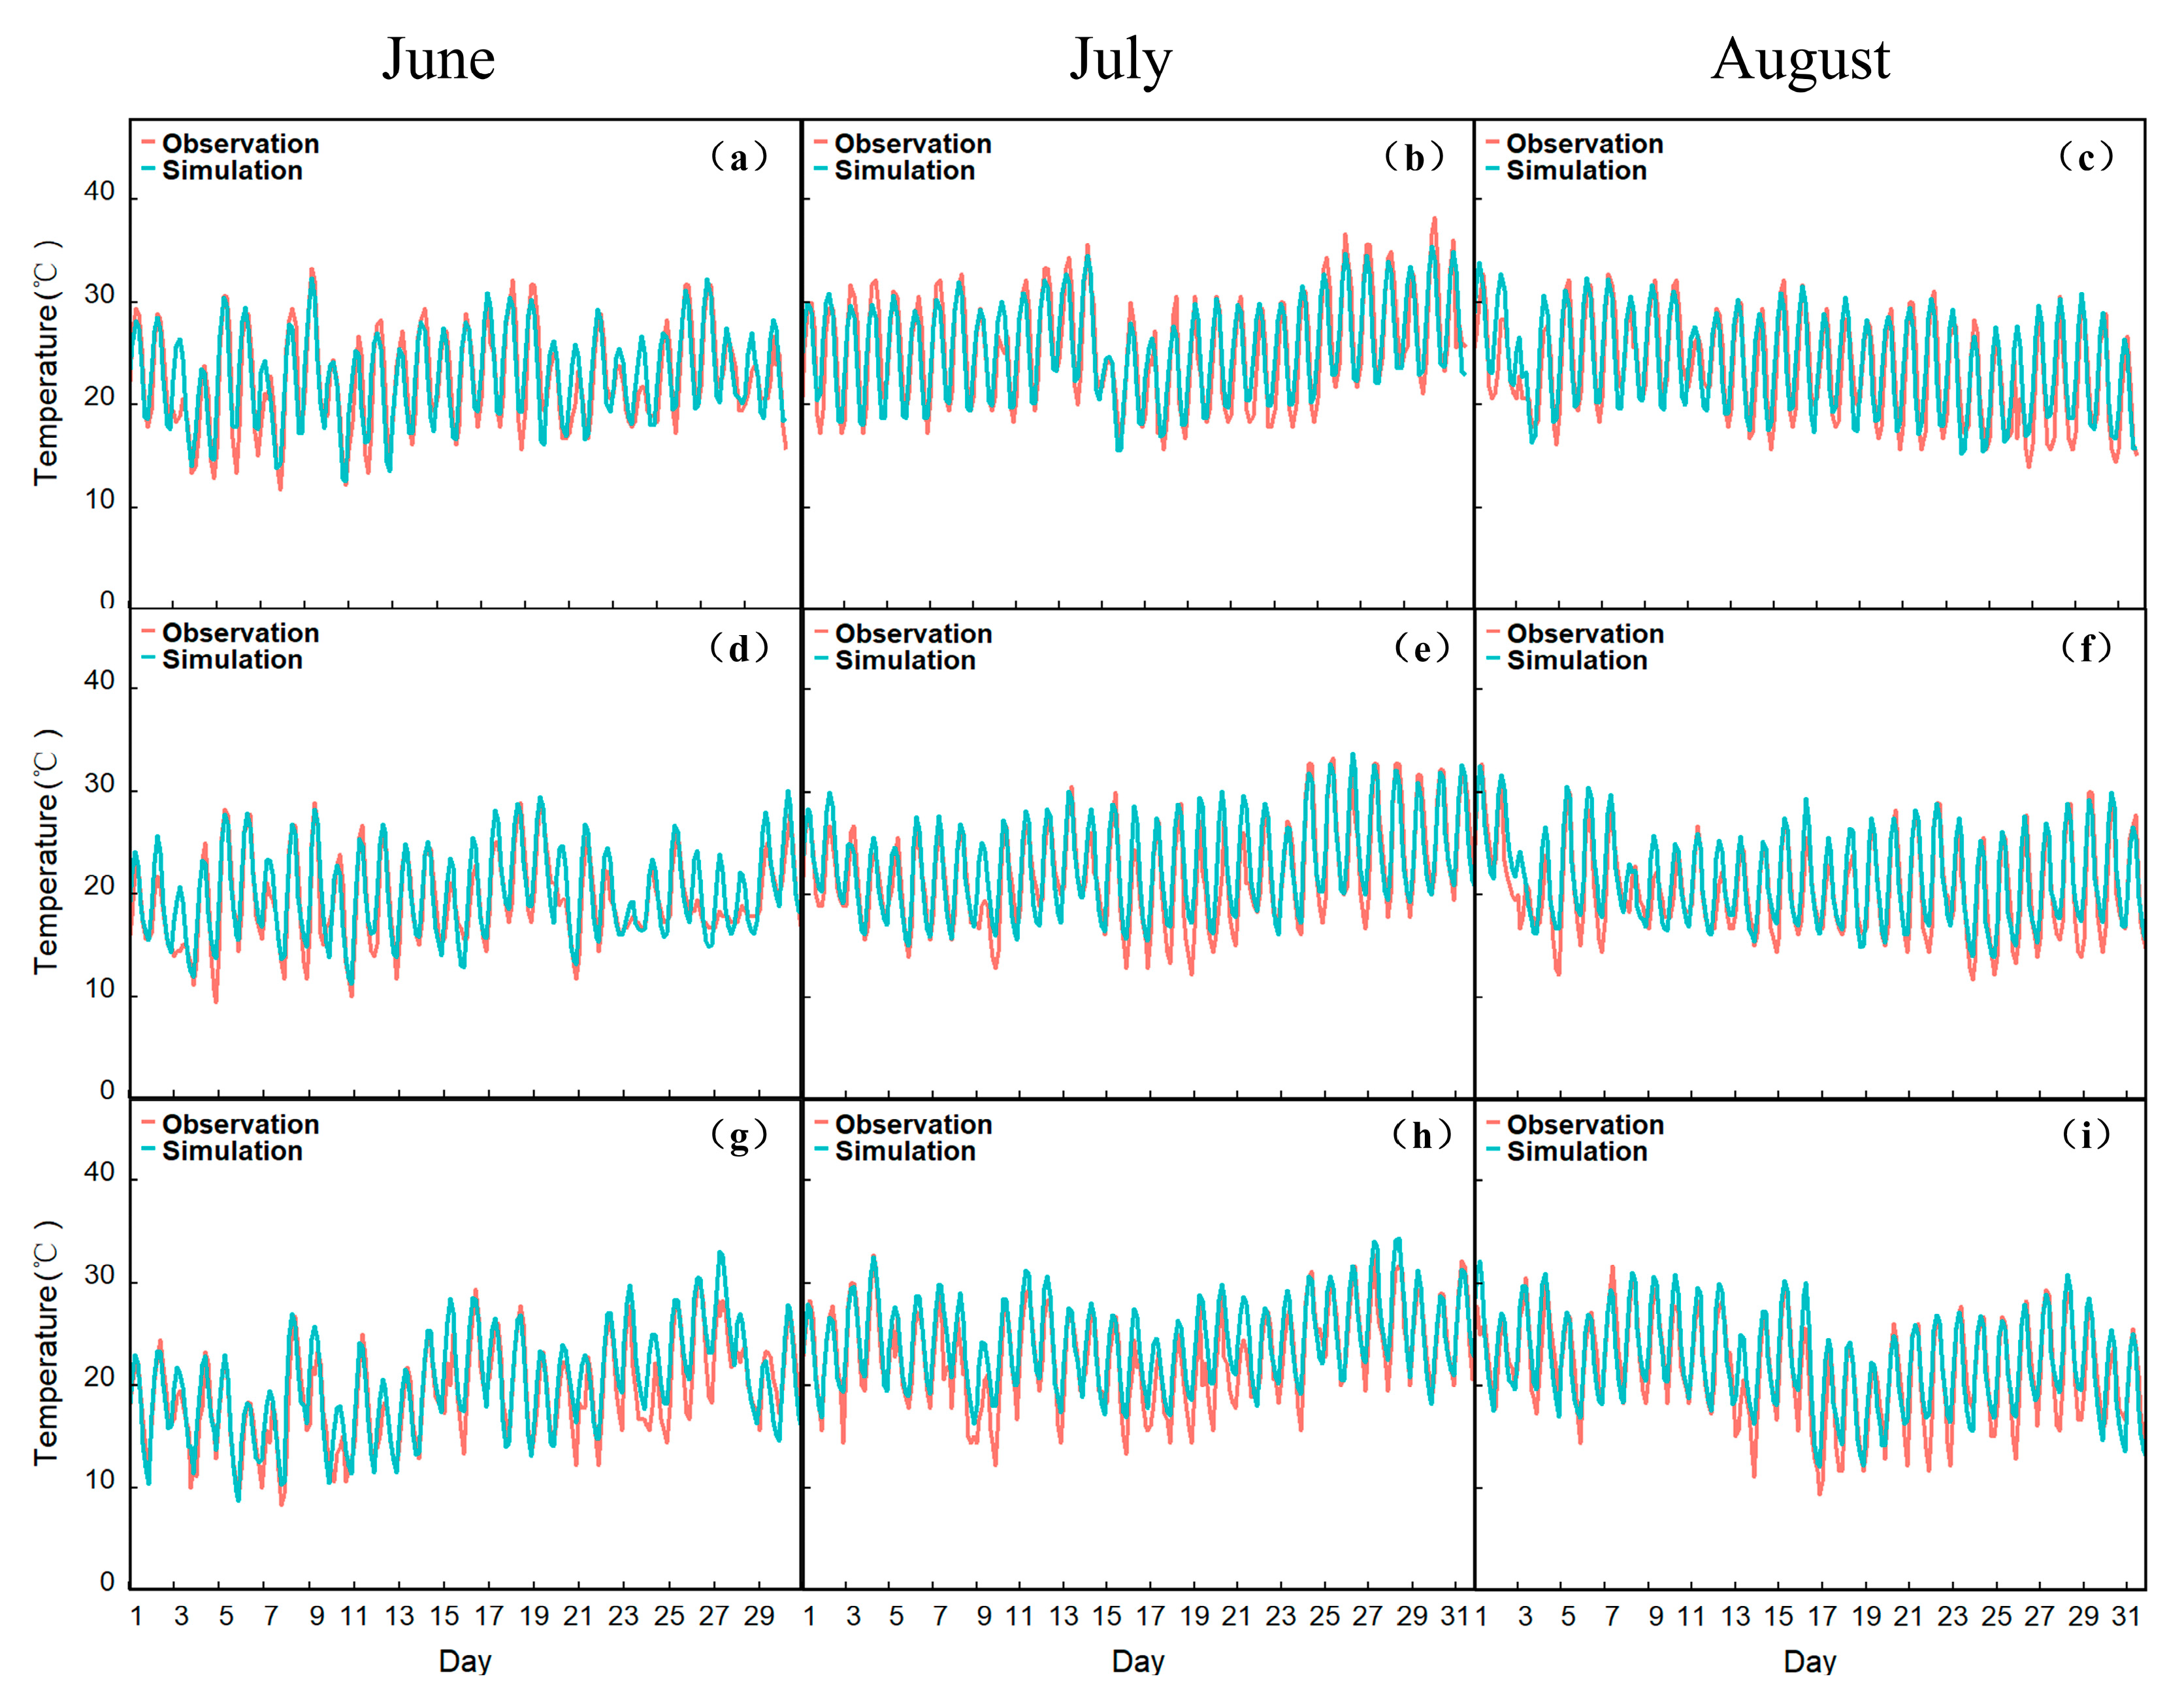
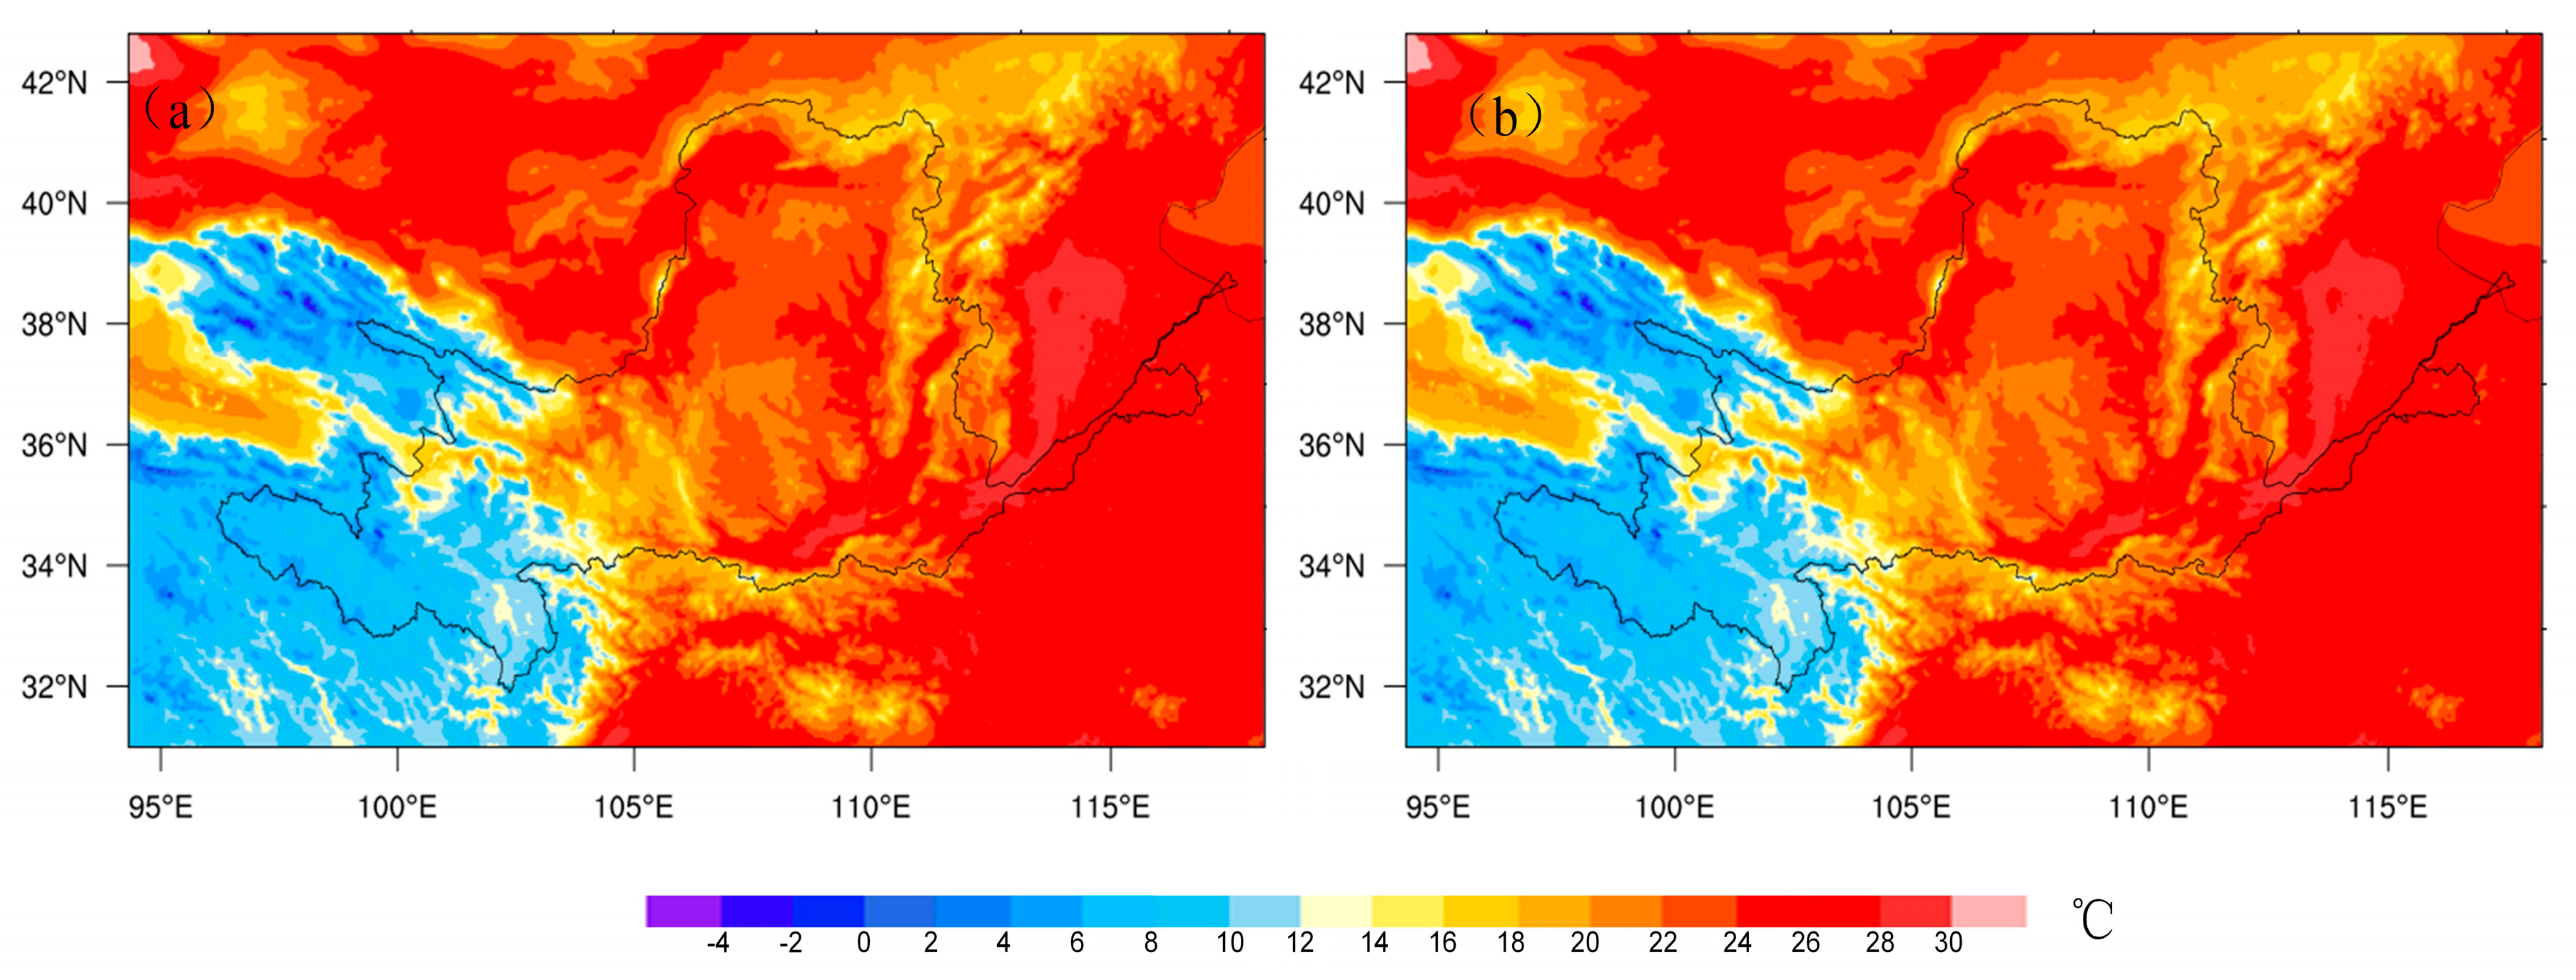
3.1. WRF Model Evaluation

In this study, we evaluated the performance of the WRF model by comparing the simulation results of Case2015 in nested domain 2 with observed temperature. Table 2 shows the performance statistics of the MB, NMB, NME, RMSE and R of T2 m for both experiments, which were similar to the performance of the WRF model in previous studies [60,61,62]. We can see that the correlation coefficient of the two simulation experiments for the temperature simulation can reach 0.93, indicating that the WRF model configurations in this study can well simulate the temperature in the study area. Therefore, the WRF model accurately generated the trend of T2 m during the simulation period and further provided confidence in exploring the impact of LUCC on regional temperature.
Figure 3 shows the comparison between the simulation results and OBS at three randomly selected sites. It can be seen that the low temperature is overestimated and the high temperature is underestimated. This may be caused by the land use data in the model being different from the real situation. In addition, the accuracy of the underlying surface data in other areas may also have an impact on the simulation results of these stations, which may also cause the uncertainty of the temperature simulation results.

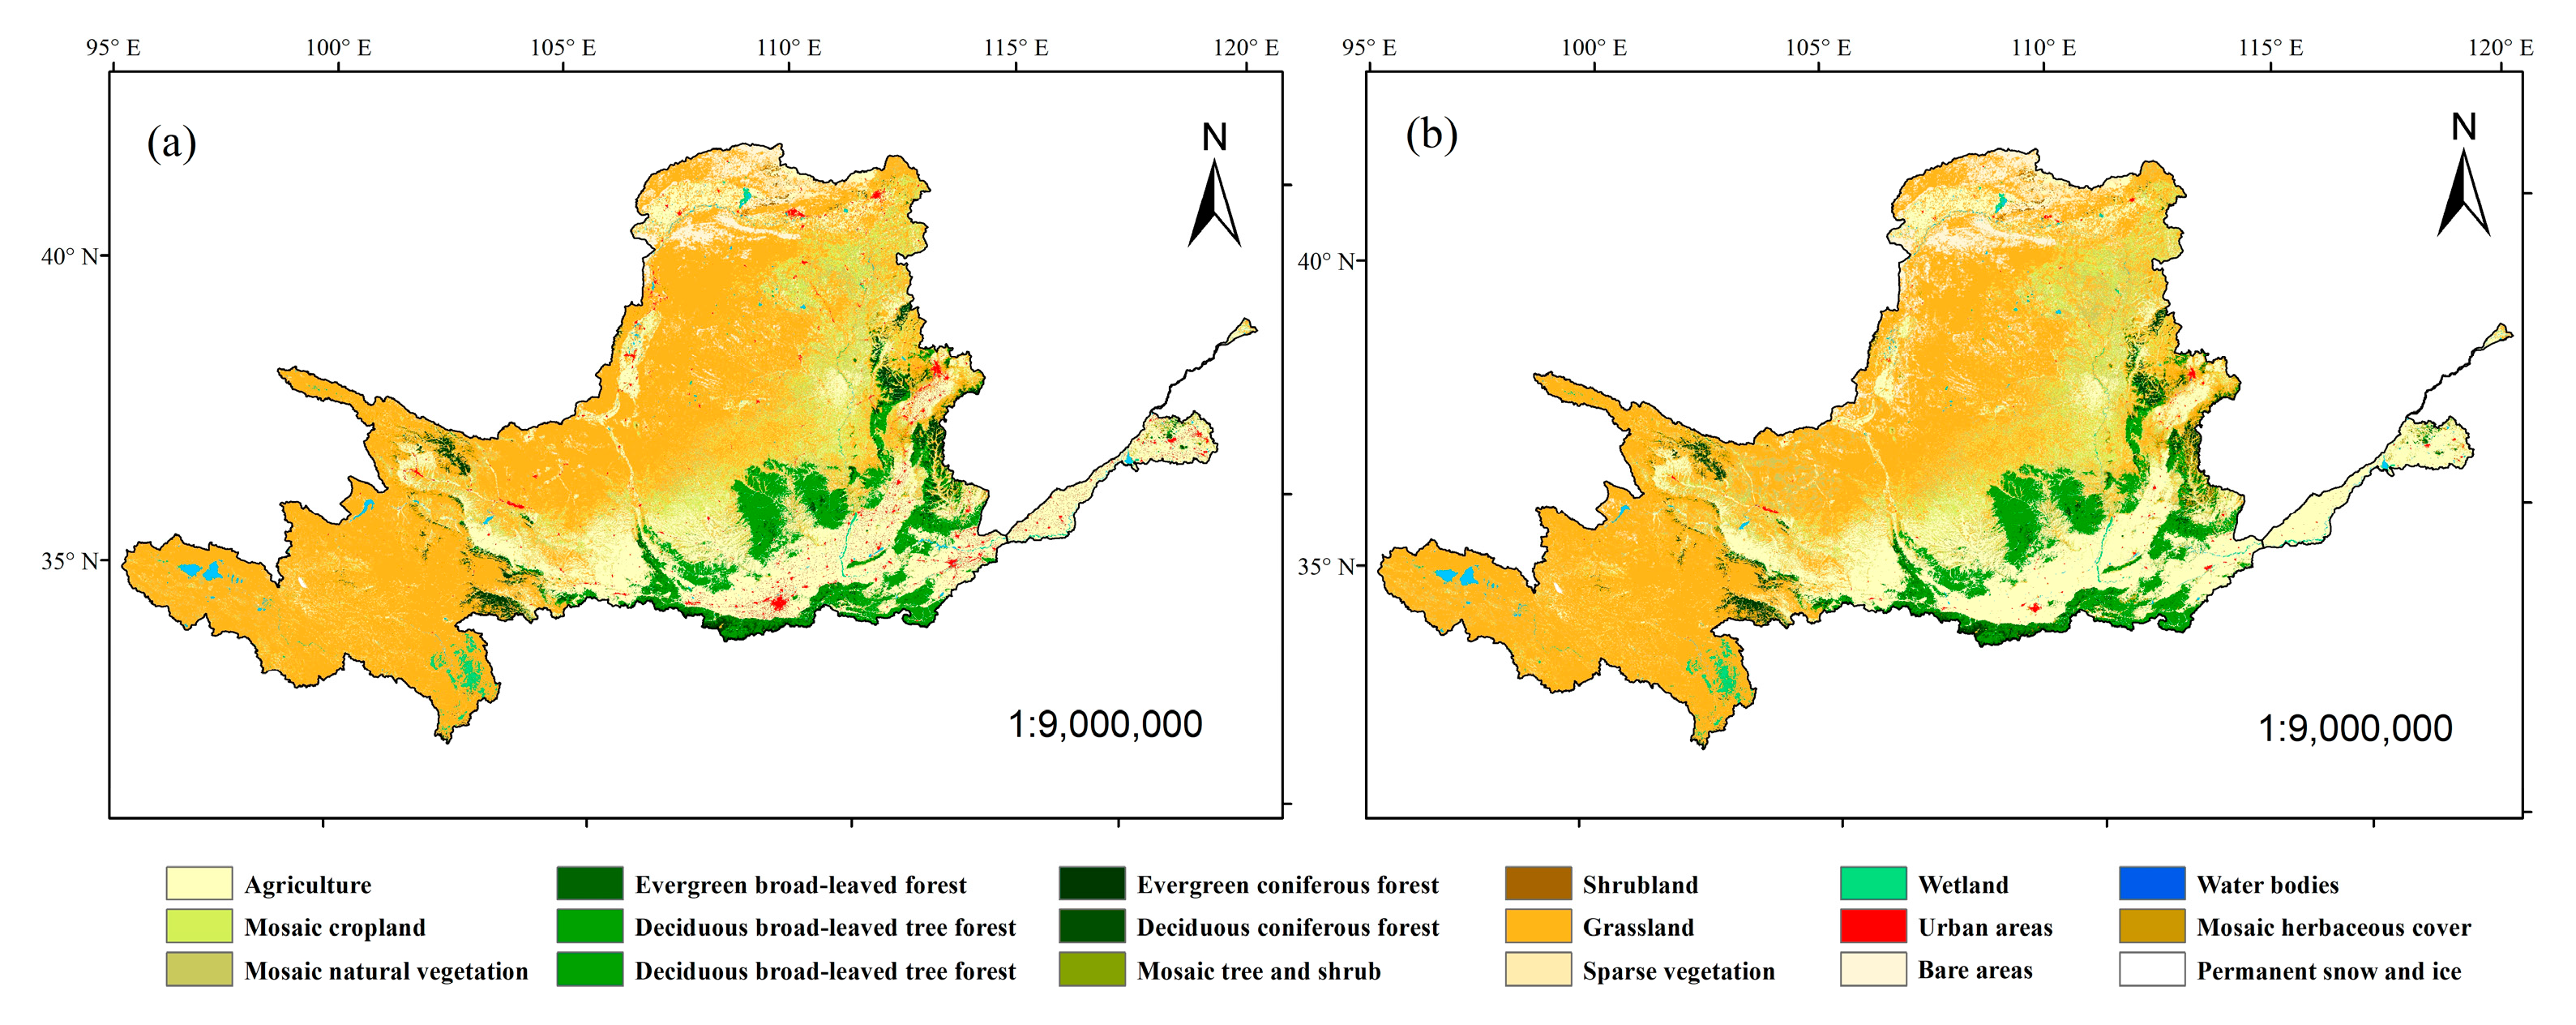
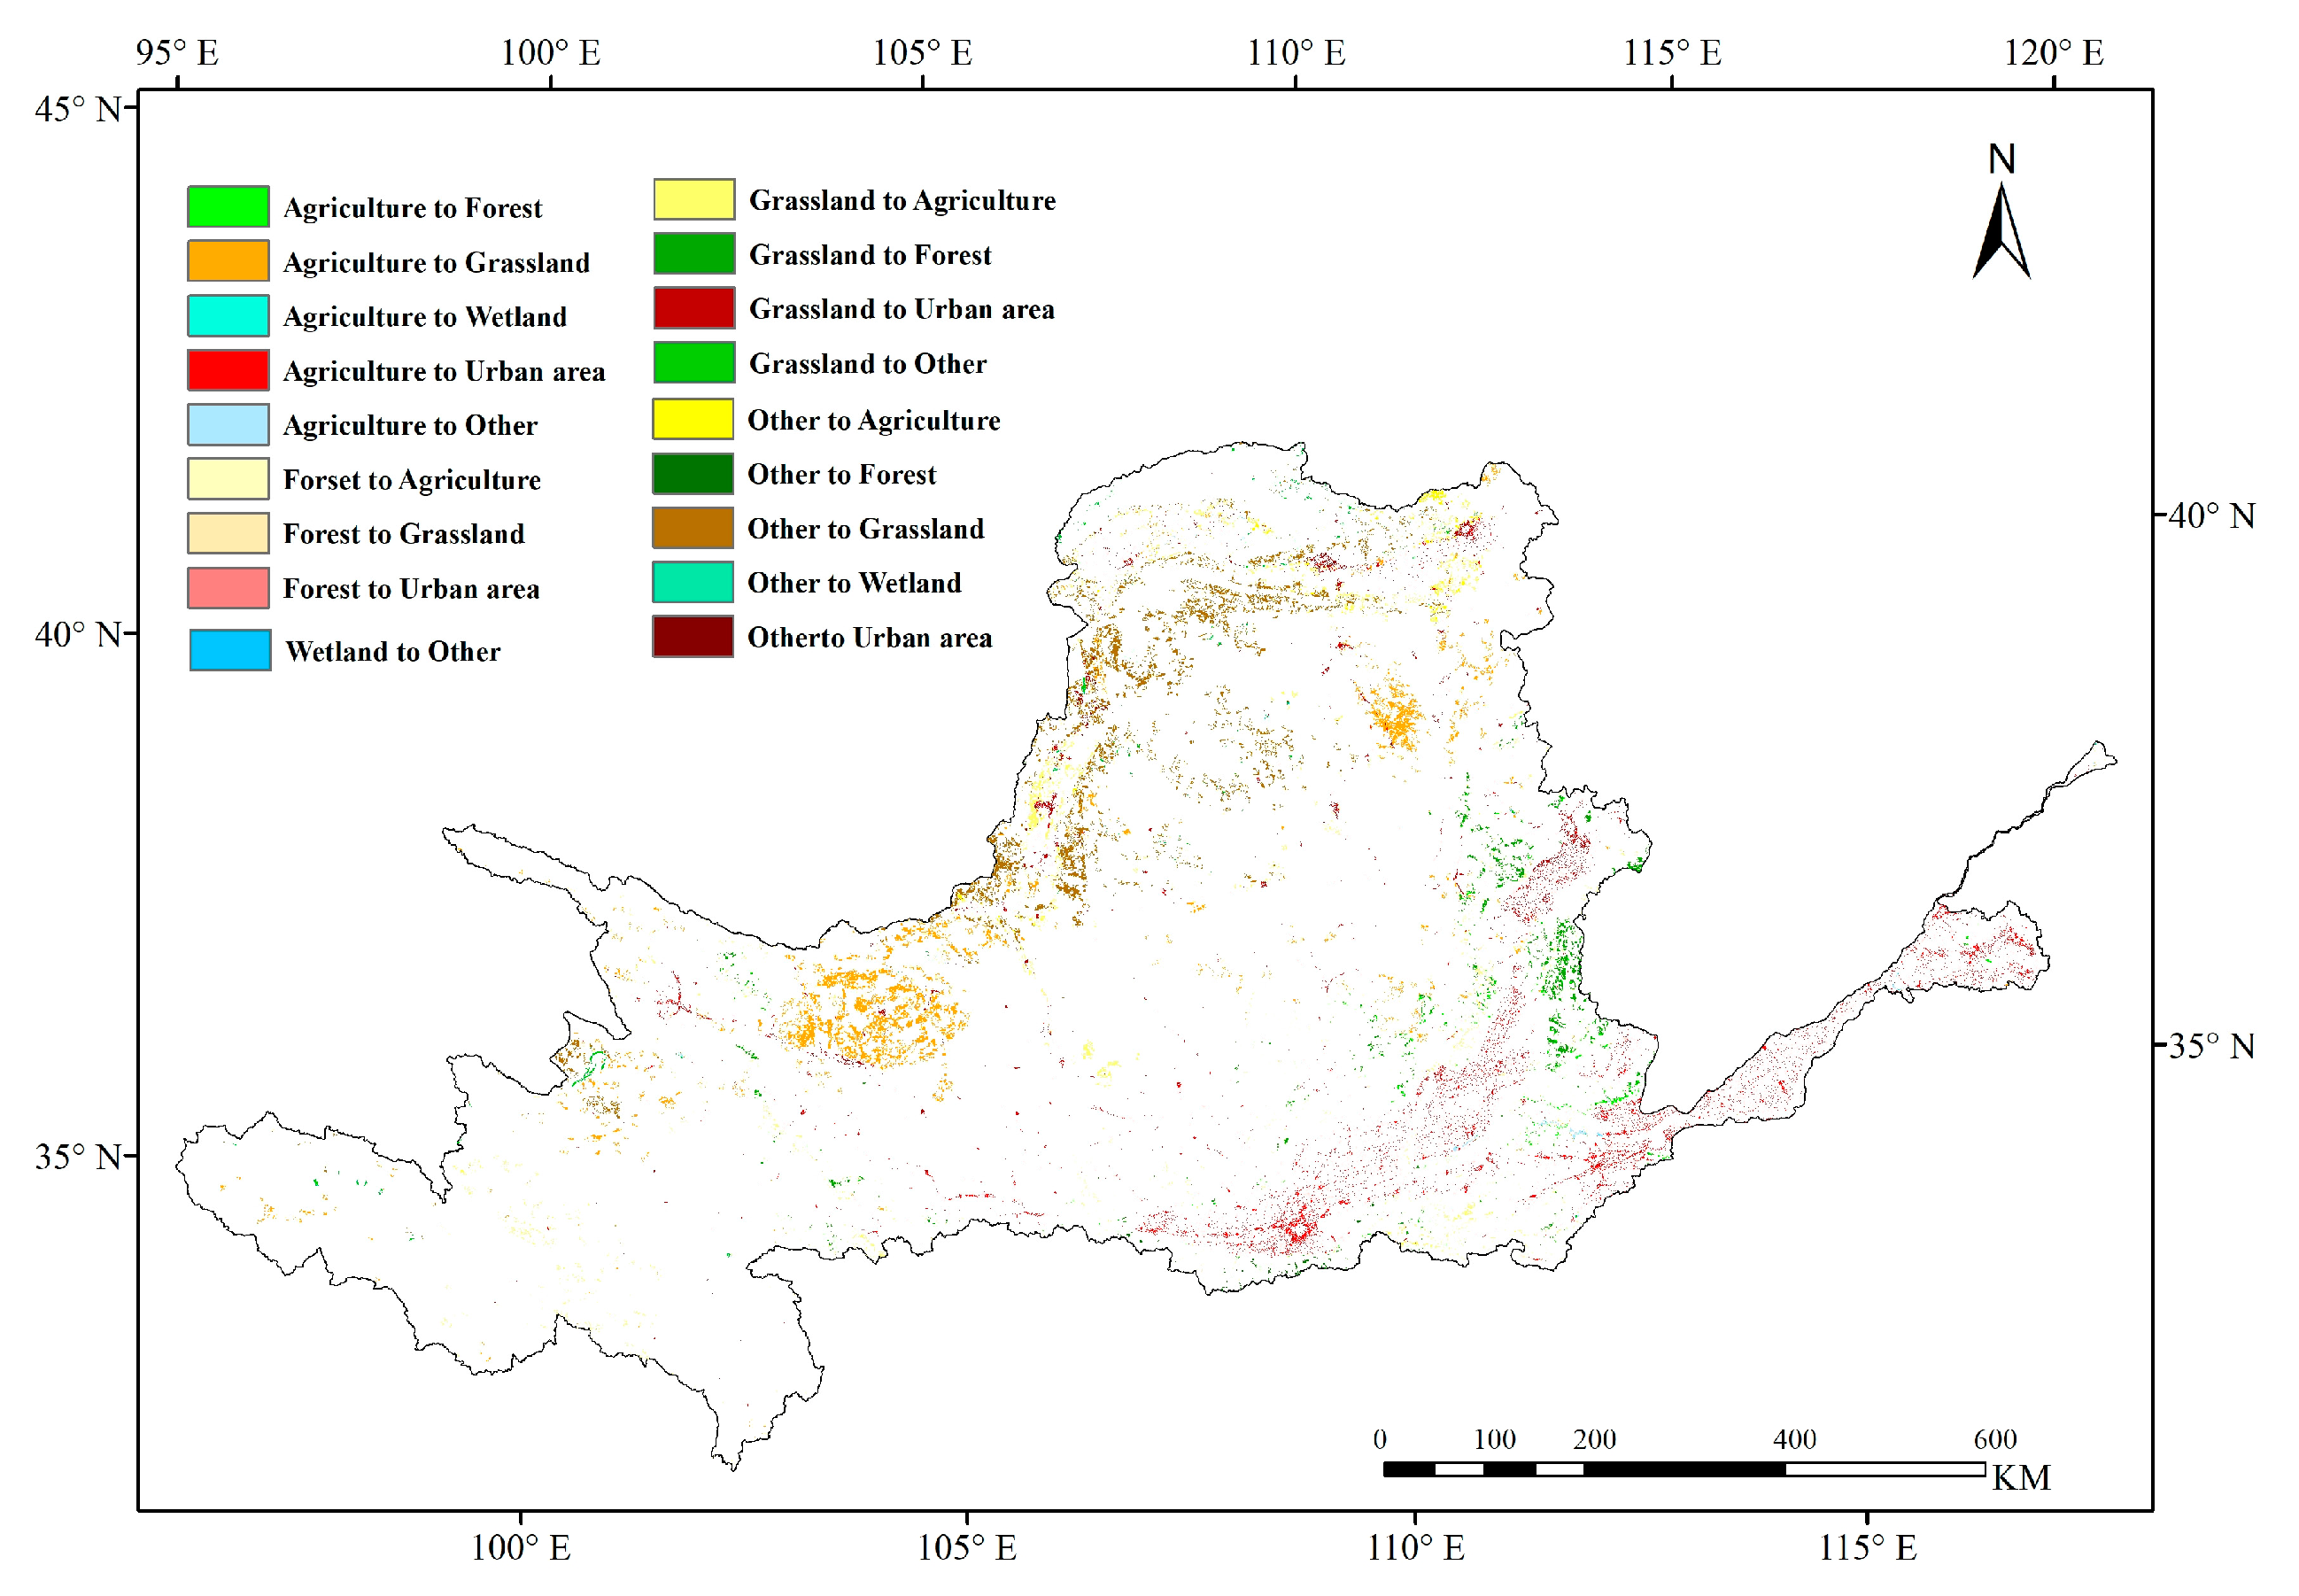
3.2. Land Use and Land Cover Change

Figure 4 shows the land use cover map of the Yellow River Basin in 2015 (a) and 1995 (b). Table 3 presents the land conversions in farmland, forest, grassland, wetland, urban areas and others. During the study period, the changes in grassland and urban areas were most obvious. Figure 5 shows the spatial distribution of LUCC between 1995 to 2015. Between 1995 and 2015, a great amount of farmland and bare areas were converted into grassland, mainly distributed in Gansu, Ningxia, and Inner Mongolia in the upper reaches of the Yellow River Basin (Figure 5). In addition, some farmland in northern Shaanxi in the middle reaches of the Yellow River Basin has also been converted into grassland, but the area was relatively small. This transformation was primarily due to the government launching the “Returning Farmland to Forest and Grassland Project”. The project purposed to alleviate soil erosion in the Yellow River Basin [63]. Similarly, the area of forest was also expanded by approximately 3000 km2 because of the project, which was distributed in the Shanxi region in the middle reaches of the Yellow River Basin. However, it was not as significant as grassland.
With the development of Chinese economic and population growth, urban areas had maintained a tendency to rapidly expand between 1995 and 2015. More than 10,000 km2 of land was converted to urban areas, primarily including farmland, grassland, and bare areas. This transition was mainly situated in Shanxi and Shaanxi regions in the southeast of the middle reaches, such as Xi’an, Taiyuan, etc. The urban expansion was also significant in the lower Henan and Shandong regions, such as Luoyang, Tai’an etc. In addition, there were also mutual conversions between other land use and land cover types, but their distribution was relatively discrete and the area was small, so they were not described in detail in this study.

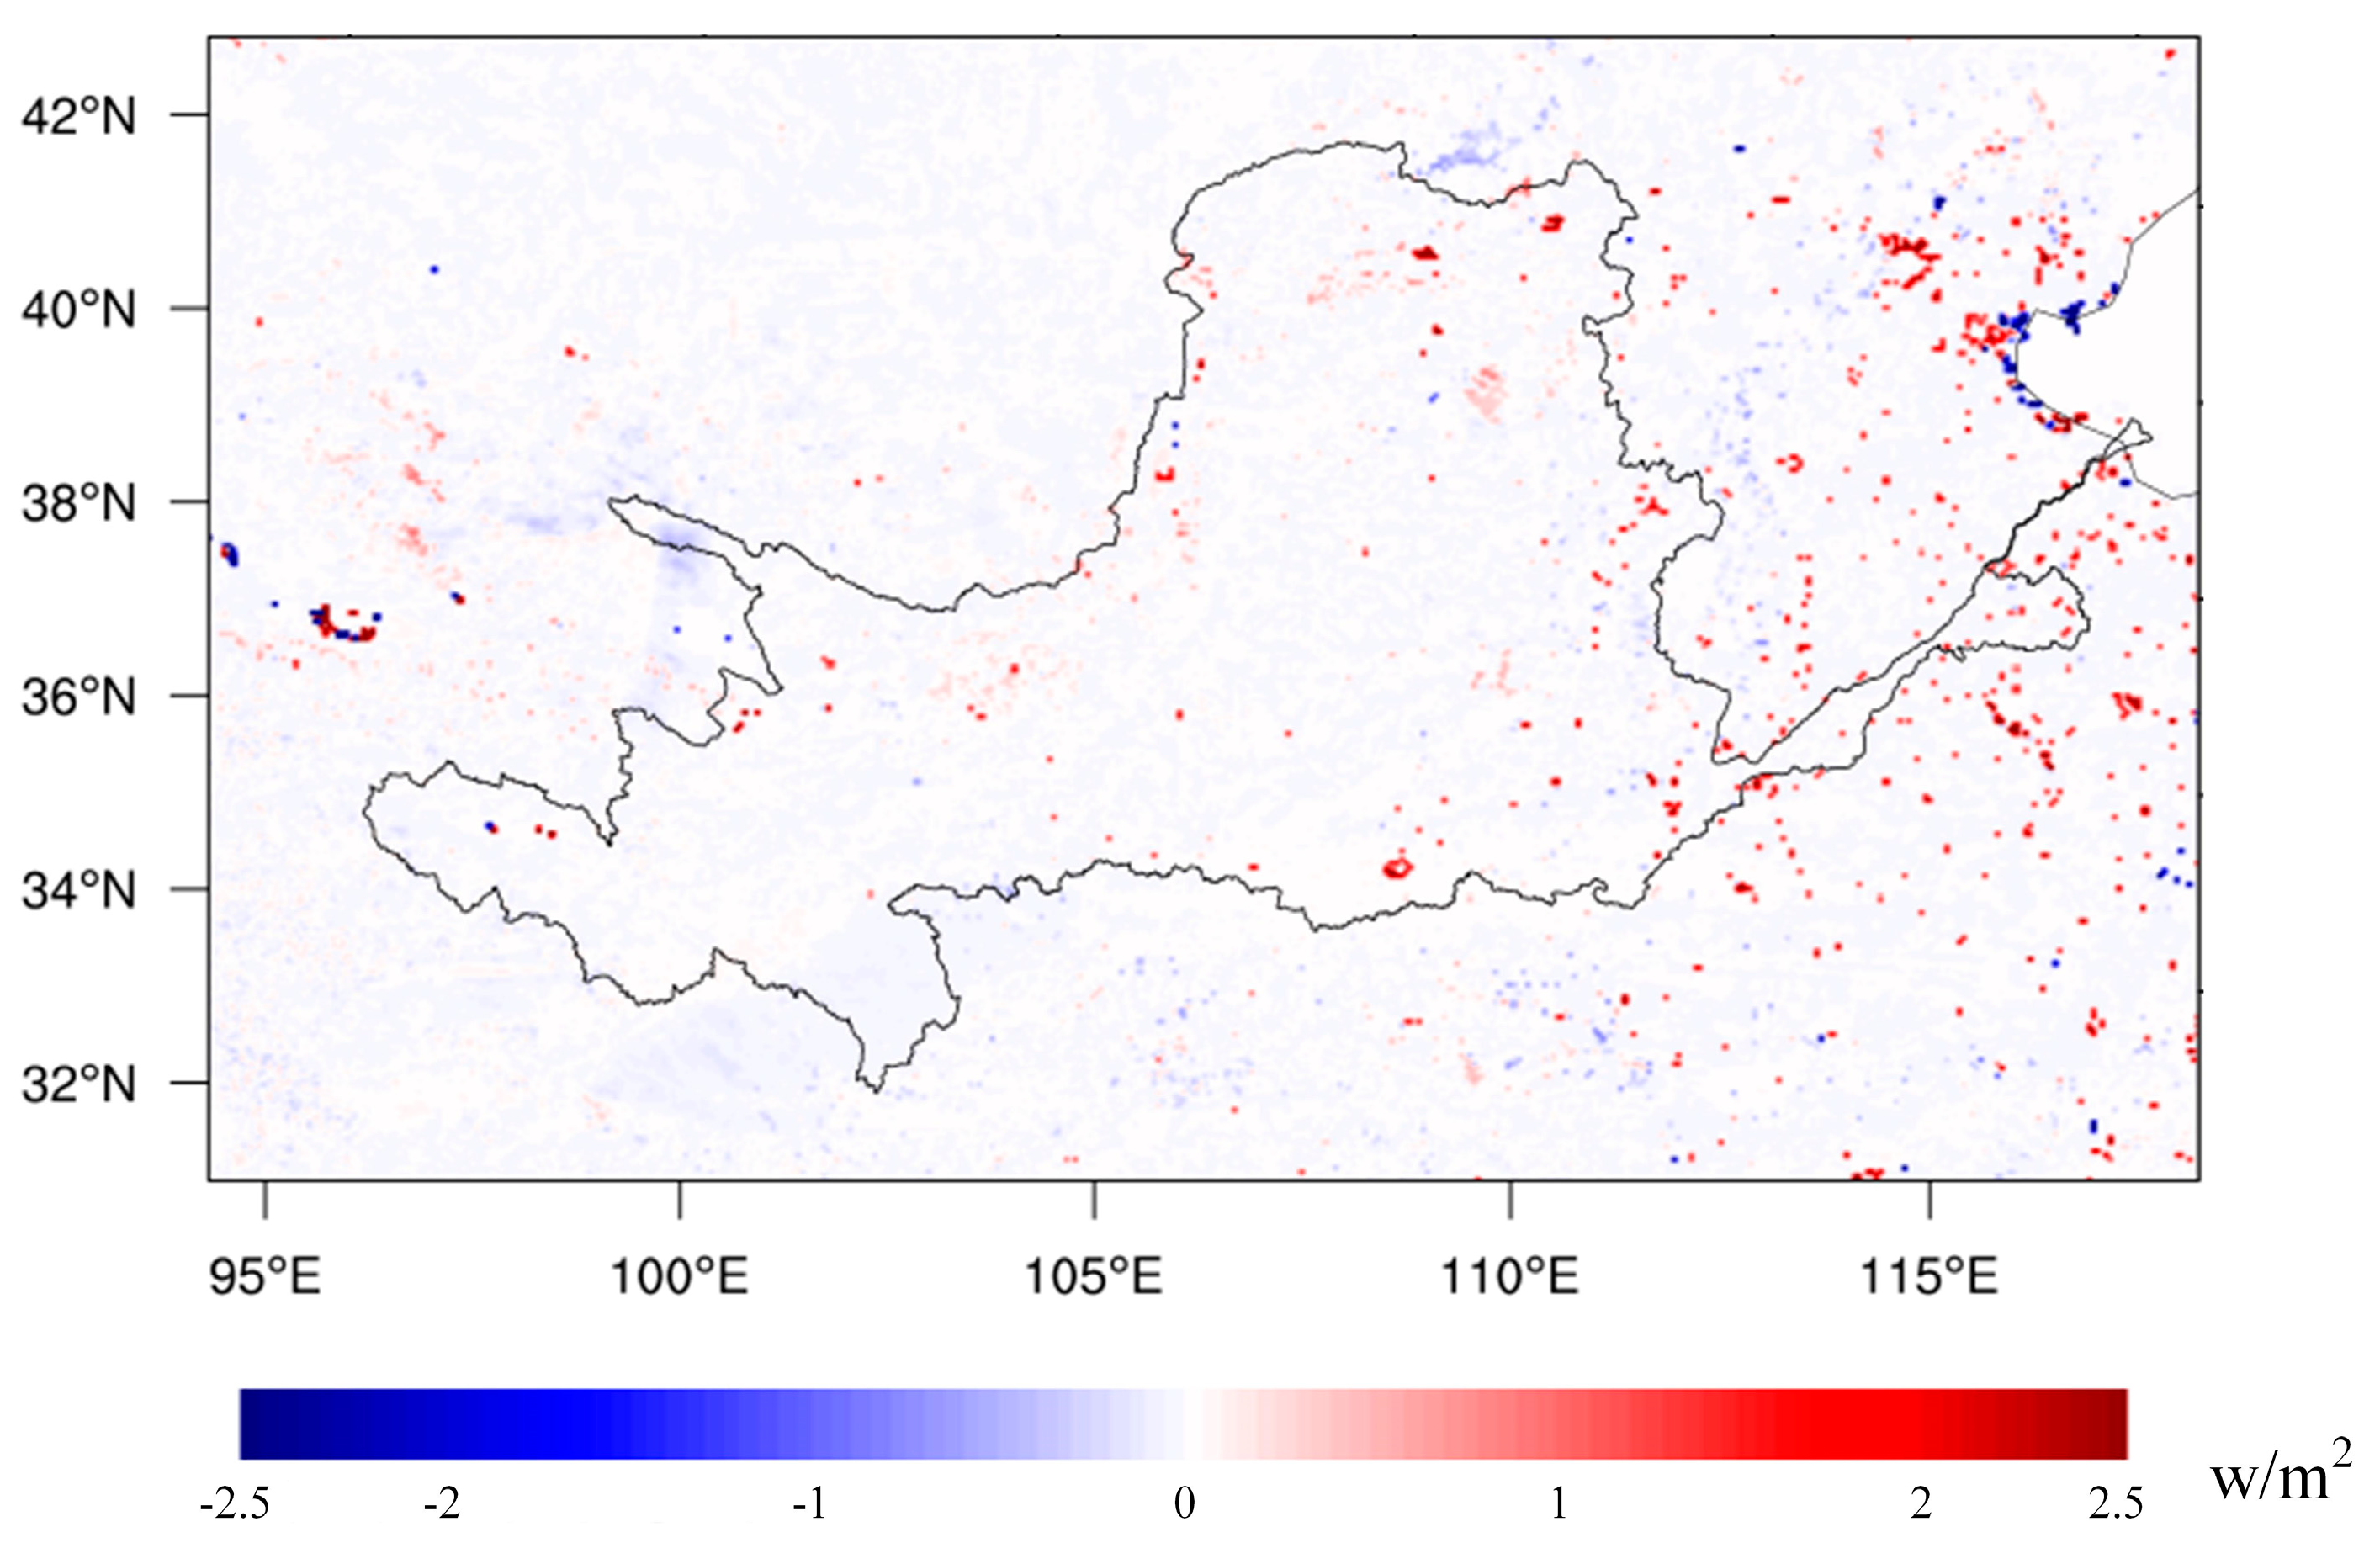
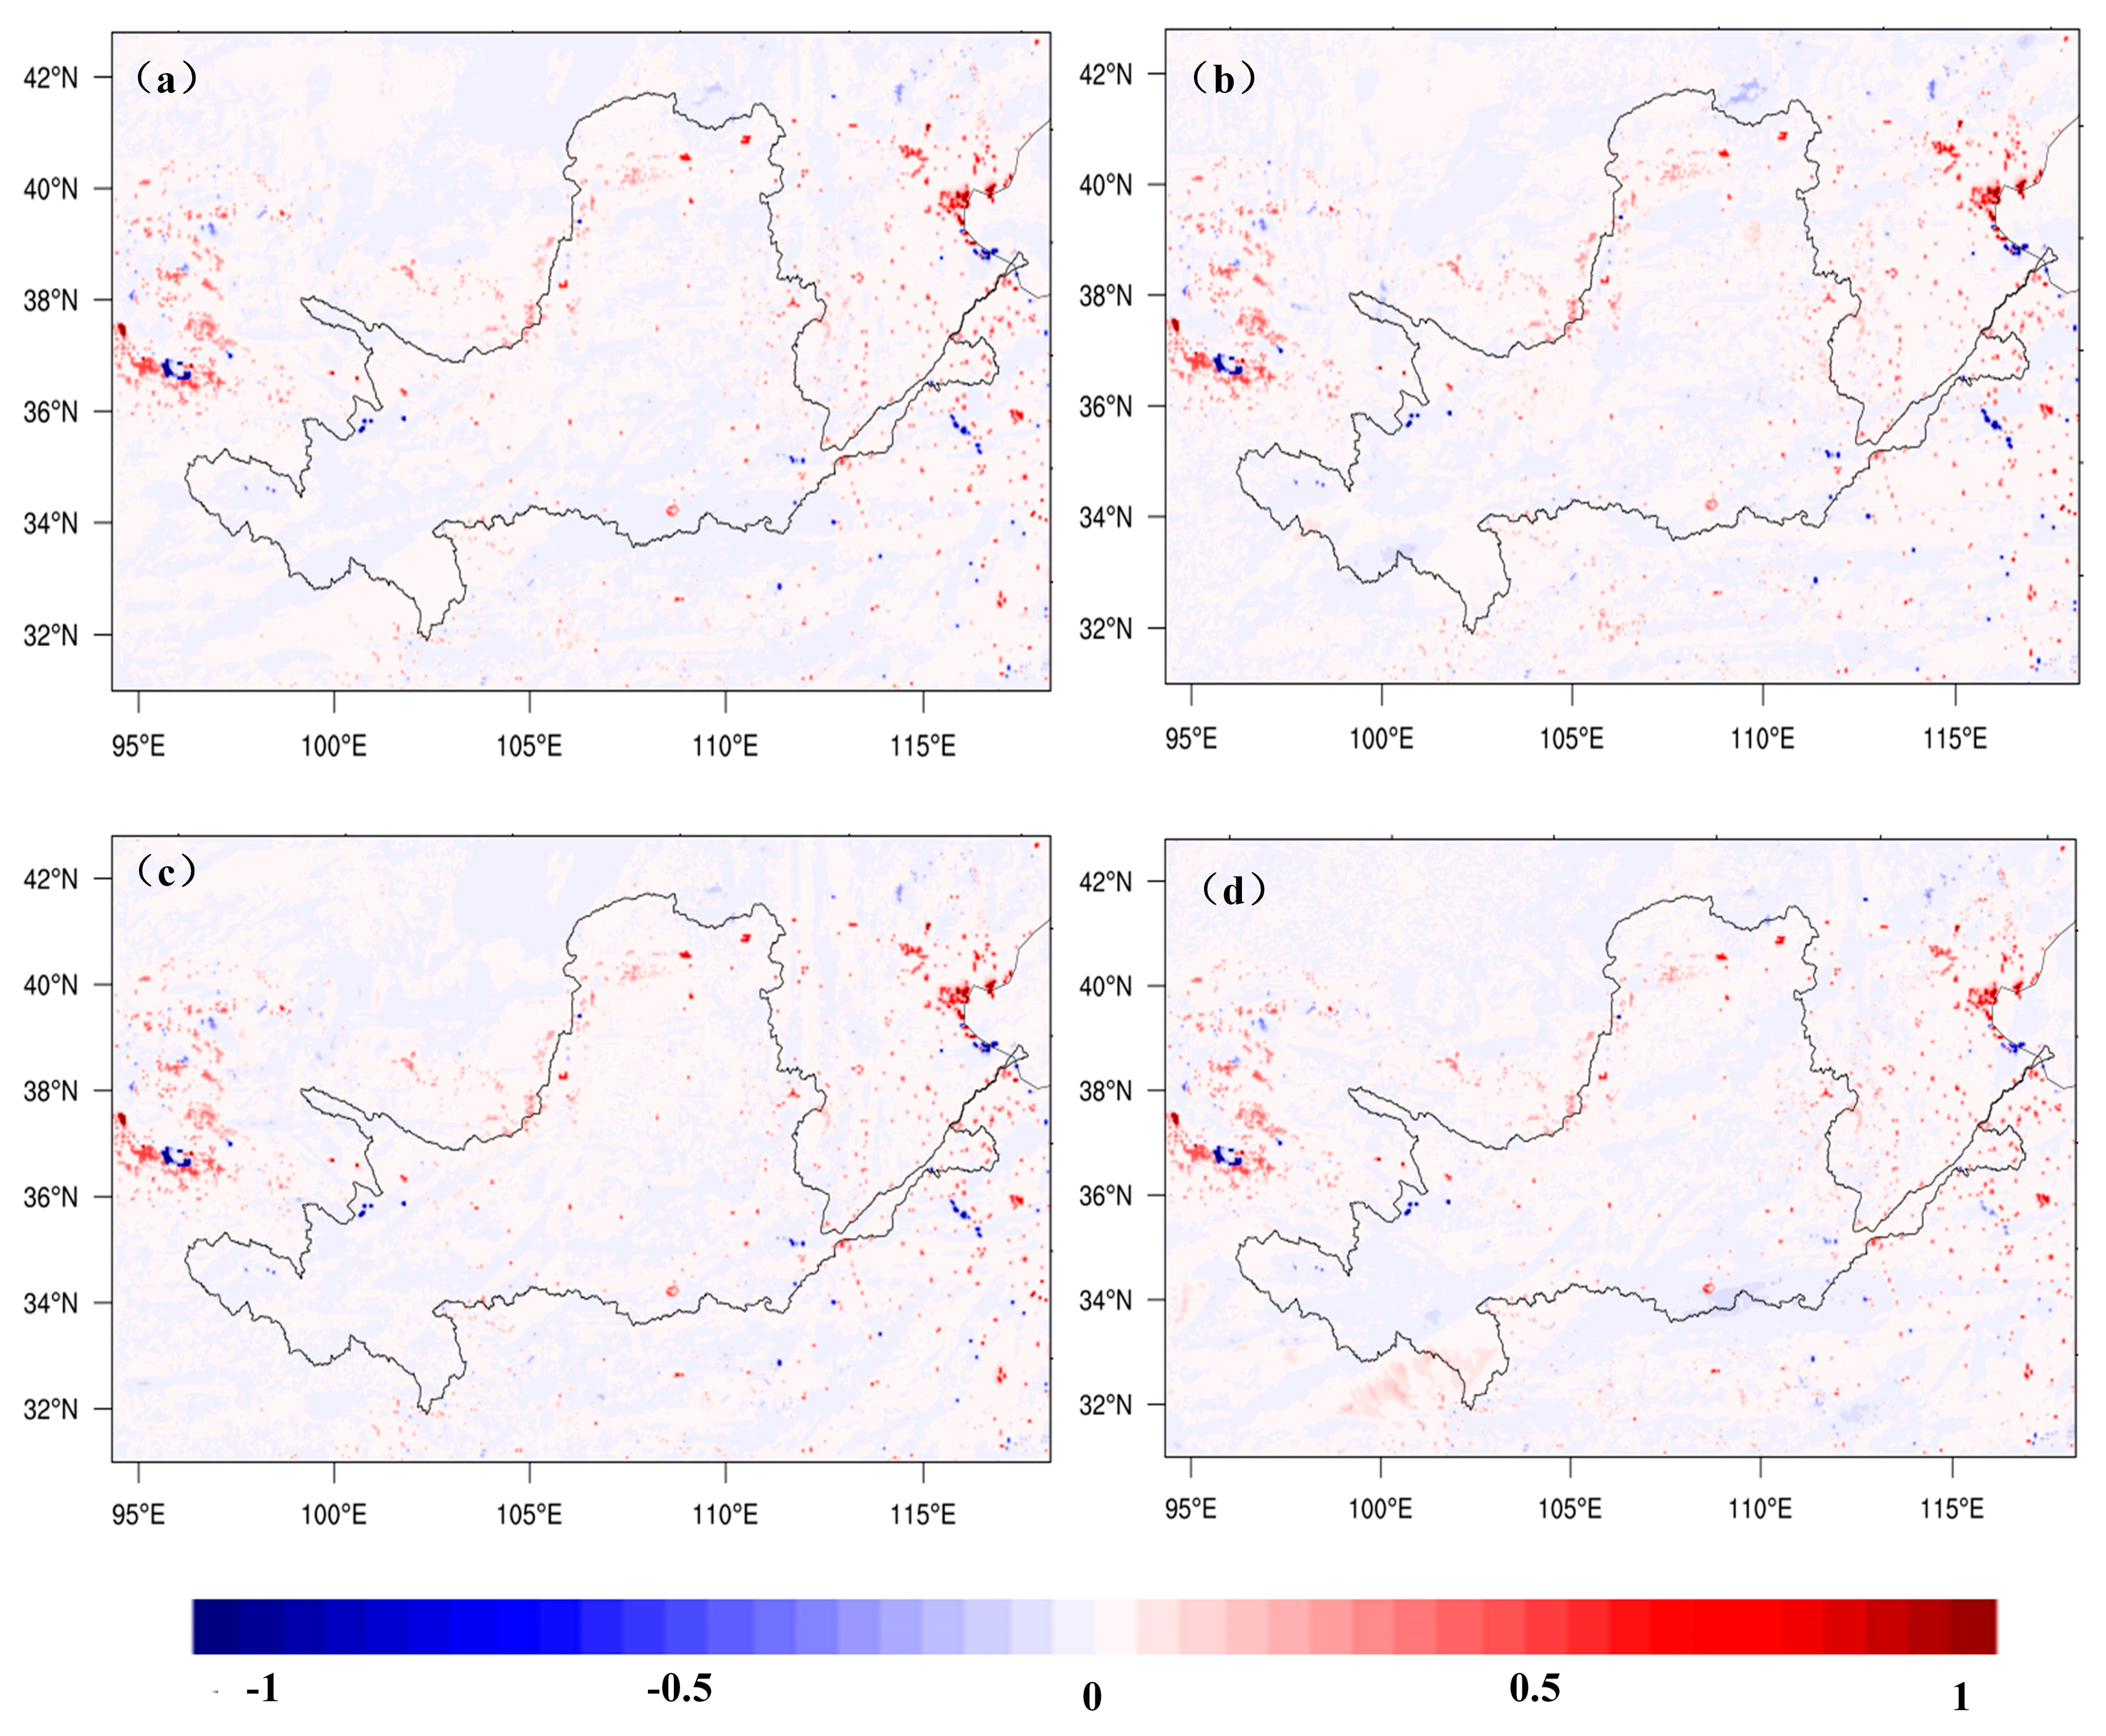
3.3. Impact of LUCC on T2 m

In this study, we used the difference in T2 m between Case2015 and Case1995 (Figure 6) to quantify the impact of LUCC on temperature change in the Yellow River Basin. Figure 7 shows the average summer temperature in the Yellow River Basin under the two scenarios. The results showed that the general trend of T2 m change was rising, especially around the city. The expansion had led to the conversion of a large amount of farmland and grassland around urban areas, and had caused the T2 m in these areas to generally increase by 0.3 to 0.4 °C, and even reach 0.6 to 1 °C in some areas, such as Xi’an, which has a heat island effect due to urban expansion. This phenomenon also appeared in the upper reaches, but the warming effect was weaker than in the middle and lower reaches. This may be because the urban expansion in the upper reaches was more scattered than the middle and lower reaches, and the terrain was more complex [6].
In addition, the extension in the area of grassland and forest had also augmented the T2 m of the Yellow River Basin. Grassland was converted from farmland, bare areas and sparse vegetation, and was distributed in the upper river basin northern region. However, the T2 m changes caused by different conversion categories were clearly different. The T2 m generally increased by around 0.4 °C in the area of bare areas and sparse vegetation turned into grassland. In areas of returning farmland to grassland, although the T2 m increased around 0.2 °C between 1995 and 2015, it was only significant in June. Comparing with grassland, the warming effect of the changed area change in forest was around 0.2 °C, which was not as significant as that in the grassland and was only evident in June and August.
The increased water area decreased the regional T2 m, especially in Qinghai area, where the decrease in T2 m reached around 1 °C. The decline in Henan and Shandong was also around 1 °C, but it slowed down in August and remained at 0.5 °C. In areas where land use and land cover types were not changed, although the T2 fluctuated to a certain extent, the amplitude was weak. The average temperature in urban area and wetland increased by about 0.04 °C and 0.015 °C, while the temperature in forest and other area decreased around 0.005 °C. The temperature change in farmland and grassland was the smallest, and was basically close to zero. This may be because the albedo and other related physical characteristics of the surface had not changed in the areas where the cropland and grassland had not changed, so the impact on temperature was small [64,65]. In addition to this, it may also be due to the bias of the model during the simulation and the influence of the surrounding grid.

4. Discussion

LUCC can change the regional temperature to a certain extent by changing the physical characteristics of the land surface. Although most of the current studies have proved the effect of LUCC on temperature, there were few related studies on the Yellow River Basin. Therefore, this study adopted the WRF model to design two scenario experiments to analyze the effect of LUCC on T2 m in the Yellow River Basin.
The simulation results indicated that urban expansion led to elevated T2 m. It was consistent with previous research [9,66,67,68,69,70]. This phenomenon occurred primarily because the emergence of impervious surfaces such as buildings and roads appeared when urban areas expanded. The impervious surfaces absorbed more solar radiation and heat, disrupting the surface energy balance. The decreased surface latent heat flux and increased surface heat flux (Figure 8 and Figure 9) resulted in the increasing temperature [71,72,73]. The phenomenon of the urban expansion in the Yellow River Basin was not obvious as that in developed urban areas such as Beijing-Tianjin-Hebei, and the distribution was more discrete [74,75]. Therefore, the temperature rise was generally weak except for the fast-growing cities such as Xi’an, where the temperature did rise significantly.
In the area of returning farmland to forest and grassland, there was also a phenomenon of warming. This is because the farmland or bare area became grassland or forest, and changes in surface albedo, LAI and regional vegetation coverage affected regional biophysical processes such as water cycle, transpiration and energy balance [35,76,77]. Previous studies have identified that the impact of forests on climate is very complex and uncertain [78,79]. In this study, we found a phenomenon that afforestation led to an increase in the T2 m, which was contrary to some research conclusions. Some studies have shown that afforestation can exhibit a cooling effect to some extent [80,81,82,83]. It is possibly due to the afforestation leading to the leaves of forests absorbing more sunlight than the original types of land cover, such as cropland or bare land. This would reduce the reflectivity of the land surface, which may reduce the incidence of light reflected from the land surface back into space and cause the temperature to rise. In addition, the afforestation areas in the Yellow River Basin were mainly distributed around urban areas between 1995 and 2015. Urban sprawl caused a significant rise in temperature, which offset the cooling effect of the forest. It was also probable that the relatively small area of afforestation could not bring an obvious reduction in T2 m.
In this study, we quantified the effect of LUCC on the T2 m in the Yellow River Basin based on the WRF model. Urban expansion and returning farmland to forest and grassland could cause T2 m increase in summer. This helps to understand the interaction mechanism between LUCC and temperature. However, we only studied the effect in summer, and did not consider how T2 m changed in other seasons. Therefore, in the follow-up research, further long-term simulation investigations are needed. Moreover, this paper only focused on the changes in T2 m, and did not pay attention to the changes in other climate variables such as precipitation, radiation, wind speed, etc. Therefore, it is necessary to comprehensively evaluate the impact of LUCC on climate change in the future.

5. Conclusions

This study quantified the impact of LUCC on T2 m in the Yellow River Basin. Two scenarios were designed and the simulation results were compared with the observed data to evaluate the simulation performance of the WRF model. The main conclusions are as follows: (1) The correlation coefficient reached 0.93, indicating that the WRF model can generally capture the summer temperature changes in the Yellow River Basin. (2) The simulation results showed that LUCC led to an overall increase trend in summer T2 m in the Yellow River Basin. The expansion of the cities has caused the temperature in its surrounding to generally rise by around 0.3 °C–0.6 °C. The warming effect also appeared in the area of returning farmland to forest and grassland, with the temperature rising by about 0.4 °C. However, the warming effect was most obvious in June and August. In addition to this, the increase in water area caused the temperature to decrease by around 0.8 °C.

Author Contributions

Conceptualization, H.S. and H.X.; methodology, H.S. and S.Z.; software, X.R., Y.W. and H.Z.; validation, X.R. and Y.W.; formal analysis, H.Z. and L.Q.; investigation, L.Q.; resources, X.R.; data curation, X.R. and R.M.; writing—original draft preparation, X.R.; writing—review and editing, H.S., S.Z. and H.X.; visualization, R.M., H.Z. and X.R.; supervision, H.S., H.X. and S.Z.; project administration, H.S.; funding acquisition, H.S. All authors have read and agreed to the published version of the manuscript.

Funding

This research was funded by the Training Plan for Young Backbone Teachers in Colleges and Universities in Henan Province, China (2021GGJS024), the National Natural Science Foundation of China, China (32130066, 41871316), and the Youth Talent Program of Henan University, China.

Data Availability Statement

The datasets generated during the current study are available from the corresponding authors on reasonable request.

Acknowledgments

We the authors thank the Super Computing Center of Zhengzhou, China.

Conflicts of Interest

The authors declare no conflict of interest.

References

  1. Cao, Q.; Yu, D.Y.; Georgescu, M.; Han, Z.; Wu, J.G. Impacts of land use and land cover change on regional climate: A case study in the agro-pastoral transitional zone of China. Environ. Res. Lett. 2015, 10, 124025. [Google Scholar] [CrossRef]
  2. Feddema, J.J.; Oleson, K.W.; Bonan, G.B.; Mearns, L.O.; Buja, L.E.; Meehl, G.A.; Washington, W.M. The importance of land-cover change in simulating future climates. Science 2005, 310, 1674–1678. [Google Scholar] [CrossRef] [PubMed]
  3. Foley, J.A.; DeFries, R.; Asner, G.P.; Barford, C.; Bonan, G.; Carpenter, S.R.; Chapin, F.S.; Coe, M.T.; Daily, G.C.; Gibbs, H.K.; et al. Global Consequences of Land Use. Science 2005, 309, 570–574. [Google Scholar] [CrossRef]
  4. Turner, B.L.; Lambin, E.F.; Reenberg, A. The emergence of land change science for global environmental change and sustainability. Proc. Natl. Acad. Sci. USA 2007, 104, 20666–20671. [Google Scholar] [CrossRef] [PubMed]
  5. Deng, X.Z.; Zhao, C.H.; Yan, H.M. Systematic Modeling of Impacts of Land Use and Land Cover Changes on Regional Climate: A Review. Adv. Meteorol. 2013, 2013, 317678. [Google Scholar] [CrossRef]
  6. Li, D.; Tian, P.P.; Luo, H.Y.; Hu, T.S.; Dong, B.; Cui, Y.L.; Khan, S.; Luo, Y.F. Impacts of land use and land cover changes on regional climate in the Lhasa River basin, Tibetan Plateau. Sci. Total Environ. 2020, 742, 140570. [Google Scholar] [CrossRef]
  7. Chen, L.; Ma, Z.G.; Zhao, T.B. Modeling and analysis of the potential impacts on regional climate due to vegetation degradation over arid and semi-arid regions of China. Clim. Chang. 2017, 144, 461–473. [Google Scholar] [CrossRef]
  8. Hua, W.J.; Chen, H.S.; Sun, S.L.; Zhou, L.M. Assessing climatic impacts of future land use and land cover change projected with the CanESM2 model. Int. J. Climatol. 2015, 35, 3661–3675. [Google Scholar] [CrossRef]
  9. Chi, Q.; Zhou, S.H.; Wang, L.J.; Zhu, M.Y.; Liu, D.D.; Tang, W.C.; Cui, Y.P.; Lee, J. Exploring on the Eco-Climatic Effects of Land Use Changes in the Influence Area of the Yellow River Basin from 2000 to 2015. Land 2021, 10, 601. [Google Scholar] [CrossRef]
  10. Lama, G.F.C.; Crimaldi, M. Remote Sensing of Ecohydrological, Ecohydraulic, and Ecohydrodynamic Phenomena in Vegetated Waterways: The Role of Leaf Area Index (LAI). Biol. Life Sci. Forum 2021, 3, 54. [Google Scholar]
  11. Hua, W.J.; Chen, H.S.; Li, X. Effects of future land use change on the regional climate in China. Sci. China Earth Sci. 2015, 58, 1840–1848. [Google Scholar] [CrossRef]
  12. Li, X.; Chen, H.S.; Liao, H.; Hua, W.J.; Sun, S.L.; Ma, H.D.; Li, X.; Gao, C.J.; Zhu, S.G. Potential effects of land cover change on temperature extremes over Eurasia: Current versus historical experiments. Int. J. Climatol. 2017, 37, 59–74. [Google Scholar] [CrossRef]
  13. Bonan, G.B. Observational evidence for reduction of daily maximum temperature by croplands in the Midwest United States. J. Clim. 2001, 14, 2430–2442. [Google Scholar] [CrossRef]
  14. Du, H.B.; He, H.S.; Wu, Z.F.; Wang, L.; Zong, S.W.; Liu, J. Human influences on regional temperature change-comparing adjacent plains of China and Russia. Int. J. Climatol. 2017, 37, 2913–2922. [Google Scholar] [CrossRef]
  15. Shi, H.Y.; Chen, J. Characteristics of climate change and its relationship with land use/cover change in Yunnan Province, China. Int. J. Climatol. 2018, 38, 2520–2537. [Google Scholar] [CrossRef]
  16. Mortoja, M.G.; Yigitcanlar, T. Local Drivers of Anthropogenic Climate Change: Quantifying the Impact through a Remote Sensing Approach in Brisbane. Remote Sens. 2020, 12, 3938. [Google Scholar] [CrossRef]
  17. Zhao, W.; Xiong, D.H.; Wen, F.P.; Wang, X.D. Lake area monitoring based on land surface temperature in the Tibetan Plateau from 2000 to 2018. Environ. Res. Lett. 2020, 15, 084033. [Google Scholar] [CrossRef]
  18. Zhou, D.C.; Xiao, J.F.; Frolking, S.; Liu, S.G.; Zhang, L.X.; Cui, Y.P.; Zhou, G.Y. Croplands intensify regional and global warming according to satellite observations. Remote Sens. Environ. 2021, 264, 112585. [Google Scholar] [CrossRef]
  19. Yu, L.X.; Liu, T.X. The Impact of Artificial Wetland Expansion on Local Temperature in the Growing Season-the Case Study of the Sanjiang Plain, China. Remote Sens. 2019, 11, 2915. [Google Scholar] [CrossRef]
  20. Du, J.Y.; Watts, J.D.; Jiang, L.M.; Lu, H.; Cheng, X.; Duguay, C.; Farina, M.; Qiu, Y.B.; Kim, Y.; Kimball, J.S.; et al. Remote Sensing of Environmental Changes in Cold Regions: Methods, Achievements and Challenges. Remote Sens. 2019, 11, 1952. [Google Scholar] [CrossRef]
  21. Yang, J.; Gong, P.; Fu, R.; Zhang, M.H.; Chen, J.M.; Liang, S.L.; Xu, B.; Shi, J.C.; Dickinson, R. The role of satellite remote sensing in climate change studies. Nat. Clim. Chang. 2013, 3, 875–883. [Google Scholar] [CrossRef]
  22. Kong, X.H.; Wang, A.H.; Bi, X.Q.; Wang, D. Assessment of Temperature Extremes in China Using RegCM4 and WRF. Adv. Atmos. Sci. 2019, 36, 363–377. [Google Scholar] [CrossRef]
  23. Fita, L.; Evans, J.P.; Argueso, D.; King, A.; Liu, Y. Evaluation of the regional climate response in Australia to large-scale climate modes in the historical NARCliM simulations. Clim. Dynam. 2017, 49, 2815–2829. [Google Scholar] [CrossRef]
  24. Rummukainen, M. State-of-the-art with regional climate models. Wires Clim. Chang. 2010, 1, 82–96. [Google Scholar] [CrossRef]
  25. Liu, C.H.; Ikeda, K.; Rasmussen, R.; Barlage, M.; Newman, A.J.; Prein, A.F.; Chen, F.; Chen, L.; Clark, M.; Dai, A.G.; et al. Continental-scale convection-permitting modeling of the current and future climate of North America. Clim. Dynam. 2017, 49, 71–95. [Google Scholar] [CrossRef]
  26. He, H.L.; Hamdi, R.; Cai, P.; Luo, G.P.; Ochege, F.U.; Zhang, M.; Termonia, P.; De Maeyer, P.; Li, C.F. Impacts of Historical Land Use/Cover Change (1980–2015) on Summer Climate in the Aral Sea Region. J. Geophys. Res. Atmos. 2021, 126, e2020JD032638. [Google Scholar] [CrossRef]
  27. Chu, X.L.; Lu, Z.; Wei, D.; Lei, G.P. Effects of land use/cover change (LUCC) on the spatiotemporal variability of precipitation and temperature in the Songnen Plain, China. J. Integr. Agr. 2022, 21, 235–248. [Google Scholar] [CrossRef]
  28. Wang, M.N.; Han, Z.; Zhang, Q.Y. Impact of Land Use and Cover Change in the Semi-arid Regions of China on the Temperature in the Early 21st Century. Clim. Environ. Res. 2016, 21, 65–77. [Google Scholar]
  29. Yang, S.T.; Liu, C.M.; Sun, R. The Vegetation Cover over Last 20 Years in Yellow River Basin. Axta Geogr. Sin. 2002, 57, 679–684. [Google Scholar]
  30. Zhao, X.Y.; Xia, H.M.; Pan, L.; Song, H.Q.; Niu, W.H.; Wang, R.M.; Li, R.M.; Bian, X.Q.; Guo, Y.; Qin, Y.C. Drought Monitoring over Yellow River Basin from 2003–2019 Using Reconstructed MODIS Land Surface Temperature in Google Earth Engine. Remote Sens. 2021, 13, 3748. [Google Scholar] [CrossRef]
  31. Wang, H.; Sun, F.B.; Xia, J.; Liu, W.B. Impact of LUCC on streamflow based on the SWAT model over the Wei River basin on the Loess Plateau in China. Hydrol. Earth Syst. Sci. 2017, 21, 1929–1945. [Google Scholar] [CrossRef]
  32. Yaseen, Z.M. An insight into machine learning models era in simulating soil, water bodies and adsorption heavy metals: Review, challenges and solutions. Chemosphere 2021, 277, 130126. [Google Scholar] [CrossRef] [PubMed]
  33. Wu, J.L.; Xiao, H.; Paterson, E. Physics-informed machine learning approach for augmenting turbulence models: A com-prehensive framework. Phy. Rev. Fluids 2018, 3, 074602. [Google Scholar] [CrossRef] [Green Version]
  34. Mahmood, M.I.; Elagib, N.A.; Horn, F.; Saad, S.A.G. Lessons learned from Khartoum flash flood impacts: An integrated assessment. Sci. Total Environ. 2017, 601–602, 1031–1045. [Google Scholar] [CrossRef] [PubMed]
  35. Liu, Z.J.; Liu, Y.S.; Baig, M.H.A. Biophysical effect of conversion from croplands to grasslands in water-limited temperate regions of China. Sci. Total Environ. 2019, 648, 315–324. [Google Scholar] [CrossRef] [PubMed]
  36. Li, Z.Y.; Wu, W.Z.; Liu, X.H.; Fath, B.D.; Sun, H.L.; Liu, X.C.; Xiao, X.R.; Cao, J. Land use/cover change and regional climate change in an arid grassland ecosystem of Inner Mongolia, China. Ecol. Model 2017, 353, 86–94. [Google Scholar] [CrossRef]
  37. Deng, X.Z.; Shi, Q.L.; Zhang, Q.; Shi, C.C.; Yin, F. Impacts of land use and land cover changes on surface energy and water balance in the Heihe River Basin of China, 2000–2010. Phys. Chem. Earth 2015, 79–82, 2–10. [Google Scholar] [CrossRef]
  38. Zhang, X.L.; Xiong, Z.; Zhang, X.Z.; Shi, Y.; Liu, J.Y.; Shao, Q.Q.; Yan, X.D. Simulation of the climatic effects of land use/land cover changes in eastern China using multi-model ensembles. Glob. Planet Chang. 2017, 154, 1–9. [Google Scholar] [CrossRef]
  39. Yang, L.S.; Feng, Q.; Yin, Z.L.; Wen, X.H.; Si, J.H.; Li, C.B.; Deo, R.C. Identifying separate impacts of climate and land use/cover change on hydrological processes in upper stream of Heihe River, Northwest China. Hydrol. Process. 2017, 31, 1100–1112. [Google Scholar] [CrossRef]
  40. Ji, G.X.; Lai, Z.Z.; Xia, H.B.; Liu, H.; Wang, Z. Future Runoff Variation and Flood Disaster Prediction of the Yellow River Basin Based on CA-Markov and SWAT. Land 2021, 10, 421. [Google Scholar] [CrossRef]
  41. Yuan, Z.; Yan, D.H.; Yang, Z.Y.; Xu, J.J.; Huo, J.J.; Zhou, Y.L.; Zhang, C. Attribution assessment and projection of natural runoff change in the Yellow River Basin of China. Mitig. Adapt. Strateg. Glob. Chang. 2018, 23, 27–49. [Google Scholar] [CrossRef]
  42. Wang, F.; Ge, Q.S.; Yu, Q.B.; Wang, H.X.; Xu, X.L. Impacts of land-use and land-cover changes on river runoff in Yellow River basin for period of 1956–2012. Chin. Geogr. Sci. 2017, 27, 13–24. [Google Scholar] [CrossRef]
  43. Delfino, R.J.; Kleeman, M.J.; Gillen, D.; Wu, J.; Nickerson, B. Powers. A Description of the Advanced Research WRF Version 3; NCAR/TN–475+STR; University Corporation for Atmospheric Research: Boulder, CO, USA, 2008. [Google Scholar]
  44. Zhang, X.L.; Xiong, Z.; Zhang, X.Z.; Shi, Y.; Liu, J.Y.; Shao, Q.Q.; Yan, X.D. Using multi-model ensembles to improve the simulated effects of land use/cover change on temperature: A case study over northeast China. Clim. Dynam. 2016, 46, 765–778. [Google Scholar] [CrossRef]
  45. Senatore, A.; Mendicino, G.; Gochis, D.J.; Yu, W.; Yates, D.N.; Kunstmann, H. Fully coupled atmosphere-hydrology simulations for the central Mediterranean: Impact of enhanced hydrological parameterization for short and long time scales. J. Adv. Model. Earth Syst. 2015, 7, 1693–1715. [Google Scholar] [CrossRef]
  46. Kusaka, H.; Chen, F.; Tewari, M.; Dudhia, J.; Gill, D.O.; Duda, M.G.; Wang, W.; Miya, Y. Numerical Simulation of Urban Heat Island Effect by the WRF Model with 4-km Grid Increment: An Inter-Comparison Study between the Urban Canopy Model and Slab Model. J. Meteorol. Soc. JPN 2012, 90B, 33–45. [Google Scholar] [CrossRef]
  47. Giorgi, F. Thirty Years of Regional Climate Modeling: Where Are We and Where Are We Going next? J. Geophys. Res. Atmos. 2019, 124, 5696–5723. [Google Scholar] [CrossRef]
  48. Qu, Y.; Wu, F.; Yan, H.M.; Shu, B.R.; Deng, X.Z. Possible Influence of the Cultivated Land Reclamation on Surface Climate in India: A WRF Model Based Simulation. Adv. Meteorol. 2013, 2013, 312716. [Google Scholar] [CrossRef]
  49. Liu, X.M.; Song, H.Q.; Lei, T.J.; Liu, P.F.; Xu, C.D.; Wang, D.; Yang, Z.L.; Xia, H.M.; Wang, T.H.; Zhao, H.P. Effects of natural and anthropogenic factors and their interactions on dust events in Northern China. Catena 2021, 196, 104919. [Google Scholar] [CrossRef]
  50. Chen, W.X.; Meng, H.; Song, H.Q.; Zheng, H. Progress in Dust Modelling, Global Dust Budgets, and Soil Organic Carbon Dynamics. Land 2022, 11, 176. [Google Scholar] [CrossRef]
  51. Chen, F.; Dudhia, J. Coupling an advanced land surface-hydrology model with the Penn State-NCAR MM5 modeling system. Part I: Model implementation and sensitivity. Mon. Weather Rev. 2001, 129, 569–585. [Google Scholar] [CrossRef]
  52. Janjić, Z.I. The Step-Mountain Eta Coordinate Model: Further Developments of the Convection, Viscous Sublayer, and Turbulence Closure Schemes. Mon. Weather Rev. 1994, 122, 927–945. [Google Scholar] [CrossRef]
  53. Janjić, Z.I. Comments on “Development and Evaluation of a Convection Scheme for Use in Climate Models”. J. Atmos. Sci. 2000, 57, 3686. [Google Scholar] [CrossRef]
  54. Lin, L.J. Bulk Parameterization of the Snow Field in a Cloud Model. J. Appl. Meteorol. Clim. 1983, 22, 1065–1092. [Google Scholar] [CrossRef]
  55. Chou, M.D.; Suare, M.J. An Efficient Thermal Infrared Radiation Parameterization for Use in General Circulation Models; Citeseer: Princeton, NJ, USA, 1994. [Google Scholar]
  56. Chou, M.D.; Suare, M.J. A Solar Radiation Parameterization (CLIRAD-SW) for Atmospheric Studies; NASA Tech: Washington, DC, USA, 1996. [Google Scholar]
  57. Song, H.Q.; Wang, K.; Zhang, Y.; Hong, C.P.; Zhou, S.H. Simulation and evaluation of dust emissions with WRF-Chem (v3.7.1) and its relationship to the changing climate over East Asia from 1980 to 2015. Atmos. Environ. 2017, 167, 511–522. [Google Scholar] [CrossRef]
  58. Min, R.; Wang, F.; Wang, Y.; Song, G.; Zheng, H.; Zhang, H.; Ru, X.; Song, H. Contribution of local and surrounding area anthropogenic emissions to a high ozone episode in Zhengzhou, China. Environ. Res. 2022, 212, 113440. [Google Scholar] [CrossRef] [PubMed]
  59. Sadeghifar, T.; Lama, G.F.C.; Sihag, P.; Bayram, A.; Kisi, O. Wave height predictions in complex sea flows through soft-computing models: Case study of Persian Gulf. Ocean. Eng. 2022, 245, 110467. [Google Scholar] [CrossRef]
  60. Wen, X.H.; Lu, S.H.; Jin, J.M. Integrating Remote Sensing Data with WRF for Improved Simulations of Oasis Effects on Local Weather Processes over an Arid Region in Northwestern China. J. Hydrometeorol. 2012, 13, 573–587. [Google Scholar] [CrossRef]
  61. Politi, N.; Vlachogiannis, D.; Sfetsos, A.; Nastos, P.T. High-resolution dynamical downscaling of ERA-Interim temperature and precipitation using WRF model for Greece. Clim. Dynam. 2021, 57, 799–825. [Google Scholar] [CrossRef]
  62. Hu, Y.; Zhang, X.Z.; Mao, R.; Gong, D.Y.; Liu, H.B.; Yang, J. Modeled responses of summer climate to realistic land use/cover changes from the 1980s to the 2000s over eastern China. J. Geophys. Res. Atmos. 2015, 120, 167–179. [Google Scholar] [CrossRef]
  63. National Development and Reform Commission (NDRC); Ministry of Water Resources (MWR); Ministry of Agriculture (MA); State Forestry Administration (SFA). People’s Republic of China (2010) Programming for Comprehensive Management of the Loess Plateau (2010–2030); NDRC/MWR/MA/SFA: Beijing, China, 2010; Volume 69, pp. 8–10. [Google Scholar]
  64. Wang, M.N.; Xiong, Z.; Yan, X.D. Modeling the climatic effects of the land use/cover change in eastern China. Phys. Chem. Earth 2015, 87, 97–107. [Google Scholar] [CrossRef]
  65. Zhai, J.; Shao, Q.; Liu, J. Impact Analysis of Climate Change from Land Use/Cover Change in Inner Mongolia Plateau. J. Nat. Resour. 2014, 29, 967–978. [Google Scholar]
  66. Zhou, X.F.; Chen, H. Impact of urbanization-related land use land cover changes and urban morphology changes on the urban heat island phenomenon. Sci. Total Environ. 2018, 635, 1467–1476. [Google Scholar] [CrossRef] [PubMed]
  67. Cao, Q.; Yu, D.Y.; Georgescu, M.; Wu, J.G. Impacts of urbanization on summer climate in China: An assessment with coupled land-atmospheric modeling. J. Geophys. Res. Atmos. 2016, 121, 10505–10521. [Google Scholar] [CrossRef]
  68. Lin, L.J.; Gao, T.; Luo, M.; Ge, E.J.; Yang, Y.J.; Liu, Z.; Zhao, Y.Q.; Ning, G.C. Contribution of urbanization to the changes in extreme climate events in urban agglomerations across China. Sci. Total Environ. 2020, 744, 140264. [Google Scholar] [CrossRef] [PubMed]
  69. Chen, F.; Kusaka, H.; Bornstein, R.; Ching, J.; Grimmond, C.S.B.; Grossman-Clarke, S.; Loridan, T.; Manning, K.W.; Martilli, A.; Miao, S.G.; et al. The integrated WRF/urban modelling system: Development, evaluation, and applications to urban environmental problems. Int. J. Climatol. 2011, 31, 273–288. [Google Scholar] [CrossRef]
  70. Chen, X.L.; Zhao, H.M.; Li, P.X.; Yin, Z.Y. Remote sensing image-based analysis of the relationship between urban heat island and land use/cover changes. Remote Sens. Environ. 2006, 104, 133–146. [Google Scholar] [CrossRef]
  71. Chen, B.; Chen, G.Q. Emergy-based energy and material metabolism of the Yellow River basin. Commun. Nonlinear Sci. 2009, 14, 923–934. [Google Scholar] [CrossRef]
  72. Chen, H.S.; Zhang, Y. Sensitivity experiments of impacts of large-scale urbanization in East China on East Asian winter monsoon. Chin. Sci. Bull. 2013, 58, 809–815. [Google Scholar] [CrossRef]
  73. Feng, J.M.; Wang, Y.L.; Ma, Z.G. Long-term simulation of large-scale urbanization effect on the East Asian monsoon. Clim. Chang. 2015, 129, 511–523. [Google Scholar] [CrossRef]
  74. Li, J.Y.; Zheng, X.Q.; Zhang, C.X.; Chen, Y.M. Impact of Land-Use and Land-Cover Change on Meteorology in the Beijing-Tianjin-Hebei Region from 1990 to 2010. Sustainability 2018, 10, 176. [Google Scholar] [CrossRef]
  75. Wang, M.N.; Zhang, X.Z.; Yan, X.D. Modeling the climatic effects of urbanization in the Beijing-Tianjin-Hebei metropolitan area. Theor. Appl. Climatol. 2013, 113, 377–385. [Google Scholar] [CrossRef]
  76. Wang, L.; Cheung, K.K.W. Potential impact of reforestation programmes and uncertainties in land cover effects over the loess plateau: A regional climate modeling study. Clim. Chang. 2017, 144, 475–490. [Google Scholar] [CrossRef]
  77. Li, Y.; Zhao, M.S.; Mildrexler, D.J.; Motesharrei, S.; Mu, Q.Z.; Kalnay, E.; Zhao, F.; Li, S.C.; Wang, K.C. Potential and Actual impacts of deforestation and afforestation on land surface temperature. J. Geophys. Res. Atmos. 2016, 121, 14372–14386. [Google Scholar] [CrossRef]
  78. Griscom, B.W.; Adams, J.; Ellis, P.W.; Houghton, R.A.; Lomax, G.; Miteva, D.A.; Schlesinger, W.H.; Shoch, D.; Siikamaki, J.V.; Smith, P.; et al. Natural climate solutions. Proc. Natl. Acad. Sci. USA 2017, 114, 11645–11650. [Google Scholar] [CrossRef] [Green Version]
  79. Welch, B.; Gauci, V.; Sayer, E.J. Tree stem bases are sources of CH4 and N2O in a tropical forest on upland soil during the dry to wet season transition. Glob. Chang. Bio. 2019, 25, 361–372. [Google Scholar] [CrossRef]
  80. Zhang, L.J.; Pan, T.; Zhang, H.W.; Li, X.X.; Jiang, L.Q. The Effects of Forest Area Changes on Extreme Temperature Indexes between the 1900s and 2010s in Heilongjiang Province, China. Remote Sens. 2017, 9, 1280. [Google Scholar] [CrossRef]
  81. Su, Y.X.; Liu, L.Y.; Wu, J.P.; Chen, X.Z.; Shang, J.L.; Ciais, P.; Zhou, G.Y.; Lafortezza, R.; Wang, Y.P.; Yuan, W.P.; et al. Quantifying the biophysical effects of forests on local air temperature using a novel three-layered land surface energy balance model. Environ. Int. 2019, 132, 105080. [Google Scholar] [CrossRef]
  82. Shen, W.J.; Li, M.S.; Huang, C.Q.; He, T.; Tao, X.; Wei, A.S. Local land surface temperature change induced by afforestation based on satellite observations in Guangdong plantation forests in China. Agr. Forest Meteorol. 2019, 276, 107641. [Google Scholar] [CrossRef]
  83. Alkama, R.; Cescatti, A. Biophysical climate impacts of recent changes in global forest cover. Science 2016, 351, 600–604. [Google Scholar] [CrossRef] [Green Version]
Figure 1. Location of the Yellow River Basin in China.
Remotesensing 14 04352 g001
Figure 2. Two nested model domains used in WRF simulation.
Remotesensing 14 04352 g002
Figure 3. Comparison of OBS with the simulation results of three random stations in Case2015 ((ac) is LISHI station; (df) is DARLAG station; (gi) is HALIUT station). The red line represents the OBS, the green line represents the simulated data.
Remotesensing 14 04352 g003
Figure 4. Land use and land cover map for 2015 (a) and 1995 (b).
Remotesensing 14 04352 g004
Figure 5. Land use and land cover change between 1995 and 2015 in the Yellow River Basin.
Remotesensing 14 04352 g005
Figure 6. Average T2 m differences between two experiments (Case2015–Case1995): (a) summer; (b) June; (c) July; (d) August.
Remotesensing 14 04352 g006
Figure 7. Average T2 m in June, July, and August: (a) Case2015; (b) Case1995.
Remotesensing 14 04352 g007
Figure 8. Difference in average ground heat flux between two experiments (Case2015–Case 1995).
Remotesensing 14 04352 g008
Figure 9. Difference in average latent heat flux between two experiments (Case2015–Case 1995).
Remotesensing 14 04352 g009
Table 1. The mainly physical parameterization schemes in WRF model.
Physical ProcessParameterization Schemes
CumulusBMJ
Land surfaceNoah
MicrophysicsLin
Planetary boundaryMYJ
Longwave radiationNew Goddard
Shortwave radiationNew Goddard
Table 2. Performance statistics of MB, NMB, NME, RMSE, and R for Case1995 and Case2015.
ExperimentsMB (°C)NMB (%)NME (%)RMSE (°C)R
Case20151.30.060.12.80.93
Case19951.20.050.12.80.93
Table 3. Land use and land cover transition matrix from 1995 to 2015 (KM2).
FarmlandForestGrasslandWetlandUrban AreasOther
Farmland857.9711529.2710.267189.29286.2
Forest420.66111.330.9927.172.07
Grassland5271.393292.297.472661.48688.32
Wetland0.278.649.9
Urban areas
Other727.74221.9411111.8512.87184.95
Publisher’s Note: MDPI stays neutral with regard to jurisdictional claims in published maps and institutional affiliations.

