Article

Preliminary Assessment and Verification of the Langley Plots Calibration of the Sun Photometer at Mt Foyeding Observatory, Beijing

1
State Key Laboratory of Severe Weather & Key Laboratory of Atmospheric Chemistry, Institute of Atmospheric Composition and Environmental Meteorology, Chinese Academy of Meteorological Sciences, China Meteorological Administration, Beijing 100081, China
2
Collaborative Innovation Center on Forecast and Evaluation of Meteorological Disasters (CIC-FEMD), Nanjing University of Information Science & Technology, Nanjing 210044, China
3
LAGEO, Institute of Atmospheric Physics, Chinese Academy of Sciences, Beijing 100029, China
4
Institute of Atmospheric Environment, China Meteorological Administration, Shenyang 110166, China
5
College of Earth and Planetary Sciences, University of Chinese Academy of Sciences, Beijing 100049, China
6
Department of Atmospheric and Oceanic Sciences, Institute of Atmospheric Sciences, Fudan University, Shanghai 200433, China
*
Author to whom correspondence should be addressed.
Remote Sens. 2022, 14(17), 4321; https://doi.org/10.3390/rs14174321
Submission received: 26 June 2022 / Revised: 28 August 2022 / Accepted: 30 August 2022 / Published: 1 September 2022
(This article belongs to the Special Issue Stereoscopic Remote Sensing of Air Pollutants and Applications)

Abstract

:
An assessment and verification of the Langley calibration method of the Sun photometer at Mt Foyeding (MFYD) Observatory in Beijing was performed. We explored whether the Langley plot calibration is practicable for this mountainous site by analyzing the aerosol climatology and carrying out a case study. Then, the aerosol optical depth (AOD) results were verified under the reference of AERONET AOD. The results showed that satisfactory atmospheric conditions are present on winter mornings, characterized by a smaller average AOD (~0.09–0.14) and a lower range ratio (~36.97–63.38%) than in the afternoons and over a whole day. The six days selected as the case study all showed stable atmospheric conditions characterized by daily average triplets of <2% for all wavelengths. The residual sum of squares for V 0 λ at all wavelengths was <0.0002 and the residual standard deviation was <0.2%. A large improvement was found in the linear regression at morning relative to the statistics obtained over the whole day, when the coefficient of determination and residual standard deviation were promoted by 0.22–2.90% and ~2.76–23.32, respectively. The final V 0 λ value was derived from 31 days of observation and the deviations from the reference V 0 λ were about −1.69, −1.29, −0.81, −0.42, −0.34, −0.22, −0.63 and −0.36% at 340, 380, 440, 500, 675, 870, 1020 and 1640 nm, respectively. The regression analysis of the AOD validation showed a perfect AOD performance, with 100% of the retrievals lying within the expected error (0.05 ± 10%) from 380 to 1640 nm and 99.99% for the 340 nm band. Good AOD agreement (correlation coefficients > 0.998) and residual standard deviation values ranging from ~0.006 to 0.011 were observed, with the relative mean bias varying from 0.999 to 1.066. The mean biases were concentrated within ±0.02 for the ultraviolet bands and within ±0.01 for the other bands; therefore, the results of this preliminary assessment and verification indicated that the Langley plots method is suitable for photometer calibration at the MFYD Observatory.

1. Introduction

Atmospheric aerosols have a crucial role in the ambient environment, affecting both the regional air quality and global climate change [1,2,3,4]. Aerosols can directly influence the Earth’s radiative budget by scattering and/or absorbing the incoming solar radiation [5,6,7]. They can also modify the microphysical and optical properties of clouds, which indirectly disturbs the radiative transfer process [8,9,10,11,12]. Anthropogenic emissions have resulted in a high aerosol loading in many megacities, causing a decrease in visibility and total solar radiation and frequent air pollution events such as haze-fog [13,14,15,16,17,18]. In addition, aerosols are heterogeneously distributed among regions and the spatial and temporal variations in their natural or anthropogenic properties are one of the largest uncertainties in global radiative forcing [19,20,21,22]. For these reasons, it is important to study the microphysical, optical and radiative properties of aerosols to evaluate the response of the global climate to anthropogenic emissions [23,24,25,26].
The aerosol optical depth (AOD) is commonly used to characterize aerosols and has been used by the World Meteorological Association for long-term observations in the Global Atmosphere Watch Program (WMO-GAW) [27]. Satellite observations have developed rapidly in recent years and are used for long-term monitoring on global scales [28,29], such as the AOD database from the Moderate Resolution Imaging Spectrometer (MODIS) (Wei et al., 2019) [30,31,32] and the Cloud-Aerosol Lidar and Infrared Pathfinder Satellite Observations (CALIPSO) [33,34]; however, the AOD retrievals from satellite-borne platforms are subject to uncertainties in sensor calibration, cloud contamination and the surface albedo. In addition, the low temporal resolution over specific regions means that the satellite AOD values cannot show detailed variations in aerosols during episodes of air pollution [4,35,36,37]. As a result, the AOD taken from ground-based observations is considered to be the most direct, accurate and effective method with which to study the optical properties of aerosols, and is usually used to validate satellite data and modeling results [38,39,40,41,42].
Ground-based monitoring networks have been established worldwide to conduct continuous measurements of the optical properties of aerosols. These networks include the Precision Filter Radiometer (PFR) network of the WMO-GAW [41], the Aerosol Robotic Network (AERONET [42]), the PHOtométrie pour le Traitement Opérationnel de Normalisation Satellitaire (PHOTONS [43]), the SKYrad Network (SKYNET [40]) and the China Aerosol Remote Sensing NETwork (CARSNET [44]). Most of these national, regional and global observation networks are equipped with the Cimel Electronique CE318 photometer, an automatic multiband Sun photometer, to obtain long-term data on the microphysical, optical and radiative properties of aerosols. These detectors have a major part to play in providing real-time results during episodes of air pollution, such as dust and haze-fog events, thus contributing to our understanding of the effects of aerosols on the Earth’s climate and environment.
Device calibration is crucial to meet the accuracy requirements of AOD measurements (with an uncertainty within 0.02 [45]) and for the establishment and maintenance of databases from ground-based observational networks. Previous studies have shown that instrument calibration is a challenge in the precision, calibration and retrieval methods for difference devices [27,46,47,48]. For example, the AERONET network has three calibration centers at the Goddard Space Flight Center (Greenbelt, Maryland, USA), the Laboratory of Atmospheric Optics (Lille/Carpentras, France) and the Group of Atmospheric Optics (Valladolid, Spain). The master devices at the Goddard Space Flight Center are calibrated at the Mauna Loa Observatory (3397 m a.s.l.) and the Laboratory of Atmospheric Optics and Group of Atmospheric Optics masters are calibrated at the Izaña Observatory (2373 m a.s.l.). These two locations are used as the absolute calibration field for Sun photometers at high altitudes when using the Langley plot method. The calibration coefficient is later transferred to the field instruments by an intercomparison between these three calibration centers [49].
CARSNET is the largest ground-based aerosol observation network in China and uses the same CE318 photometer as AERONET. This network was initiated by the China Meteorological Administration (CMA) for dust monitoring and satellite validation [50]. It has now been developed into a federal observation program, including 76 sites affiliated to local scientific institutions, universities and meteorological bureaus, among them 40 stations run operationally by the CMA. An intercomparison calibration center has been established in Beijing, similar to AERONET at the Goddard Space Flight Center, with a master device reference that is periodically calibrated (every six months) by the Group of Atmospheric Optics. Mt Waliguan Observatory (36.28°N, 100.09°E, 3826 m a.s.l.) has been proposed as a suitable platform to conduct Langley plot calibrations for Sun photometers and could achieve calibration coefficients comparable with the intercomparison method; however, the Mt Waliguan Observatory is located on the northeastern edge of the Tibetan Plateau in western China, where the transport of instruments is challenging as a result of the harsh terrain. In addition, the lack of a reference instrument (such as a master device) could result in large uncertainties in the calibration, leading to an increased bias in the calculation of the AOD.
We present here a comprehensive study of the Langley plot calibration of the Sun photometer at the Mt Foyeding (MFYD) Observatory in Beijing. We explored whether the Langley plot method was practicable for this mountainous station based on an analysis of the aerosol climatology. The AOD results were then verified with reference to the AEROENT AOD. This work will contribute to the assessment and verification of the Langley plot calibration method and intercomparison calibrations with CARSNET, as well as improving the overall accuracy of the ground-based AOD dataset in China.

2. Instruments, Sites and Methods

2.1. Instrument

The CE318 is a multiwavelength Sun photometer for direct Sun and diffuse sky radiation measurements within a 1.2° full field of view. The photometer is used to obtain the microphysical, optical and radiative properties of atmospheric aerosols (e.g., the volume size distribution, AOD and single scattering albedo) [42]. Direct solar radiation measurements at 340, 380, 440, 500, 675, 870, 1020 and 1640 nm were used to calculated specific AOD values, whereas measurements at 936 nm were used for water vapor, with uncertainties within ±0.02 and ±0.10 cm, respectively. The diffuse sky measurements at 440, 675, 870 and 1020 nm were used to retrieve the aerosol microphysical, optical and radiative inversions.

2.2. Site Information

The Langley calibration method for Sun photometers requires atmospheric stability, characterized by a low and stable AOD, which can be achieved at high-altitude locations [46,49]. The MFYD Observatory (40.36°N, 116.08°E, and 1225 m a.s.l.; Figure 1) is located in northwest Beijing, about 80 km from the city center. Previous studies have reported that the planetary boundary layer height (PBLH) in Beijing shows significant seasonal variations with relatively high average values (~1.0 km) in summer and low values (~0.7 km) in winter [51,52]. The MFYD Observatory is located above a strong temperature inversion layer in winter and is, therefore, free from local anthropogenic influences, resulting in the stable conditions required for a Langley plot calibration. We conducted this observational campaign and assessment of the Langley calibration method to determine whether this mountainous site near Beijing is practicable for the establishment of an absolute calibration center for CARSNET.
The Chinese Academy of Meteorological Sciences (CAMS) site is located in urban Beijing within the Third Ring Road (116.317°E, 39.933°N, and 106 m a.s.l.; Figure 1), where the main atmospheric pollutants originate from anthropogenic activity [53,54]. The Beijing CAMS observational platform is subordinate to CARSNET and AEROENT and is equipped with five master CE318 photometers. The real-time data are available on the AERONET webpage (https://aeronet.gsfc.nasa.gov/, last access: 2 August 2022). We conducted synchronous measurements after the Langley calibration at the MFYD Observatory to evaluate the application and accuracy of the calibration coefficients.

2.3. Calibration Method

We carried out a long-term observational campaign from 2013 to 2019 of the aerosol optical properties at the MFYD Observatory using the CE318 photometer. We set the device to make direct observations every three minutes (otherwise every 15 min) to obtain sufficient data to evaluate the Langley plot calibration method for the Sun photometer at this site.
The Langley method is based on the Beer–Lambert–Bouguer law:
V λ = V 0 λ R 2 e x p ( m τ λ ) ,
where λ is the wavelength, V λ is the measured digital count, V 0 λ is the calibration coefficient, R is the ratio of the average to actual Earth–Sun distance, m is the local optical air mass and τ λ is the AOD.
The value of m is calculated as follows:
m = ( ( c o s θ + 0.15 ( 93.885 θ ) 1.253 ) 1 ,
where θ is the local solar zenith angle.
The value of R 2 can be calculated as:
R 2 = ( ( 1.000423 + 0.032359 s i n l + 0.000086 sin ( 2 l ) 0.008349 c o s l + 0.000115 cos ( 2 l ) ) 1 ,
where l is the Earth revolution radian:
l = 2 π ( D D c ) / 365.242 ,
and D is the Julian day in a year. D c is the correction factor:
D c = 79.6764 + 0.2422 ( Y 1985 ) I N T ( 0.25 ( Y 1985 ) ) ,
where Y is the year and INT is the rounding function.
Equation (1) can be log-transformed as:
l n ( V λ   R 2 ) = τ λ m + l n V 0 λ
If m and l n ( V λ   R 2 ) are regarded as independent and dependent variables, respectively, then V 0 λ can be easily determined by the ordinate intercept of the linear regression. The Langley plot calibration method, therefore, requires stable, clear atmospheric conditions, during which a series of measurements can be taken over a range of air masses because the AOD can be considered as constant [46,55].
The annual direct Sun calibration for this photometer was determined by intercomparison with the AEROENT and CARSNET master instruments at the CAMS site. The details of this method have been presented previously [51,56,57].

2.4. Data Processing

To verify the accuracy of the calibration coefficient calculated by the Langley method, we not only carried out an intercomparison of the coefficients, but also a bias analysis of the AOD. The synchronous measurement campaign was conducted between this photometer and the AERONET master CE318 instruments at the CAMS site. The consistency and accuracy of the calculated cloud-screened AOD were assessed in detail using a similar algorithm to that used by AERONET. This algorithm has been used in previous studies of CARSNET, including observational campaigns, numerical modeling and satellite verification and is, therefore, reliable for evaluating the accuracy of the calibration coefficient from a Langley plot regression [20,31,39,56,58,59,60].

3. Results and Discussion

3.1. Aerosol Climatology

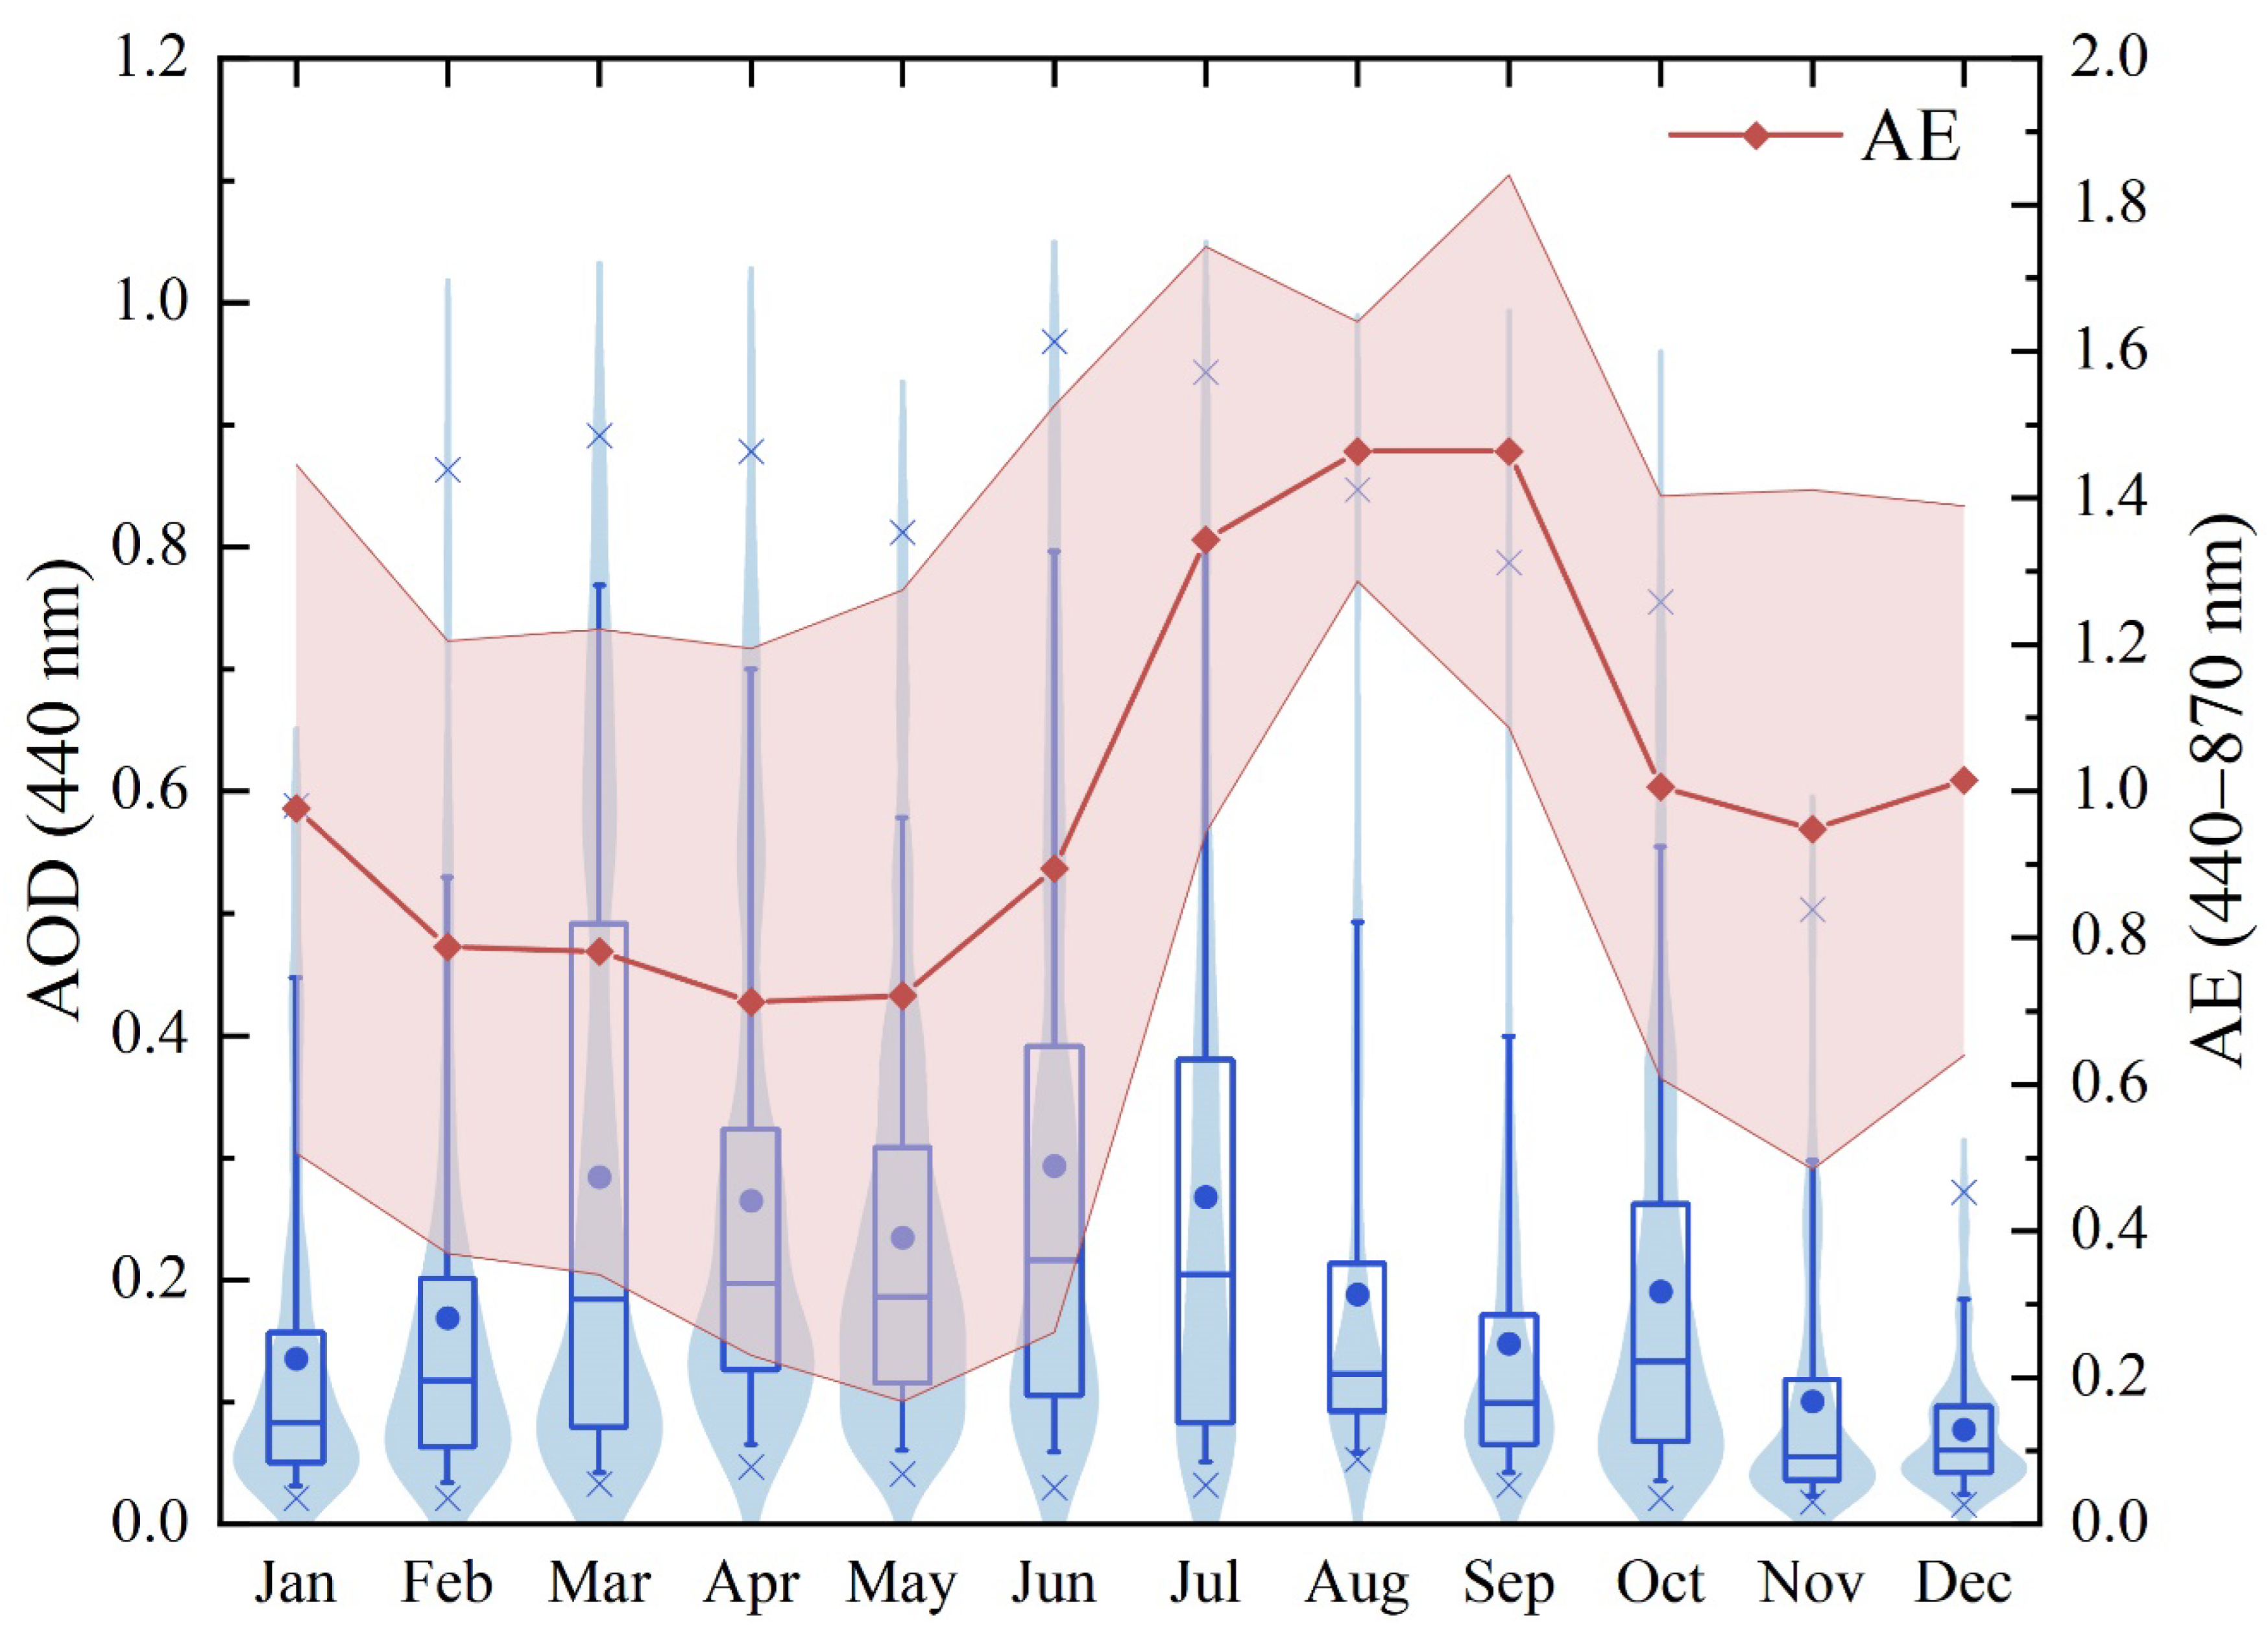
The aerosol extinction coefficient reflects the aerosol loading, which is a key factor influencing the Langley plot calibration. Figure 2 shows the monthly AOD at 440 nm and the Ångström exponent (440−870 nm) calculated by averaging all the available cloud-screened AOD values from the observational period.
The average AOD based on eight years of measurements was ~0.23, but with a significant seasonal variability. The seasonal mean peaked in spring (March–May) at ~0.26 ± 0.21, followed by ~0.25 ± 0.23 in summer (June–August), ~0.15 ± 0.16 in autumn (September–November) and ~0.13 ± 0.11 in winter (December–February). It has been shown previously that the transport of continental dust from Eurasia over the MFYD Observatory in spring increases the aerosol loading and its variability [51]. High monthly mean values from 0.23 (May) to 0.28 (March) were found, with standard deviations of up to 0.25 in March. The Ångström exponent, which had an overall mean of 1.01, was moderately influenced by fine particles. There was a clear decrease to 0.74 in spring, confirming the increased presence of coarse dust particles. Despite these variabilities in the AOD and Ångström exponent, the 50th percentile of the AOD was <0.20 from March to May, indicating some clean days during spring.
Another feature of the seasonal cycle of aerosols is the larger Ångström exponent and AOD in summer compared with the other seasons. The Ångström exponent increased continuously from ~0.89 to ~1.46 during the summer, suggesting the influence of fine particles from anthropogenic activity. This can be partly explained by the diffusion effect of aerosols within the thickened PBL in summer. The altitude of the MFYD Observatory is ~1225 m and the mean PBLH over Beijing in summer is ~1.0 km [51]. This suggests that fine particles originating from the near-surface could be uplifted by the increased vertical turbulence before diffusing into the upper atmospheric layer, leading to a predominance of small particles. Zheng et al. (2019) reported that the accumulation and vertical diffusion of the haze layer could lead to an AOD440 nm >0.50 at the MFYD Observatory [51]. The 50th and 75th percentiles of the AOD were ~0.20 and 0.40 in June and July, whereas the monthly mean value was ~0.30, indicating the increased proportion of high AOD values observed in this campaign. The 25th percentile of the AOD was <0.10 in summer and autumn, whereas the 50th percentile was <0.10 in winter, demonstrating the clean atmospheric conditions at the MFYD Observatory.
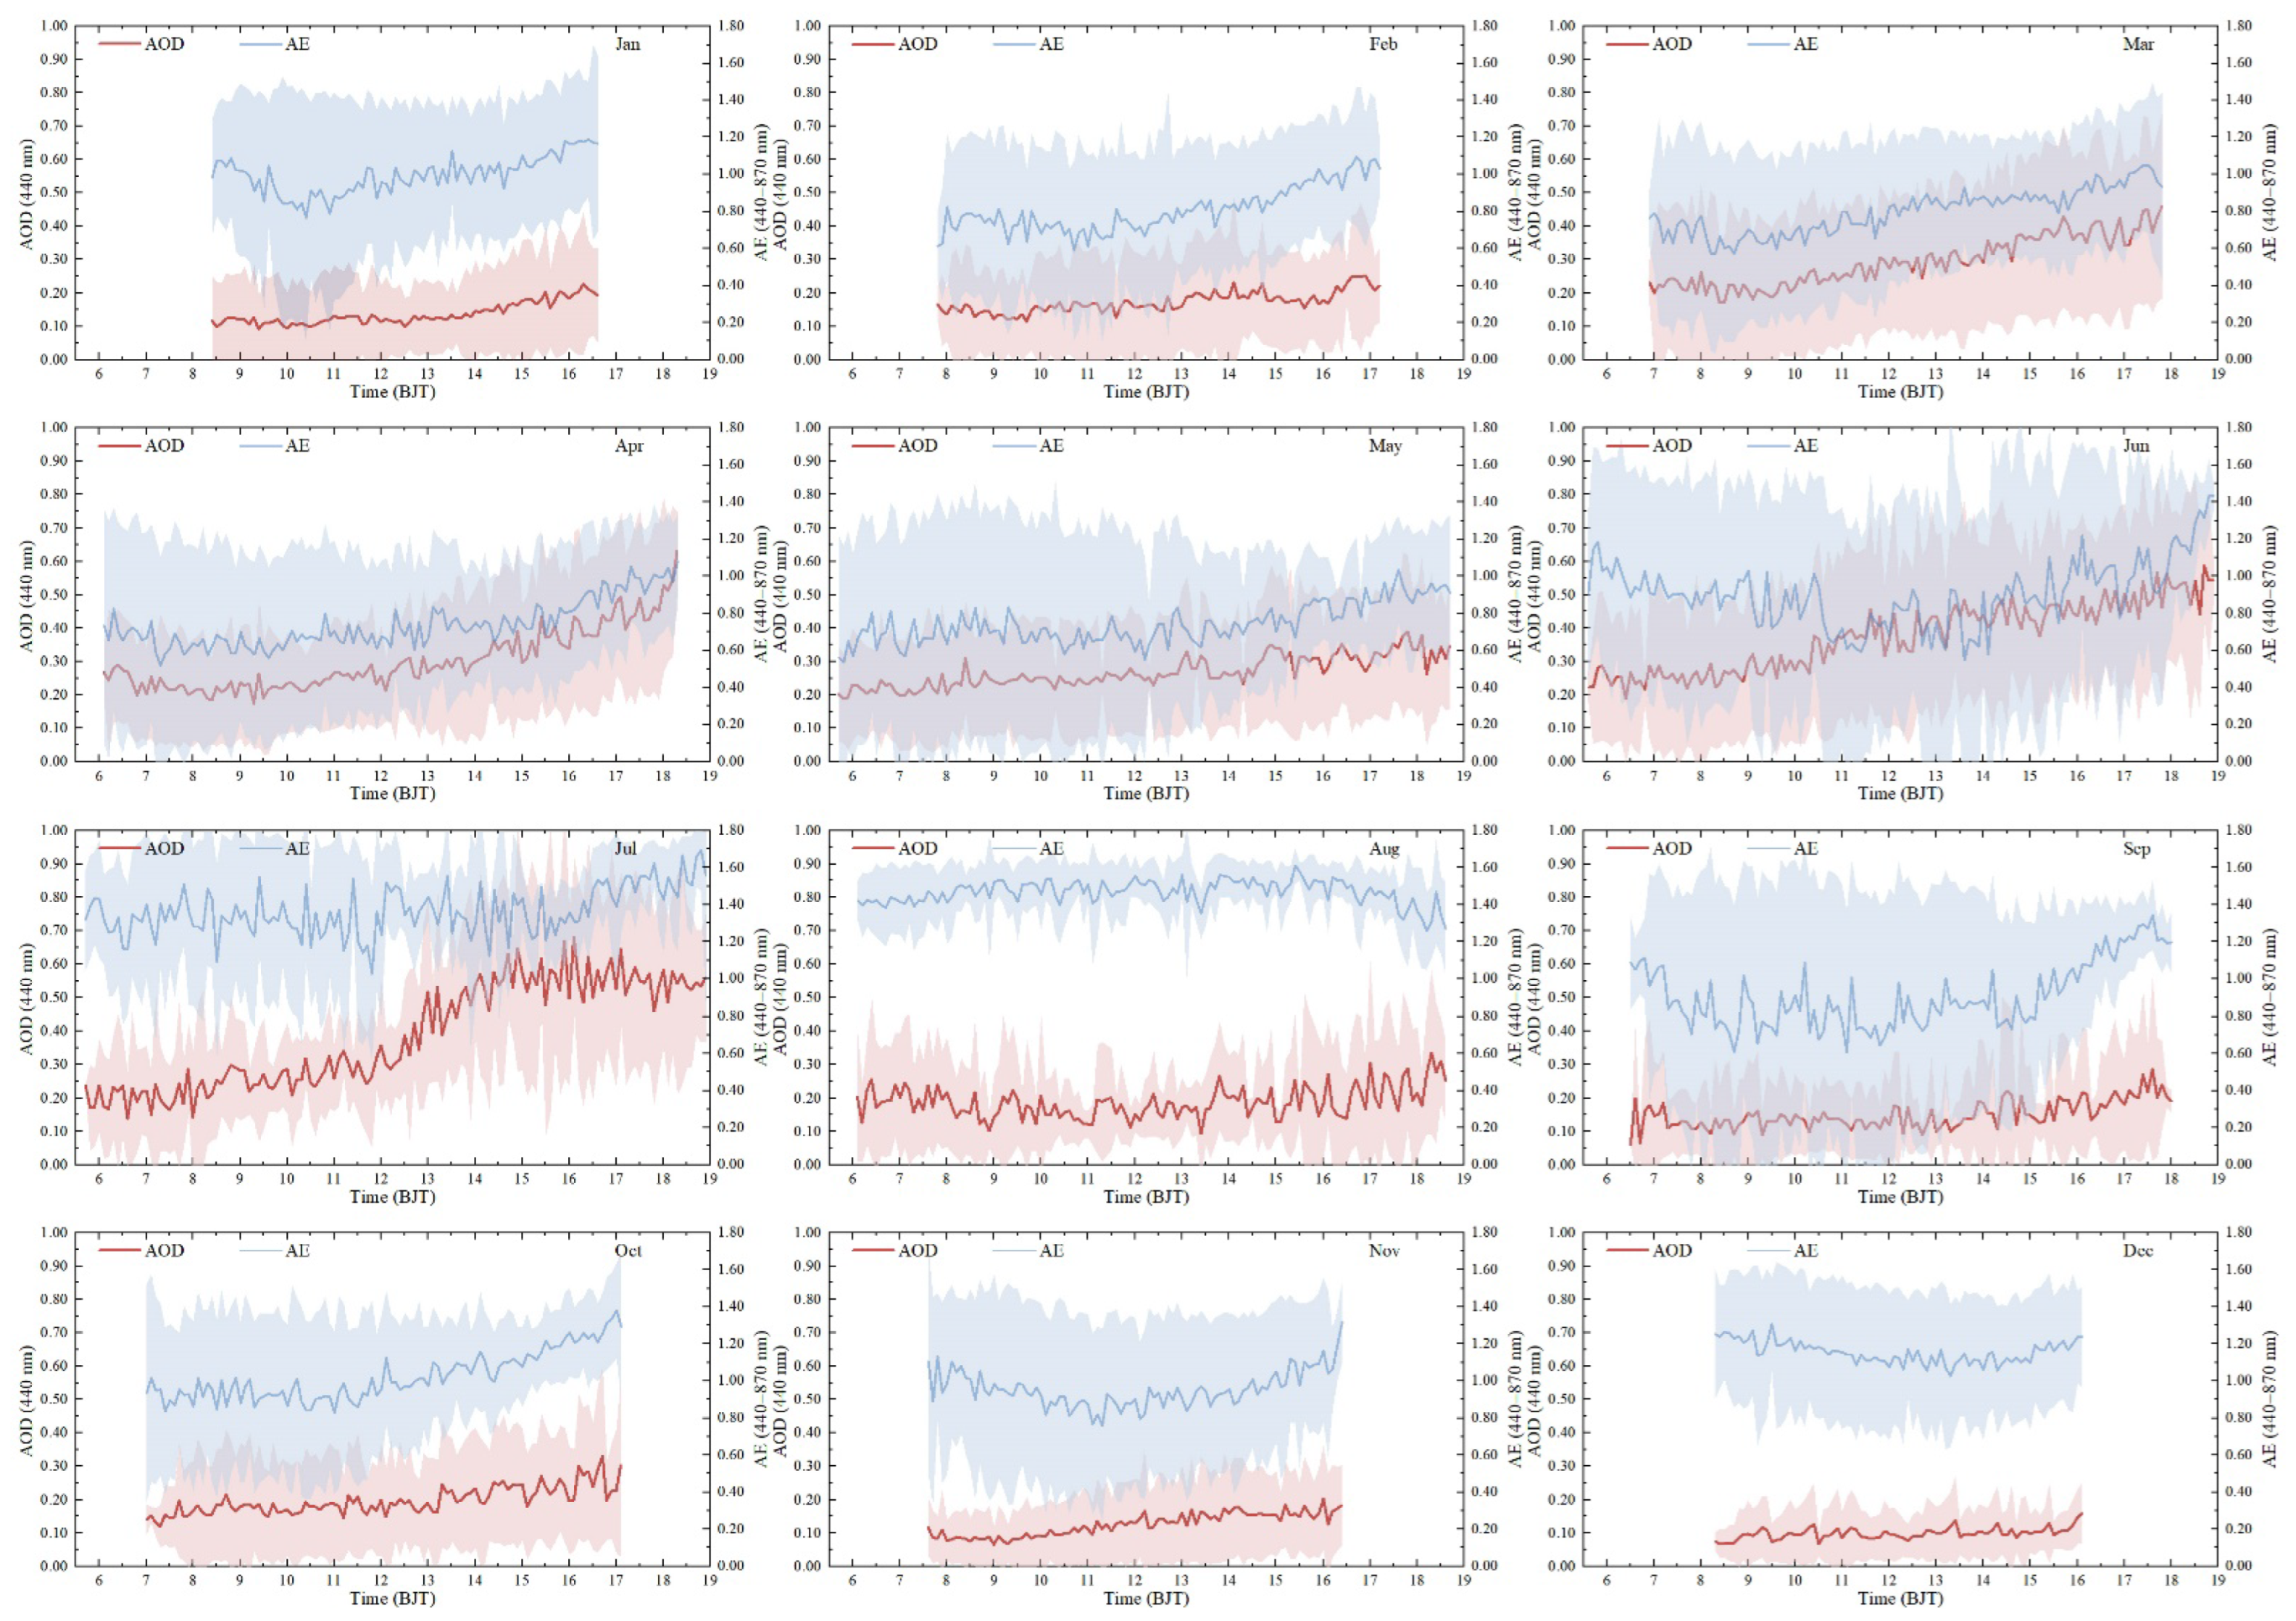
The aerosol loading at the MFYD Observatory is greatly affected by the local vertical turbulence, especially during the warm season when the PBLH is significantly deepened. Because the Langley plot calibration usually requires a whole day of observations under stable, clean atmospheric conditions over a period of several months, we needed to determine whether the aerosol content was affected by diurnal variations and the extent of this impact. Figure 3 shows the diurnal AOD and Ångström exponent for each month.
The AOD mostly showed an increasing trend during the day in each month. The variation in the Ångström exponent showed a similar trend to the AOD in spring, autumn and winter, but a larger variability with a higher standard deviation throughout the year (the shaded areas), suggesting that the size of the volatile particles was influenced by dust transport and diffusion effects. For example, the Ångström exponent showed a relatively small variability in August, with a monthly mean standard deviation of ~0.16, whereas the monthly mean standard deviation of the AOD was ~0.13. To describe the daily variation of the AOD more precisely, we used the range ratio of the mean AOD (defined as (maximum − minimum)/mean × 100%) to clarify its tendency in the morning and afternoon (Table 1).
The whole-day average AOD showed a significant diurnal variability characterized by the ratio varying from 74.79 to 151.55%. The minimum AOD of ~74.49% occurred in May, followed by February (~81.43%), December (~93.56%) and January (~99.00%). The ratios in the other months were >100%, indicating that the AOD tended to be larger during the daytime. The ratio was lower in the morning than in the afternoon, except in June and July, which indicated that the hourly AOD was relatively stable in the morning. The mean AOD in the morning varied from 0.09 to 0.14, with a ratio of 36.97–68.59% in the four coldest months from November to February, confirming the relatively clean and stable atmospheric conditions. From the perspective of the aerosol climatology, the mean AOD in the afternoon was also low (~0.10–0.19) in these four coldest months, suggesting clean conditions; however, the ratio was ~11–50% greater than in the morning and it was unclear whether the Langley calibration experiment could achieve satisfactory results with these variations.

3.2. Meteorological Conditions

We used a campaign period between November 2017 and March 2018 to test the applicability of the Langley plot calibration. The final coefficients were retrieved by the least-squares method from several days of data and we therefore selected six days as a case study to show the details of the Langley method. The photometer was then moved to CAMS to perform the intercomparison with the AERONET master device and the discrepancy in the AOD was analyzed using data from March 2018 to March 2019. The Langley plot calibration method requires clean, stable atmospheric conditions. We therefore checked the related meteorological elements for these six days (Table 2). The values for each variable were calculated from the daily average measured at the MFYD Observatory.
The pressures were concentrated in a narrow range from 873 to 884 hPa with a small deviation of ~1 hPa. The small variation in pressure within a single day indicated a stable atmospheric circulation without a significant vertical convection. A small variation in temperature was also found for these days, with an average range of ~1−2 °C. The relative humidity showed a decreasing trend with a maximum of ~98% on 18 November and a minimum of ~37% on 20 December. Apart from 18 November, the prevailing winds were mainly from the northwest, which is usually regarded as a dry, clean area [61,62]. The average wind speed varied from 2 to 5 m/s with a deviation of ~1−3 m/s, indicating a soft breeze. The horizontal diffusion was moderate, contributing to the uniform distribution of aerosols over this region. These moderate atmospheric diffusion conditions suggested no violent weather process during those six days, which favored the stable atmospheric conditions required for a Langley calibration.

3.3. Evaluation of the Raw Digital Count

The raw digital counts can be used to reflect the atmospheric conditions. Every direct observation of the Sun by the CE318 Sun photometer is a triplet measurement over the whole wavelength. We therefore calculated the average triplet value to give an overview of the daily digital count for those six days.
Figure S1 shows that the daily digital count for each wavelength on those six days had a smooth parabolic distribution from ~08:00 to 16:00 BJT (Beijing time) with tight, continuous digital count values, reflecting the good working condition of the photometer. The smooth and roughly symmetrical digital count curve at each wavelength showed the fairly stable atmospheric conditions over this region. There was no significant shift (or zero value) on those days, indicating a clear sky without any contamination from clouds. We used the particulate matter concentrations provided by the Ministry of Ecology and Environment (https://air.cnemc.cn:18007/, last accessed: 2 August 2022) to show that there was a relatively high digital count on those days compared with other polluted days with large daily particulate matter concentrations, which suggested that the atmospheric aerosol loading was fairly low. We therefore concluded that the selected days were suitable for the Langley plot calibration of the photometer.
To obtain a better description of the stability of the photometer and the atmospheric conditions, we calculated the triplet ratio, defined as the ((maximum − minimum)/mean × 100%), for each wavelength on those six days. Figure 4 shows that the triplet ratios had a typically diurnal distribution, as found in previous studies, and presented a trend characterized by an increasing dispersion with an increasing air mass [46,63,64]. In general, the ratios were <10%, which indicated no cloud contamination nor instrument failure during those days. Relatively large ratios (>2%) were found both in the morning (before 10:00 BJT) and in the afternoon (after 14:00 BJT). At those times, the solar altitudinal angle changed rapidly, which, combined with the dramatic variation in the incoming solar radiation, resulted in a trend toward a larger ratio discrepancy for larger air masses. This phenomenon was more pronounced in the ultraviolet band. The ratios at 340 and 380 nm varied from ~1 to 8% and ~1 to 6%, respectively, because these wavelengths are more sensitive to variations in solar radiation. By contrast, the ratios in the visible (440–675 nm) and infrared (870–1640 nm) bands showed relatively small fluctuations, with the maximum range (~1–4%) in the 440 nm band and the minimum range (~1–2%) in the 1640 nm band. Consistently low ratios were measured at all wavelengths around noon, with most values < 1% between 10:00 and 14:00 BJT, suggesting clear, stable weather conditions and a good running status for the photometer.
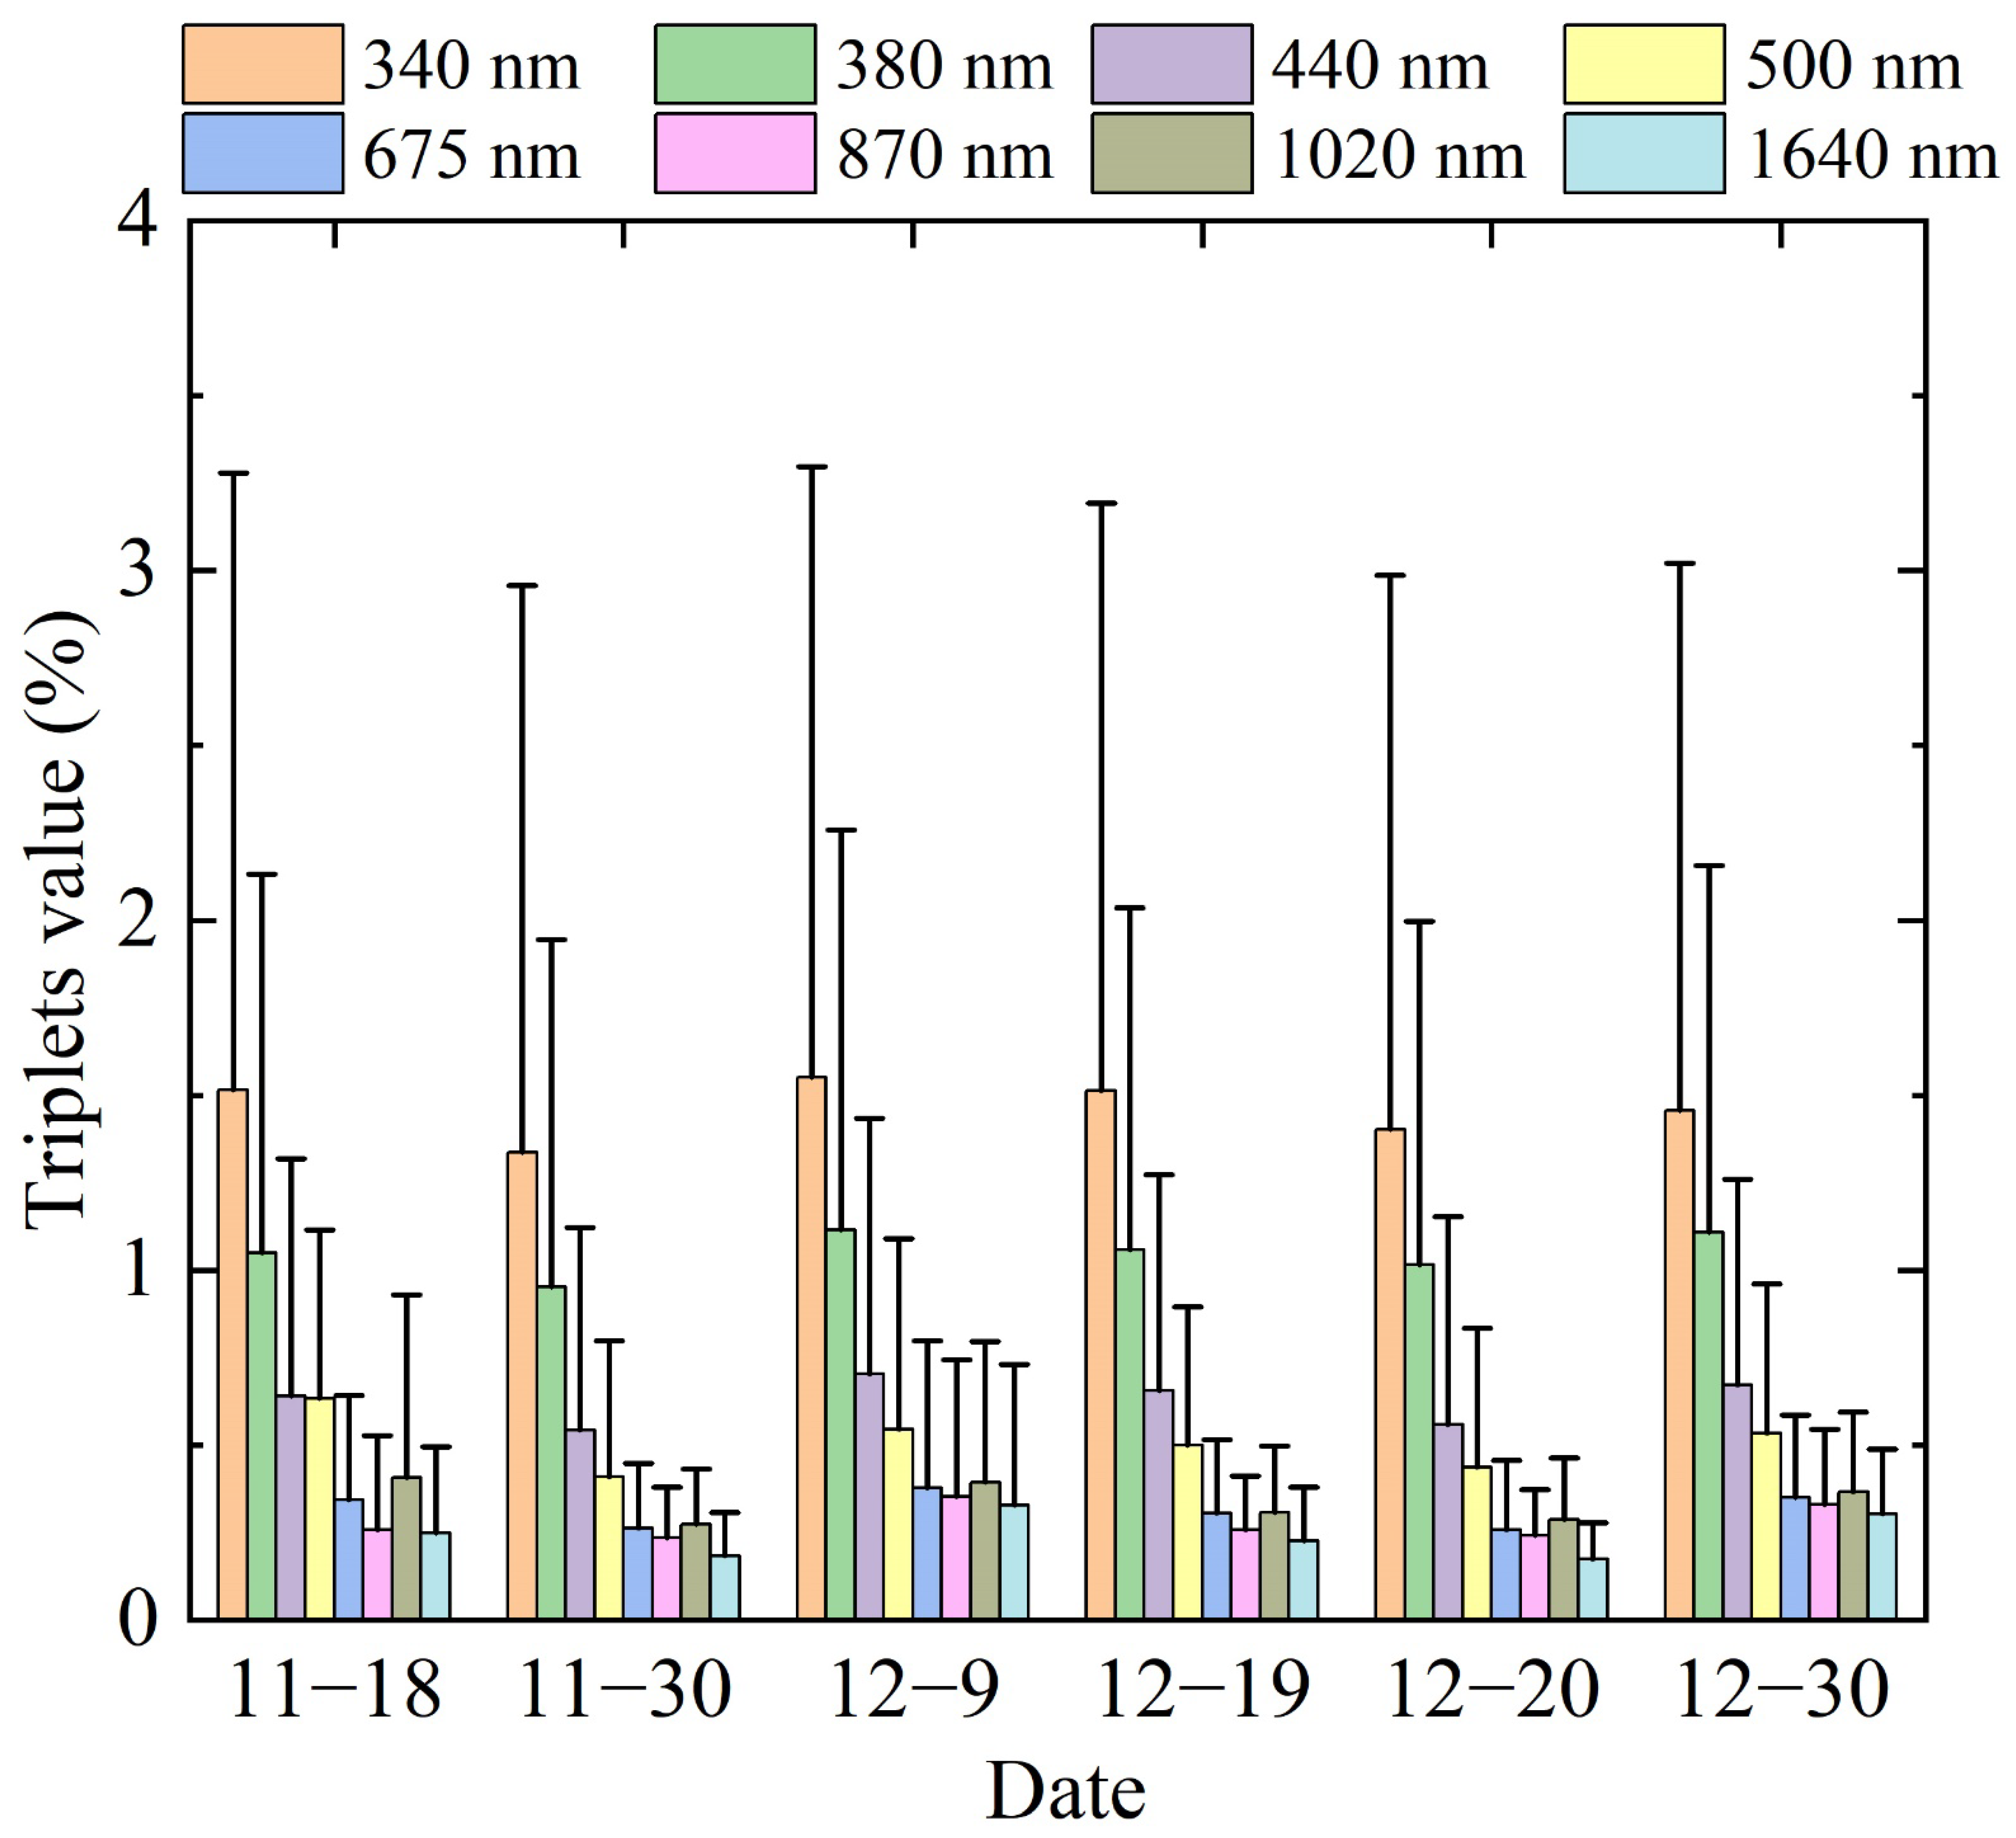
Figure 5 shows the daily mean triplet ratios. There were relatively large ratios in the ultraviolet bands (~1.3–1.6% at 340 nm and ~0.9–1.3% at 380 nm). The average ratios in the visible bands showed moderate fluctuations with a clear decreasing trend with an increasing wavelength. The daily mean ratios were ~0.5–0.7, 0.4–0.6 and 0.3–0.5% at 440, 500 and 675 nm, respectively. In the infrared band (870–1640 nm), the minimum daily variation was at 1640 nm (~0.2–0.3%) and the maximum (~0.3–0.5%) at 1020 nm, which could be responsible for the temperature sensitivity of the photometer [48]. These characteristics of the raw digital count measured on those six days at the MFYD Observatory were comparable with those at the Mt Waliguan Observatory, where the daily mean ratios at 1020 nm (~0.2–0.6%) were significantly higher than those at 870 nm (~0.2–0.3%), with a decreasing trend from 340 to 675 nm.

3.4. Langley Plot Calibration

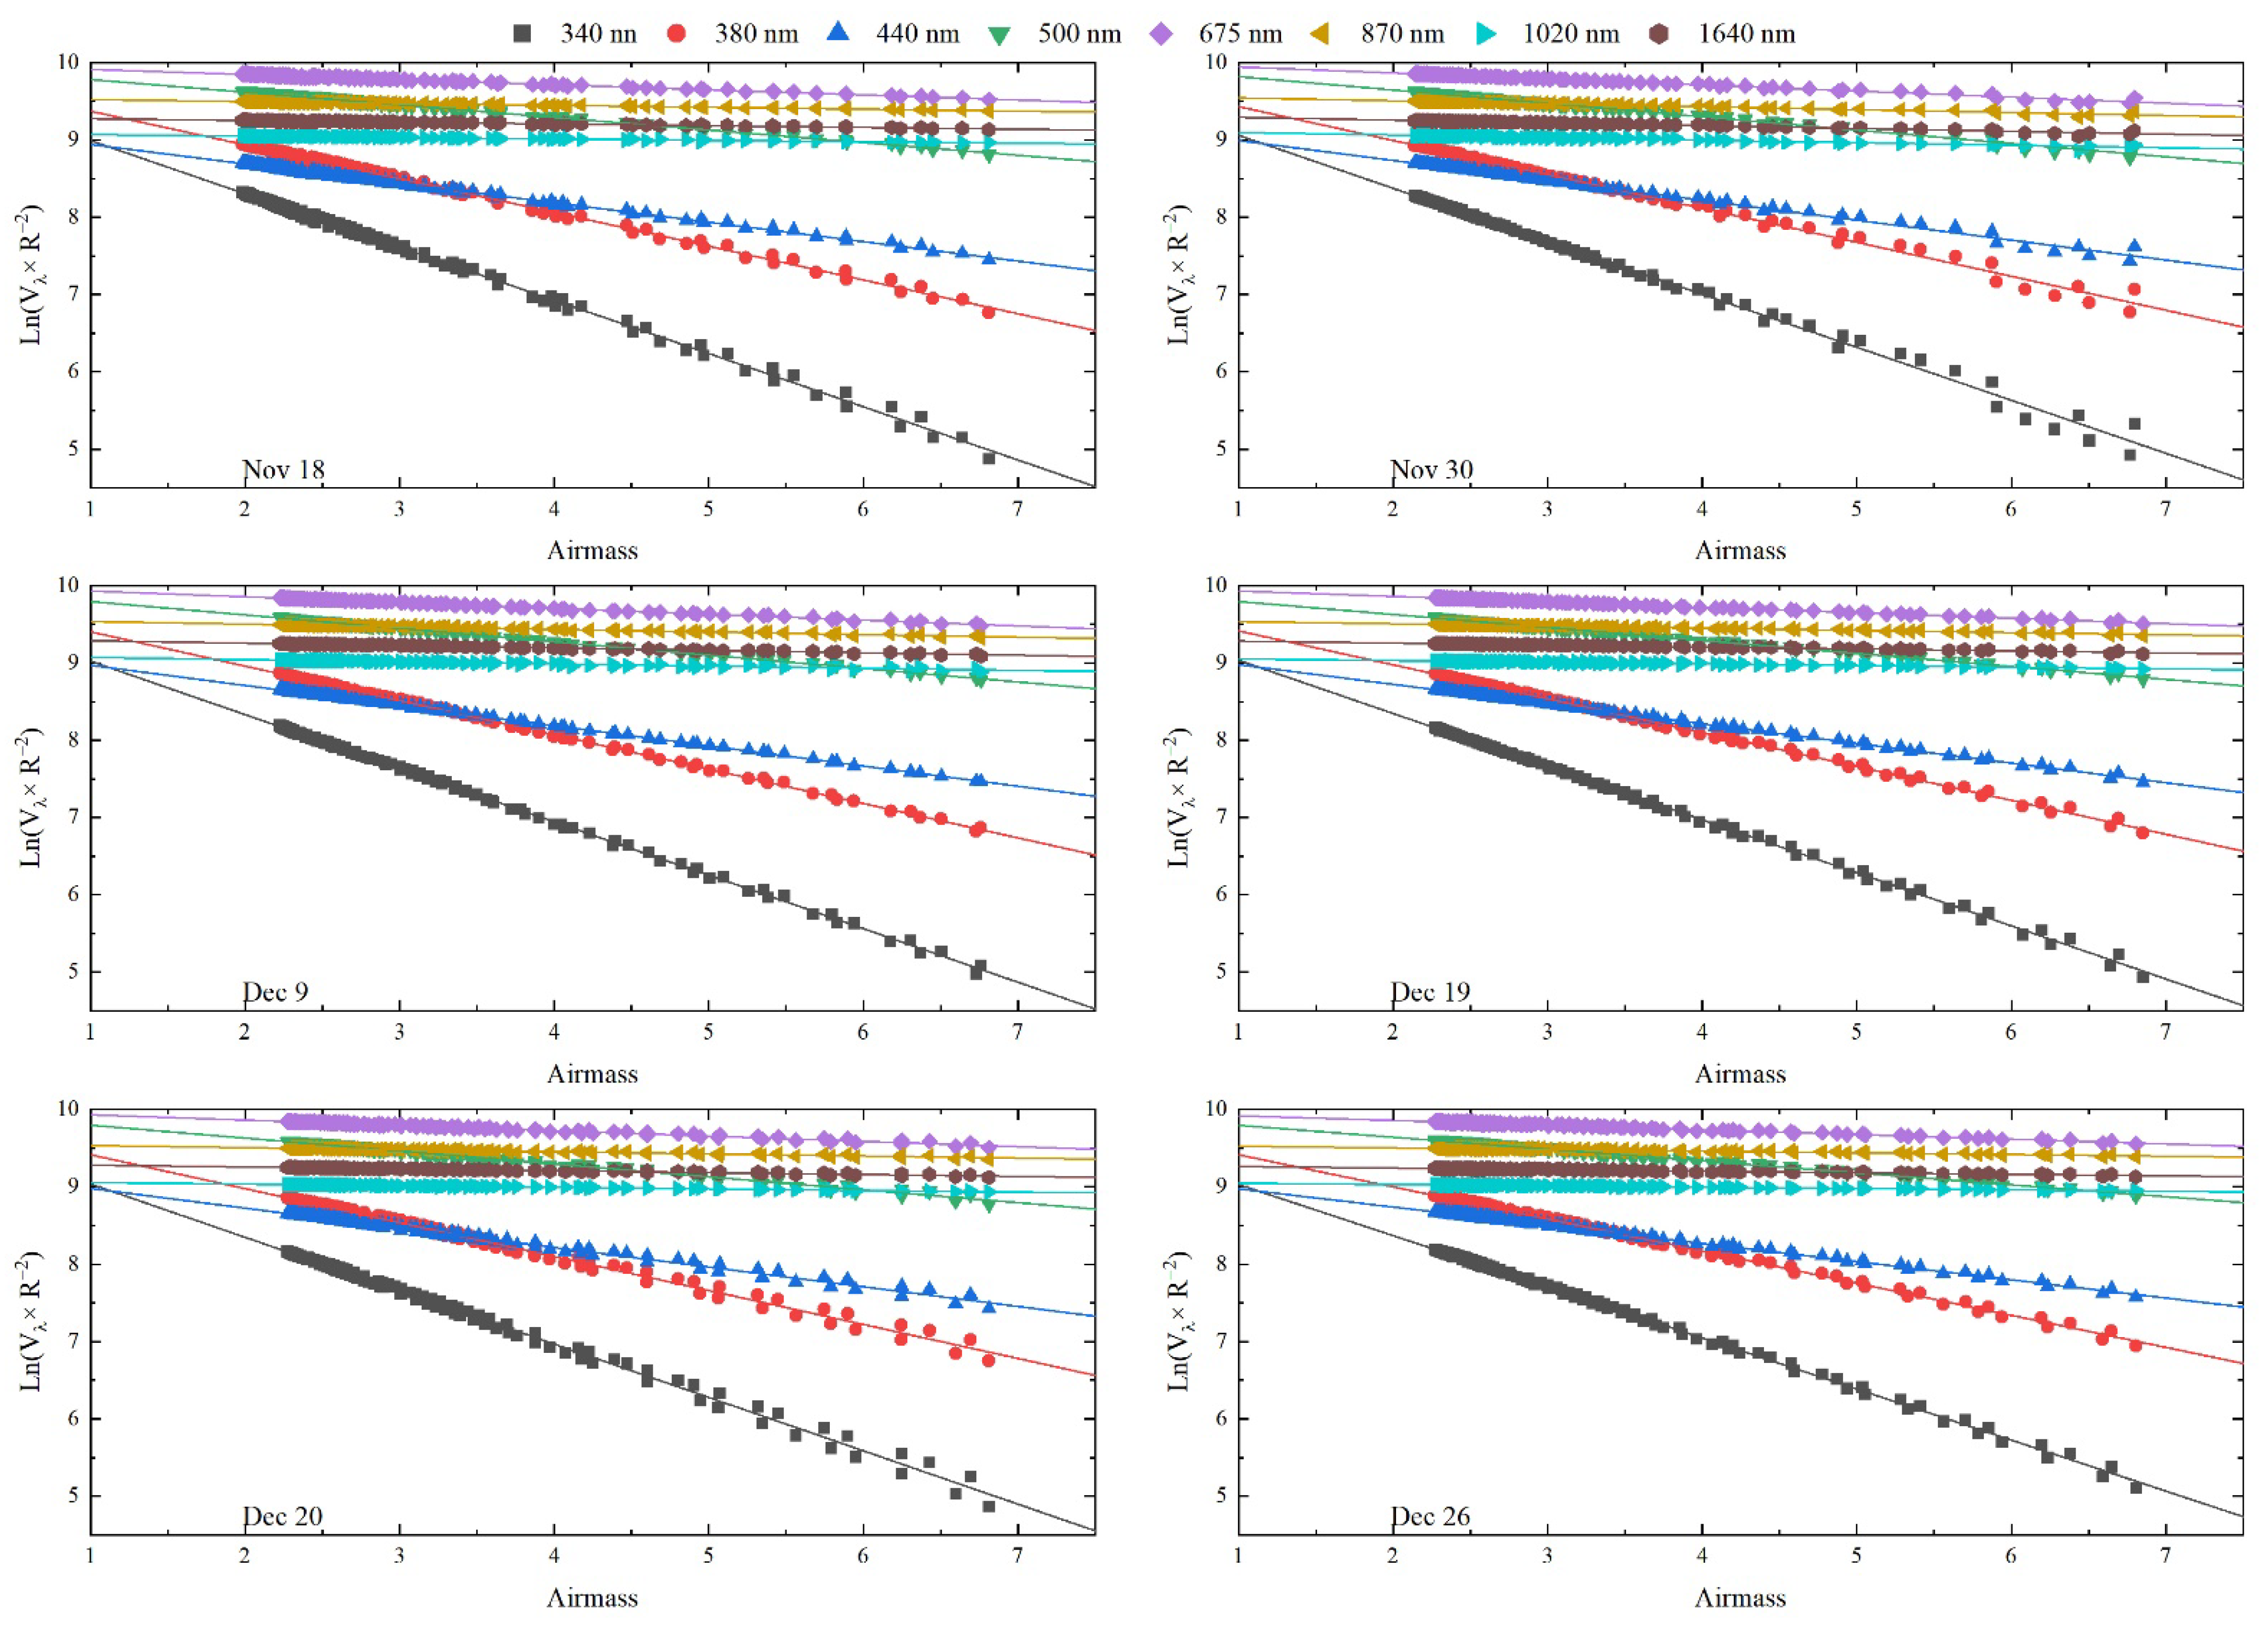
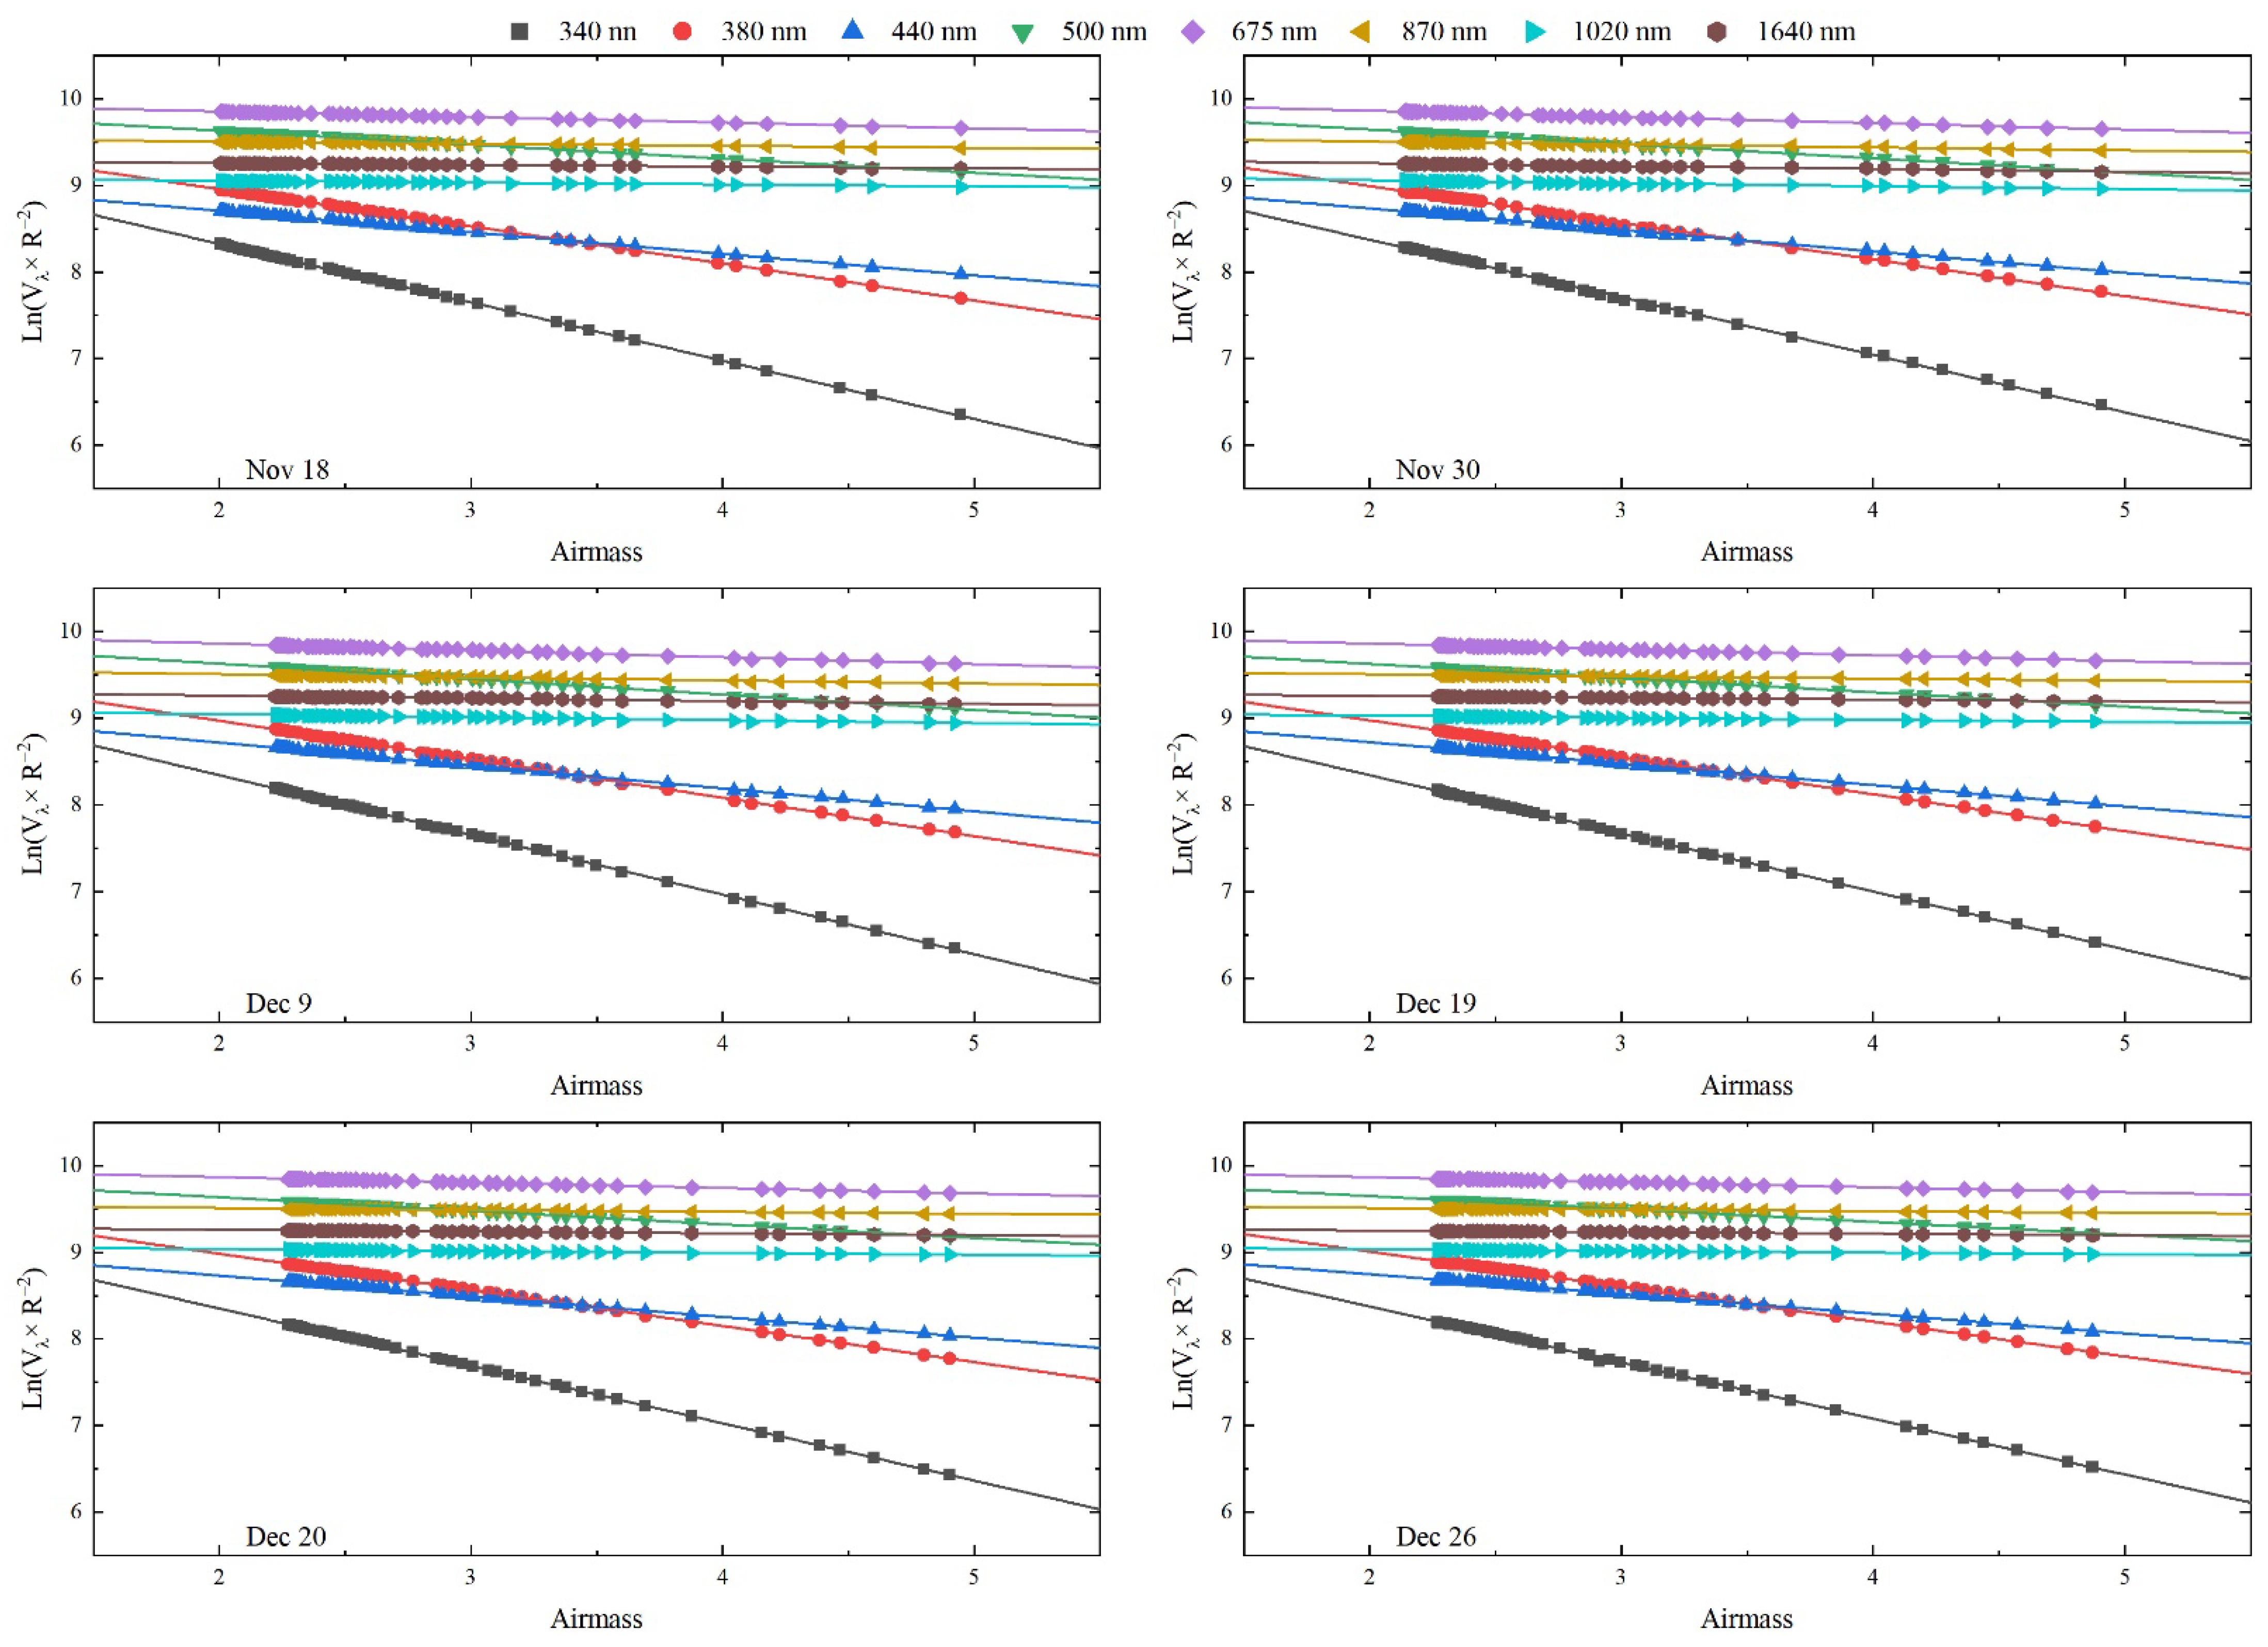
V 0 λ is obtained from the ordinate intercept of a linear regression. We therefore carried out a linear fitting analysis between m versus l n ( V λ   R 2 ) for the six study days using all the observed values. Figure 6 shows the linear fitting results, and the statistical analysis is given in Table S1.
Figure 6 shows that there were small deviations between the measured values and fitting lines in each band of the photometer, especially when the air mass was >5 in the ultraviolet and visible bands. To calculate the V 0 λ more precisely, we checked the quality of the Langley plots by statistically analyzing the linear regressions. Table S1 shows that a satisfactory R2 value (>0.99) was found in the ultraviolet and visible bands from 440 to 500 nm, whereas more volatile R2 values were found from 675 to 1640 nm, suggesting a relatively poor linear relationship. For example, the lowest R2 values for 675, 870, 1020 and 1640 nm were 0.9791, 0.9279, 0.9229 and 0.8809, respectively. The residual sum of squares (RSS) values reflected the discrepancy in all the measured values versus the linear regression, indicating the total deviation (Table S1). The RSS values showed significant decreasing trends from 340 to 870 nm on the case study days, whereas the values at 1020–1640 nm were comparable with those at 675–870 nm and shared roughly the same random distribution. The maximum values for the 340–870 nm band were ~0.3796–0.0104 on 20 December, whereas the minimum values of ~0.0725–0.0042 occurred on 9 December. For 1020–1640 nm, the maximum values occurred on 30 November (~0.0143) and 26 December (~0.0098) and the minimum values on 20 December (~0.0014) and 9 December (~0.0033). These results show a larger deviation in the ultraviolet and visible bands than in the near-infrared bands, which agrees well with our previous findings (Figure S1).
We used the residual standard deviation (RSD), which shows the degree of dispersion of the observed values and linear fitting, to obtain a more accurate description of the linear regression. In general, the RSD varied in a wide range from ~5.5317 to 0.3383%. There was no satisfactory RSD in the ultraviolet band and all values were >2%, indicating a large dispersion and poor accuracy. The Langley plots acquired from the whole-day observations, therefore, did not give a precise result and were characterized by a low R2 value (minimum ~0.8809) and a high RSD (maximum ~5.5317%) for the linear regression.
Previous studies have suggested that this may be a result of the influence of aerosol loading and the irradiance regime [46,49,65,66]. Local convection rises from the upper boundary layer to the observational level in the afternoon at both inland sites—such as Mt Waliguan (36.28°N, 100.09°E, and 3826 m a.s.l.; China), the Jungfraujoch (46.51°N, 7.96°E, and 3580 m a.s.l.; Switzerland) and the Sierra Nevada (37.1°N, 3.4°W, and 2100 m a.s.l.; Spain)—and island sites—such as the Izaña Observatory (28°N, 16°W, and 2373 m a.s.l.; Spain) and the Mauna Loa Observatory (19°N, 155°W, and 3397 m a.s.l.; Hawaii, USA). Inland observatories are more vulnerable to the regional transport effects of aerosols. When the vertical turbulence and horizontal diffusion are enhanced by thermal forcing in the afternoon, the transport of aerosols may strongly disturb stable atmospheric conditions, resulting in the large deviations in the linear fitting seen in both this study and at Mt Waliguan [46].
We therefore screened out the values measured in the afternoon and present the Langley plot calibration for the morning data with triplets <1% on the six study days. We also removed the points measured in the early morning with an air mass of 5–7 because the rapidly changing solar elevation angle and irradiance could have increased the observational uncertainty. This method is widely used to ensure the accuracy of Langley calibrations [46,65,66]. The modified Langley plots and corresponding statistics are shown in Figure 7 and Table 3, respectively.
Figure 7 shows that the discrepancy in the ultraviolet and visible bands (Figure 6) was eliminated and the measured points smoothly distributed on the linear fitting line with no sharp fluctuations. Statistically, the R2 values in Table 3 were significantly improved by the modification. The R2 was >0.9508 for all bands, suggesting a significant linear correlation. Satisfactory R2 values (>0.99) were found from 340 to 675 nm and the ranges of variation for R2 at 870, 1020 and 1640 nm were ~0.9508–0.9923, ~0.9589–0.9810 and ~0.9622–0.9918, respectively. A better result was also found in the variation of the RSS value after the modification, with all values < 0.0002, which means that the total residual was significantly reduced. As reported by Dutton et al. [58] and Schmid and Wehrli [60], only data with an RSD < 0.002 should be included in the long-term calibration database. We found that the RSD of the Langley plots was <0.002 on all six study days at all wavelengths. This shows that the Langley plots performed at the MFYD Observatory may be comparable with those observed at the Mauna Loa Observatory and the Jungfraujoch, which indicates that the MFYD Observatory could be suitable for a Langley calibration. In addition, we can see a great improvement in the RSD of the linear regression. During the whole daytime observation on the six study days, the mean RSDs were ~3.96, 2.96, 1.84, 1.32, 0.86, 0.73, 0.65, and 0.65% at 340, 380, 440, 500, 675, 870, 1020 and 1640 nm, respectively, while those found in the morning measurements were ~0.16, 0.17, 0.16, 0.18, 0.16, 0.17, 0.16 and 0.17%, respectively. That is to say, the accuracy of the linear regression was greatly promoted by a factor of ~2.76–23.32. Similarly, we can observe that the correlations (R2) in the morning observations were improved by ~0.22–2.90%.

3.5. Assessment of Calibration Results

We obtained 45 days of Langley plots for the L n ( V 0 λ ) retrievals during this observational campaign. The calibration constant V 0 λ needs to be in a narrow range to obtain a more precise calibration coefficient. The exact cutoff threshold of the RSD from the mean was, therefore, set as 1% for the final L n ( V 0 λ ) at all wavelengths. The values of L n ( V 0 λ ) with the largest deviations from the mean value were screened out one by one until the L n ( V 0 λ ) values of all bands fell into an interval with an RSD < 1%. This gave L n ( V 0 λ ) values for a total of 31 days from all retrievals. Table 4 shows the corresponding calibration results.
The last L n ( V 0 λ ) values were retrieved in the morning in December and January, which is usually the coldest season in Beijing, indicating that stable atmospheric conditions are present on winter mornings as a result of the blocking effect of the inversion layer [51]. The average L n ( V 0 λ ) values at 340, 380, 440, 500, 675, 870, 1020 and 1640 nm were ~9.7052, 9.8433, 9.2317, 9.9757, 10.0172, 9.5813, 9.1129 and 9.3282, respectively. The standard deviation varied in a narrow range from ~0.0065 to 0.0095, which implies the L n ( V 0 λ ) values for each wavelength were more concentrated at the average value. This was supported by the variation in the RSS, with all values <0.003, suggesting a small total discrepancy in the average L n ( V 0 λ ) value.
The calibration coefficients were retrieved using the exponential function of L n ( V 0 λ ) and the final V 0 λ values at 340–1640 nm were ~16,403, 18,850, 10,215, 21,498, 22,409, l4,491, 9072 and 11,251, respectively. The final calibration coefficient was compared with that obtained at CAMS (Figure S2). The V 0 λ values were very close to the results of the intercomparison performed at CAMS, with deviations of about −1.69, −1.29, −0.81, −0.42, −0.34, −0.22, −0.63 and −0.36% at 340, 380, 440, 500, 675, 870, 1020 and 1640 nm, respectively. In general, these V 0 λ values were all slightly smaller than the previous value, which could be considered as a systematic deviation due to the aging of the filter. Specifically, the discrepancies at the ultraviolet wavelengths were larger than those at the visible and near-infrared wavelengths, which was similar to the Langley plot results obtained at Mt Waliguan [46]. This large difference could be due to the large uncertainty in the measurements at ultraviolet wavelengths, which are more sensitive to variations in the solar angle and irradiance.
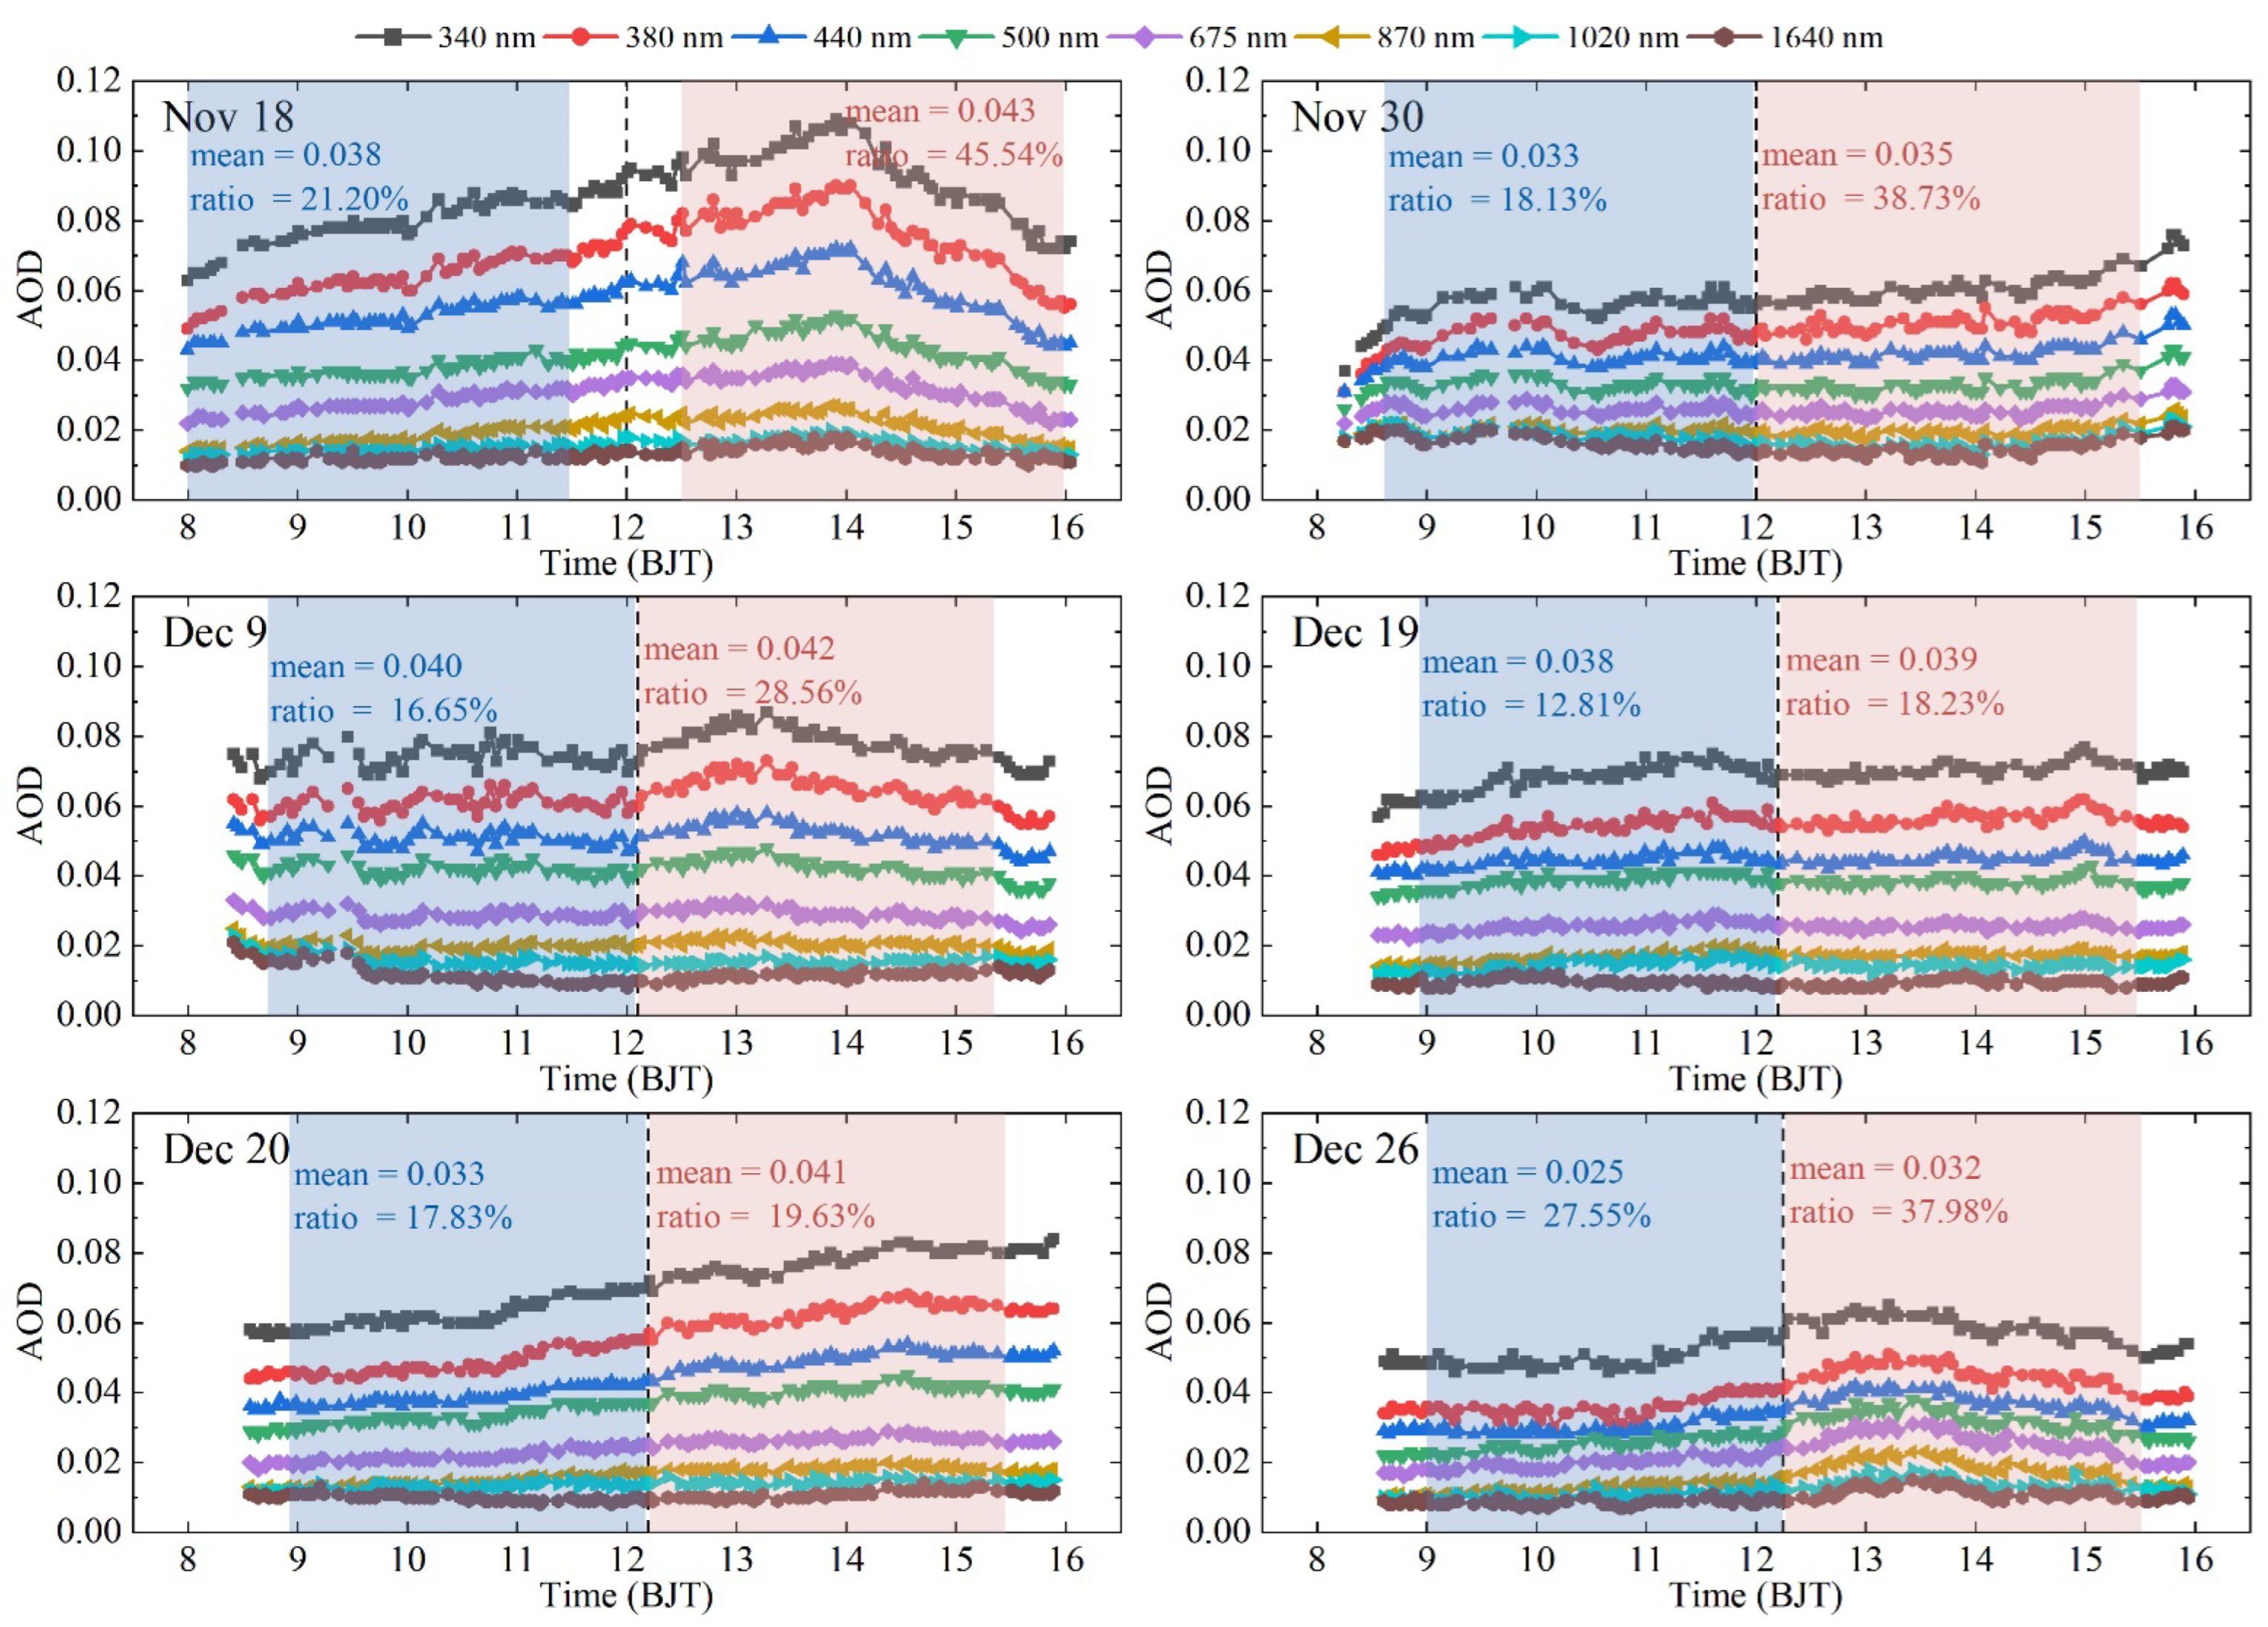
We calculated the diurnal AOD derived from the measured data for the six study days based on the final V 0 λ value to further evaluate the accuracy of the calibration coefficient (Figure 8). Because the final V 0 λ value was retrieved under clear, stable atmospheric conditions, it provided a unique opportunity to examine the spectral dependence of the AOD. The total uncertainty in the AOD calculation was <0.02 according to the inherent error of the algorithm; therefore, the spectral dependence could be regarded as an important indicator of the precision of V 0 λ , especially under the extremely low aerosol loading of the ambient background. Figure 8 shows that the daily AOD decreased as the wavelength increased from the ultraviolet to visible and near-infrared bands for each measurement. There were no obvious abnormalities in the AOD curves, which means that the observations were of good quality. There was no crossover of any of the AOD curves, suggesting a satisfactory AOD distribution from the precise V 0 λ . Toledano et al. [49] suggested that an aerosol loading with an AOD500 nm < 0.025 was suitable for a Langley calibration. In this study, the daily mean AOD500 nm varied from ~0.028 to 0.042. To clarify the difference in the AOD during the Langley observation period (air mass 2–5, as shown by the shaded squares in Figure 8) in the morning and afternoon, we used the mean and range ratio to show detailed features of the variation in aerosols. The mean AOD500 nm in the morning varied from 0.025 to 0.040, whereas the mean AOD500 nm in the afternoon was ~0.032–0.043, indicating relatively lower aerosol loading in the morning. The ratios in the morning (~16.65–27.55) were all lower than in the afternoon (~18.23–45.54%), implying that the vertical diffusion of aerosols could influence the atmospheric conditions at the MFYD Observatory, even in cold winters. It is, therefore, acceptable that we only included the morning observations in the Langley plot calibration.
The validation of the AOD with the reference results from other high-standard instruments is an essential part of evaluating the accuracy of the calibration. The WMO-PFR and AEROENT CE318 instruments are the devices most widely used for intercomparisons with field instruments [41,49,60,67]; however, because of the restrictions of the observation platform, we could only deploy one photometer at the MFYD Observatory in this campaign. We therefore decided to re-deploy this photometer at the CAMS Beijing site to conduct synchronous measurements with the AERONET master photometer from March 2018 to March 2019. The verification of the final V 0 λ values was, therefore, more detailed and complete with the reference AOD results from AERONET. The threshold of the interval time between these two photometers was set to ~30 s to avoid instantaneous disturbances of the atmospheric conditions.
Figure 9 compares the AODs from this field photometer with the AODs from AERONET at coincident spectral wavelengths. The calculated AODs generally agree well with the AERONET results, with R2 values of ~1.000 for 340–675 nm, ∼0.999 for 870–1020 nm and ∼0.998 for 1640 nm, suggesting that these AODs were similarly distributed on both sides of the y = x line. The values showed a relatively low linear correlation in the near-infrared bands (870–1640 nm) compared with those in the UV and visible bands (340–675 nm). These results can partly be explained by the temperature sensitivity of the near-infrared wavelengths because the retrievals could be slightly modified by the temperature readings acquired from the sensor in the device, even though the measured raw signals were the same. From these linear regressions, the slopes for 340–870 nm varied between ~0.992 and 0.999, whereas those for 1020 and 1640 nm were 1.005 and 1.004, respectively. This suggests that the calculated AOD tended to be lower than that from AERONET in the ultraviolet and visible bands, but the opposite trends were seen in the near-infrared bands (1020–1640 nm).
Expected error analyses are widely used to evaluate the overall distribution of the AOD and were, therefore, carried out with envelopes of ±(0.05 ± 10%). The calculated AOD values all achieved a satisfactory performance characterized by almost 100% retrievals for each band within the expected error. These distribution levels were much higher than the standard threshold of ∼70%, even though the maximum discrepancy was at 340 nm (~99.99% within the expected error and ~0.01 above the expected error) [31,60,68,69]. The RSD for the ultraviolet bands was ~0.011, whereas those for the other bands varied in the narrow range 0.006–0.008. This showed a relatively large deviation in the ultraviolet band, but the calculated AOD values in the other bands were more concentrated in the reference range. The overall fluctuation at each wavelength was demonstrated by the relative mean bias (RMB). Apart from a slight underestimation of ~0.1% (RMB = 0.999) at 870 nm, the AOD values were overestimated at other wavelengths. The largest discrepancy of ~6.6% (RMB = 1.066) was found at 1640 nm, with discrepancies of ~0.1% (675 nm and RMB = 1.001) to 1.009% (340 nm and RMB = 1.009) elsewhere. This may be attributed to the uncertainty in the calculation at low AOD levels because the values at 1640 nm were mostly <0.50 (~99.6%) during this intercomparison.
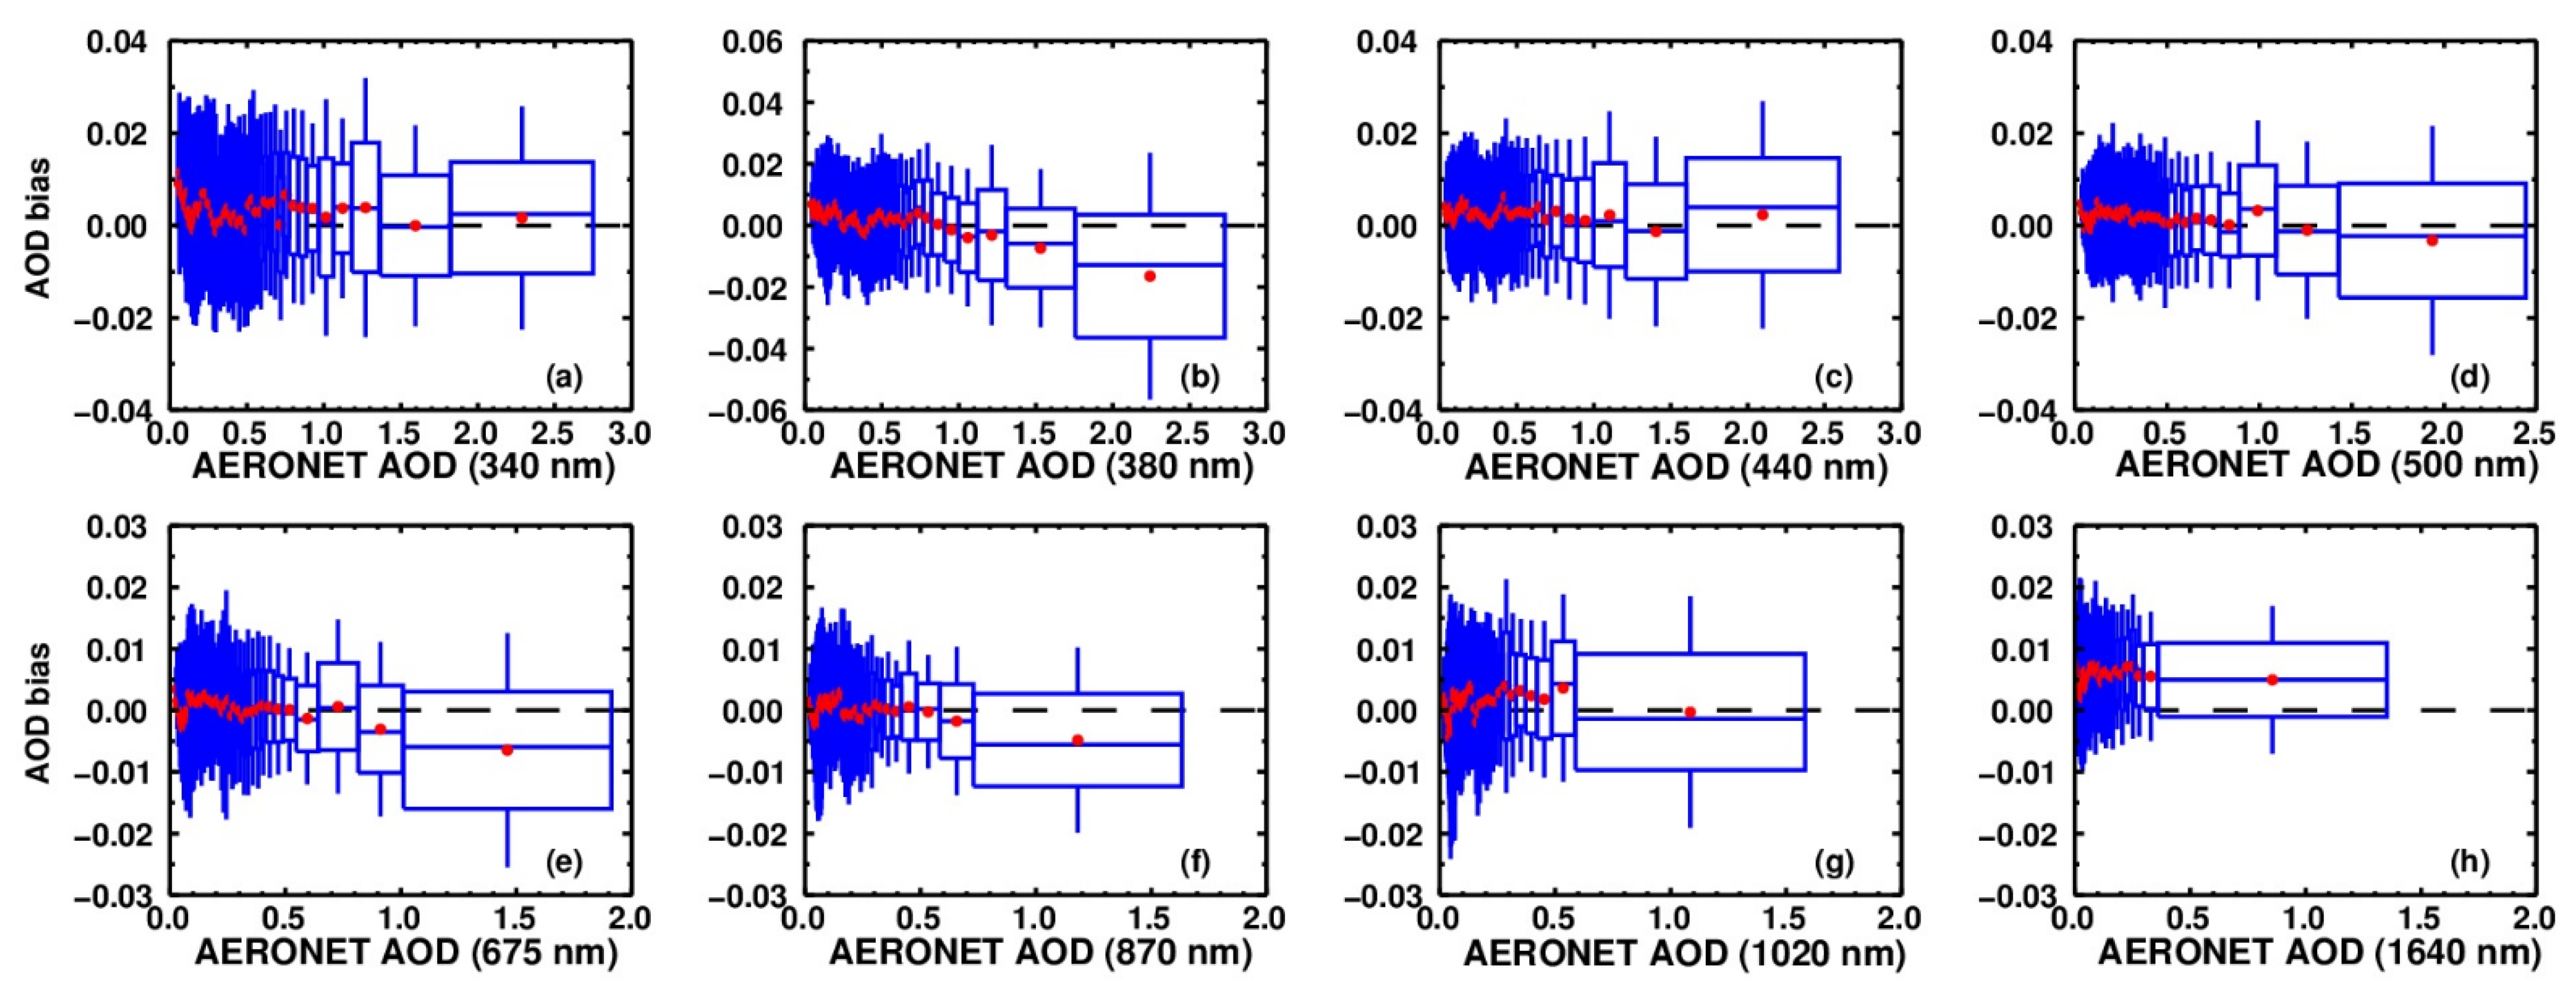
To present the distribution of the discrepancy in more detail, the calculated AOD values were compared with the equal-frequency bins of the reference AOD from AERONET. Figure 10 shows all the calculated AOD values sorted into ascending order and then sampled with 20 bins. The AOD bias for the visible and near-infrared wavelengths varied from −0.02 to 0.02, with the mean biases (red dots) concentrated within ±0.01. The biases for the ultraviolet bands were higher and varied in a broad range from −0.02 to 0.03 and from −0.05 to 0.03 at 340 and 380 nm, respectively. The mean biases for the ultraviolet bands were mostly concentrated within ±0.02 and the large fluctuations found between the total bias and the mean bias suggested a relatively large uncertainty in the ultraviolet bands. The variations in the bias distribution with the AOD at 380, 675 and 870 nm showed decreasing trends with increasing AOD values, with small random fluctuations in other bands. Although these decreasing trends were acceptable according to the statistical analyses, the main cause of the error was in the final V 0 λ values or in the filters and this requires further investigation. The bias analyses, therefore, suggest that the AOD retrievals gave satisfactory results based on the final V 0 λ value, indicating the accuracy of the Langley calibration performed at the MFYD Observatory.

4. Conclusions

We verified the Langley plots calibration of the Sun photometer at the MFYD Observatory in Beijing. We investigated whether this mountainous observatory could be considered as a Langley plot calibration platform using the aerosol climatology and a case study of six days. We then evaluated the calibration coefficient V 0 λ against the reference V 0 λ value and conducted a long-term intercomparison of the calculated AOD based on the V 0 λ with the AERONET’s reference AOD at the CAMS. Our conclusions can be summarized as follows.
  • The winter season may be more suitable for the application of the Langley calibration method at the MFYD Observatory, especially in the morning. Based on long-term observations, the monthly mean AOD440 nm over the MFYD Observatory peaked in spring (March–May) at ~0.26 ± 0.21, followed by ~0.25 ± 0.23 in summer (June–August), ~0.15 ± 0.16 in autumn (September–November) and ~0.13 ± 0.11 in winter (December–February). In addition, the 50th percentile of the AOD in winter, was <0.10, demonstrating the very clean atmospheric conditions over the MFYD Observatory. Although the atmospheric conditions were influenced by vertical diffusion caused by the deepened PBLH (as revealed by the diurnal variation of the AOD), relatively clean and stable atmospheric conditions were present in the morning, characterized by a smaller average AOD (~0.09–0.14) and lower ratio (~36.97–63.38%) compared with the values in the afternoon and over the whole day.
  • The six selected study days had stable atmospheric conditions and the final V 0 λ values from the morning observations were consistent with the reference V 0 λ . The daily average triplets were all <2% at all wavelengths; when the air mass was 2–5 in the morning (about 09:00–12:00 BJT), the triplets for the instantaneous observations were mostly <1% (with some outliers in the 340 and 380 nm bands). The RSS for the final V 0 λ at all wavelengths were <0.0002 and the RSD was <0.2%, indicating the precise results of the linear regression in these Langley plots. The results showed a great improvement was found in the linear regression at morning relative to the statistics obtained over the whole day, when the coefficient of determination and residual standard deviation were promoted by 0.22–2.90% and ~2.76–23.32, respectively. The final V 0 λ value was derived from 31 days of observation and the deviations from the reference of the V 0 λ were about −1.69, −1.29, −0.81, −0.42, −0.34, −0.22, −0.63 and −0.36% at 340, 380, 440, 500, 675, 870, 1020 and 1640 nm, respectively.
  • The AOD validation indicated the high accuracy of the final V 0 λ value compared with the reference AOD from AERONET. The regression analysis showed a perfect AOD performance, with 100% of the retrievals lying within the expected error (0.05 ± 10%) from 380 to 1640 nm and 99.99% for the 340 nm band. Good AOD agreement (R > 0.998) and RSD values ranging from ~0.006 to 0.011 were observed, with the RMB varying from 0.999 to 1.066. The AOD bias analysis showed an overall deviation for the visible and near-infrared wavelengths of −0.02 to 0.02, and −0.02 to 0.03 and −0.05 to 0.03 for 340 and 380 nm, respectively. The mean biases for the ultraviolet bands were concentrated within ±0.02 and ±0.01 for the other bands.
The results of this preliminary assessment and verification indicate that Langley plots are suitable for calibration of the photometer at the MFYD Observatory; however, as for the AOD validation, the drift of the final V 0 λ originating from the transportation and filter aging between the field observation and intercomparison at CAMS was neglected. Although this drift was small, it could indeed influence the AOD retrieval. The accuracy of the AOD, therefore, still needs to be tested further with long-term, in situ observations with a reference device, such as the master photometer and WMO-PFR, before establishing a calibration platform at the MFYD Observatory. In addition, the data used in the aerosol climatology were obtained from long-term observations at the MFYD Observatory and the Langley observation period was selected as November 2017–March 2018 from this database, mostly because these data were relatively continuous with a good device status. Despite the influence of the variable PBL over the MFYD Observatory, we found satisfactory conditions for the Langley plot calibration in winter. With the continuously improving air quality in Beijing, more suitable days with a low AOD for Langley calibrations can be expected. This work can, therefore, be regarded as a pilot study for the application of the Langley method at a mountainous observatory in eastern China, particularly when the atmospheric conditions are affected by the PBL.

Supplementary Materials

The following supporting information can be downloaded at: https://www.mdpi.com/article/10.3390/rs14174321/s1, Figure S1: Diurnal average digital count at each wavelength on the six days of this case study, Figure S2: Comparison of calibration coefficients at the MFYD Observatory and CAMS, Table S1. Statistical analysis of the linear regression for all the Langley plots on the six study days.

Author Contributions

Conceptualization, H.C.; methodology, Y.Z.; validation, K.G.; formal analysis, H.Z. (Hujia Zhao); investigation, X.X.; resources, L.L.; data curation, Y.Z.; writing—original draft preparation, Y.Z., Y.W., H.W. and Y.L.; writing—review and editing, H.C.; visualization, L.Z., X.Z. (Xinglu Zhang) and H.Z. (Hengheng Zhao); supervision, X.Z. (Xiaoye Zhang). All authors have read and agreed to the published version of the manuscript.

Funding

This research was funded by the National Science Fund for Distinguished Young Scholars (Grant Nos. 41825011), the National Natural Science Foundation of China project (Grant Nos. 42030608, 42105138, 41975161, 41905117, 42175153), and the Basic Research Fund of CAMS (Grant Nos. 2021Y003, 2020Z002).

Data Availability Statement

Datasets used in the present study are available from the corresponding author on reasonable request.

Acknowledgments

We are grateful to Wei Yan, Yongxue Wu and Wenxing Han of the Yanqing Meteorological Bureau for their assistance during this observation campaign.

Conflicts of Interest

The authors declare no conflict of interest.

References

  1. Charlson, R.J.; Schwartz, S.E.; Hales, J.M.; Cess, R.D.; Coakley, J.A., Jr.; Hansen, J.E.; Hofmann, D.J. Climate forcing by anthropogenic aerosols. Science 1992, 255, 423–430. [Google Scholar] [CrossRef] [PubMed]
  2. Letu, H.; Shi, J.; Li, M.; Wang, T.; Shang, H.; Lei, Y.; Ji, D.; Wen, J.; Yang, K.; Chen, L. A review of the estimation of downward surface shortwave radiation based on satellite data: Methods, progress and problems. Sci. China Earth Sci. 2020, 63, 774–789. [Google Scholar] [CrossRef]
  3. Zhao, H.; Gui, K.; Ma, Y.; Wang, Y.; Wang, Y.; Wang, H.; Zheng, Y.; Li, L.; Zhang, L.; Che, H.; et al. Climatological variations in aerosol optical depth and aerosol type identification in Liaoning of Northeast China based on MODIS data from 2002 to 2019. Sci. Total Environ. 2021, 781, 146810. [Google Scholar] [CrossRef]
  4. Li, L.; Che, H.; Derimian, Y.; Dubovik, O.; Luan, Q.; Li, Q.; Huang, X.; Zhao, H.; Gui, K.; Zheng, Y.; et al. Climatology of fine and coarse mode aerosol optical thickness over East and South Asia derived from POLDER/PARASOL satellite. J. Geophys. Res. Atmos. 2020, 125, e2020JD032665. [Google Scholar] [CrossRef]
  5. Zhuang, B.; Wang, T.; Liu, J.; Li, S.; Xie, M.; Han, Y.; Chen, P.; Hu, Q.; Yang, X.Q.; Fu, C.; et al. The surface aerosol optical properties in the urban area of Nanjing, west Yangtze River Delta, China. Atmos. Chem. Phys. 2017, 17, 1143–1160. [Google Scholar] [CrossRef]
  6. Ma, Y.; Zhang, M.; Jin, S.; Gong, W.; Chen, N.; Chen, Z.; Jin, Y.; Shi, Y. Long-term investigation of aerosol optical and radiative characteristics in a typical megacity of central China during winter haze periods. J. Geophys. Res. Atmos. 2019, 124, 12093–12106. [Google Scholar] [CrossRef]
  7. Bi, J.; Huang, J.; Hu, Z.; Holben, B.N.; Guo, Z. Investigating the aerosol optical and radiative characteristics of heavy haze episodes in Beijing during January of 2013. J. Geophys. Res. Atmos. 2014, 119, 9884–9900. [Google Scholar] [CrossRef]
  8. Ningombam, S.S.; Song, H.J.; Mugil, S.K.; Dumka, U.C.; Larson, E.J.L.; Kumar, B.; Sagar, R. Evaluation of fractional clear sky over potential astronomical sites. Mon. Not. R. Astron. Soc. 2021, 507, 3745–3760. [Google Scholar] [CrossRef]
  9. Bréon, F.-M.; Tanré, D.; Generoso, S. Aerosol effect on cloud droplet size monitored from satellite. Science 2002, 295, 834–838. [Google Scholar] [CrossRef]
  10. Letu, H.; Yang, K.; Nakajima, T.Y.; Ishimoto, H.; Nagao, T.M.; Riedi, J.; Baran, A.J.; Ma, R.; Wang, T.; Shang, H.; et al. High-resolution retrieval of cloud microphysical properties and surface solar radiation using Himawari-8/AHI next-generation geostationary satellite. Remote Sens. Environ. 2020, 239, 111583. [Google Scholar] [CrossRef]
  11. Li, L.; Che, H.; Derimian, Y.; Dubovik, O.; Schuster, G.L.; Chen, C.; Li, Q.; Wang, Y.; Guo, B.; Zhang, X. Retrievals of fine mode light-absorbing carbonaceous aerosols from POLDER/PARASOL observations over East and South Asia. Remote Sens. Environ. 2020, 247, 111913. [Google Scholar] [CrossRef]
  12. Zhang, X.; Li, L.; Chen, C.; Chen, X.; Dubovik, O.; Derimian, Y.; Gui, K.; Zheng, Y.; Zhao, H.; Zhang, L.; et al. Validation of the aerosol optical property products derived by the GRASP/component approach from multi-angular polarimetric observations. Atmos. Res. 2021, 263, 105802. [Google Scholar] [CrossRef]
  13. Miao, Y.; Liu, S.; Zheng, Y.; Wang, S.; Chen, B.; Zheng, H.; Zhao, J. Numerical study of the effects of local atmospheric circulations on a pollution event over Beijing–Tianjin–Hebei, China. J. Environ. Sci. 2015, 30, 9–20. [Google Scholar] [CrossRef] [PubMed]
  14. Xing, C.; Liu, C.; Hu, Q.; Fu, Q.; Wang, S.; Lin, H.; Zhu, Y.; Wang, S.; Wang, W.; Javed, Z.; et al. Vertical distributions of wintertime atmospheric nitrogenous compounds and the corresponding OH radicals production in Leshan, southwest China. J. Environ. Sci. 2021, 105, 44–55. [Google Scholar] [CrossRef]
  15. Gui, K.; Che, H.; Li, L.; Zheng, Y.; Zhang, L.; Zhao, H.; Zhong, J.; Yao, W.; Liang, Y.; Wang, Y.; et al. The significant contribution of small-sized and spherical aerosol particles to the decreasing trend in total aerosol optical depth over land from 2003 to 2018. Engineering, 2021, in press. [CrossRef]
  16. Liang, Y.; Che, H.; Gui, K.; Zheng, Y.; Yang, X.; Li, X.; Liu, C.; Sheng, Z.; Sun, T.; Zhang, X. Impact of biomass burning in South and Southeast Asia on background aerosol in southwest China. Aerosol Air Qual. Res. 2019, 19, 1188–1204. [Google Scholar] [CrossRef]
  17. Xing, C.; Liu, C.; Hu, Q.; Fu, Q.; Lin, H.; Wang, S.; Su, W.; Wang, W.; Javed, Z.; Liu, J. Identifying the wintertime sources of volatile organic compounds (VOCs) from MAX-DOAS measured formaldehyde and glyoxal in Chongqing, southwest China. Sci. Total Environ. 2020, 715, 136258. [Google Scholar] [CrossRef]
  18. Li, L.; Che, H.; Zhang, X.; Chen, C.; Chen, X.; Gui, K.; Liang, Y.; Wang, F.; Derimian, Y.; Fuertes, D.; et al. A satellite-measured view of aerosol component content and optical property in a haze-polluted case over North China Plain. Atmos. Res. 2022, 266, 105958. [Google Scholar] [CrossRef]
  19. Dubovik, O.; Holben, B.; Eck, T.F.; Smirnov, A.; Kaufman, Y.J.; King, M.D.; Tanré, D.; Slutsker, I. Variability of absorption and optical properties of key aerosol types observed in worldwide locations. J. Atmos. Sci. 2002, 59, 590–608. [Google Scholar] [CrossRef]
  20. Che, H.; Xia, X.; Zhao, H.; Dubovik, O.; Holben, B.N.; Goloub, P.; Cuevas-Agulló, E.; Estelles, V.; Wang, Y.; Zhu, J.; et al. Spatial distribution of aerosol microphysical and optical properties and direct radiative effect from the China aerosol remote sensing network. Atmos. Chem. Phys. 2019, 19, 11843–11864. [Google Scholar] [CrossRef] [Green Version]
  21. Huang, R.-J.; Zhang, Y.; Bozzetti, C.; Ho, K.-F.; Cao, J.-J.; Han, Y.; Daellenbach, K.R.; Slowik, J.G.; Platt, S.M.; Canonaco, F.; et al. High secondary aerosol contribution to particulate pollution during haze events in China. Nature 2014, 514, 218–222. [Google Scholar] [CrossRef]
  22. Xing, C.; Liu, C.; Wang, S.; Lok Chan, K.; Gao, Y.; Huang, X.; Su, W.; Zhang, C.; Dong, Y.; Fan, G.; et al. Observations of the vertical distributions of summertime atmospheric pollutants and the corresponding ozone production in Shanghai, China. Atmos. Chem. Phys. 2017, 17, 14275–14289. [Google Scholar] [CrossRef]
  23. Zhang, X.Y.; Wang, Y.Q.; Niu, T.; Zhang, X.C.; Gong, S.L.; Zhang, Y.M.; Sun, J.Y. Atmospheric aerosol compositions in China: Spatial/temporal variability, chemical signature, regional haze distribution and comparisons with global aerosols. Atmos. Chem. Phys. 2012, 12, 779–799. [Google Scholar] [CrossRef]
  24. Huang, X.; Wang, Z.; Ding, A. Impact of aerosol-PBL interaction on haze pollution: Multiyear observational evidences in North China. Geophys. Res. Lett. 2018, 45, 8596–8603. [Google Scholar] [CrossRef]
  25. Zhang, J.; Liu, L.; Wang, Y.; Ren, Y.; Wang, X.; Shi, Z.; Zhang, D.; Che, H.; Zhao, H.; Liu, Y.; et al. Chemical composition, source, and process of urban aerosols during winter haze formation in Northeast China. Environ. Pollut. 2017, 231, 357–366. [Google Scholar] [CrossRef] [PubMed]
  26. Gui, K.; Che, H.; Zheng, Y.; Zhao, H.; Yao, W.; Li, L.; Zhang, L.; Wang, H.; Wang, Y.; Zhang, X. Three-dimensional climatology, trends, and meteorological drivers of global and regional tropospheric type-dependent aerosols: Insights from 13 years (2007–2019) of CALIOP observations. Atmos. Chem. Phys. 2021, 21, 15309–15336. [Google Scholar] [CrossRef]
  27. Kazadzis, S.; Kouremeti, N.; Nyeki, S.; Gröbner, J.; Wehrli, C. The world optical depth research and calibration center (WORCC) quality assurance and quality control of GAW-PFR AOD measurements. Geosci. Instrum. Methods Data Syst. 2018, 7, 39–53. [Google Scholar] [CrossRef]
  28. Gui, K.; Yao, W.; Che, H.; An, L.; Zheng, Y.; Li, L.; Zhao, H.; Zhang, L.; Zhong, J.; Wang, Y.; et al. Record-breaking dust loading during two mega dust storm events over northern China in March 2021: Aerosol optical and radiative properties and meteorological drivers. Atmos. Chem. Phys. 2022, 22, 7905–7932. [Google Scholar] [CrossRef]
  29. Li, L.; Derimian, Y.; Chen, C.; Zhang, X.; Che, H.; Schuster, G.L.; Fuertes, D.; Litvinov, P.; Lapyonok, T.; Lopatin, A.; et al. Climatology of aerosol component concentrations derived from multi-angular polarimetric POLDER-3 observations using GRASP algorithm. Earth Syst. Sci. Data 2022, 14, 3439–3469. [Google Scholar] [CrossRef]
  30. Sayer, A.M.; Hsu, N.C.; Bettenhausen, C.; Jeong, M.J.; Holben, B.N.; Zhang, J. Global and regional evaluation of over-land spectral aerosol optical depth retrievals from SeaWiFS. Atmos. Meas. Tech. 2012, 5, 1761–1778. [Google Scholar] [CrossRef] [Green Version]
  31. Che, H.; Yang, L.; Liu, C.; Xia, X.; Wang, Y.; Wang, H.; Wang, H.; Lu, X.; Zhang, X. Long-term validation of MODIS C6 and C6.1 dark target aerosol products over China using CARSNET and AERONET. Chemosphere 2019, 236, 124268. [Google Scholar] [CrossRef]
  32. Wei, J.; Li, Z.; Peng, Y.; Sun, L. MODIS Collection 6.1 aerosol optical depth products over land and ocean: Validation and comparison. Atmos. Environ. 2019, 201, 428–440. [Google Scholar] [CrossRef]
  33. Shahid, M.Z.; Shahid, I.; Chishtie, F.; Shahzad, M.I.; Bulbul, G. Analysis of a dense haze event over North-eastern Pakistan using WRF-Chem model and remote sensing. J. Atmos. Sol.-Terr. Phys. 2019, 182, 229–241. [Google Scholar] [CrossRef]
  34. Kim, M.H.; Omar, A.H.; Tackett, J.L.; Vaughan, M.A.; Winker, D.M.; Trepte, C.R.; Hu, Y.; Liu, Z.; Poole, L.R.; Pitts, M.C.; et al. The CALIPSO version 4 automated aerosol classification and lidar ratio selection algorithm. Atmos. Meas. Tech. 2018, 11, 6107–6135. [Google Scholar] [CrossRef] [PubMed]
  35. Eck, T.F.; Holben, B.N.; Reid, J.S.; Dubovik, O.; Smirnov, A.; O’Neill, N.T.; Slutsker, I.; Kinne, S. Wavelength dependence of the optical depth of biomass burning, urban, and desert dust aerosols. J. Geophys. Res. Atmos. 1999, 104, 31333–31349. [Google Scholar] [CrossRef]
  36. Zhang, X.; Wang, H.; Che, H.Z.; Tan, S.C.; Shi, G.Y.; Yao, X.P.; Zhao, H.J. Improvement of snow/haze confusion data gaps in MODIS dark target aerosol retrievals in East China. Atmos. Res. 2020, 245, 105063. [Google Scholar] [CrossRef]
  37. Toledano, C.; Torres, B.; Velasco-Merino, C.; Althausen, D.; Groß, S.; Wiegner, M.; Weinzierl, B.; Gasteiger, J.; Ansmann, A.; González, R.; et al. Sun photometer retrievals of Saharan dust properties over Barbados during SALTRACE. Atmos. Chem. Phys. 2019, 19, 14571–14583. [Google Scholar] [CrossRef]
  38. Xia, X.; Che, H.; Shi, H.; Chen, H.; Zhang, X.; Wang, P.; Goloub, P.; Holben, B. Advances in sunphotometer-measured aerosol optical properties and related topics in China: Impetus and perspectives. Atmos. Res. 2021, 249, 105286. [Google Scholar] [CrossRef] [PubMed]
  39. Che, H.; Zhang, X.Y.; Xia, X.; Goloub, P.; Holben, B.; Zhao, H.; Wang, Y.; Zhang, X.C.; Wang, H.; Blarel, L.; et al. Ground-based aerosol climatology of China: Aerosol optical depths from the China aerosol remote sensing network (CARSNET) 2002–2013. Atmos. Chem. Phys. 2015, 15, 7619–7652. [Google Scholar] [CrossRef]
  40. Nakajima, T.; Campanelli, M.; Che, H.; Estellés, V.; Irie, H.; Kim, S.W.; Kim, J.; Liu, D.; Nishizawa, T.; Pandithurai, G.; et al. An overview of and issues with sky radiometer technology and SKYNET. Atmos. Meas. Tech. 2020, 13, 4195–4218. [Google Scholar] [CrossRef]
  41. Cuevas, E.; Romero-Campos, P.M.; Kouremeti, N.; Kazadzis, S.; Räisänen, P.; García, R.D.; Barreto, A.; Guirado-Fuentes, C.; Ramos, R.; Toledano, C.; et al. Aerosol optical depth comparison between GAW-PFR and AERONET-Cimel radiometers from long-term (2005–2015) 1 min synchronous measurements. Atmos. Meas. Tech. 2019, 12, 4309–4337. [Google Scholar] [CrossRef]
  42. Holben, B.N.; Eck, T.F.; Slutsker, I.; Tanré, D.; Buis, J.P.; Setzer, A.; Vermote, E.; Reagan, J.A.; Kaufman, Y.J.; Nakajima, T.; et al. AERONET—A federated instrument network and data archive for aerosol characterization. Remote Sens. Environ. 1998, 66, 1–16. [Google Scholar] [CrossRef]
  43. Goloub, P.; Li, Z.; Dubovik, O.; Blarel, L.; Podvin, T.; Jankowiak, I.; Lecoq, R.; Deroo, C.; Chatenet, B.; Morel, J.P.; et al. PHOTONS/AERONET sunphotometer network overview: Description, activities, results. In Proc. SPIE, Proceedings of the Fourteenth International Symposium on Atmospheric and Ocean Optics/Atmospheric Physics, Buryatia, Russian, 24–30 June 2007; SPIE: Bellingham, WA, USA, 2008; Volume 6936, pp. 218–232. [Google Scholar] [CrossRef]
  44. Che, H.; Xia, X.; Zhu, J.; Li, Z.; Dubovik, O.; Holben, B.; Goloub, P.; Chen, H.; Estelles, V.; Cuevas-Agulló, E.; et al. Column aerosol optical properties and aerosol radiative forcing during a serious haze-fog month over North China Plain in 2013 based on ground-based sunphotometer measurements. Atmos. Chem. Phys. 2014, 14, 2125–2138. [Google Scholar] [CrossRef]
  45. Kazadzis, S.; Kouremeti, N.; Diémoz, H.; Gröbner, J.; Forgan, B.W.; Campanelli, M.; Estellés, V.; Lantz, K.; Michalsky, J.; Carlund, T.; et al. Results from the fourth WMO filter radiometer comparison for aerosol optical depth measurements. Atmos. Chem. Phys. 2018, 18, 3185–3201. [Google Scholar] [CrossRef]
  46. Che, H.; Wang, Y.; Sun, J.; Zhang, X. Assessment of in-situ Langley calibration of CE-318 sunphotometer at Mt. Waliguan observatory, China. Sola 2011, 7, 89–92. [Google Scholar] [CrossRef]
  47. Campanelli, M.; Estellés, V.; Tomasi, C.; Nakajima, T.; Malvestuto, V.; Martínez-Lozano, J.A. Application of the SKYRAD improved Langley plot method for the in situ calibration of CIMEL sun-sky photometers. Appl. Opt. 2007, 46, 2688–2702. [Google Scholar] [CrossRef]
  48. Tao, R.; Che, H.; Chen, Q.; Wang, Y.; Sun, J.; Zhang, X.; Lu, S.; Guo, J.; Wang, H.; Zhang, X. Development of an integrating sphere calibration method for Cimel sunphotometers in China aerosol remote sensing network. Particuology 2014, 13, 88–99. [Google Scholar] [CrossRef]
  49. Toledano, C.; González, R.; Fuertes, D.; Cuevas, E.; Eck, T.F.; Kazadzis, S.; Kouremeti, N.; Gröbner, J.; Goloub, P.; Blarel, L.; et al. Assessment of sun photometer Langley calibration at the high-elevation sites Mauna Loa and Izaña. Atmos. Chem. Phys. 2018, 18, 14555–14567. [Google Scholar] [CrossRef]
  50. Zheng, Y.; Che, H.; Xia, X.; Wang, Y.; Yang, L.; Chen, J.; Wang, H.; Zhao, H.; Li, L.; Zhang, L.; et al. Aerosol optical properties and its type classification based on multiyear joint observation campaign in north China plain megalopolis. Chemosphere 2021, 273, 128560. [Google Scholar] [CrossRef]
  51. Zheng, Y.; Che, H.; Xia, X.; Wang, Y.; Wang, H.; Wu, Y.; Tao, J.; Zhao, H.; An, L.; Li, L.; et al. Five-year observation of aerosol optical properties and its radiative effects to planetary boundary layer during air pollution episodes in North China: Intercomparison of a plain site and a mountainous site in Beijing. Sci. Total Environ. 2019, 674, 140–158. [Google Scholar] [CrossRef]
  52. Wang, H.; Li, Z.; Lv, Y.; Xu, H.; Li, K.; Li, D.; Hou, W.; Zheng, F.; Wei, Y.; Ge, B. Observational study of aerosol-induced impact on planetary boundary layer based on lidar and sunphotometer in Beijing. Environ. Pollut. 2019, 252, 897–906. [Google Scholar] [CrossRef]
  53. Zhong, J.; Zhang, X.; Wang, Y.; Wang, J.; Shen, X.; Zhang, H.; Wang, T.; Xie, Z.; Liu, C.; Zhang, H.; et al. The two-way feedback mechanism between unfavorable meteorological conditions and cumulative aerosol pollution in various haze regions of China. Atmos. Chem. Phys. 2019, 19, 3287–3306. [Google Scholar] [CrossRef]
  54. Miao, Y.; Che, H.; Zhang, X.; Liu, S. Integrated impacts of synoptic forcing and aerosol radiative effect on boundary layer and pollution in the Beijing-Tianjin-Hebei region, China. Atmos. Chem. Phys. 2020, 20, 5899–5909. [Google Scholar] [CrossRef]
  55. Schmid, B.; Wehrli, C. Comparison of Sun photometer calibration by use of the Langley technique and the standard lamp. Appl. Opt. 1995, 34, 4500–4512. [Google Scholar] [CrossRef]
  56. Liu, C.; Yang, L.; Che, H.; Xia, X.; Zhao, H.; Wang, H.; Gui, K.; Zheng, Y.; Sun, T.; Li, X.; et al. Aerosol optical properties over an urban site in central China determined using ground-based sun photometer measurements. Aerosol Air Qual. Res. 2019, 19, 620–638. [Google Scholar] [CrossRef]
  57. Che, H.; Zhang, X.; Chen, H.; Damiri, B.; Goloub, P.; Li, Z.; Zhang, X.; Wei, Y.; Zhou, H.; Dong, F.; et al. Instrument calibration and aerosol optical depth validation of the China aerosol remote sensing network. J. Geophys. Res. Atmos. 2009, 114, D03206. [Google Scholar] [CrossRef]
  58. Zhao, H.; Che, H.; Xia, X.; Wang, Y.; Wang, H.; Wang, P.; Ma, Y.; Yang, H.; Liu, Y.; Wang, Y.; et al. Multiyear ground-based measurements of aerosol optical properties and direct radiative effect over different surface types in northeastern China. J. Geophys. Res. Atmos. 2018, 123, 13887–13916. [Google Scholar] [CrossRef]
  59. Che, H.; Qi, B.; Zhao, H.; Xia, X.; Eck, T.F.; Goloub, P.; Dubovik, O.; Estelles, V.; Cuevas-Agulló, E.; Blarel, L.; et al. Aerosol optical properties and direct radiative forcing based on measurements from the China aerosol remote sensing network (CARSNET) in eastern China. Atmos. Chem. Phys. 2018, 18, 405–425. [Google Scholar] [CrossRef]
  60. Zheng, Y.; Che, H.; Wang, Y.; Xia, X.; Hu, X.; Zhang, X.; Zhu, J.; Zhu, J.; Zhao, H.; Li, L.; et al. Evaluation of aerosol microphysical, optical and radiative properties measured with a multiwavelength photometer. Atmos. Meas. Tech. 2022, 15, 2139–2158. [Google Scholar] [CrossRef]
  61. Sheng, Z.; Che, H.; Chen, Q.; Xia, X.; Liu, D.; Wang, Z.; Zhao, H.; Gui, K.; Zheng, Y.; Sun, T.; et al. Aerosol vertical distribution and optical properties of different pollution events in Beijing in autumn 2017. Atmos. Res. 2019, 215, 193–207. [Google Scholar] [CrossRef]
  62. Zheng, Y.; Che, H.; Yang, L.; Chen, J.; Wang, Y.; Xia, X.; Zhao, H.; Wang, H.; Wang, D.; Gui, K.; et al. Optical and radiative properties of aerosols during a severe haze episode over the North China Plain in December 2016. J. Meteorol. Res. 2018, 31, 1045–1061. [Google Scholar] [CrossRef]
  63. Barreto, Á.; Cuevas, E.; Granados-Muñoz, M.J.; Alados-Arboledas, L.; Romero, P.M.; Gröbner, J.; Kouremeti, N.; Almansa, A.F.; Stone, T.; Toledano, C.; et al. The new sun-sky-lunar Cimel CE318-T multiband photometer—A comprehensive performance evaluation. Atmos. Meas. Tech. 2016, 9, 631–654. [Google Scholar] [CrossRef]
  64. Estellés, V.; Campanelli, M.; Utrillas, M.P.; Expósito, F.; Martínez-Lozano, J.A. Comparison of AERONET and SKYRAD4.2 inversion products retrieved from a Cimel CE318 sunphotometer. Atmos. Meas. Tech. 2012, 5, 569–579. [Google Scholar] [CrossRef]
  65. Nevada, S.; Alcántara-Ruiz, E.A.; Olmo, F.J.; Alados-Arboledas, L. Langley calibrations of sunphotometer at Sierra Nevada, Granada, Spain. Opt. Pura Apl. 2004, 37, 3263–3269. [Google Scholar]
  66. Dutton, E.G.; Reddy, P.; Ryan, S.; Deluisi, J.J. Features and effects of aerosol optical depth observed at Mauna Loa, Hawaii: 1982–1992. J. Geophys. Res. Atmos. 1994, 99, 8295–8306. [Google Scholar] [CrossRef]
  67. Barreto, A.; Cuevas, E.; Pallé, P.; Romero, P.M.; Guirado, C.; Wehrli, C.J.; Almansa, F. Recovering long-term aerosol optical depth series (1976–2012) from an astronomical potassium-based resonance scattering spectrometer. Atmos. Meas. Tech. 2014, 7, 4103–4116. [Google Scholar] [CrossRef]
  68. Levy, R.C.; Remer, L.A.; Kleidman, R.G.; Mattoo, S.; Ichoku, C.; Kahn, R.; Eck, T.F. Global evaluation of the collection 5 MODIS dark-target aerosol products over land. Atmos. Chem. Phys. 2010, 10, 10399–10420. [Google Scholar] [CrossRef]
  69. Yang, L.; Tian, X.; Liu, C.; Ji, W.; Zheng, Y.; Liu, H.; Lu, X.; Che, H. Evaluation and comparison of MODIS C6 and C6.1 deep blue aerosol products in arid and semi-arid areas of northwestern China. Remote Sens. 2022, 14, 1935. [Google Scholar] [CrossRef]
Figure 1. Geographical information for the two sites used in this observational campaign.
Remotesensing 14 04321 g001
Figure 2. Monthly mean AOD440 nm and the Ångström exponent (AE) (440−870 nm) at the MFYD Observatory from 2013 to 2019. The blue circles and central lines indicate the mean and median values of the AOD and the blue shaded area and cross sign represent the density distribution and the 99th percentile of the AOD. The red diamonds indicate the mean Ångström exponent and the red shaded area represents the standard deviation.
Remotesensing 14 04321 g002
Figure 3. Diurnal variation of the hourly mean AOD440 nm and Ångström exponent (440−870 nm) at the MFYD Observatory. The shaded areas represent the standard deviation.
Remotesensing 14 04321 g003
Figure 4. Diurnal triplet ratios at each wavelength on the six study days.
Remotesensing 14 04321 g004
Figure 5. Daily variation of the average triplet ratio at each wavelength on the six study days.
Remotesensing 14 04321 g005
Figure 6. Langley plots for the six study days during daytime observations.
Remotesensing 14 04321 g006
Figure 7. Langley plots acquired in the morning on the six study days.
Remotesensing 14 04321 g007
Figure 8. The diurnal AOD derived from the measured data on the six study days based on the final V 0 λ values. The blue and red shaded areas represent the observation time under an air mass of 2–5 in the morning and afternoon, respectively.
Remotesensing 14 04321 g008
Figure 9. Validation of the calculated AOD at each wavelength (from 340 to 1640 nm (ah)) against the AERONET AOD. The one-to-one line, the linear regression line and the expected error envelopes of ±(0.05 ± 10%) are plotted as dashed red, solid green and dashed black lines, respectively.
Remotesensing 14 04321 g009
Figure 10. Box plots of the calculated AOD bias at each wavelength (from 340 to 1640 nm (ah)) and AERONET AOD using the 25th and 75th percentiles with 20 bins. The dashed black line indicates zero bias. The red dots, middle line, and upper and lower hinges represent the mean and median of the AOD bias and the 25th and 75th percentiles, respectively.
Remotesensing 14 04321 g010
Table 1. Monthly mean statistics of the variation of the AOD at the MFYD Observatory.
DaytimeMorningAfternoon
MonthAODRatio (%)AODRatio (%)AODRatio (%)
January0.1499.000.1236.970.1584.15
February0.1781.430.1443.490.1957.42
March0.29100.410.2359.710.3562.27
April0.30152.340.2350.700.36115.39
May0.2774.790.2352.000.3053.67
June0.37106.280.2993.040.4556.94
July0.38141.510.1985.690.5176.94
August0.19129.080.1788.860.20121.38
September0.15151.550.13106.510.17117.96
October0.20107.870.1755.930.2283.07
November0.13111.350.1068.590.1573.97
December0.1093.560.0963.380.1079.96
Table 2. Variation in meteorological parameters for the six study days. The P, T, RH, WD, and WS stand for pressure (hPa), temperature (°C), relative humidity (%), wind direction (°) and wind speed (m/s), respectively.
PTRHWDWS
11 − 18873 ± 2−1 ± 198 ± 199 ± 322 ± 1
11 − 30879 ± 1−5 ± 275 ± 19298 ± 264 ± 3
12 − 09881 ± 1−8 ± 250 ± 12243 ± 1054 ± 3
12 − 19881 ± 1−1 ± 242 ± 6302 ± 174 ± 1
12 − 20884 ± 11 ± 137 ±46230 ± 762 ± 1
12 − 26884 ± 1−8 ± 245 ± 13323 ± 135 ± 1
Table 3. Statistical analysis of the linear regression for Langley plots at the MFYD Observatory.
340 nm380 nm440 nm500 nm675 nm870 nm1020 nm1640 nm
11 − 18R20.9999 0.9999 0.9997 0.9990 0.9978 0.9804 0.9589 0.9770
RSS1.7529 × 10−41.4741 × 10−41.2844 × 10−41.8140 × 10−41.6100 × 10−49.9779 × 10−41.3662 × 10−41.1594 × 10⁻⁴
RSD0.1872%0.1717%0.1603%0.1905%0.1794%0.1413%0.1653%0.1523%
11 − 30R20.9993 0.9990 0.9983 0.9975 0.9952 0.9798 0.9723 0.9802
RSS1.0191 × 10−41.6877 × 10−41.4532 × 10−41.2159 × 10−41.4447 × 10−41.2952 × 10−41.1619 × 10−41.6613 × 10⁻⁴
RSD0.1428%0.1837%0.1705%0.1559%0.1700%0.1609%0.1524%0.1823%
12 − 09R20.9997 0.9995 0.9990 0.9983 0.9943 0.9746 0.9766 0.9636
RSS1.5700 × 10−41.3332 × 10−41.0536 × 10−41.1614 × 10−41.0732 × 10−41.2995 × 10−41.8142 × 10−41.0628 × 10⁻⁴
RSD0.1772%0.1633%0.1452%0.1524%0.1465%0.1612%0.1905%0.1458%
12 − 19R20.9999 0.9998 0.9996 0.9993 0.9986 0.9923 0.9725 0.9918
RSS1.2213 × 10−41.1553 × 10−41.2823 × 10−41.8545 × 10−41.0179 × 10−41.4898 × 10−41.0439 × 10−41.6001 × 10⁻⁴
RSD0.1563%0.1520%0.1601%0.1926%0.1427%0.1726%0.1445%0.1789%
12 − 20R20.99990.9997 0.9994 0.9993 0.9976 0.9877 0.9806 0.9909
RSS1.4297 × 10−41.6543 × 10−41.4838 × 10−41.4486 × 10−41.1633 × 10−41.7894 × 10−41.3181 × 10−41.7672 × 10⁻⁴
RSD0.1691%0.1819%0.1723%0.1702%0.1525%0.1892%0.1624%0.1880%
12 − 26R20.99960.9993 0.9987 0.9978 0.9924 0.9508 0.9810 0.9622
RSS1.0444 × 10−41.2334 × 10−41.5139 × 10−41.8241 × 10−41.3982 × 10−41.7817 × 10−41.2893 × 10−41.7339 × 10⁻⁴
RSD0.1445%0.1571%0.1740%0.1910%0.1672%0.1888%0.1606%0.1862%
Table 4. Langley plot calibration results at the MFYD Observatory.
Calibration   Constant   L n ( V 0 λ )
340 nm380 nm440 nm500 nm675 nm870 nm1020 nm1640 nm
11 − 189.69119.83339.22289.974410.00759.57299.11569.3191
11 − 279.69469.83139.22419.967610.01069.57379.09899.3209
11 − 289.72639.85439.22479.987710.01439.57299.13059.3147
11 − 309.71849.85659.24779.984610.03169.59379.10589.3416
12 − 059.70159.83569.22509.977210.01569.57619.11079.3258
12 − 069.70779.84179.22439.977510.02429.58499.11049.3417
12 − 079.70489.85229.23129.982110.02509.58769.12749.3355
12 − 099.71189.85899.24279.986310.01179.58789.12379.3367
12 − 129.70169.84219.23069.967910.01169.56949.10349.3145
12 − 139.70989.84899.23769.978510.01969.58279.11499.3274
12 − 189.69979.83679.22579.965610.01289.57809.10649.3264
12 − 199.71339.85749.24669.983710.02489.58539.10749.3293
12 − 209.70929.84799.22769.980110.02329.58479.11359.3308
12 − 219.69419.83239.23239.981510.01939.58629.11369.3301
12 − 239.70119.84629.23659.987110.02139.59309.12529.3325
12 − 249.71099.84619.23669.979510.00909.56909.09599.3200
12 − 269.71029.85689.23279.985010.02049.58379.10309.3217
12 − 289.70659.83779.22779.977010.02149.57609.11669.3322
12 − 299.70709.83059.22269.969310.00949.58109.12629.3248
12 − 309.70569.84109.22669.961310.00319.56429.10179.3171
1 − 039.70249.83719.23149.974710.02719.59379.12639.3450
1 − 059.70499.85569.22999.979210.01829.58619.11089.3425
1 − 109.69149.84149.23489.973910.02289.58849.10319.3355
1 − 129.70459.83779.22709.971210.01519.57869.11889.3253
1 − 139.70869.84909.23809.982610.02569.59729.12179.3406
1 − 159.70519.84659.23499.970910.01919.58519.12259.3324
1 − 179.70049.83909.22509.968510.01579.56859.11649.3157
1 − 189.70329.84829.23629.971310.01989.58579.10809.3293
1 − 209.69639.83849.23109.960010.01869.57099.09759.3182
1 − 219.70579.84609.23029.967910.00559.57169.10569.3115
1 − 309.71379.84629.23719.973810.01039.59189.11919.3351
Mean9.70529.84439.23179.975710.01729.58139.11299.3282
STDEV0.00750.00810.00650.00740.00680.00860.00950.0092
RSS0.00170.00210.00130.00170.00140.00230.00280.0026
RSD0.7611%0.8279%0.6651%0.7536%0.6893%0.8745%0.9608%0.9305%
Publisher’s Note: MDPI stays neutral with regard to jurisdictional claims in published maps and institutional affiliations.