Technical Note

Real-Time Synchronous 3-D Detection of Air Pollution and Wind Using a Solo Coherent Doppler Wind Lidar

1
School of Atmospheric Physics, Nanjing University of Information Science and Technology, Nanjing 210044, China
2
School of Earth and Space Science, University of Science and Technology of China, Hefei 230026, China
3
Nanjing Taixin Co., Ltd., Nanjing 211899, China
4
National Laboratory for Physical Sciences at the Microscale, University of Science and Technology of China, Hefei 230026, China
5
Institute of Software, Chinese Academy of Sciences, Beijing 100190, China
*
Author to whom correspondence should be addressed.
Remote Sens. 2022, 14(12), 2809; https://doi.org/10.3390/rs14122809
Submission received: 24 April 2022 / Revised: 19 May 2022 / Accepted: 9 June 2022 / Published: 11 June 2022
(This article belongs to the Special Issue Stereoscopic Remote Sensing of Air Pollutants and Applications)

Abstract

:
The monitoring and tracking of urban air pollution is a challenging environmental issue. The approach of synchronous 3-D detection of wind and pollution using a solo coherent Doppler wind lidar (CDWL) is developed and demonstrated. The 3-D distribution of pollutant is depicted by the backscatter coefficient based on signal intensity of CDWL. Then, a high-resolution wind field is derived to track the local air pollution source with its diffusion and to analyze transboundary air pollution episodes. The approach is experimentally implemented in a chemical industry park. Smoke plumes caused by point source pollutions are captured well using plan position indicator (PPI) scanning with low elevation. A typical source of pollution is located, combining the trajectory of the smoke plume and the horizontal wind vector. In addition, transboundary air pollution caused by the transport of dust storms is detected in a vertical profile scanning pattern, which is consistent with the results of national monitoring stations and backward trajectory models. Our present work provides a significant 3-D detection approach to air pollution monitoring with its sources, paths, and heights by using a solo-CDWL system.

Graphical Abstract

1. Introduction

With the rapid development of industrialization and urbanization, air pollution caused by anthropogenic aerosols is increasing [1]. Urban air pollution has become a serious environmental issue affecting human health [1,2]. Developing effective instruments to observe aerosols optical properties is of great significance to the research on the transport and diffusion of urban air pollution.
Previous studies of global or regional scales air pollution are mainly reliant on satellite sensors [3,4], numerical modelling [5,6], and ground-based instruments [7,8]. Satellite-based aerosol retrievals are limited by radiometric and calibration errors of the sensors, the surface reflectance, and cloud contamination [9]. The verification of numerical modelling needs high quality measurement values to improve the accuracy. Aerosols exhibit high temporal and spatial variations due to their various sources of emissions, sinks, and short residence times in the atmosphere [9,10,11,12,13,14]. The temporal-spatial resolution of satellites and modelling is not enough for air pollution research in a small-scale region. Thus, many works have been conducted to monitor air pollution using incoherent ground-based aerosol lidars, which can provide the distribution and change in atmospheric particulate with a high resolution [15,16,17,18,19,20,21]. However, without synchronous high-resolution 3-D wind and aerosol information, it is difficult for most aerosol lidars to identify the transport height of transboundary air pollutants and to study the local mixing process of air pollutants [19,21,22], let alone analyzing the relationships between wind characteristics (including wind direction, vertical speed, windshear, turbulence intensity) and aerosol pollution episodes. Therefore, to track the source of pollution and study its diffusion, multiple meteorological elements are required, especially for the wind field.
Coherent Doppler wind lidar (CDWL) has been widely used in the measurement of atmospheric wind field, with the advantages of simple construction, strong anti-interference capability, wide detection range, and superior real-time performance [23,24,25,26,27,28,29,30,31,32]. Recently, CDWLs have been extended to detection of precipitation [33,34], cloud seeding [35], and melting layer [36] by deep analysis of the power spectrum. Meanwhile, the echo signal power of CDWL also characterizes the concentration of the atmospheric aerosol. The related studies have been conducted for many years [37,38,39,40,41,42,43,44,45]. With multiple products retrieved by CDWL, it can be developed as a new way for air pollution detection.
In this work, a single CDWL with the ability to retrieve an atmospheric wind field as well as backscatter coefficient was applied to provide an urban air pollution detection service. The site and data resources are described in Section 2. For the first time, the method of local point source pollution tracking by combining with a spatial slice of the plume and two-dimensional wind field and the in-depth analysis of a transboundary layered dust pollution episode are demonstrated with a solo CDWL, as introduced in Section 3. Finally, a conclusion is drawn in Section 4. If not specified, local time is used.

2. Site and Data Resources

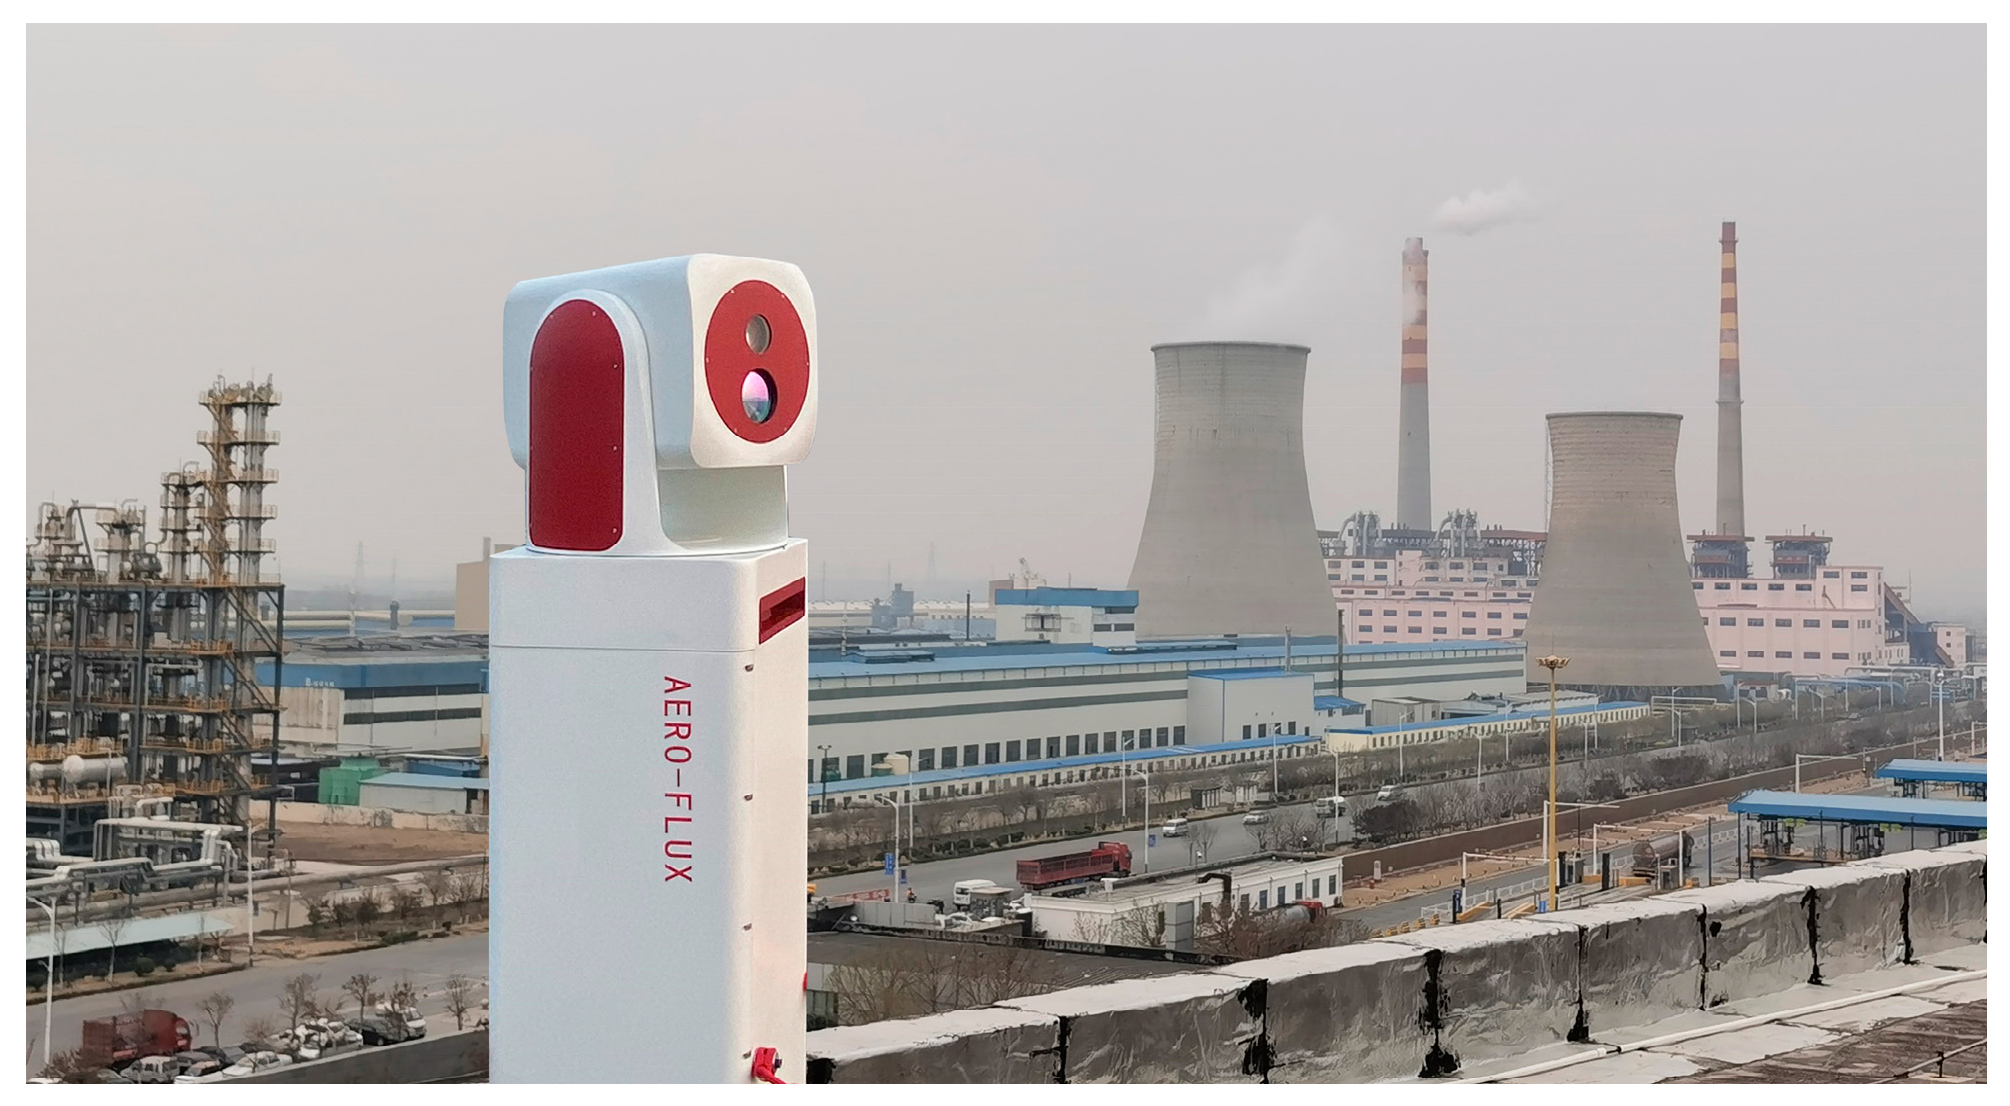
2.1. Ground-Based Lidar Measurements

The field experiment was performed in Binzhou City, Shandong province, China (37°11′N, 118°13′E), where the local government attaches great importance to pollution control and monitoring. The observation period was from 25 March to 30 March 2021. The emitted light is affected by the surrounding buildings, and the CDWL should be placed as high as possible. As shown in Figure 1, the CDWL was placed on the rooftop of the main building of Shandong Chambroad Co., Ltd. (Binzhou, China), which is in the center of a chemical industrial park. The building’s height is approximately 30 m.
The CDWL can work continuously in different weather conditions with an all-fiber structure and temperature control system. It is operated at an eye-safe wavelength of 1.5 μm. The pulse energy of the laser is 300 μJ. The repetition frequency of the CDWL is 10 kHz, corresponding to a theoretical detection range of 15 km [32]. However, the signal is influenced by weather conditions. Due to poor visibility during the experiment, the horizontal detection range was about 4.5 km in this work.
During the experiment, the scanning angle of azimuth ranged from 0° to 360°, where 0° corresponds to north and 90° corresponds to east. For the horizontal scanning mode, elevation angles were set between 0° and 4° and the step of the azimuth angle was 1°. The horizontal scanning mode was applied to capture point source pollution. For the vertical scanning mode, the elevation angle was set as 60°, and the step of azimuth angle was 5°. The vertical scanning mode was used to obtain profile results of the aerosols properties and wind field. The period of one scanning for horizontal scanning mode and vertical scanning mode were about 5 min and 40 s, respectively. The accuracy of radial speed was mainly determined by the carrier-to-noise ratio (CNR), which is the ratio of signal power to noise power. As raw data management, CNR criterion was set to −27 dB, with a radial speed accuracy of 0.2 m/s. In horizontal scanning mode, the magnitude of the RMS for 2-D wind speed and wind direction was less than 0.6 m/s and 11°, respectively [32]. In vertical scanning mode, the standard deviations of wind speed and direction were 0.84 m/s and 9.2°, respectively [34].

2.2. Surface National Monitoring Station

The data released by China’s air quality online monitoring and analysis platform (https://www.aqistudy.cn/, accessed on 23 April 2022), were applied to analyze the changing process and development trend of the time and space distribution of a dust storm. Air Quality Index (AQI), PM2.5, and PM10 data published hourly by national monitoring stations were used. AQI is a widely used index for public understanding and for evaluation of air pollution on human health indicators. PM2.5 and PM10 are defined as particulate matter with aerodynamic diameters below 2.5 µm and 10 µm, respectively.

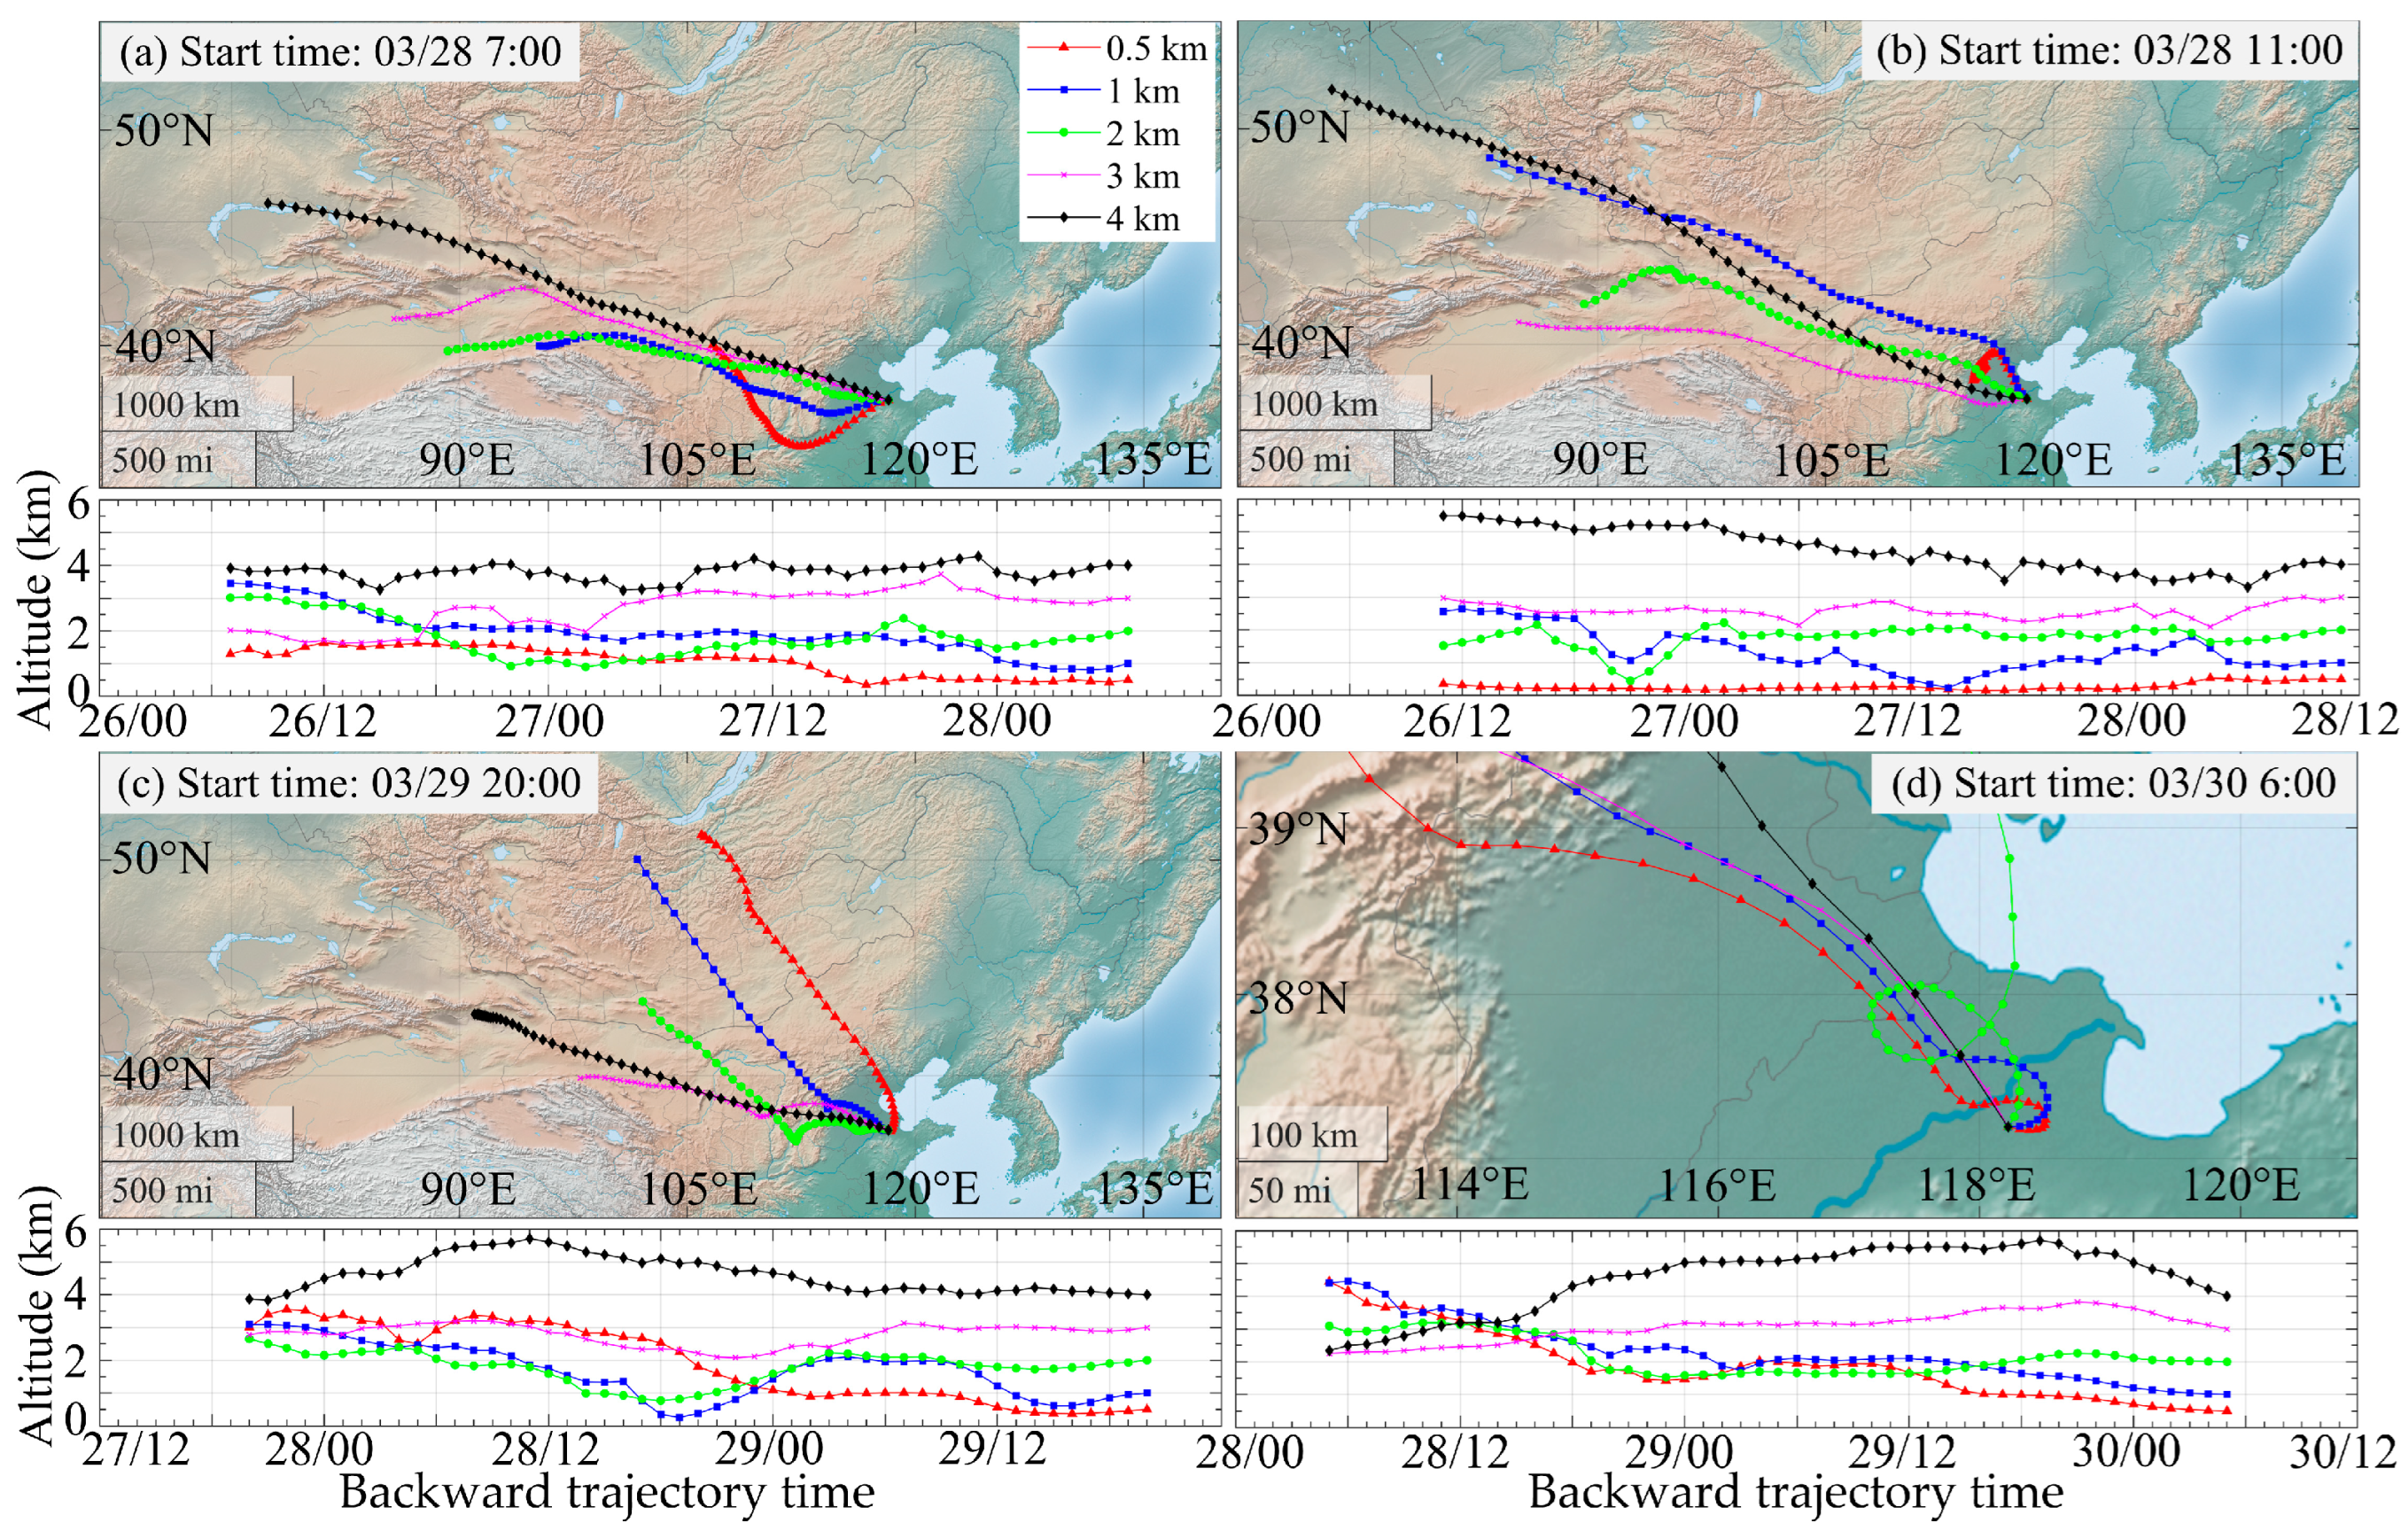
2.3. Backward Trajectory Analysis

The HYbrid Single-Particle Lagrangian Integrated Trajectory (HYSPLIT) was applied to identify aerosol sources and the transport path. HYSPLIT, developed by NOAA’s Air Resources Laboratory [46], is one of the most widely used models for atmospheric trajectory and dispersion calculations [45]. HYSPLIT was configured to perform back trajectory calculations at 0.5 km, 1 km, 2 km, 3 km, and 4 km above the lidar site for 48 h using the meteorological data of the Global Data Assimilation System (GDAS) at the spatial resolution of 0.25°.

3. Results

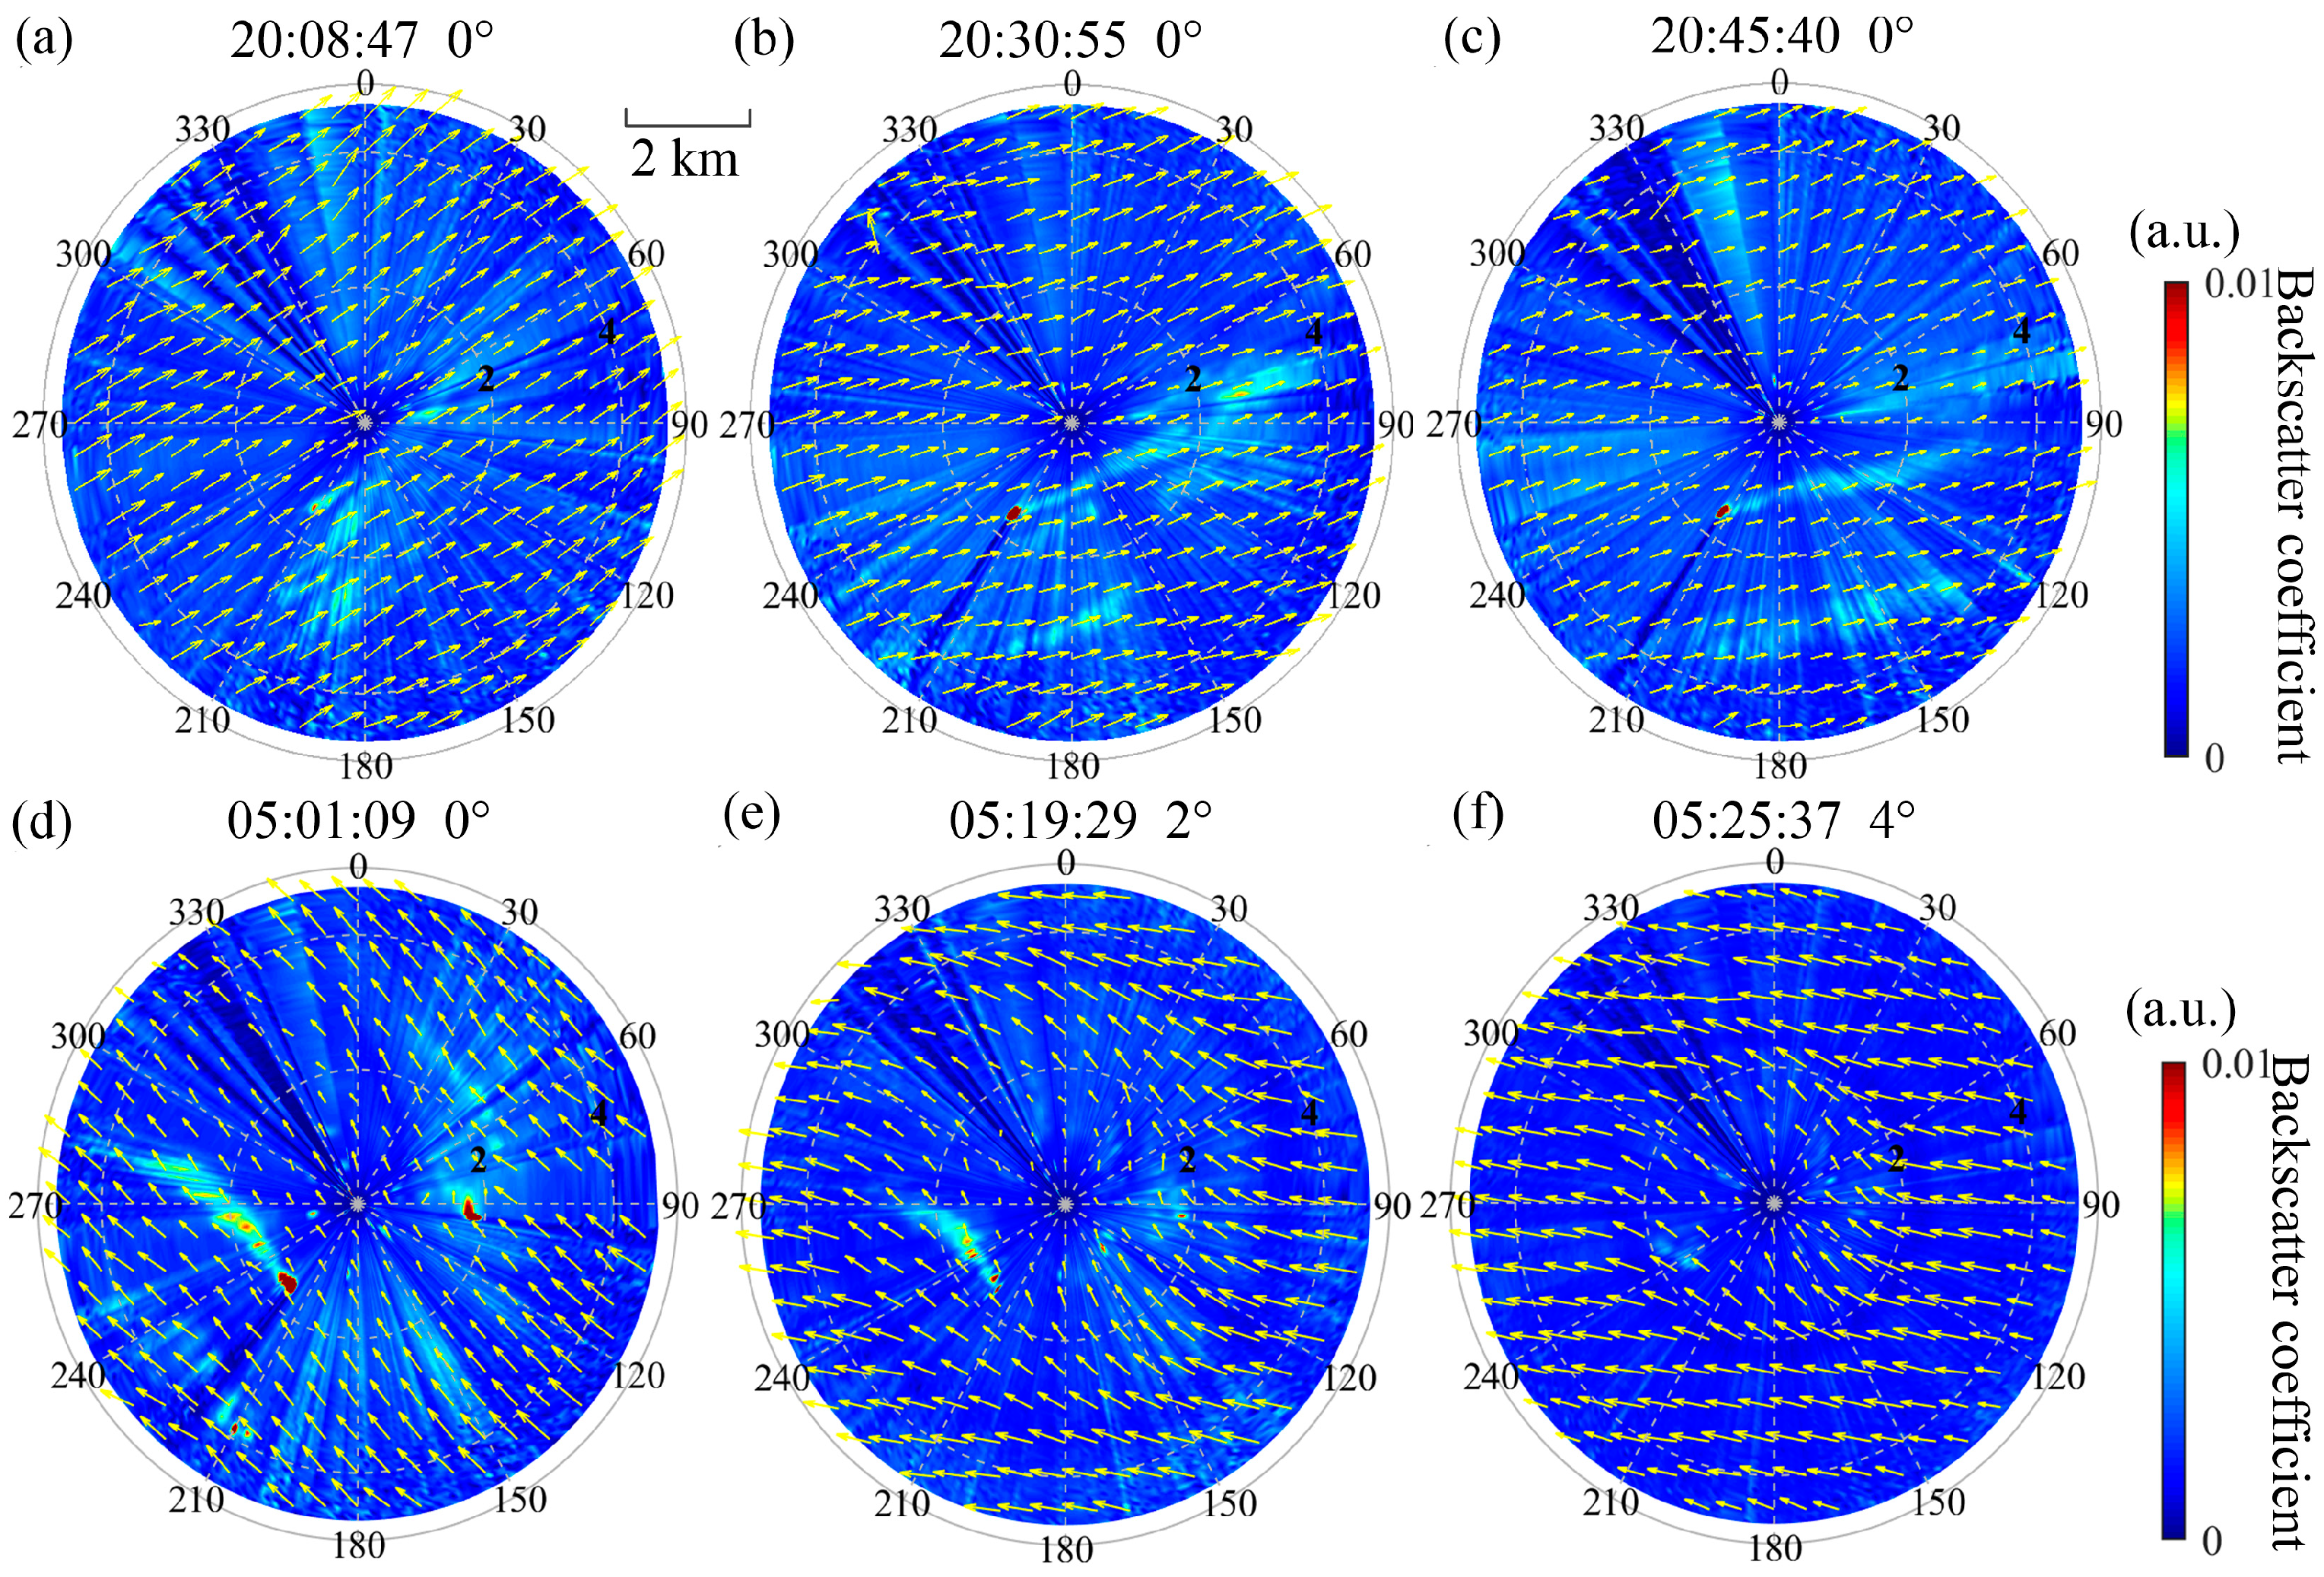
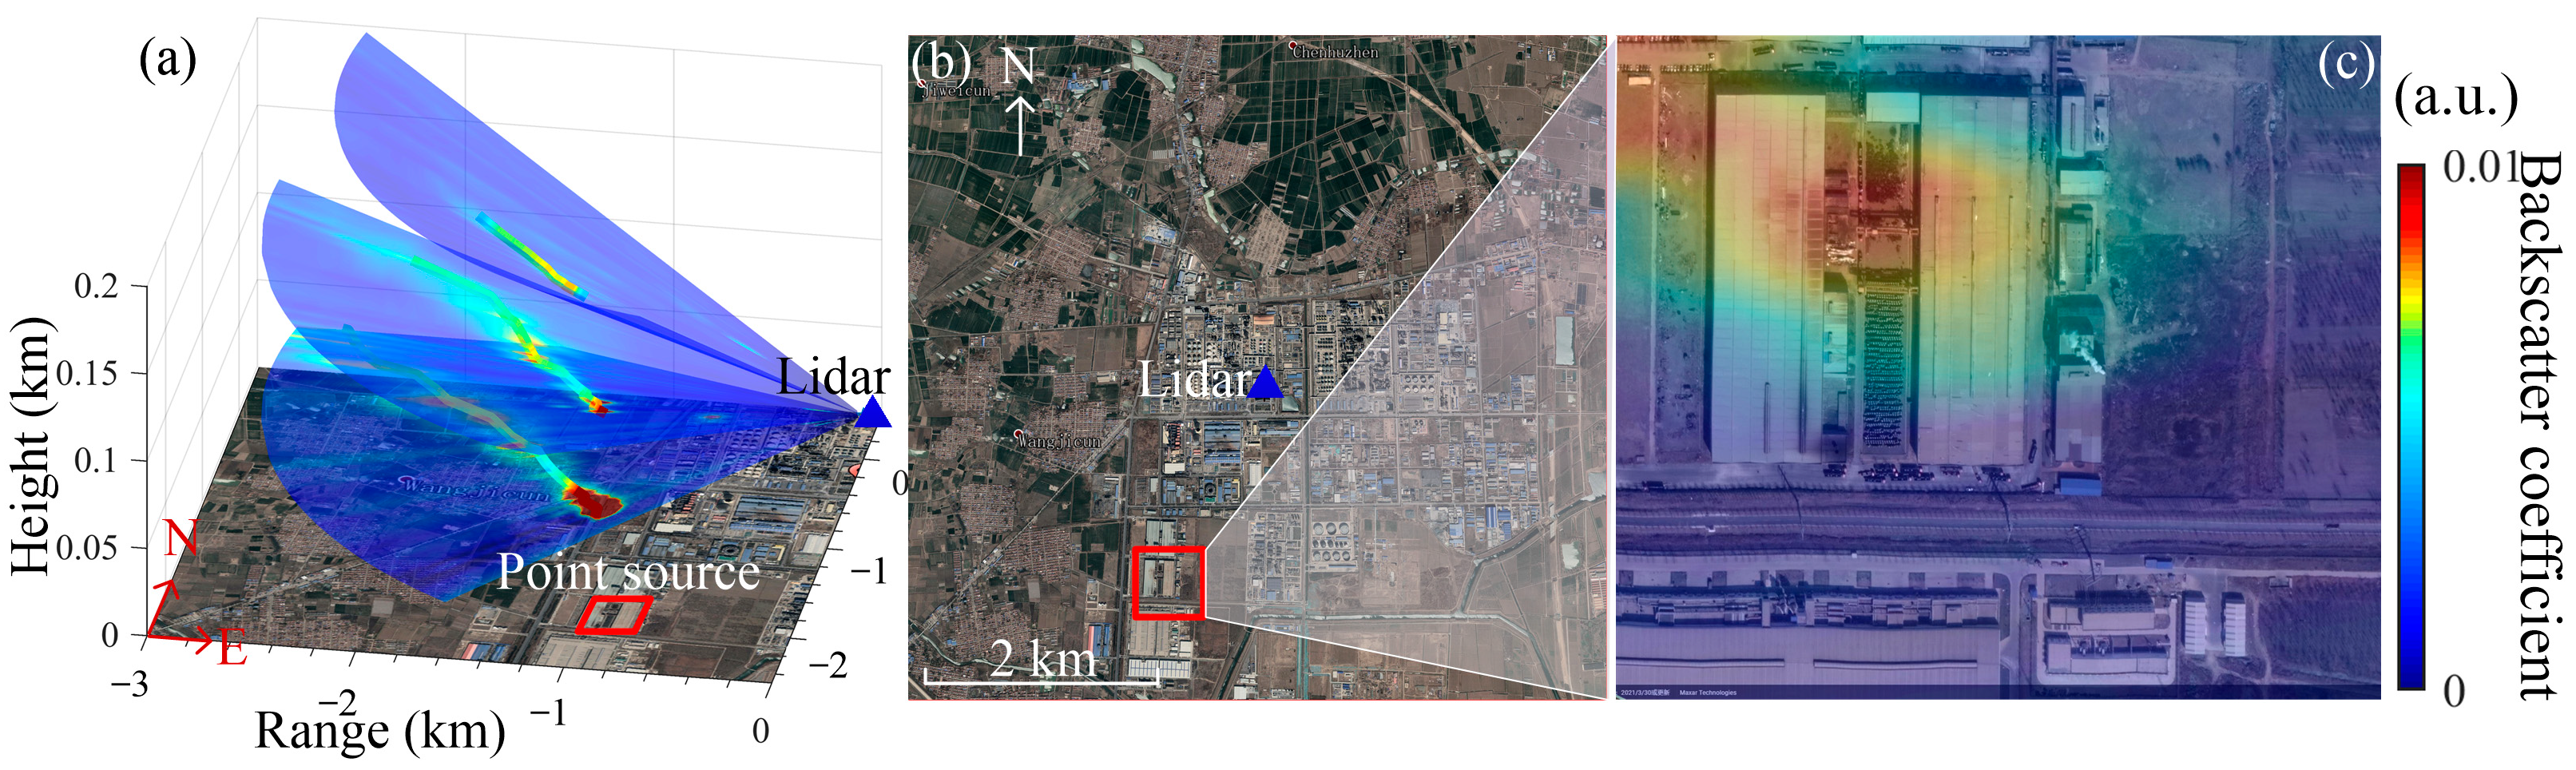
3.1. Local Point Source Pollution Tracking

Horizontal PPI scanning with low elevation was performed for tracking local point source pollution emission and to study its diffusion. Figure 2 shows the CDWL scanning results of the backscatter coefficient and the two-dimensional wind vector for 27 March 2021. The backscatter coefficient is calculated based on the echo signal intensity [37,38,39,40,41,42,43,44]. The 2D wind field is retrieved by a variation method [32] based on the radial speed detected by the CDWL.
Figure 2a–c show the scanning results of an emission episode with a fixed elevation of 0°. Pollution transmission belts were observed in backscatter coefficient maps. The background wind field was about 5 m/s to the southwest. The direction of the pollution transmission was consistent with the direction of the wind vector. Combining the horizontal wind field and backscatter coefficient, the point source pollution was inferred to be in the upstream of the smoke plume. The pollution was developing to the northeast, affecting the downstream area.
The development morphology of the pollution plume is closely related to the state of the atmosphere, with various types. Spatial slices of the plume structure can be obtained by PPI scanning with different elevation angles to obtain the spatial distribution of pollution. The results are shown in Figure 2d–f. The background wind field was southeasterly. When the elevation is 2° or 4°, the height of measuring point increases with the increasing radial distance. The horizontal wind field increases with the increasing height, as shown by the wind vector in Figure 2e,f. There was an obvious smoke plume structure caused by a point source pollution emission 1.8 km southwest of the lidar. The smoke plume diffused along the northwest direction with the horizontal wind field.
The source tracking results are shown in Figure 3. Trajectories of the smoke plume highlighted are shown in Figure 3a. The plume transports to a height of 130 m. It should be noted that the minimum detected height of plume is 30 m. With the 2-D horizontal wind field, the diffusion direction and speed of plume slices can be determined, which helps the locating of pollution source. This is especially important when there is a gap between ground and the lowest altitude level detected. Combined with the spatial structure of the smoke plume and wind field, the position of the pollution sourced is tracked to be in the red box in the map, as show in Figure 3b. After field investigation, there is a steelwork factory in the red box, which has air pollution emission, as show in Figure 3c.
The accuracy of source positioning depends on the density of effective spatial slices. When the background wind detected by CDWL is strong, the elevation angle of scanning slice can be set to downward (<0°) to capture the smoke plume, which originates in the ground and is mainly advected horizontally along the ground.

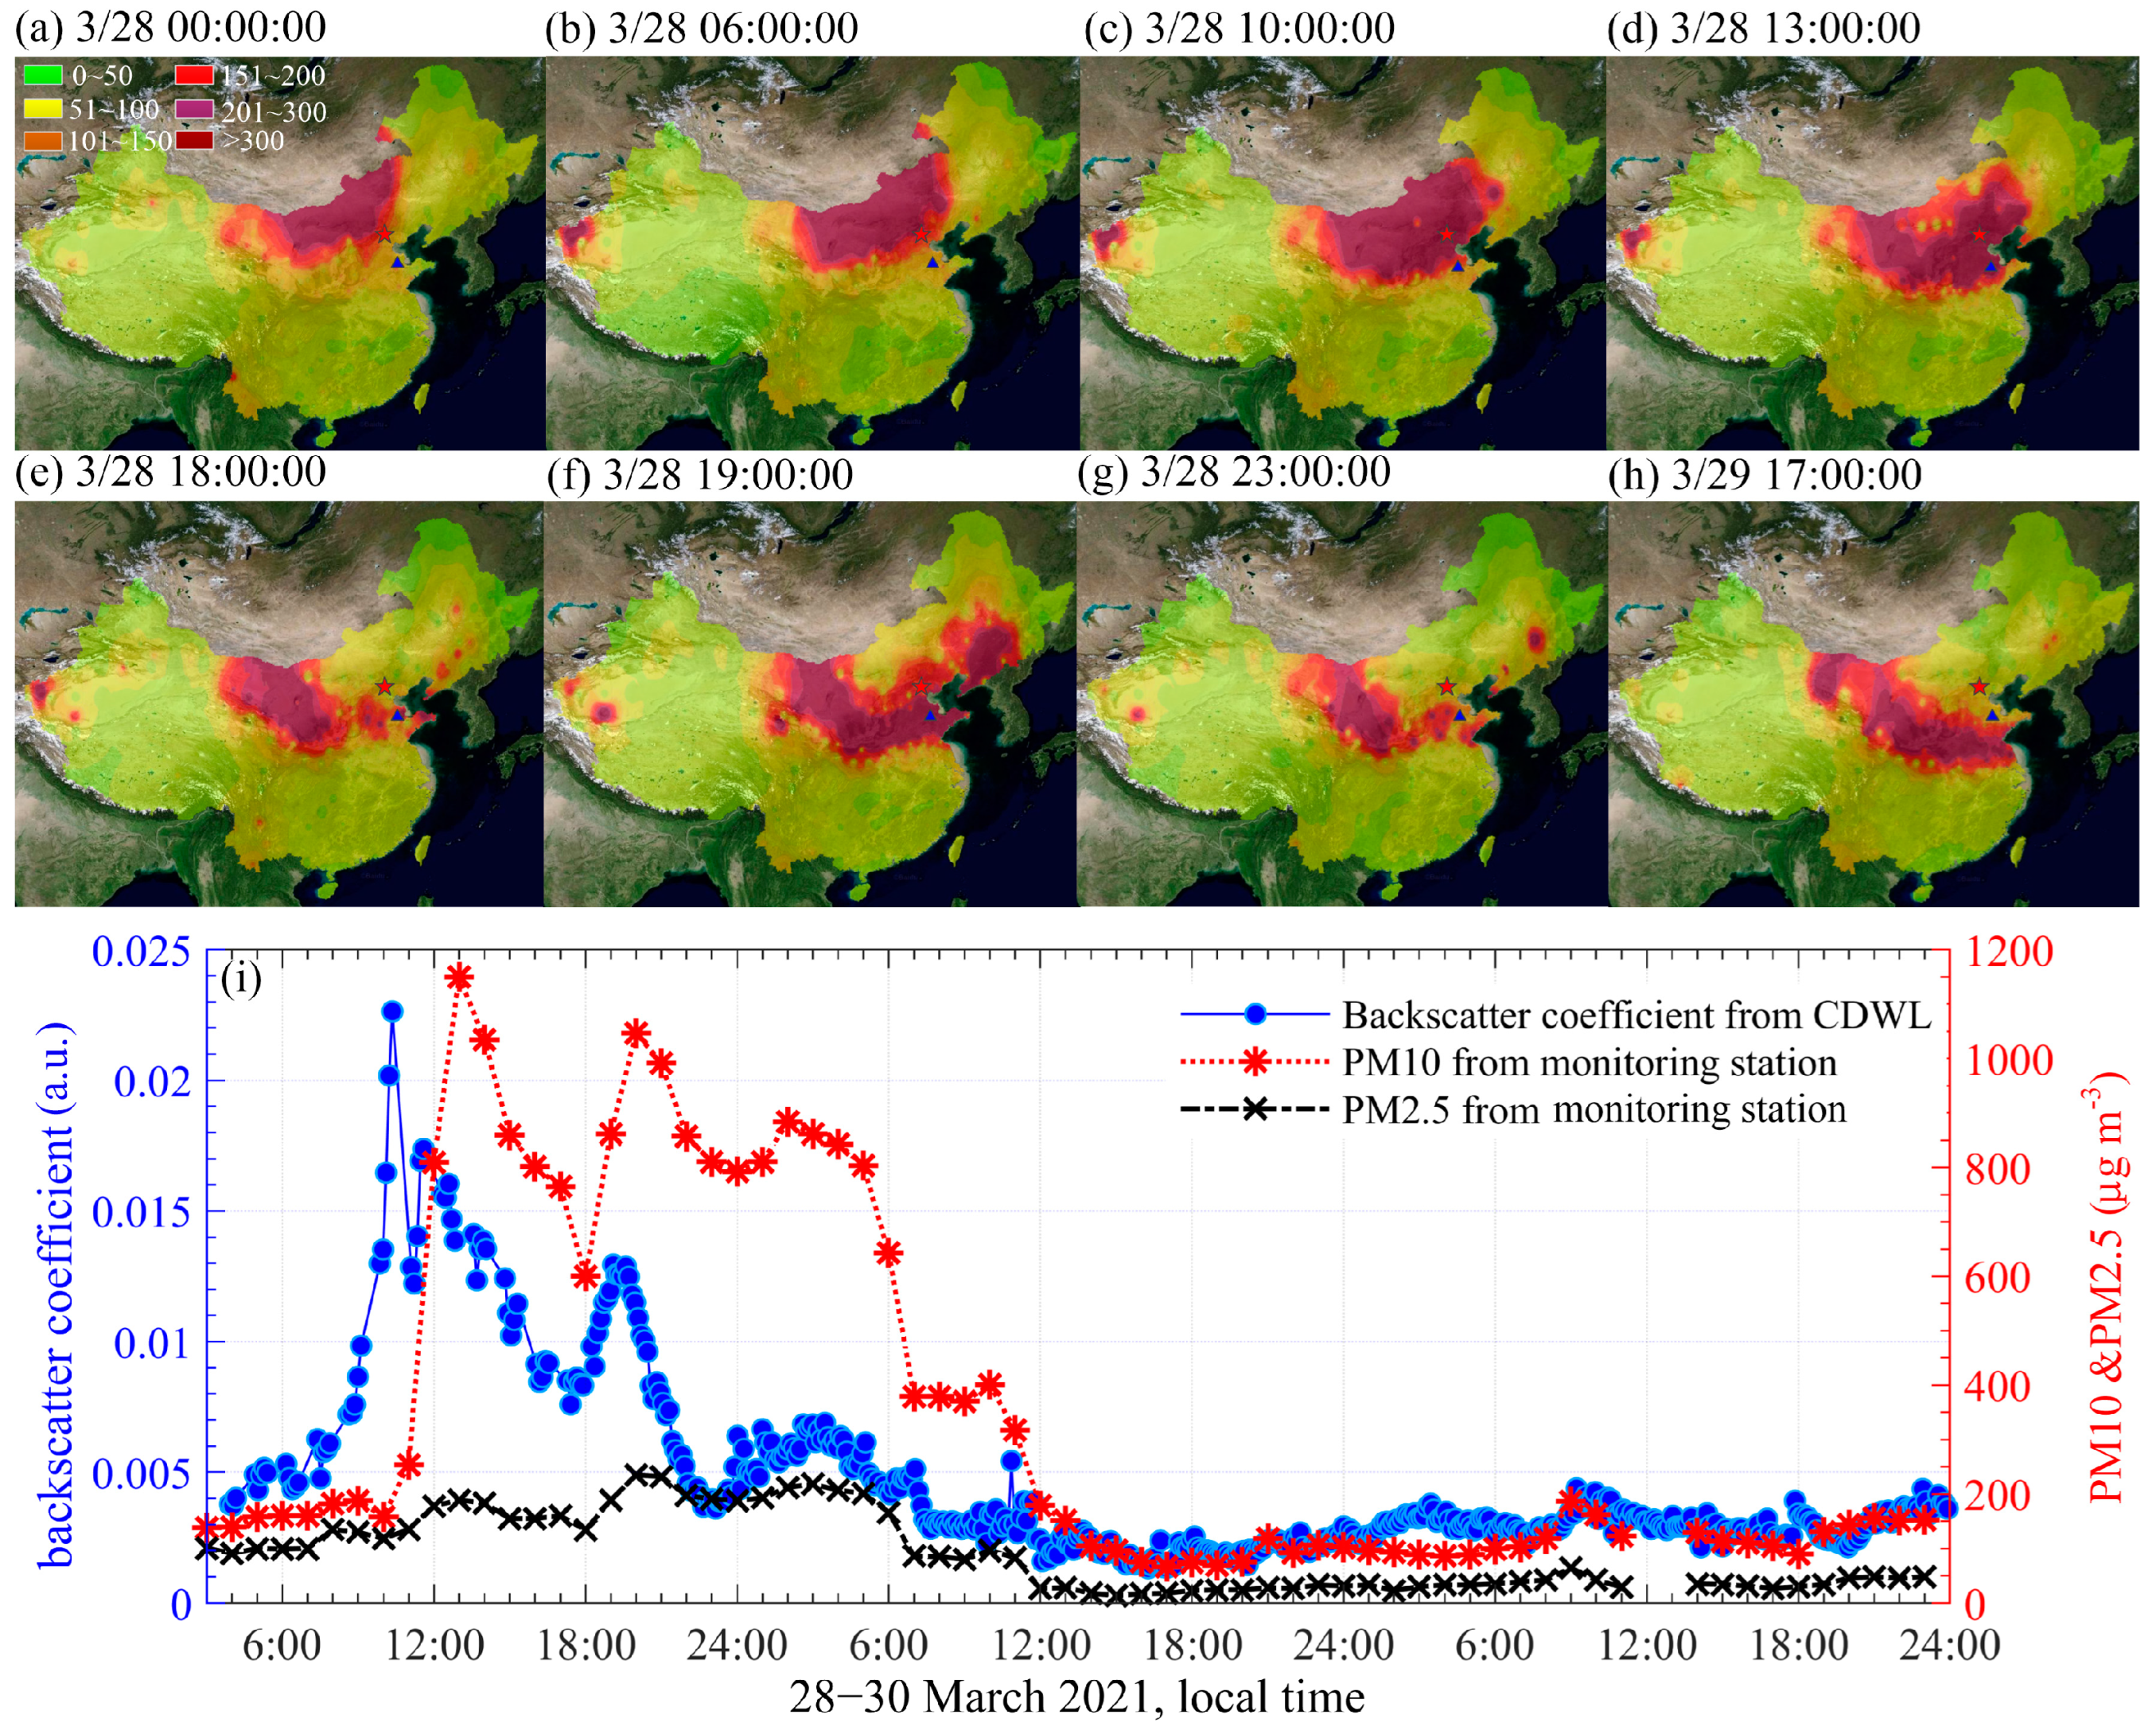
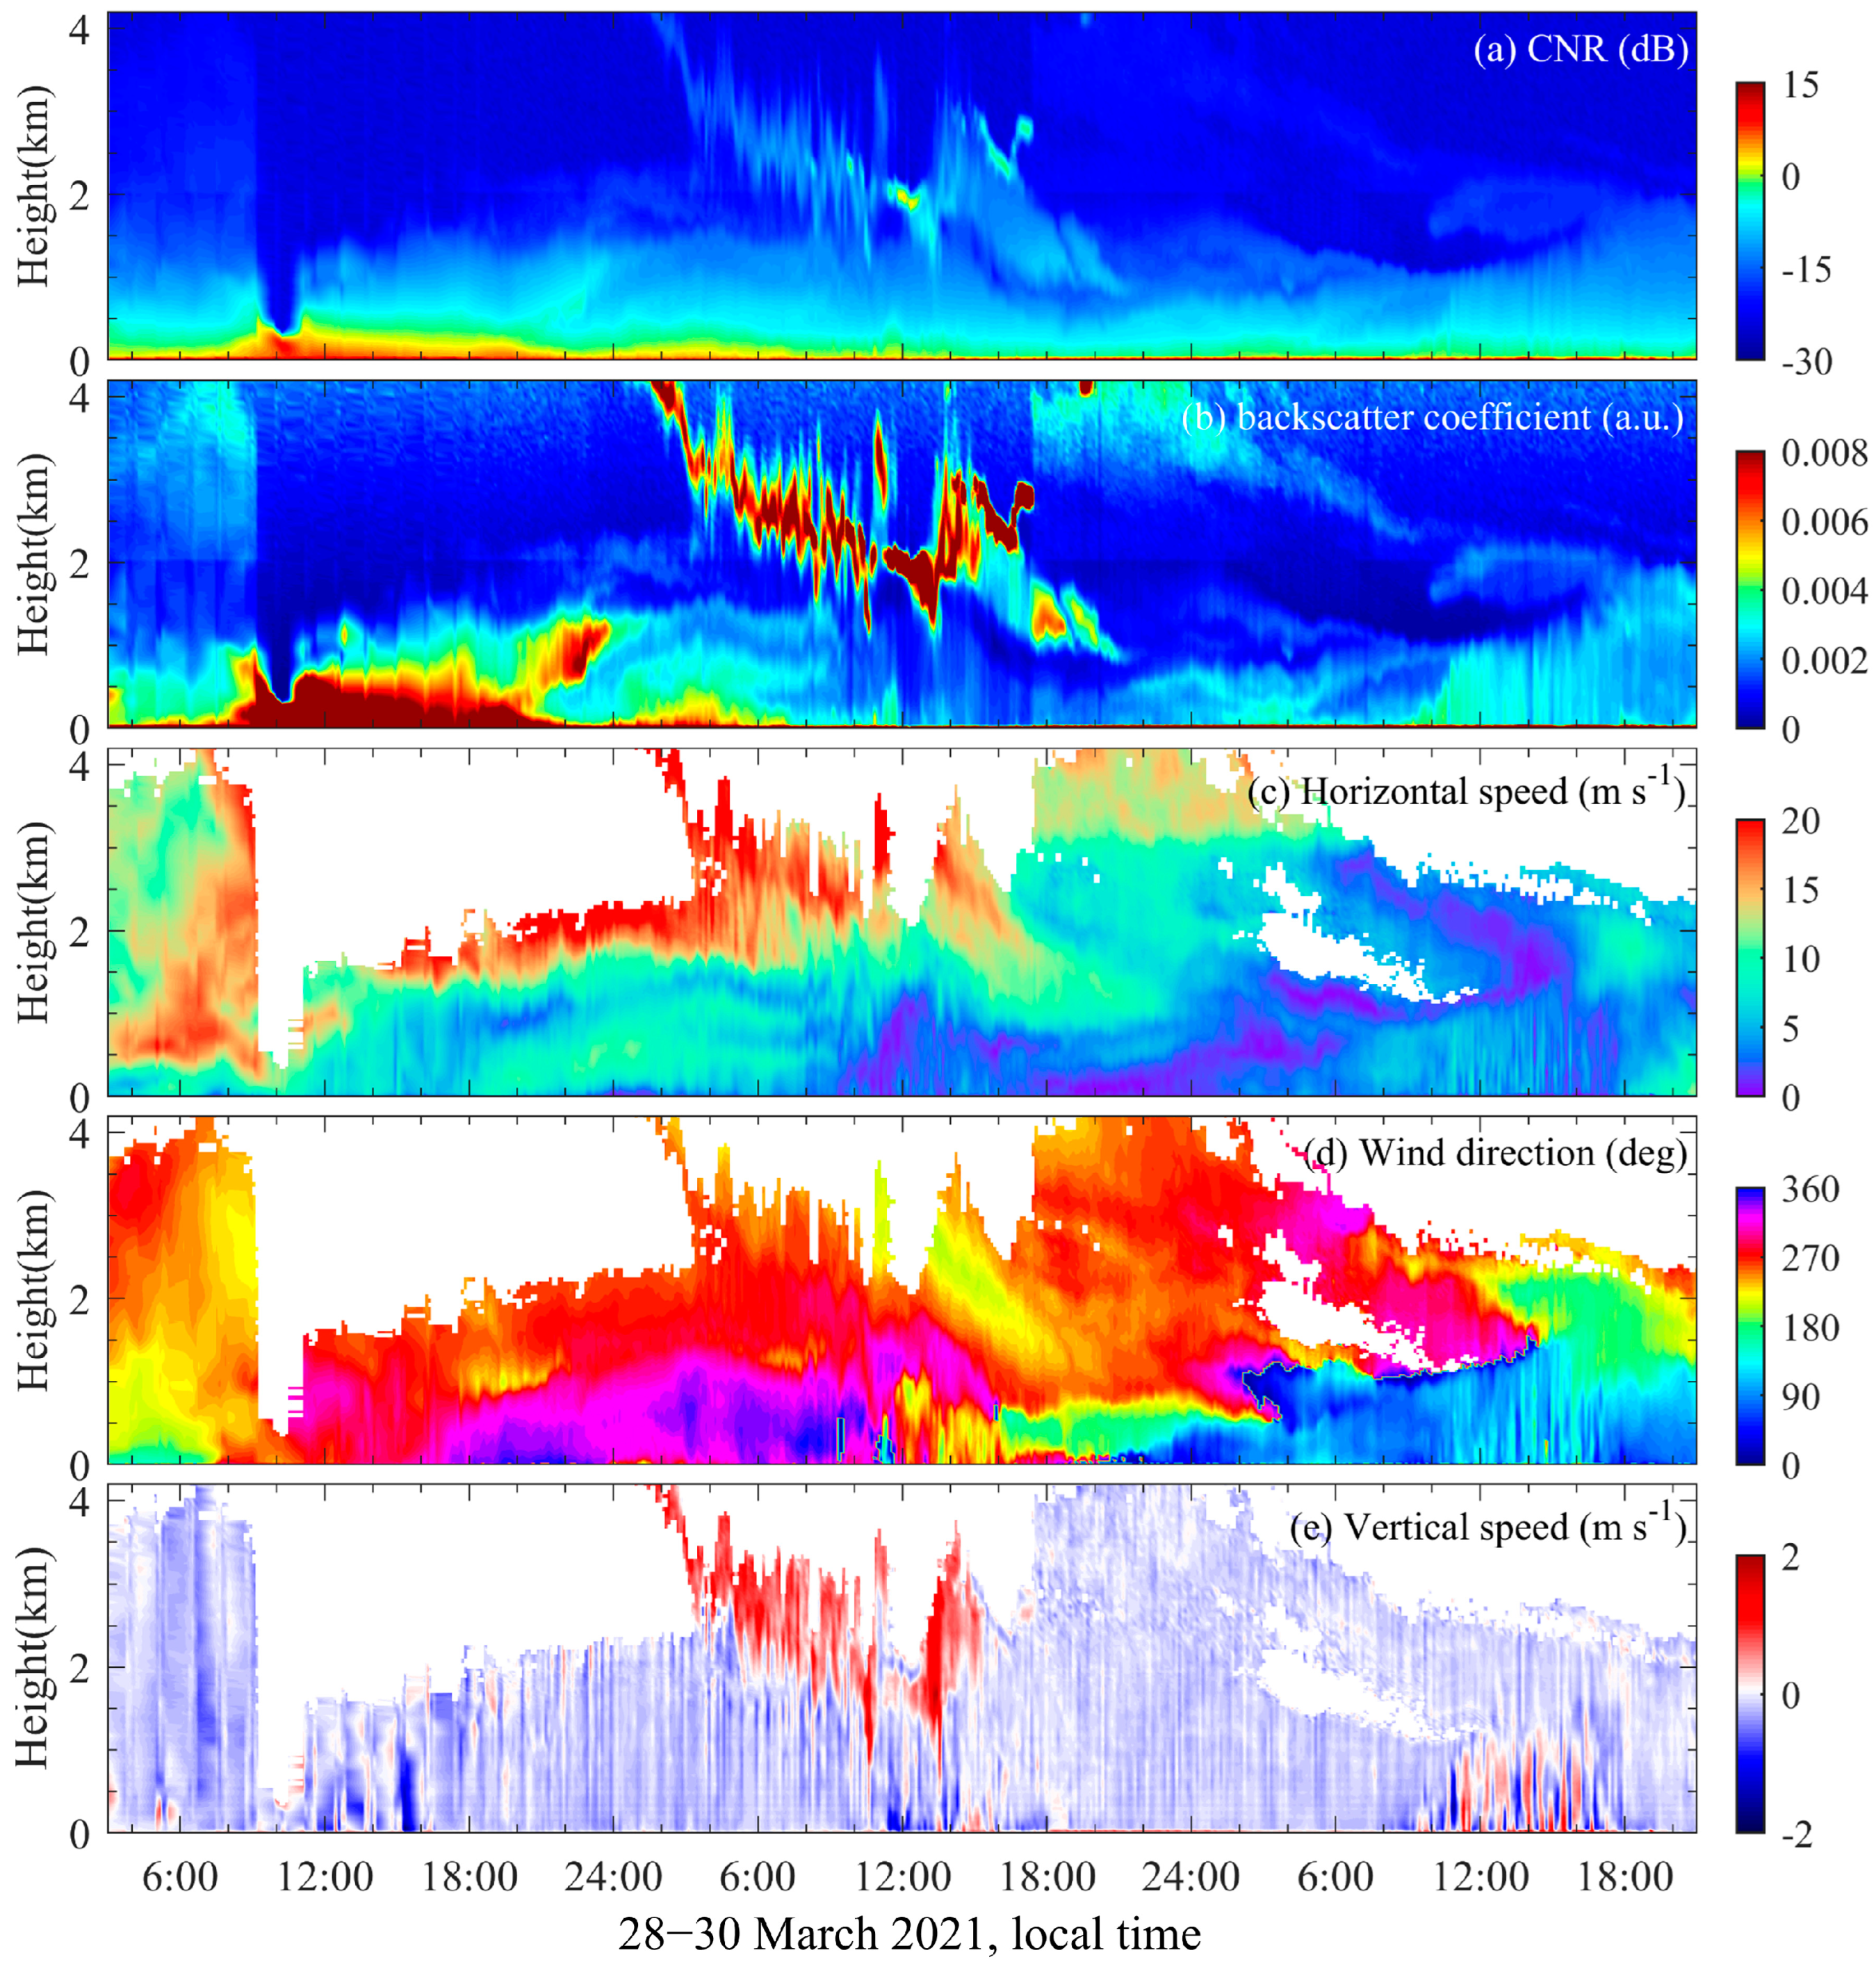
3.2. Transboundary Pollution Transport Detection

Due to the drought and rainless climatic conditions and soil desertization in Mongolia and northern China, northern China suffers dust storms frequently in the springtime (March to May) [47]. During the observation experiment, a dust storm event was detected. Figure 4a–h show AQI maps of the dust storm transmission process in surface. The backscattering coefficients of the CDWL, PM2.5, and PM10 data from the local national monitoring station are shown in Figure 4i. The dust storm has already appeared in Inner Mongolia, starting at 0:00 on 28 March 2021. The dust storm first spread to the southeast of China and then to the southwest. The dust storm arrived at experiment site at 10:00 on 28 March, as shown in Figure 4c, corresponding an obvious increase in the backscatter coefficient and PM10 level, as shown in Figure 4i. The maximum content of PM10 reached 1150 μg m−3 at 13:00 on 28 March.
The vertical scanning mode was applied to obtain the vertical profiles. Figure 5 shows the observation profile results of the dust storm episodes from 28 to 30 March 2021. Due to the influence of sand and dust, the surface echo signal was enhanced and then attenuated rapidly after the dust storm arrived at the lidar site. The corresponding CNR and backscatter coefficients were increased. The vertical profiles of the wind field are shown in Figure 5c–e. The detectable range of the lidar was as low as 500 m, due to excessive attenuation, from 9:00 to 11:00, 28 March. The dust storm continued into 21:00 on 28 March. The dust storm was accompanied with a background wind field of ≥10 m s−1. This strong northwest wind continued from 28 March. The fluctuation in the vertical velocity is shown in Figure 5e.
The chemical industrial park is located in a suburb; the nearest national monitoring site is in the south urban area tens of kilometers away from the CDWL. Thus, the PM10 of the monitoring station showed a delay compared with the backscatter coefficient of the CDWL. Another possible reason is that the CDWL’s first detectable range gate is 60 m above the surface, while the monitoring station detects dust settling on the surface.
The dust storm that arrived at 9:00, March 28, contained a high concentration of PM10 and larger particles. The backscattering coefficient reached the maximum value and the signal attenuation was the most serious with the lowest lidar detection range at this moment. As the subsequent dust storms gradually weakened and the concentration of dust particles and backscattering coefficient decreased, the corresponding lidar detection range increased, as shown in Figure 5. The duration of the relatively strong signal of the backscattering coefficients (>0.007 a.u.) by the CDWL lasted from 9:00 to 21:00 local time on March 28 (Figure 4i), corresponding to the thick serious polluted layer on the surface; The signal of the backscattering coefficients deviating from the average (>0.005 a.u.) continued into 7:00 on March 29 (Figure 4i), corresponding to a thinner polluted layer on the surface with a lower content of large particles, as shown in Figure 5b. PM10 subsiding to the surface lasted longer than the CDWL detected. Thus, the backscatter coefficient decreased faster than that of the PM10 from the monitoring station. On the whole, the influence of the dust storm on the surface observed by the CDWL is consistent with that of the monitoring station, which indicates the effectiveness and reliability of the CDWL.
The transport height of dust is related to particle size distribution and atmospheric state [48]. The small-particle-size dust is easily transported to a height of 4 km. Figure 6a shows the 48 h HYSPLIT backward trajectory results starting at 7:00 on 28 March. Air masses at 3 km and 4 km were transported from Mongolia in northwest, where the dust storm started. A polluted layer at 3–4 km was detected by the CDWL from 3:00 to 9:00, 28 March, as shown in Figure 5b. Small-particle-size dust travelling faster were the first to reach experiment site, forming this dust layer.
The serious polluted layer was concentrated at a height of 0–0.7 km, as shown in Figure 5b, during 9:00–21:00, 28 March. Figure 6b shows the 48 h HYSPLIT backward trajectory result started at 11:00 on 28 March. The trajectory result shows that most air masses are transported from dust storm region as shown in Figure 4b,c.
After the serious polluted layer left, there were still residual layers at an altitude of 3–4 km from 17:00 on 29 March to 12:00 on 30 March, as shown in Figure 5b. Figure 6c shows the 48 h HYSPLIT backward trajectory result starting at 20:00 on 29 March. The air mass at altitudes of 3 km and 4 km were transported from the western region. During this period, the upper wind field was westerly, as shown in Figure 5d. Westerly wind brought dusts from the storm region, as shown in Figure 4g,h. The upper polluted layer suddenly disappeared at 9:00 on 28 March and appeared again at 17: 00 on 29 March. Because the signal of the upper polluted layer was blocked by the lower serious polluted layer and clouds successively during this period, it can be inferred that the polluted layer at 3–4 km lasted for a long time.
Figure 6d shows the 48 h HYSPLIT backward trajectory result starting at 6:00 on 30 March. These clean air masses detected at the experimental site could be brought from the aerosol influenced by sea breeze circulation, as air masses below 2 km were transported from the east and northeast near coast. Air masses of the polluted top layer were mainly transported from the northwest. It can be inferred that this polluted layer was caused by light dust left by the sandstorm, for dust particles that are injected higher into the atmosphere generally have higher potential for longer atmospheric suspension time [49]. There was a hole layer at a height of about 2 km, from 3:00 to 10:00, 30 March. There was a dust-polluted layer above this layer, with a western wind and aerosol layer below the northeast wind, while spotless aerosols existed in this hole layer.
At noon of 30 March, with the rising temperature, the fluctuation in the vertical velocity was strengthened and the turbulence was fully developed, as shown in Figure 5e. The height of the mixed boundary layer increased with the air convection motion. Eventually, the mixed boundary layer interacted with the top polluted layer.

4. Conclusions

The CDWL was developed for air pollution detection, with multiple retrieved parameters. By PPI scanning with low elevation, the trajectory of the smoke plume was depicted well by the backscatter coefficient. The CDWL is helpful for the tracking of point source pollution and the prediction of its diffusion, combined with horizontal wind vectors. Thus, it can be used for the accurate monitoring of local pollution for environmental protection bureaus, and it also provides effective data support for the development of smoke plume models. By vertical scanning, the transboundary dust pollution structure was captured, which developed from Inner Mongolia and was transported to the south. The surface data of the CDWL were consistent with those of national monitoring stations. The serious polluted layer at a height of 0–0.7 km and the top polluted layer at a height of 3–4 km were detected, and the corresponding sources of pollution were verified by the HYSPLIT model. The small-particle-size dust injected into the height of 3–4 km has the characteristics of fast transmission and long duration, with the potential of long-distance transmission. With the wind profiles, the source and diffusion direction of such transboundary pollution can be inferred. Both local point source pollution and transboundary pollution are important parts of air pollution. CDWL can perform these two scanning modes alternately to monitor both types of pollution in real-time, which has the potential to distinguish local pollution from transboundary pollution.
In conclusion, the CDWL, with high temporal-spatial aerosol backscatter coefficients and wind field, was proven to be a good instrument for air pollution detection, which can improve the pollution tracking results in local regions compared to other instruments such as satellites or ground-based measurements. Our findings provide convinced evidence that the sources, paths, and heights of both local and transboundary air pollution can be effectively identified by a solo CDWL system due to its function of real-time synchronous 3-D detection of air pollution and wind. The application of such an integrated lidar in this research contributes to our understanding of aerosol–urban boundary layer interactions, improving air quality forecasts. The current system has difficulty distinguishing the detailed pollutant composition. In future work, we plan to integrate polarization detection into the lidar system for classification of pollutants.

Author Contributions

Conceptualization, H.X.; methodology, J.Y.; software, L.S.; formal analysis, H.X., J.Y. and Y.W.; investigation, J.Y.; resources, J.Y.; data curation, J.Y.; writing—original draft preparation, J.Y.; writing—review and editing, Y.W., Z.S., L.S., D.T., J.D., Z.Z., S.Y. and Y.Y.; visualization, J.Y.; supervision, H.X. All authors have read and agreed to the published version of the manuscript.

Funding

This work was funded by Nanjing Taixin Co., Ltd. (91320191MA26A48Q5X).

Data Availability Statement

The CDWL data presented in this paper and more pollution episodes can be obtained from the authors upon reasonable request. Air quality datasets used in this study are available from the URL of https://www.aqistudy.cn/ (accessed on 23 April 2022).

Acknowledgments

We would like to thank China’s air quality online monitoring and analysis platform for providing hourly air quality datasets.

Conflicts of Interest

The authors declare no conflict of interest.

References

  1. Hien, T.T.; Chi, N.D.T.; Nguyen, N.T.; Vinh, L.X.; Takenaka, N.; Huy, D.H. Current Status of Fine Particulate Matter (PM2.5) in Vietnam’s Most Populous City, Ho Chi Minh City. Aerosol Air Qual. Res. 2019, 19, 2239–2251. [Google Scholar] [CrossRef]
  2. Jin, Y.; Andersson, H.; Zhang, S. Air Pollution Control Policies in China: A Retrospective and Prospects. Int. J. Environ. Res. Public Health 2016, 13, 1219. [Google Scholar] [CrossRef]
  3. Zhang, Q.; Geng, G.; Wang, S.; Richter, A.; He, K. Satellite remote sensing of changes in NO x emissions over China during 1996–2010. Chin. Sci. Bull. 2012, 57, 2857–2864. [Google Scholar] [CrossRef]
  4. Wang, J.; Xu, X.; Spurr, R.; Wang, Y.; Drury, E. Improved algorithm for MODIS satellite retrievals of aerosol optical thickness over land in dusty atmosphere: Implications for air quality monitoring in China. Remote Sens. Environ. 2010, 114, 2575–2583. [Google Scholar] [CrossRef]
  5. Liu, X.-H.; Zhang, Y.; Cheng, S.-H.; Xing, J.; Zhang, Q.; Streets, D.G.; Jang, C.; Wang, W.-X.; Hao, J.-M. Understanding of regional air pollution over China using CMAQ, part I performance evaluation and seasonal variation. Atmos. Environ. 2010, 44, 2415–2426. [Google Scholar] [CrossRef]
  6. Lei, Y.; Zhang, Q.; He, K.B.; Streets, D.G. Primary anthropogenic aerosol emission trends for China, 1990–2005. Atmos. Chem. Phys. 2011, 11, 931–954. [Google Scholar] [CrossRef]
  7. Rohde, R.A.; Muller, R.A. Air Pollution in China: Mapping of Concentrations and Sources. PLoS ONE 2015, 10, e0135749. [Google Scholar] [CrossRef]
  8. Xu, L.; Batterman, S.; Chen, F.; Li, J.; Zhong, X.; Feng, Y.; Rao, Q.; Chen, F. Spatiotemporal characteristics of PM2.5 and PM10 at urban and corresponding background sites in 23 cities in China. Sci. Total Environ. 2017, 599–600, 2074–2084. [Google Scholar] [CrossRef]
  9. Verma, S.; Bhanja, S.N.; Pani, S.K.; Misra, A. Aerosol optical and physical properties during winter monsoon pollution transport in an urban environment. Environ. Sci. Pollut. Res. 2014, 21, 4977–4994. [Google Scholar] [CrossRef]
  10. Moorthy, K.K.; Saha, A.; Prasad, B.S.N.; Niranjan, K.; Jhurry, D.; Pillai, P.S. Aerosol optical depths over peninsular India and adjoining oceans during the INDOEX campaigns: Spatial, temporal, and spectral characteristics. J. Geophys. Res. 2001, 106, 28539–28554. [Google Scholar] [CrossRef]
  11. Babu, S.S.; Gogoi, M.M.; Kumar, V.H.A.; Nair, V.S.; Moorthy, K.K. Radiative properties of Bay of Bengal aerosols: Spatial distinctiveness and source impacts. J. Geophys. Res. 2012, 117, D06213. [Google Scholar] [CrossRef]
  12. Pilinis, C.; Pandis, S.N.; Seinfeld, J.H. Sensitivity of direct climate forcing by atmospheric aerosols to aerosol size and composition. J. Geophys. Res. 1995, 100, 18739–18754. [Google Scholar] [CrossRef]
  13. Kedia, S.; Ramachandran, S.; Kumar, A.; Sarin, M.M. Spatiotemporal gradients in aerosol radiative forcing and heating rate over Bay of Bengal and Arabian Sea derived on the basis of optical, physical, and chemical properties. J. Geophys. Res. 2010, 115, D07205. [Google Scholar] [CrossRef]
  14. Ramachandran, S.; Jayaraman, A. Premonsoon aerosol mass loadings and size distributions over the Arabian Sea and the tropical Indian Ocean. J. Geophys. Res. 2002, 107, 1–21. [Google Scholar] [CrossRef]
  15. Vivone, G.; D’Amico, G.; Summa, D.; Lolli, S.; Amodeo, A.; Bortoli, D.; Pappalardo, G. Atmospheric boundary layer height estimation from aerosol lidar: A new approach based on morphological image processing techniques. Atmos. Chem. Phys. 2021, 21, 4249–4265. [Google Scholar] [CrossRef]
  16. Xie, C.; Zhao, M.; Wang, B.; Zhong, Z.; Wang, L.; Liu, D.; Wang, Y. Study of the scanning lidar on the atmospheric detection. J. Quant. Spectrosc. Radiat. Transf. 2015, 150, 114–120. [Google Scholar] [CrossRef]
  17. Mei, L.; Guan, P.; Yang, Y.; Kong, Z. Atmospheric extinction coefficient retrieval and validation for the single-band Mie-scattering Scheimpflug lidar technique. Opt. Express 2017, 25, A628–A638. [Google Scholar] [CrossRef]
  18. Kong, Z.; Liu, Z.; Zhang, L.; Guan, P.; Li, L.; Mei, L. Atmospheric Pollution Monitoring in Urban Area by Employing a 450-nm Lidar System. Sensors 2018, 18, 1880. [Google Scholar] [CrossRef]
  19. Zhao, H.; Che, H.; Wang, Y.; Dong, Y.; Ma, Y.; Li, X.; Hong, Y.; Yang, H.; Liu, Y.; Wang, Y.; et al. Aerosol Vertical Distribution and Typical Air Pollution Episodes over Northeastern China during 2016 Analyzed by Ground-based Lidar. Aerosol Air Qual. Res. 2018, 18, 918–937. [Google Scholar] [CrossRef]
  20. Lisetskii, F.; Borovlev, A. Monitoring of Emission of Particulate Matter and Air Pollution using Lidar in Belgorod, Russia. Aerosol Air Qual. Res. 2019, 19, 504–515. [Google Scholar] [CrossRef]
  21. Yang, Y.; Fan, S.; Wang, L.; Gao, Z.; Zhang, Y.; Zou, H.; Miao, S.; Li, Y.; Huang, M.; Yim, S.H.L.; et al. Diurnal Evolution of the Wintertime Boundary Layer in Urban Beijing, China: Insights from Doppler Lidar and a 325-m Meteorological Tower. Remote Sens. 2020, 12, 3935. [Google Scholar] [CrossRef]
  22. Yang, Y.; Yim, S.H.L.; Haywood, J.; Osborne, M.; Chan, J.C.S.; Zeng, Z.; Cheng, J.C.H. Characteristics of Heavy Particulate Matter Pollution Events Over Hong Kong and Their Relationships with Vertical Wind Profiles Using High-Time-Resolution Doppler Lidar Measurements. J. Geophys. Res.-Atmos. 2019, 124, 9609–9623. [Google Scholar] [CrossRef]
  23. Wang, L.; Yuan, J.; Xia, H.; Zhao, L.; Wu, Y. Marine Mixed Layer Height Detection Using Ship-Borne Coherent Doppler Wind Lidar Based on Constant Turbulence Threshold. Remote Sens. 2022, 14, 745. [Google Scholar] [CrossRef]
  24. Zhang, Y.; Wu, Y.; Xia, H. Spatial resolution enhancement of coherent Doppler wind lidar using differential correlation pair technique. Opt. Lett 2021, 46, 5550–5553. [Google Scholar] [CrossRef]
  25. Wang, L.; Qiang, W.; Xia, H.; Wei, T.; Yuan, J.; Jiang, P. Robust Solution for Boundary Layer Height Detections with Coherent Doppler Wind Lidar. Adv. Atmos. Sci. 2021, 38, 1920–1928. [Google Scholar] [CrossRef]
  26. Jia, M.; Yuan, J.; Wang, C.; Xia, H.; Wu, Y.; Zhao, L.; Wei, T.; Wu, J.; Wang, L.; Gu, S.Y.; et al. Long-lived high-frequency gravity waves in the atmospheric boundary layer: Observations and simulations. Atmos. Chem. Phys. 2019, 19, 15431–15446. [Google Scholar] [CrossRef]
  27. Yuan, J.; Xia, H.; Wei, T.; Wang, L.; Yue, B.; Wu, Y. Identifying cloud, precipitation, windshear, and turbulence by deep analysis of the power spectrum of coherent Doppler wind lidar. Opt. Express 2020, 28, 37406–37418. [Google Scholar] [CrossRef]
  28. Smalikho, I.N.; Banakh, V.A. Measurements of wind turbulence parameters by a conically scanning coherent Doppler lidar in the atmospheric boundary layer. Atmos. Meas. Tech. 2017, 10, 4191–4208. [Google Scholar] [CrossRef]
  29. Banakh, V.; Smalikho, I. Lidar Studies of Wind Turbulence in the Stable Atmospheric Boundary Layer. Remote Sens. 2018, 10, 1219. [Google Scholar] [CrossRef]
  30. Banakh, V.A.; Smalikho, I.N.; Falits, A.V.; Sherstobitov, A.M. Estimating the Parameters of Wind Turbulence from Spectra of Radial Velocity Measured by a Pulsed Doppler Lidar. Remote Sens. 2021, 13, 2071. [Google Scholar] [CrossRef]
  31. Liu, Z.; Barlow, J.F.; Chan, P.-W.; Fung, J.C.H.; Li, Y.; Ren, C.; Mak, H.W.L.; Ng, E. A Review of Progress and Applications of Pulsed Doppler Wind LiDARs. Remote Sens. 2019, 11, 2522. [Google Scholar] [CrossRef]
  32. Yuan, J.; Su, L.; Xia, H.; Li, Y.; Zhang, M.; Zhen, G.; Li, J. Microburst, Windshear, Gust Front, and Vortex Detection in Mega Airport Using a Single Coherent Doppler Wind Lidar. Remote Sens. 2022, 14, 1626. [Google Scholar] [CrossRef]
  33. Wei, T.; Xia, H.; Yue, B.; Wu, Y.; Liu, Q. Remote sensing of raindrop size distribution using the coherent Doppler lidar. Opt. Express 2021, 29, 17246–17257. [Google Scholar] [CrossRef] [PubMed]
  34. Wei, T.; Xia, H.; Hu, J.; Wang, C.; Shangguan, M.; Wang, L.; Jia, M.; Dou, X. Simultaneous wind and rainfall detection by power spectrum analysis using a VAD scanning coherent Doppler lidar. Opt. Express 2019, 27, 31235–31245. [Google Scholar] [CrossRef]
  35. Yuan, J.; Wu, K.; Wei, T.; Wang, L.; Shu, Z.; Yang, Y.; Xia, H. Cloud Seeding Evidenced by Coherent Doppler Wind Lidar. Remote Sens. 2021, 13, 3815. [Google Scholar] [CrossRef]
  36. Wei, T.; Xia, H.; Wu, K.; Yang, Y.; Liu, Q.; Ding, W. Dark/bright band of a melting layer detected by coherent Doppler lidar and micro rain radar. Opt. Express 2022, 30, 3654. [Google Scholar] [CrossRef]
  37. Menzies, R.T.; Tratt, D.M. Airborne CO 2 coherent lidar for measurements of atmospheric aerosol and cloud backscatter. Appl. Optics. 1994, 33, 5698–5711. [Google Scholar] [CrossRef]
  38. Chouza, F.; Reitebuch, O.; Groß, S.; Rahm, S.; Freudenthaler, V.; Toledano, C.; Weinzierl, B. Retrieval of aerosol backscatter and extinction from airborne coherent Doppler wind lidar measurements. Atmos. Meas. Tech. 2015, 8, 2909–2926. [Google Scholar] [CrossRef]
  39. Dai, G.; Wang, X.; Sun, K.; Wu, S.; Song, X.; Li, R.; Yin, J.; Wang, X. Calibration and retrieval of aerosol optical properties measured with Coherent Doppler Lidar. J. Atmos. Ocean. Tech. 2021, 38, 1035–1045. [Google Scholar] [CrossRef]
  40. Weickmann, A.M.; Senff, C.J.; Tucker, S.C.; Brewer, W.A.; Banta, R.M.; Sandberg, S.P.; Law, D.C.; Hardesty, R.M. Doppler Lidar Estimation of Mixing Height Using Turbulence, Shear, and Aerosol Profiles. J. Atmos. Ocean. Tech. 2009, 26, 673–688. [Google Scholar] [CrossRef]
  41. Abdelazim, S.; Santoro, D.; Arend, M.F.; Moshary, F.; Ahmed, S. Development and Operational Analysis of an All-Fiber Coherent Doppler Lidar System for Wind Sensing and Aerosol Profiling. IEEE Trans. Geosci. Remote Sensing 2015, 53, 6495–6506. [Google Scholar] [CrossRef]
  42. Huang, T.; Yang, Y.; O’Connor, E.J.; Lolli, S.; Haywood, J.; Osborne, M.; Cheng, J.C.; Guo, J.; Yim, S.H. Influence of a weak typhoon on the vertical distribution of air pollution in Hong Kong: A perspective from a Doppler LiDAR network. Environ. Pollut. 2021, 276, 116534. [Google Scholar] [CrossRef] [PubMed]
  43. Singh, U.N.; Mayor, S.D.; Dérian, P.; Mauzey, C.F.; Spuler, S.M.; Ponsardin, P.; Pruitt, J.; Ramsey, D.; Higdon, N.S. Comparison of aerosol backscatter and wind field estimates from the REAL and the SAMPLE. In Proceedings of the Lidar Remote Sensing for Environmental Monitoring XV, New Delhi, India, 4–7 April 2016. [Google Scholar]
  44. Yim, S.H.L. Development of a 3D Real-Time Atmospheric Monitoring System (3DREAMS) Using Doppler LiDARs and Applications for Long-Term Analysis and Hot-and-Polluted Episodes. Remote Sens. 2020, 12, 1036. [Google Scholar] [CrossRef]
  45. Huang, T.; Li, Y.; Cheng, J.C.H.; Haywood, J.; Hon, K.K.; Lam, D.H.Y.; Lee, O.S.M.; Lolli, S.; O’Connor, E.J.; Lee, H.F.; et al. Assessing Transboundary-Local Aerosols Interaction Over Complex Terrain Using a Doppler LiDAR Network. Geophys. Res. Lett. 2021, 48, e2021GL093238. [Google Scholar] [CrossRef]
  46. Cohen, M.D.; Stunder, B.J.B.; Rolph, G.D.; Draxler, R.R.; Stein, A.F.; Ngan, F. NOAA’s HYSPLIT Atmospheric Transport and Dispersion Modeling System. Bull. Amer. Meteorol. Soc. 2015, 96, 2059–2077. [Google Scholar] [CrossRef]
  47. Qian, Z.A.; Cai, Y.; Liu, J.T.; Li, D.L.; Song, M.H. Some advances in dust storm research over China-Mongolia areas. Chin. J. Geophys.-Chin. Ed. 2006, 49, 83–92. [Google Scholar]
  48. Yu, Y.; Kalashnikova, O.V.; Garay, M.J.; Notaro, M. Climatology of Asian dust activation and transport potential based on MISR satellite observations and trajectory analysis. Atmos. Chem. Phys. 2019, 19, 363–378. [Google Scholar] [CrossRef]
  49. Tao, M.; Chen, L.; Wang, J.; Wang, L.; Wang, W.; Lin, C.; Gui, L.; Wang, L.; Yu, C.; Wang, Y. Characterization of dust activation and their prevailing transport over East Asia based on multi-satellite observations. Atmos. Res. 2022, 265, 105886. [Google Scholar] [CrossRef]
Figure 1. The CDWL on the rooftop of the main building of Shandong Chambroad Co., Ltd.
Remotesensing 14 02809 g001
Figure 2. Horizontal scanning results of backscatter coefficient and two-dimensional wind vector for 27 March 2021. (ac) Pollution emission episode detected with fixed elevation of 0° at night. (df) A typical pollution emission episode detected with elevations of 0°, 2°, and 4° in the early morning. The direction of vector indicates the direction of the wind speed, and the length of the vector represents the relative wind speed.
Remotesensing 14 02809 g002
Figure 3. (a) The trajectories of smoke plume extracted from Figure 2d–f. (b) The red-box region is the tracking result of the point source pollution in Figure 3a. (c) The corresponding red box region in Figure 3b. Trajectories of plume are highlighted in (a). The blue triangle represents the lidar site.
Remotesensing 14 02809 g003
Figure 4. (ah) AQI maps of a dust storm transmission process. AQI maps originate from China’s air quality online monitoring and analysis platform. The red pentagram and blue triangle represent city of Beijing and Binzhou, respectively. (i) Comparison results of the CDWL and national monitoring station.
Remotesensing 14 02809 g004
Figure 5. A dust storm episode detected by CDWL from 28 to 30 March, 2021. (a) CNR, (b) backscatter coefficient, (c) horizontal wind speed, (d) horizontal wind direction, (e) vertical wind speed. The CNR and backscatter coefficient are averaged in a vertical scanning. Positive value of vertical velocity is defined as downward.
Remotesensing 14 02809 g005
Figure 6. The 48 h HYSPLIT backward trajectory result calculated at (a) 7:00 on 28 March, (b) 11:00 on 28 March, (c) 20:00 on 29 March, and (d) 6:00 on 30 March. The starting location is set as 0.5 km, 1 km, 2 km, 3 km, and 4 km over the lidar sites.
Remotesensing 14 02809 g006
Publisher’s Note: MDPI stays neutral with regard to jurisdictional claims in published maps and institutional affiliations.

