Article

Alert-Driven Community-Based Forest Monitoring: A Case of the Peruvian Amazon

by
Christina Cappello
1,2,*,
Arun Kumar Pratihast
1,
Alonso Pérez Ojeda del Arco
2,
Johannes Reiche
2,
Veronique De Sy
2,
Martin Herold
2,3,
Rolando Eduardo Vivanco Vicencio
4 and
Daniel Castillo Soto
4
1
Wageningen Environmental Research, Wageningen University and Research, P.O. Box 47, NL-6700 AA Wageningen, The Netherlands
2
Laboratory of Geo-Information Science and Remote Sensing, Wageningen University and Research, P.O. Box 47, NL-6700 AA Wageningen, The Netherlands
3
Helmholtz GFZ German Research Centre for Geosciences, Section 1.4 Remote Sensing and Geoinformatics, Telegrafenberg, 14473 Potsdam, Germany
4
Programa Nacional de Conservación de Bosques para la Mitigación del Cambio Climático, Lima 3030, Peru
*
Author to whom correspondence should be addressed.
Remote Sens. 2022, 14(17), 4284; https://doi.org/10.3390/rs14174284
Submission received: 17 June 2022 / Revised: 4 August 2022 / Accepted: 24 August 2022 / Published: 30 August 2022
(This article belongs to the Special Issue In Situ Data in the Interplay of Remote Sensing)

Abstract

:
Community-based monitoring (CBM) is one of the- most sustainable ways of establishing a national forest monitoring system for successful Reduce Emissions from Deforestation and Forest Degradation (REDD+) implementation. In this research, we present the details of the National Forest Conservation Program (PNCB—Programa Nacional de Conservación de Bosques para la Mitigación del Cambio Climático), Peru, from a satellite-based alert perspective. We examined the community’s involvement in forest monitoring and investigated the usability of 1853 CBM data in conjunction with 445 satellite-based alerts. The results confirm that Peru’s PCNB contributed significantly to the REDD+ scheme, and that the CBM data provided rich information on the process and drivers of forest change. We also identified some of the challenges faced in the existing system, such as delays in satellite-based alert transfer to communities, sustaining community participation, data quality and integration, data flow, and standardization. Furthermore, we found that mobile devices responding to alerts provided better and faster data on land-use, and a better response rate, and facilitated a more targeted approach to monitoring. We recommend expanding training efforts and equipping more communities with mobile devices, to facilitate a more standardized approach to forest monitoring. The automation and unification of the alert data flow and incentivization of the participating communities could further improve forest monitoring and bridge the gap between near-real-time (NRT) satellite-based and CBM systems.

1. Introduction

Forests are one of the most significant ecosystems on the planet, serving as both carbon sink and source [1,2], and cover around 31% of the total land area [3]. Nearly 50% of global forests are tropical forests, giving them a particularly important role in mitigating climate change [4,5,6]. In addition, tropical forests provide important ecosystem services which support the livelihoods of local and rural communities (e.g., Brazil nut extraction) [7,8,9,10]. An increased demand for natural resources, urban growth, expansion of commercial and subsistence agriculture, timber extraction, and livestock grazing have led to deforestation, fragmentation of the landscape, and loss of habitat [11,12]. These human-induced land use changes, mainly deforestation, are the second largest source of anthropogenic CO2 emissions, with the majority occurring in tropical regions (IPCC 2013). The reduction in size of tropical forests will also negatively affect their important carbon sink function.
In response, the United Nations Framework Convention on Climate Change (UNFCCC) introduced the framework to Reduce Emissions from Deforestation and Forest Degradation (REDD+), which includes fostering conservation, the sustainable management of forests, and enhancing forest carbon stocks [13,14]. Parties to the UNFCCC agreed to support developing countries in their efforts to design and implement national REDD+ strategies, policies, and action plans [15].
Countries participating in the REDD+ framework need to establish a credible, transparent, and reliable national forest monitoring system (NFMS) [16] in order to receive REDD+ payments. Satellite-based monitoring is considered a central part of REDD+ forest monitoring [17]. There have been increases in national forest monitoring capacities, especially in the tropics [18]. However, assessments which rely solely on satellite-based techniques might not provide full understanding of all deforestation and forest degradation processes (e.g., drivers, small-scale changes) [19]. Therefore, in addition to satellite-based monitoring, community-based monitoring (CBM) systems on the ground can play an important role in better understanding these processes and verifying forest changes [20,21].
Local and indigenous communities play an important role in mitigating deforestation, and remain crucial players in combatting climate change and decreasing carbon emissions [22]. According to Ministerio de Ambiente (MINAM) (2016), 16% of Peru’s deforestation occurs in indigenous communities, however, deforestation has affected only 2.3% of these areas. This implies a great potential for forest conservation in these areas, where better monitoring tools will improve forest management in these communities [23]. It was also found that indigenous communities in the Amazon managed to decrease forest carbon emissions and reduce deforestation [24]. Additionally, it was found that CBM was perceived positively by communities, despite former mistrust between communities and states [25].
CBM can provide a cost-effective and independent data source whilst engaging locals in forest monitoring, though there remains a disconnect between satellite-based monitoring systems and CBM systems on the ground. This can be seen in the disparate growth of capacity for forest monitoring using satellites and the NFMS of tropical countries [18,26,27]. Even though many countries are attempting to implement an NFMS, only a few REDD+ countries have established an integrated NFMS by combining satellite monitoring and CBM. There remains an operational gap in linking CBM and national forest monitoring, particularly around strategically and ethically engaging indigenous people, and understanding the added value for local conservation effectiveness [28,29].
A promising example of an emerging government-driven NFMS that incorporates CBM is Peru’s Conditional Direct Transfer Program, instigated by the Ministry of Environment (MINAM) and implemented by the National Forest Conservation Program (PNCB—Programa Nacional de Conservación de Bosques para la Mitigación del Cambio Climático). It is a novel multilevel institutional approach, operating on national, regional, and local levels, including local and indigenous communities [25]. Within this approach, a variety of different monitoring approaches are used across communities. The alert-driven community monitoring where communities should respond to satellite-based alerts of forest changes is a particularly interesting case study to examine the efficiency and effectiveness of an existing operational CBM system, including its integration between the local and the national level. For example, it was found that satellite-based alerts used by communities reduce deforestation, but some communities rarely receive these alerts [30].
The main objectives of this paper are to:
(1)
Present the institutional setup of the Peruvian National Forest Conservation Program, with a particular focus on data flows and community-based monitoring;
(2)
evaluate community participation, thematic detail, spatial and temporal accuracy, as well as fitness for use of CBM in conjunction with satellite-based alerts;
(3)
discuss implications for operational sustainability and the future of CBM within the PNCB program.

2. Institutional Set-Up of National Forest Conservation Program and Community Monitoring

Since 2010, the Peruvian Government has implemented the PNCB in collaboration with indigenous communities, indigenous organizations, regional and local governments, and civil society. The PNCB is operationally independent and carries out work at three different levels (Figure 1): National level, with MINAM and the Ministry of Agriculture (MINAGRI) as the technical unit with its headquarters in Lima; the regional level (GORE) operating as an intermediate level overseen by regional authorities; and the local level where indigenous organizations form inter-communal groups, where each community having their own vigilance committee and several communities having formed indigenous federations [25,31]. PNCB mainly coordinates with zonal and regional governments who are the responsible authorities in the forests. In some cases, this authority has not yet transferred from the Servicio Forestal y de Fauna Silvestre (SERFOR).
The process of community involvement starts at the national level, identifying and reaching out to communities (local level) to participate in the PNCB. Each community that wishes to participate needs to initiate an establishment process, followed by the demarcation of the territory’s conservation area, and organize their monitoring groups, known as vigilance committees (VC). Communities who participate in the program receive monetary compensation (10 PEN or 2.75 USD per Ha per year) for protecting their forests. Local and national levels both interact with the regional level, which makes arrangements with local offices, prepares base maps, provides training, and offers detailed plans for monitoring practices. Further details of the institutional arrangements for community engagement can be found in Kowler et al. [25].
As part of the conservation agreement with the PNCB, each community is required to patrol its forest four times a year. Community monitoring can be divided into two categories: routine monitoring and alert-driven monitoring (Figure 1).
Routine monitoring is a structured monitoring approach conducted by trained vigilance committees on a regular basis, using paper- or mobile-phone-based systems. It is independent from any deforestation alerts and other occurrences within the area and is conducted periodically at least four times per year. According to information from the communities, routine monitoring consists of routes selected by the vigilance committees of the communities themselves, based on factors such as distance, accessibility, terrain, logistics, and availability of resources (e.g., fuel). They choose areas that have not been monitored previously, or areas that need to be marked with milestones, or are of interest for the community (e.g., communities that are involved in management plans for timber for industrial consumption and have to georeference the trees).
Alert-driven monitoring is conducted in response to satellite-based forest disturbance alerts generated and distributed by PNCB. PNCB sends the satellite-based alerts to the affected communities on printed maps indicating the location of the detected forest disturbance. As a response to the alerts, vigilance committees go to the location to verify the alert. This approach is often more labor-intensive than routine monitoring, due to the accessibility of and route to the designated location. The satellite-based alerts are derived by PNCB from Landsat 8, with a resolution of 30 m and a revisiting time of eight days.
The paper-based system consists of a form provided by PNCB, which asks for information on geo-location, landcover, deforestation type, details of the individual making the record, photographs, and other information. For complete forms please see Appendix A, for an example of a filled- in monitoring report please see Appendix B. The vigilance committee is equipped with cameras and GPS devices on every patrol. Alert-driven and routine monitoring have different forms, and mobile-based monitoring operates in digitized form, using Open Data Kit (ODK).
The communities send field reports based on their field observations by the vigilance committees back to the regional or national level; Figure 1. These field reports consist of observations obtained from routine monitoring and alert-driven monitoring. The reporting can be paper-based or mobile-phone-based.

3. Evaluation of Community-Based Forest Monitoring

In this study, we evaluated community participation, thematic detail, and the spatial and temporal accuracy of community-based forest monitoring, based on an approach described by Pratihast et al. [22]. Community participation and thematic detail analysis included all 45 communities, while the temporal and spatial assessment was limited to six communities that were part of the alert-driven monitoring scheme.
To evaluate community participation, we considered regional differences in numbers of participating communities, numbers of observations, and observation type (routine, paper-based alert-driven, mobile-based alert-driven). The thematic detail of the field observation collected by the vigilance committees was divided into the observation categories of forest change, vegetation, land use, topography, markings, and other (Table 1).
The assessment of the temporal accuracy consisted of an analysis of the number of days between receiving satellite-based alerts and the field observations, for every community that deployed alert-driven monitoring. For analysis of the spatial accuracy, satellite-based alerts and alert-driven monitoring observations were mapped to check the proximity (i.e., consistency) of the coordinates. The satellite-based alerts did not include a spatial delineation (i.e., polygon) representing the precise area of the forest disturbance, but only the coordinates of the central point. Therefore, each satellite-based alert was mapped as a circular buffer of 15 m around the central point to approximate the area of the detected forest disturbance. The proximity analysis was performed for each community by calculating the shortest distance from a community-based monitoring observation point to the closest satellite-based alert area.

4. Results

4.1. Community Participation

A total of 445 satellite-based alerts were sent by PNCB to communities, and 1853 observations with geographic coordinates from vigilance committees were collected (Figure 2). These observations were collected by 45 different communities, over the six regions of Junín, Pasco, Cusco, Ayacucho, San Martín, and Loreto in Peru. The community of Poyeni had the highest number of observations, while Orejones had the lowest number of observations (Figure 3).
The graph in Figure 4 represents the number of satellite-based alerts and CBMs by region (Figure 4 Number of observations per region, divided into CBM and satellite-based alerts). Other graphs show the number of field observations according to type: Mobile-alert-driven monitoring; paper-based alert-driven monitoring, and routine monitoring. Overall, only eight communities had satellite-based alerts as well as alert-driven monitoring in the dataset. Communities Puerto Ocopa, Loma Linda, and San Pedro de Pichanaz all used mobile devices instead of paper- based field reports. Furthermore, alert-driven monitoring observations explicitly referred to satellite-based alerts.
We discovered that routine monitoring accounted for 95% of all observations. Only about 5% of monitoring corresponded to alert-driven monitoring. Focusing on alert-driven community monitoring, we see that only eight communities were involved, with the communities of Puerto Ocopa, Loma Linda, and San Pedro de Pichanaz in the Regions Junín, Pasco and Loreto (Figure 5) using mobile devices instead of paper-based field reports.

4.2. Thematic Detail

We observed that routine monitoring tended to include information on marking and topography, while alert-driven monitoring included mainly land use and forest change observations (Figure 6 see Table 1 for explanation)). Mobile-alert-driven monitoring also often includes information on vegetation.
In the categories of forest change, nine different drivers were mentioned by communities in their field observations: Wood extraction, wind, cattle, landslide, open plantation, reforestation, road, seismic exploration, and others (Figure 7).
In contrast, information from satellite-based alerts provided fewer categories: Landslide, open plantation (new), open plantation (rehabilitation), road, and others. For community field observations and satellite-based alerts, the biggest percentage of forest change was determined to be caused by conversion to open plantation (Figure 7 and Figure 8).

4.3. Temporal and Spatial Accuracy

Most alert-driven monitoring took place in 2016, during the time of this study. For the 23 field observations directly related to a satellite-based alert, the number of days between satellite-based alert and field observation varied from 20 days (eight observations), around 60 days (10 observations), to 110–125 days (five observations). All those observations were derived from paper-based monitoring, due to the lack of data in other classes.
The spatial accuracy (i.e., spatial proximity) analysis showed the shortest distance to each alert-driven monitoring point for 49 samples (Figure 9). Only the communities that used alert-driven monitoring were included in this analysis, all of which were from the Pasco region (Belen, Divisora, Loma Linda, Platanillo de Getarine, Puerto Davies, and San Pedro de Pichanaz).

5. Discussion of Implications for Operational Sustainability and Future of CBM

5.1. Review on the Program Outline

Including indigenous communities in PNCB is an important step for the effectiveness of Peru’s conservation effort, since the Amazon region alone harbors around 1200 indigenous communities that inhabit and manage more than 11 million hectare of land [32,33,34]. It was found that Peru’s monitoring of forest-area change and its associated satellite-based capacities have improved substantially in recent decades, while its forest inventory capacities have increased at a much lower rate [35]. We identified certain challenges in the existing system (e.g., delay in satellite-based alert transfer to communities, non-uniformity, i.e., digital versus analog data collection). There were significantly more CBM observations (including routine and alert-driven monitoring) than satellite-based alerts from the PNCB. The communities Junín and Pasco accounted for most of the observations due to their long ongoing work with the project in comparison with other communities. Additionally, some of the communities seem to have deployed solely routine monitoring, while others responded to satellite-based alerts with alert-driven monitoring. This could be due to unavailability of satellite-based alerts, different accessibility of the terrain, differences in incentives, or the manner of communication between governmental institutions. Slough et al. [30] confirmed these claims. It might be the case when one community does not receive many satellite-based alerts due to low deforestation rates, the observations are mostly based on routine monitoring, aimed at delimiting its boundaries, signaling, etc. The resulting low levels of alert-driven monitoring and the difference in driver characterization between satellite-based alerts and field monitoring insinuate a lack of understanding of the drivers and mechanisms of forest change on a larger scale.
Because of the remoteness of many communities and the complex logistics involved, paired with a prevalent paper-based method of monitoring, few communities practiced alert-driven monitoring. This low percentage of alert-driven monitoring in comparison to routine monitoring, and the fact that only certain communities deployed alert-driven monitoring, suggests different approaches by the communities, but also possible different approaches from the PNCB. According to discussions held with communities, routine monitoring consists of routes selected by the vigilance committees themselves based on distance, accessibility, logistics, and availability of resources (e.g., fuel).
Satellite-based forest monitoring and CBM both provide their own advantages but are rarely used together. Some communities involved in this project have little to no access to the internet or no mobile phones, which slows down data collection and data curation. However, given the context of the pandemic, and the need to actively communicate with the PNCB, as well as that of children and young people, among others, to participate in distance learning, many communities allocated part of their economic funds to install a private satellite internet service.
There is a need for more active data transfer building and increased capacity. This can be facilitated by providing people with mobile devices and systems that use offline maps and more standardized data collection [36]. The gap in spatial accuracy can also be bridged by providing more accurate devices and using offline maps, which can additionally improve temporal accuracy [37,38]. It must also be considered that communities must register their scope so that the NRT systems can periodically provide data. If they do not register, they depend on third persons to provide them with this information, which again results in delay and another potential source of error.

5.2. Review on the Data and Their Use

Some of the observations included incomplete or misspelled coordinates, which was likely due to difficulties recording UTM coordinates manually in the field. These errors could be counteracted by using digital or mobile devices with GPS that automatically record the coordinates in a standardized way. Additionally, the field data did not seem to have been summarized in a uniform or systematic format in the regional offices, which poses a challenge for effective centralization and data analysis on a national level.
It should be noted that land use observations, such as plantations, can result from recent forest changes, and there is therefore an ambiguity between these two categories. It would be helpful if field observations could include an indication on how recent the land use was, to enable estimation of when the forest change (if any) occurred.
When examining the temporal detail, the most complete dataset was for the year 2016, during the fieldwork of this study. It is possible that there has been alert-driven monitoring after 2016 and there were some obstacles in the information chain. It could also indicate a lack of communication, centralization, and transparency between agencies [25]. Before 2019, the PNCB partner communities only sporadically recorded information monitored in the field, as of 2018 the PNCB has requested this data more rigorously. The relatively large time lag between generated alerts and generated ground observations showed that, particular with paper-based monitoring, there is room for improvement. It seems to take a long time for information to reach remote areas and the community. This could be overcome by integration of a unified mobile system.
Spatial analysis showed that all field observations were within 4 km of the closest satellite-based alert. However, many observations fell to the same observation point. The response to satellite-based alert signals varied per community. The communities of Puerto Davis and Platanillo de Getarine have not spread the distance of their alerts, which means that all ground observations were from the same locations as the satellite-based alerts. This also applies to a fraction of the observations of all other communities. From this we can conclude that many observations were a direct reaction to the satellite-based alerts.
There was a clear difference between the thematic detail of CBM monitoring vs. satellite-based alerts. It is evident that the characterization of drivers of deforestation was more detailed in the CBM observations, with nine different drivers versus five drivers in satellite-based alerts. Furthermore, in the satellite-based alerts a large proportion (76.4%) were characterized as new plantations, while in the CBM observations only 42.3% were characterized as open plantation, and 26.8% were characterized as undefined. Due to the on-the-ground knowledge of the vigilance committees’ members, it is likely that the characterizations of the CBM observations were more accurate than the satellite-based alert characterizations [25]. Focusing the national efforts of PNCB more onto the training of the communities, providing an improved payment scheme, and extending the vigilance committees might help to integrate more alert-driven monitoring into the program. Providing communities with more access to resources by expanding payment schemes could help to expand monitoring approaches, which in turn might help some communities to switch from routine monitoring to alert-driven monitoring. This is confirmed by the data collected in the field.
Additionally, it is evident that the only regions that provided information on alert-driven monitoring were Pasco and, to a lesser extent, Junin and Loreto. However, we cannot conclude that other regions were not using alert-driven monitoring. It can similarly be suggested that more data was collected by other communities via paper-based alert-driven monitoring, but not processed at local or regional level. This may be another indication that a paper-based monitoring approach can lead to loss of data and to barriers in the data-collection chain.

5.3. Operational Sustainability and Scalability of the Program

It is evident that while there has been a high progress in NRT satellite-based techniques, including deforestation alerts [39,40], the application and operational sustainability of CBM leaves some progress to be desired. This can be seen by the big difference in observations of routine monitoring and alert-driven monitoring. Only the latter combines CBM and NRT satellite-based data to report on forest change. It is important to fill the gap and progress to a fully functioning integrated forest-monitoring system, using CBM alongside NRT satellite-based data. CBM is a potentially effective way to link satellite-based alert systems in action, providing crucial information on the drivers of deforestation and at the same time verifying NRT satellite-based alerts. It is also a way to directly engage communities, which has many benefits.
Routine monitoring can lead to bias due to selected factors that influence the monitoring routes. It might lead to an overrepresentation of deforested areas, since more accessible areas are more likely to be deforested. Similarly, it can lead to underrepresentation due to neglect of other areas further away. On the other hand, routine monitoring also gives communities a sense of autonomy by basing their decisions where to go on their current knowledge, informal communications, and spatial knowledge of the area.
Alert-driven acquired observation provides better data on land use, increased response rates, and targeted monitoring. However, communities reacted differently to alerts. Even though in theory, alert-driven monitoring is expected to perform better, there exist certain logistical issues that must be addressed. These include coordination with the offices of the PNCB, obtaining internet connection in remote areas, receiving the alerts and printing then, and overwriting the location into the GPS, which can be sources of errors. This explains the higher amount of data generated in routine monitoring. Moreover, mobile devices have significant potential to improve the monitoring system by facilitating accuracy and centralization of the field data collected. The communities that used a mobile device for data collection all had a higher number of alert-driven monitoring observations.
Limited attention has been paid to local communities and their motivations to participate in forest monitoring programs [28,41,42,43], which may have contributed to the lack of participation in some communities and the differences in numbers of reports across communities. There seems to be no uniform way to apply local consultation in the development of CBM schemes. Cultural sensitivity and understanding of the interests and motivations for participation among local communities are very important for successful implementation of an integrated NFMS [44]. Understanding the motivations for communities to participate, particularly in the long term, is vital for the sustainability of such programs and conclusively reaching climate goals and REDD+ objectives [45].
As key players in the protection of forests, communities should be able to adjust the PNCB to their own needs by choosing their own level of security of data collection and transmission, and to design or co-design the forms used to collect data. We encourage a transparent and flexible forest monitoring system that includes different incentive schemes, respects the autonomy and consent of communities, and includes different standards to choose from. In practice that could include community-owned equipment and infrastructure to store, analyze, and direct their actions based on the digital information they gather and own. This could be in the form of communal or intercommunal technology hubs led by indigenous organizations of the region.

6. Conclusions

6.1. Conclusions

Peru’s PCNB is a noteworthy national initiative with the goal of establishing a community-based forest monitoring program that is alert-driven and contributes extensively to the REDD+ scheme. It is unique in its multi-level communication, the CBM data is rich in providing the process and drivers of forest change, and has great potential for future forest conservation program development and implementation. With 1180 data points collected from 45 different communities and 445 satellite-based alerts distributed by the PNCB, we clearly see a broad participation of community members as well as instances of the government sending alerts. The CBM data comprise higher thematic detail then the satellite-based alerts and give more insights into the dynamics of deforestation in the area. Those satellite-based alerts can be used to locate deforested areas, and an aim-oriented and efficient monitoring system could be implemented.
However, some challenges have yet to be overcome. While commending the introduction of this national multilevel forest monitoring system, we discovered some shortcomings concerning transparency, citizen participation, data quality, data flow, and standardization. For successful implementation it is important that a uniform system exists, and that the communication between government agencies and the communities’ vigilance committees works in a time-efficient and transparent manner. To ensure community participation and trust, the payment scheme should be broadened, and the members of the vigilance committees should be compensated according to their contributions in the field. As stated by Kowler et al. [25], vigilance committee activity in forest conservation takes members from their daily work and thus reduces their income significantly.

6.2. Outlook

We recommend increasing the effectiveness of forest monitoring programs by extending the efforts and resources put into these. Building and maintaining trust and incentive schemes are key points for sustainability of any program including communities and government agencies across different levels. Thus, it is suggested that communities’ incentives are kept in check and community members compensated appropriately and fairly, according to the effort and risks taken during forest monitoring. Furthermore, we suggest moving to a unified monitoring approach that integrates routine and alert-driven monitoring, using mobile devices for data collection. This involves a need for further development and deployment of software, services, and applications that can help to ensure citizen participation and interaction in the data collection process. It can further improve data quality, transparency, and data flow. Concrete steps on follow-up actions can include:
1.
Improving policy on alert-driven monitoring and facilitating effective and efficient distribution to communities;
2.
Limiting interaction with data points between PNCB, vigilance committees, and communities involved with data manipulation, to remove the introduction of error;
3.
Moving from paper-based to mobile-based monitoring, to avoid ambiguity in data collection;
4.
Engaging more communities to take part in the project and incorporating their experiences.

Author Contributions

Conceptualization, A.K.P. and V.D.S.; Data curation, A.P.O.d.A.; Formal analysis, C.C.; Funding acquisition, A.K.P., V.D.S. and M.H.; Investigation, A.P.O.d.A.; Methodology, A.K.P., J.R. and M.H.; Project administration, A.K.P.; Software, C.C.; Supervision, A.K.P. and M.H.; Visualization, C.C.; Writing—original draft, C.C.; Writing—review & editing, A.K.P., A.P.O.d.A., J.R., V.D.S., M.H., R.E.V.V. and D.C.S. All authors have read and agreed to the published version of the manuscript.

Funding

This research is funded by German International Climate Initiative (IKI) of the Federal Ministry for the Environment, Nature Conservation and Nuclear Safety (BMU) (Project number 20_III_108_Global_A_Transparent Monitoring Land Sector). Further support is provided by USFS/Silvacarbon Peru project (Grant Agreement #18-IG-11132762-374).

Acknowledgments

The authors would like to express their gratitude to the National Forest Conservation Program, particularly Urpi Tania Brioso Bolivar, Jorge Tito, and Ruben Jacinto, for their time. We also appreciate Christelle Odongo-Braun for data analysis. We are grateful to Silva Carbon and USAID for their support in making this study feasible. This project is part of the International Climate Initiative (IKI) which is supported by The Federal Ministry for the Environment, Nature Conservation and Nuclear Safety (BMU) on the basis of a decision adopted by the German Bundestag. We highly acknowledge the three anonymous reviewers for their constructive feedback. And last but not least our biggest thanks to Elliot Shapiro for proofreading this paper.

Conflicts of Interest

The authors declare no conflict of interest. The founding sponsors had no role in the design of the study; in the collection, analyses, or interpretation of data; in the writing of the manuscript, or in the decision to publish the results.

Abbreviations

CBMCommunity-based monitoring
FAOFood and Agriculture Organization of the United Nations
NFMSNational Forest Monitoring System
NRTNear-Real-Time
MINAGRIMinistry of Agriculture
MINAMMinistry of Environment Peru—Ministerio del Ambiente
PNCBNational Forest Conservation Program—Programa Nacional de Conservación de Bosques para la Mitigación del Cambio Climatico
REDD+Reducing Emissions from Deforestation and Forest Degradation
RSRemote sensing
UNFCCUnited Nations Framework Convention on Climate Change

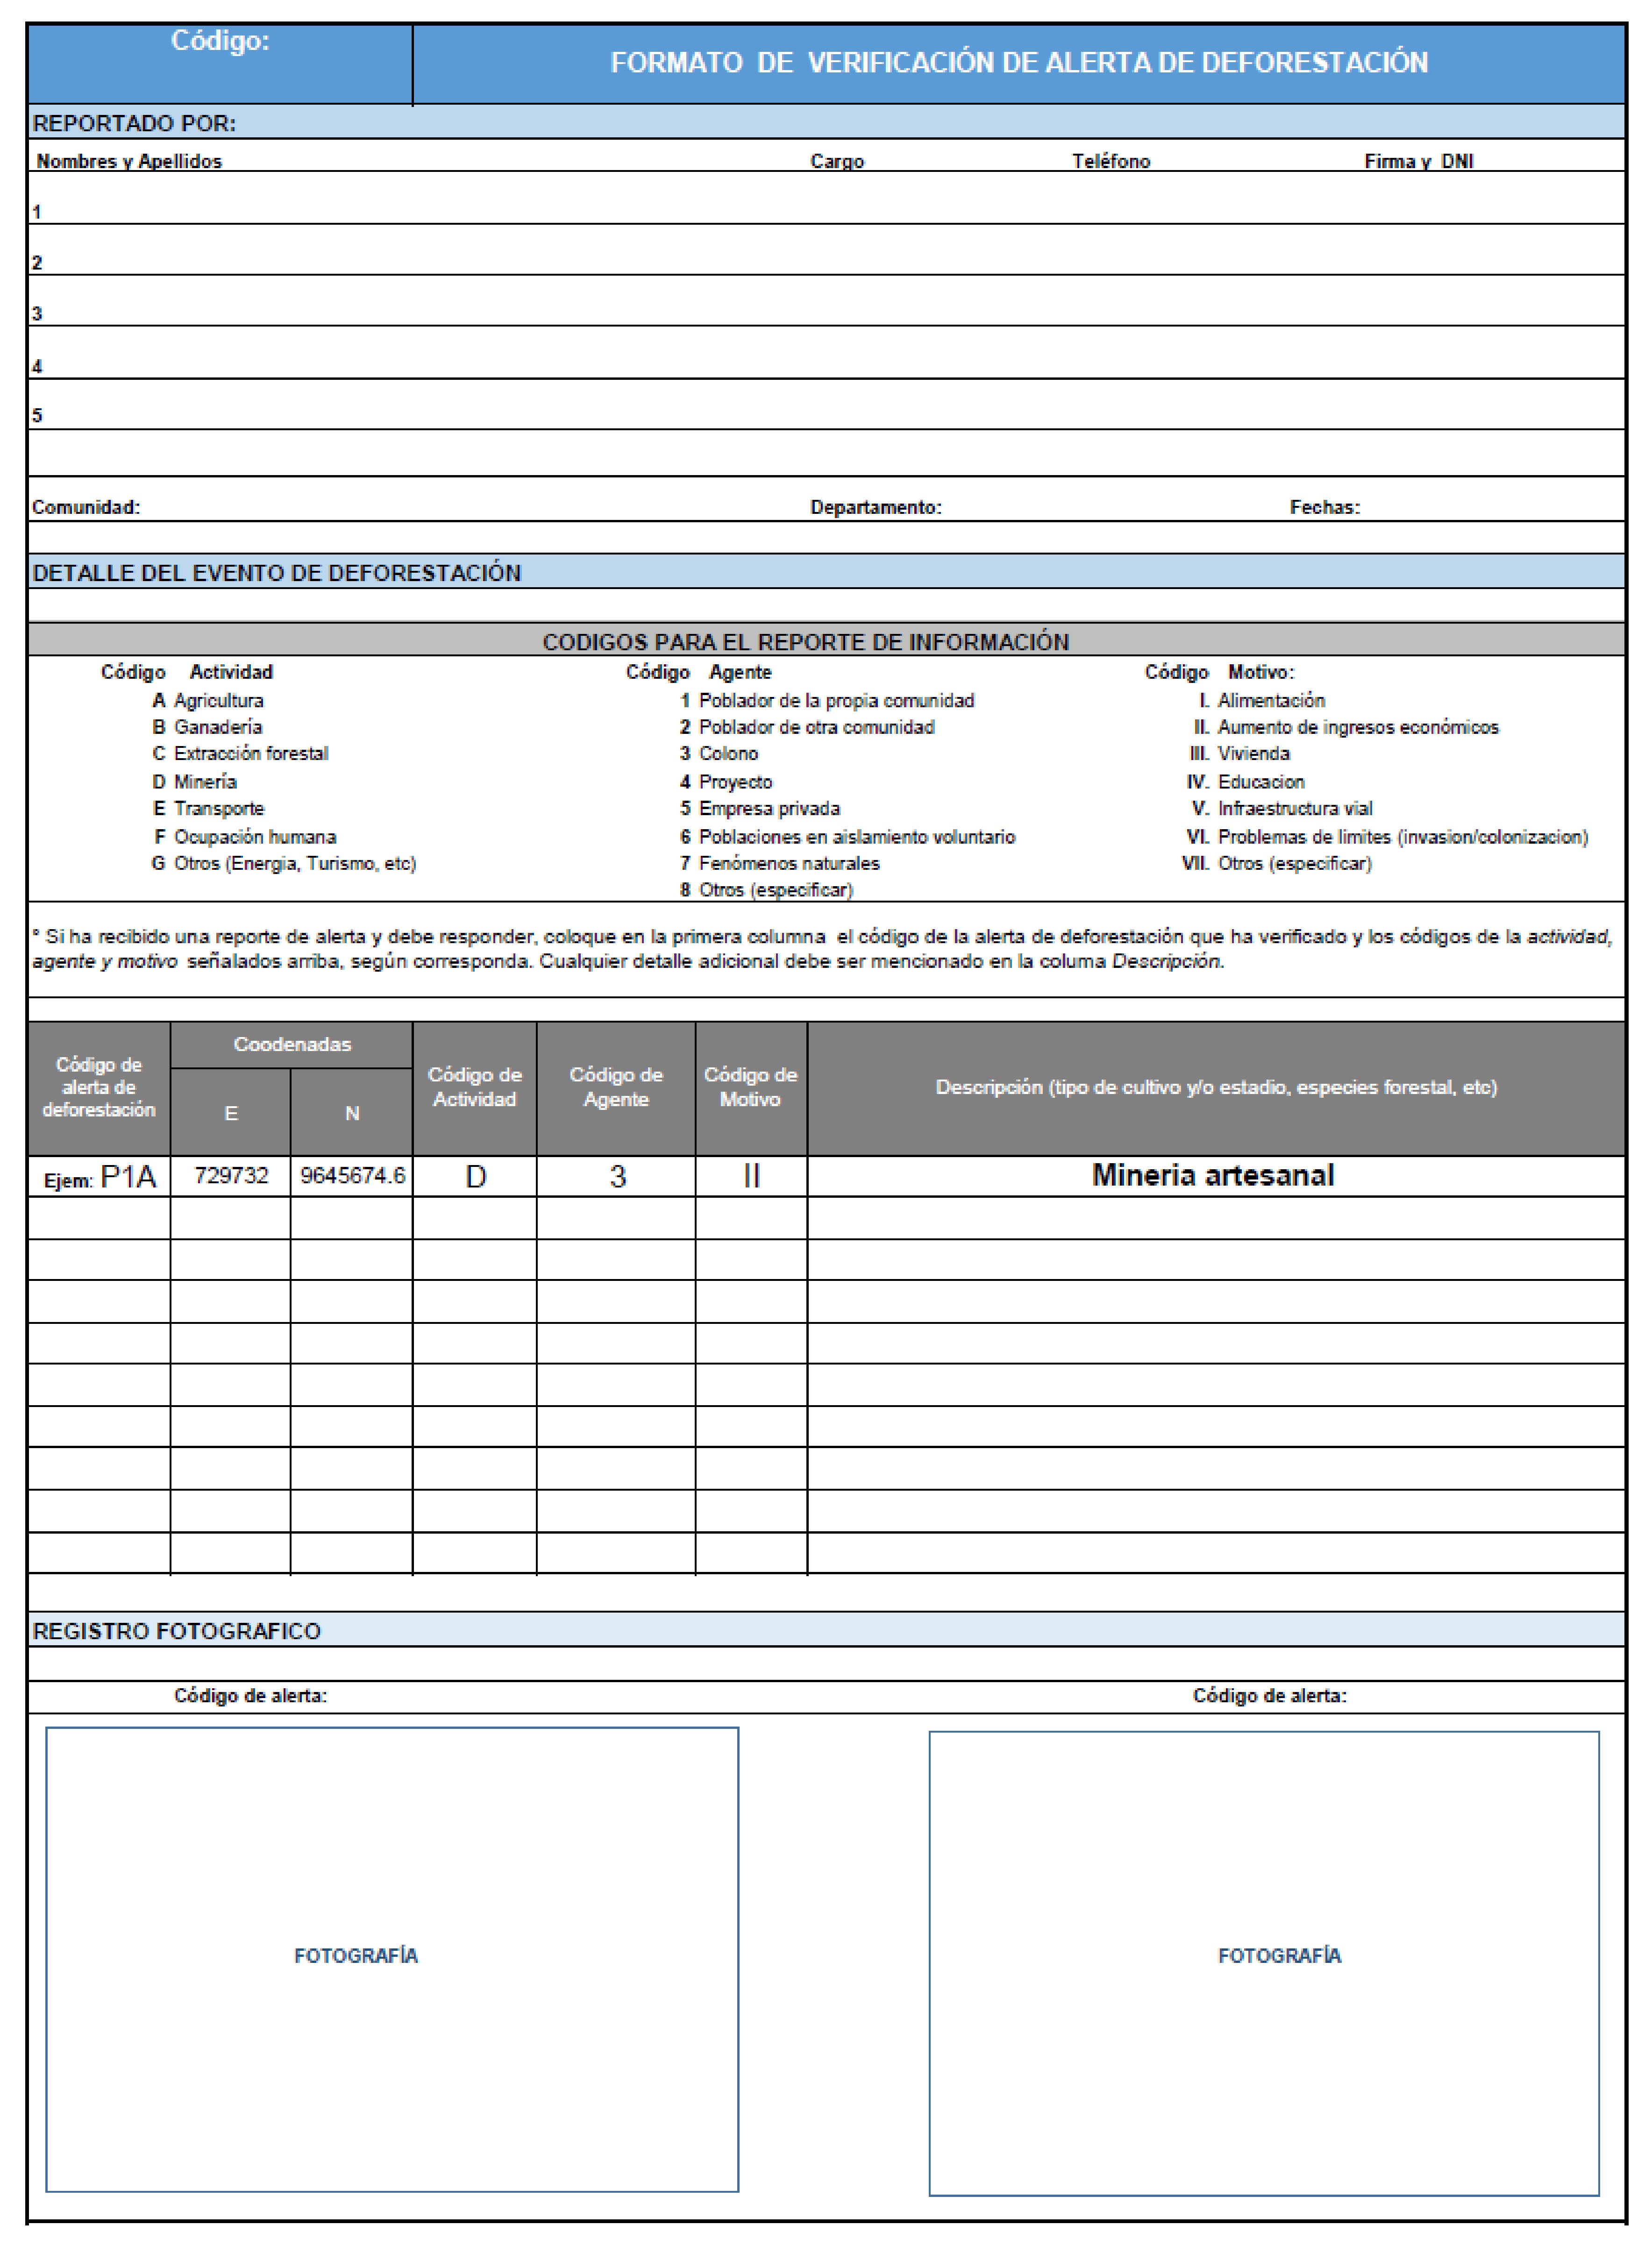
Appendix A. Format of Alert Verification

Figure A1. Deforestation alert verification format.
Remotesensing 14 04284 g0a1aRemotesensing 14 04284 g0a1b

Appendix B. Filled-in Report

Figure A2. Monitoring report N°. 01–2019 in the communal forest for conservation from the native community: Orejones.
Remotesensing 14 04284 g0a2

References

  1. Saatchi, S.S.; Harris, N.L.; Brown, S.; Lefsky, M.; Mitchard, E.T.A.; Salas, W.; Zutta, B.R.; Buermann, W.; Lewis, S.L.; Hagen, S.; et al. Benchmark map of forest carbon stocks in tropical regions across three continents. Proc. Natl. Acad. Sci. USA 2011, 108, 9899–9904. [Google Scholar] [CrossRef] [PubMed]
  2. Hardcastle, P.D.; Baird, D. Capability and cost assessment of the major forest nations to measure and monitor their forest carbon. Capab. Cost Assess. Major For. Nations Meas. Monit. For. Carbon 2012, 19, 33–48. [Google Scholar]
  3. Hansen, M.C.; Potapov, P.V.; Moore, R.; Hancher, M.; Turubanova, S.A.; Tyukavina, A.; Thau, D.; Stehman, S.V.; Goetz, S.J.; Loveland, T.R.; et al. High-resolution global maps of 21st-century forest cover change. Science 2013, 342, 850–853. [Google Scholar] [CrossRef] [PubMed]
  4. FAO. Global Forest Resources Assessment 2020-Key Findings; FAO: Rome, Italy, 2020. [Google Scholar]
  5. FAO. Global Forest Resource Assessment 2010; FAO: Rome, Italy, 2010. [Google Scholar]
  6. Grassi, G.; House, J.; Dentener, F.; Federici, S.; Den Elzen, M.; Penman, J. The key role of forests in meeting climate targets requires science for credible mitigation. Nat. Clim. Chang. 2017, 7, 220–226. [Google Scholar] [CrossRef]
  7. Angelsen, A.; Jagger, P.; Babigumira, R.; Belcher, B.; Hogarth, N.J.; Bauch, S.; Borner, J.; Smith-Hall, C.; Wunder, S. Environmental Income and Rural Livelihoods: A Global-Comparative Analysis. World Dev. 2014, 64, S12–S28. [Google Scholar] [CrossRef]
  8. Vedeld, P.; Angelsen, A.; Bojö, J.; Sjaastad, E.; Kobugabe Berg, G. Forest environmental incomes and the rural poor. For. Policy Economics 2007, 9, 869–879. [Google Scholar] [CrossRef]
  9. Martínez Pastur, G.; Perera, A.H.; Peterson, U.; Iverson, L.R. Ecosystem services from forest landscapes: An overview. In Ecosystem Services from Forest Landscapes; Springer: Berlin/Heidelberg, Germany, 2018; pp. 1–10. [Google Scholar]
  10. Food and Agriculture Organization of the United Nations. State of the World’s Forests. Enhancing the Socioeconomic Benefits from Forests; Food and Agriculture Organization of the United Nations: Rome, Italy, 2014. [Google Scholar]
  11. Pielke, R.A. Land use and climate change. Science 2005, 310, 1625–1626. [Google Scholar] [CrossRef]
  12. Hosonuma, N.; Herold, M.; De Sy, V.; De Fries, R.S.; Brockhaus, M.; Verchot, L.; Angelsen, A.; Romijn, E. An assessment of deforestation and forest degradation drivers in developing countries. Environ. Res. Lett. 2012, 7, 044009. [Google Scholar] [CrossRef]
  13. Maniatis, D.; Todd, K.; Scriven, J.; Guay, B.; Hugel, B. Towards a Common Understanding of REDD+ under the UNFCCC; Annual Reviews: Palo Alto, CA, USA, 2016. [Google Scholar]
  14. Nepstad, D.C.; Boyd, W.; Stickler, C.M.; Bezerra, T.; Azevedo, A.A. Responding to climate change and the global land crisis: REDD+, market transformation and low-emissions rural development. Philos. Trans. R. Soc. B Biol. Sci. 2013, 368, 20120167. [Google Scholar] [CrossRef]
  15. FAO. Seventy Years of FAO’s Global Forest Resources Assessment Historical Overview and Future Prospects; FAO: Rome, Italy, 2018. [Google Scholar]
  16. FAO. REDD+ Reducing Emissions from Deforestation and Forest Degradation FAO. 2021. Available online: http://www.fao.org/redd/overview/en/ (accessed on 16 June 2022).
  17. Song, X.P.; Huang, C.; Saatchi, S.S.; Hansen, M.C.; Townshend, J.R. Annual carbon emissions from deforestation in the Amazon basin between 2000 and 2010. PLoS ONE 2015, 10, e0126754. [Google Scholar] [CrossRef]
  18. Nesha, M.K.; Herold, M.; De Sy, V.; Duchelle, A.E.; Martius, C.; Branthomme, A.; Garzuglia, M.; Jonsson, O.; Pekkarinen, A. An assessment of data sources, data quality and changes in national forest monitoring capacities in the Global Forest Resources Assessment 2005–2020. Environ. Res. Lett. 2021, 16, 054029. [Google Scholar] [CrossRef]
  19. Calders, K.; Jonckheere, I.; Nightingale, J.; Vastaranta, M. Remote Sensing Technology Applications in Forestry and REDD+. Forests 2020, 11, 188. [Google Scholar] [CrossRef]
  20. Danielsen, F.; Adrian, T.; Brofeldt, S.; Van Noordwijk, M.; Poulsen, M.K.; Rahayu, S.; Rutishauser, E.; Theilade, I.; Widayati, A.; An, N.T.; et al. Community monitoring for REDD+: International promises and field realities. Ecol. Society 2013, 18, 3. [Google Scholar] [CrossRef]
  21. Pratihast, A.K.; DeVries, B.; Avitabile, V.; De Bruin, S.; Kooistra, L.; Tekle, M.; Herold, M. Combining satellite data and community-based observations for forest monitoring. Forests 2014, 5, 2464–2489. [Google Scholar] [CrossRef]
  22. Wallbott, L. Indigenous peoples in UN REDD+ negotiations: "Importing power" and lobbying for rights through discursive interplay management. Ecol. Society 2014, 19, 1. [Google Scholar] [CrossRef]
  23. MINAM. Estrategia Nacional de Bosques y Cambio Climático 2016. Available online: http://www.bosques.gob.pe/archivo/ff3f54_ESTRATEGIACAMBIOCLIMATICO2016_ok.pdf (accessed on 16 June 2022).
  24. Blackman, A.; Corral, L.; Lima, E.S.; Asner, G.P. Titling indigenous communities protects forests in the Peruvian Amazon. Proc. Natl. Acad. Sci. USA 2017, 114, 4123–4128. [Google Scholar] [CrossRef] [PubMed]
  25. Kowler, L.F.; Pratihast, A.K.; del Arco, A.P.O.; Larson, A.M.; Braun, C.; Herold, M. Aiming for sustainability and scalability: Community engagement in forest payment schemes. Forests 2020, 11, 444. [Google Scholar] [CrossRef]
  26. Diniz, C.G.; de Almeida Souza, A.A.; Santos, D.C.; Dias, M.C.; Da Luz, N.C.; De Moraes, D.R.; Maia, J.S.; Gomes, A.R.; da Silva Narvaes, I.; Valeriano, D.M.; et al. DETER-B: The New Amazon Near Real-Time Deforestation Detection System. IEEE J. Sel. Top. Appl. Earth Obs. Remote Sens. 2015, 8, 3619–3628. [Google Scholar] [CrossRef]
  27. Bucki, M.; Cuypers, D.; Mayaux, P.; Achard, F.; Estreguil, C.; Grassi, G. Assessing REDD+ performance of countries with low monitoring capacities: The matrix approach. Environ. Res. Lett. 2012, 7, 014031. [Google Scholar] [CrossRef]
  28. Larrazábal, A.; McCall, M.K.; Mwampamba, T.H.; Skutsch, M. The role of community carbon monitoring for REDD+: A review of experiences. Curr. Opin. Environ. Sustain. 2012, 4, 707–716. [Google Scholar] [CrossRef]
  29. Schmitt, C.B.; Mukungu, J. How to achieve effective participation of communities in the monitoring of REDD+ projects: A case study in the Democratic Republic of Congo (DRC). Forests 2019, 10, 794. [Google Scholar] [CrossRef] [Green Version]
  30. Slough, T.; Kopas, J.; Urpelainen, J. Satellite-based deforestation alerts with training and incentives for patrolling facilitate community monitoring in the Peruvian Amazon. Proc. Natl. Acad. Sci. USA 2021, 118, e2015171118. [Google Scholar] [CrossRef] [PubMed]
  31. Plan Operativo Institutional-II Reprogramación Unidad Ejecutora 002 Conservation de Bosques. 2016, p. 49. Available online: https://www.transparencia.gob.pe/enlaces/pte_transparencia_enlaces.aspx?id_entidad=14051&id_tema=5&ver=D#.Yw2K1nZBxPY (accessed on 16 June 2022).
  32. Instituto del Bien Común. Directorio de Comunidades Nativas Del Perú; Instituto del Bien Común: Lima, Peru, 2013. [Google Scholar]
  33. COFOPRI. Demarcación y Titulación de Comunidades Nativas; COFOPRI: Lima, Peru, 2008. [Google Scholar]
  34. IBC-WRI. Sistema de Información Sobre Comunidades Nativas de la Amazonia Peruana; IBC-WRI: Lima, Peru, 2009. [Google Scholar]
  35. Romijn, E.; Lantican, C.B.; Herold, M.; Lindquist, E.; Ochieng, R.; Wijaya, A.; Murdiyarso, D.; Verchot, L. Assessing change in national forest monitoring capacities of 99 tropical countries. For. Ecol. Manag. 2015, 352, 109–123. [Google Scholar] [CrossRef]
  36. Pratihast, A.K.; Herold, M.; Avitabile, V.; De Bruin, S.; Bartholomeus, H.; Souza, C.M., Jr.; Ribbe, L. Mobile devices for community-based REDD+ monitoring: A case study for central Vietnam. Sensors 2013, 13, 21–38. [Google Scholar] [CrossRef] [PubMed]
  37. Antoniou, V.; Potsiou, C. Design and development of geographic citizen science technological perspectives and considerations. In Geographic Citizen Science Design. No One Left behind; Skarlatidou, A., Haklay, M., Eds.; UCL Press: London, UK, 2021; pp. 38–54. [Google Scholar]
  38. Radicchi, A. Citizen science mobile apps for soundscape research and public spaces studies. lessons from the Hush City project. In Geographic Citizen Science Design. No One Left behind; Skarlatidou, A., Haklay, M., Eds.; UCL Press: London, UK, 2021; pp. 130–148. [Google Scholar]
  39. Hansen, M.C.; Krylov, A.; Tyukavina, A.; Potapov, P.V.; Turubanova, S.; Zutta, B.; Ifo, S.; Margono, B.; Stolle, F.; Moore, R. Humid tropical forest disturbance alerts using Landsat data. Environ. Res. Lett. 2016, 11, 034008. [Google Scholar] [CrossRef]
  40. Reiche, J.; Mullissa, A.; Slagter, B.; Gou, Y.; Tsendbazar, N.E.; Odongo-Braun, C.; Vollrath, A.; Weisse, M.J.; Stolle, F.; Pickens, A.; et al. Forest disturbance alerts for the Congo Basin using Sentinel-1. Environ. Res. Lett. 2021, 16, 024005. [Google Scholar] [CrossRef]
  41. Somorin, O.A.; Visseren-Hamakers, I.J.; Arts, B.; Sonwa, D.J.; Tiani, A.M. REDD+ policy strategy in Cameroon: Actors, institutions and governance. Environ. Sci. Policy 2014, 35, 87–97. [Google Scholar] [CrossRef]
  42. Awono, A.; Somorin, O.A.; Eba’a Atyi, R.; Levang, P. Tenure and participation in local REDD+ projects: Insights from southern Cameroon. Environ. Sci. Policy 2014, 35, 76–86. [Google Scholar] [CrossRef]
  43. Ekowati, D.; Hofstee, C.; Praputra, A.V.; Sheil, D. Motivation matters: Lessons for REDD+ participatory measurement, reporting and verification from three decades of child health participatory monitoring in Indonesia. PLoS ONE 2016, 11, e0159480. [Google Scholar] [CrossRef]
  44. Seddon, N.; Smith, A.; Smith, P.; Key, I.; Chausson, A.; Girardin, C.; House, J.; Srivastava, S.; Turner, B. Getting the message right on nature-based solutions to climate change. Glob. Chang. Biology 2021, 27, 1518–1546. [Google Scholar] [CrossRef]
  45. Boissière, M.; Herold, M.; Atmadja, S.; Sheil, D. The feasibility of local participation in Measuring, Reporting and Verification (PMRV) for REDD+. PLoS ONE 2017, 12, e0176897. [Google Scholar] [CrossRef] [Green Version]
Figure 1. Community-based forest monitoring set-up, Peru.
Remotesensing 14 04284 g001
Figure 2. Study area; the green regions indicate the participating regions, the purple points show Routine Observations, the purple points indicate CBM observations, and red indicate satellite-based alerts.
Remotesensing 14 04284 g002
Figure 3. Number of observations of vigilance committees, per region.
Remotesensing 14 04284 g003
Figure 4. Number of observations per region, divided into CBM and satellite-based alerts.
Remotesensing 14 04284 g004
Figure 5. Number of observations per region, where mustard bars indicate routine monitoring, blue bars indicate paper-based alert-driven monitoring, and green indicates mobile-based monitoring.
Remotesensing 14 04284 g005
Figure 6. Categories of observations made per monitoring approach (see Table 1 for explanation).
Remotesensing 14 04284 g006
Figure 7. Forest change characterization based on routine and alert-driven field observations by communities.
Remotesensing 14 04284 g007
Figure 8. Forest change characterization based on satellite-based alerts.
Remotesensing 14 04284 g008
Figure 9. Spatial proximity (meters) of satellite-based alerts to nearest field observation.
Remotesensing 14 04284 g009
Table 1. Thematic detail of CBM observation categories.
CategoryDescription
Forest changeDeforestation, logging, landslides, clearing due to crops, burning, etc.
VegetationInformation about tree species, medicinal plants, and forest type (primary forest, dense forest)
Land useAnthropogenic features found at a location, e.g., roads, camps, crops, trails, houses, and farms
TopographyImportant topographical features such as streams, rivers, slopes, flat terrain, or waterfalls
MarkingLandmarks and boundary demarcation, start and end points of a tour, intersections and limits
OtherCategories that could either not be identified or did not fit under another category
NoneNo information available
Publisher’s Note: MDPI stays neutral with regard to jurisdictional claims in published maps and institutional affiliations.

