Article

Analysis of Vegetation Vulnerability Dynamics and Driving Forces to Multiple Drought Stresses in a Changing Environment

1
State Key Laboratory of Eco-Hydraulics in Northwest Arid Region of China, Xi’an University of Technology, Xi’an 710048, China
2
Key Laboratory of Water Cycle and Related Land Surface Processes, Institute of Geographic Sciences and Natural Resources Research, Chinese Academy of Sciences, Beijing 100101, China
3
School of Water Conservancy Engineering, Zhengzhou University, Zhengzhou 450001, China
4
State Key Laboratory of Desert and Oasis Ecology, Xinjiang Institute of Ecology and Geography, Chinese Academy of Sciences, Urumqi 830011, China
5
Department of Geography, Hong Kong Baptist University, Baptist University Road, Kowloon Tong, Hong Kong 999077, China
6
Department of Remote Sensing, Helmholtz Centre for Environmental Research−UFZ, Permoserstrasse 15, 04318 Leipzig, Germany
7
Remote Sensing Centre for Earth System Research, Leipzig University, 04103 Leipzig, Germany
*
Author to whom correspondence should be addressed.
Remote Sens. 2022, 14(17), 4231; https://doi.org/10.3390/rs14174231
Submission received: 26 July 2022 / Revised: 20 August 2022 / Accepted: 24 August 2022 / Published: 27 August 2022
(This article belongs to the Section Remote Sensing in Agriculture and Vegetation)

Abstract

:
Quantifying changes in the vulnerability of vegetation to various drought stresses in different seasons is important for rational and effective ecological conservation and restoration. However, the vulnerability of vegetation and its dynamics in a changing environment are still unknown, and quantitative attribution analysis of vulnerability changes has been rarely studied. To this end, this study explored the changes of vegetation vulnerability characteristics under various drought stresses in Xinjiang and conducted quantitative attribution analysis using the random forest method. In addition, the effects of ecological water transport and increased irrigation areas on vegetation vulnerability dynamics were examined. The standardized precipitation index (SPI), standardized precipitation-evapotranspiration index (SPEI), and standardized soil moisture index (SSMI) represent atmospheric water supply stress, water and heat supply stress, and soil water supply stress, respectively. The results showed that: (1) different vegetation types responded differently to water stress, with grasslands being more sensitive than forests and croplands in summer; (2) increased vegetation vulnerability under drought stresses dominated in Xinjiang after 2003, with vegetation growth and near-surface temperature being the main drivers, while increased soil moisture in the root zone was the main driver of decreased vegetation vulnerability; (3) vulnerability of cropland to SPI/SPEI/SSMI-related water stress increased due to the rapid expansion of irrigation areas, which led to increasing water demand in autumn that was difficult to meet; and (4) after ecological water transport of the Tarim River Basin, the vulnerability of its downstream vegetation to drought was reduced.

Graphical Abstract

1. Introduction

Drought is one of the most serious and common natural disasters, affecting agriculture, ecosystems, and the social economy [1,2]. In the context of global warming [3,4], drought will intensify and affect vegetation dynamics [5,6,7]. In addition, long-term precipitation deficit may reduce the available water in the root zone of vegetation, affecting the growth of vegetation and even increasing the mortality of vegetation [8,9,10]. Vegetation is a very important part of the terrestrial ecosystem, controlling the water cycle, matter and energy exchanges, and plays a very important role in climate regulation and terrestrial carbon balance regulation [11,12,13,14]. The study of dryland vegetation dynamics has raised much attention in climate change research [15,16]. Dryland ecosystem areas are sensitive to climate change and human activities [16]. Xinjiang is China’s largest province in land area and plays an important role in China’s economic development. Xinjiang is a mountain-oasis-desert system, which is the largest area of dryland ecosystem in China [16,17,18]. Yang et al. [19] found that the eco-environment of the mountain-oasis-desert coupling system in Xinjiang was fragile and very sensitive to global climate change. Several studies have analyzed the change of water budget in Xinjiang, and confirmed that the water cycle in Xinjiang was intensifying [20,21,22]. Li et al. [23] found that there was a drought trend in the southern part of Xinjiang. Moreover, in arid areas, water resources are directly related to the construction of ecological environment. In 2000, China organized an emergency ecological diversion project for the lower reaches of Tarim River to improve the ecological environment [24,25]. Several studies have analyzed the ecological water diversion of the Tarim River [26]. For example, Guo et al. [27] analyzed the effects of water transport dike of the Tarim River on the cover of desert riparian vegetation. Tao et al. [28] and Yang et al. [29] analyzed the dynamics of groundwater depth and vegetation response after water diversion. Bao et al. [30] evaluated the effect of ecological water diversion on vegetation restoration. Vulnerability is defined as the degree to which a disaster body (a system or part of it) is damaged by a single or combined disaster event [31,32]. Several studies have emphasized the importance of studying vegetation response from the perspective of vulnerability [33,34]. Vegetation vulnerability is the sensitive response of vegetation to external interference at a specific spatial and temporal scale [8]. The response of Xinjiang vegetation vulnerability to ecological water transfer under drought stresses has not been quantified, and it is unknown whether vegetation vulnerability to different drought stresses varies from season to season in a changing environment. Previous studies mainly focused on the response of vegetation to conventional hydroclimatic changes (e.g., temperature, precipitation, potential evaporation, soil moisture) [35,36,37,38]. Few studies have quantitatively analyzed the driving forces of vegetation vulnerability changes under multiple drought stresses [39]. Therefore, it is important to assess the vulnerability and resistance of vegetation to drought stress and to quantify the impact of ecological water transfer on vegetation vulnerability in the context of increasing drought in Xinjiang.
Xinjiang is an inland arid region with complex terrain conditions, interspersed with mountains, oases and deserts [40]. The synergistic relationship between precipitation, soil moisture and vegetation are different in different geographical units. Therefore, it is necessary to analyze the responses of different vegetation types to drought in Xinjiang. SPI and SPEI are widely used in the field of meteorology to monitor drought severity, quantify, and analyze drought, and determine the impact of drought on various systems [41,42,43]. In contrast to SPI, which relies exclusively on precipitation, SPEI combines the monthly climatic water balance, taking into account the effects of changes in precipitation and evapotranspiration [44,45,46]. Moreover, the change of root zone soil moisture can also reflect the dynamic change of vegetation in Xinjiang [41]. The SPI, SPEI, and SSMI drought indexes were all used in this study to explore the response of vegetation to drought stresses. Normalized difference vegetation index (NDVI) has been widely used to characterize vegetation vitality and greening rate [47]. Linear regression alone may not be sufficient to reveal the variation of nonlinear vegetation trends [48]. The concept of copula was first introduced by Sklar in 1959 [49]. The copula function is a multidimensional joint distribution function with a definition domain of [0, 1]. Its core concept is to couple the marginal distributions of multiple random variables with the Copula function. The Copula function has been widely used in hydrology, and the method has shown advantages in revealing nonlinear changes between climate and NDVI [50,51]. In addition, the importance score of the random forest method was used to analyze the drivers of vegetation vulnerability change.
The objective of this study is to investigate the changes and drivers of vegetation vulnerability responses to multiple drought stresses in different seasons, and to explore the influence of ecological water transport on vegetation vulnerability in Xinjiang. The results of the study can help explain vegetation responses to climate and hydrological changes.

2. Materials and Methods

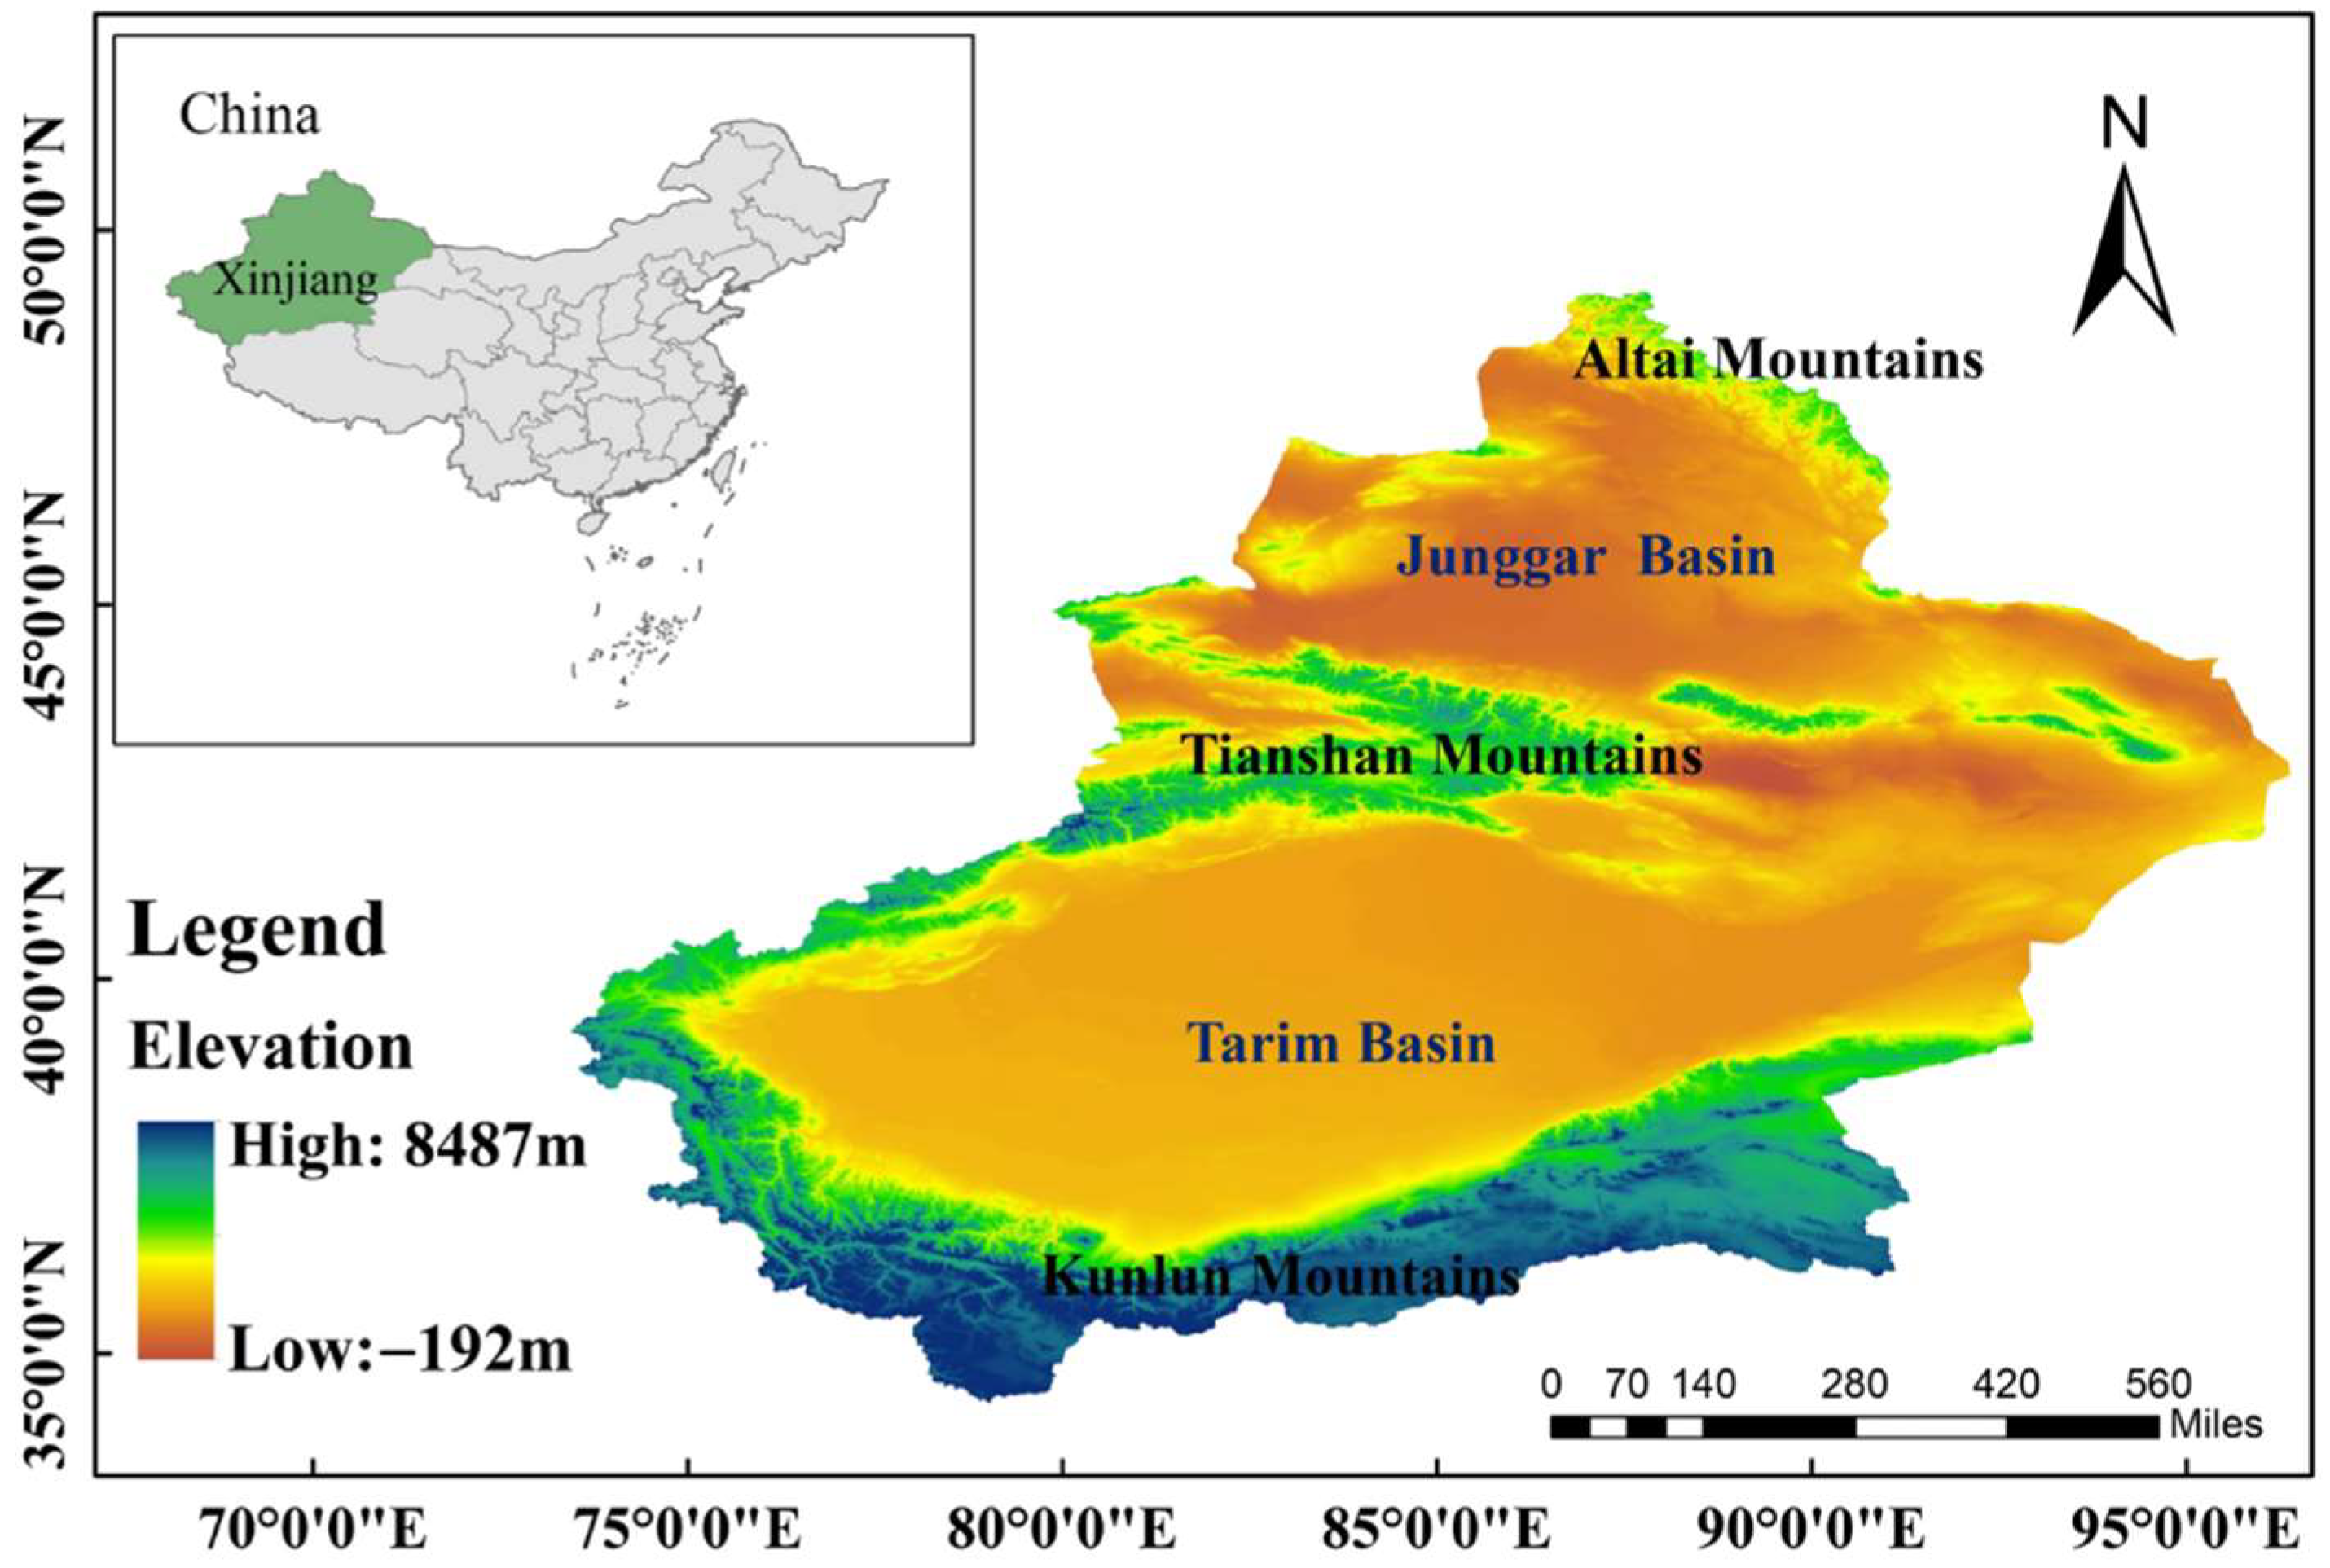
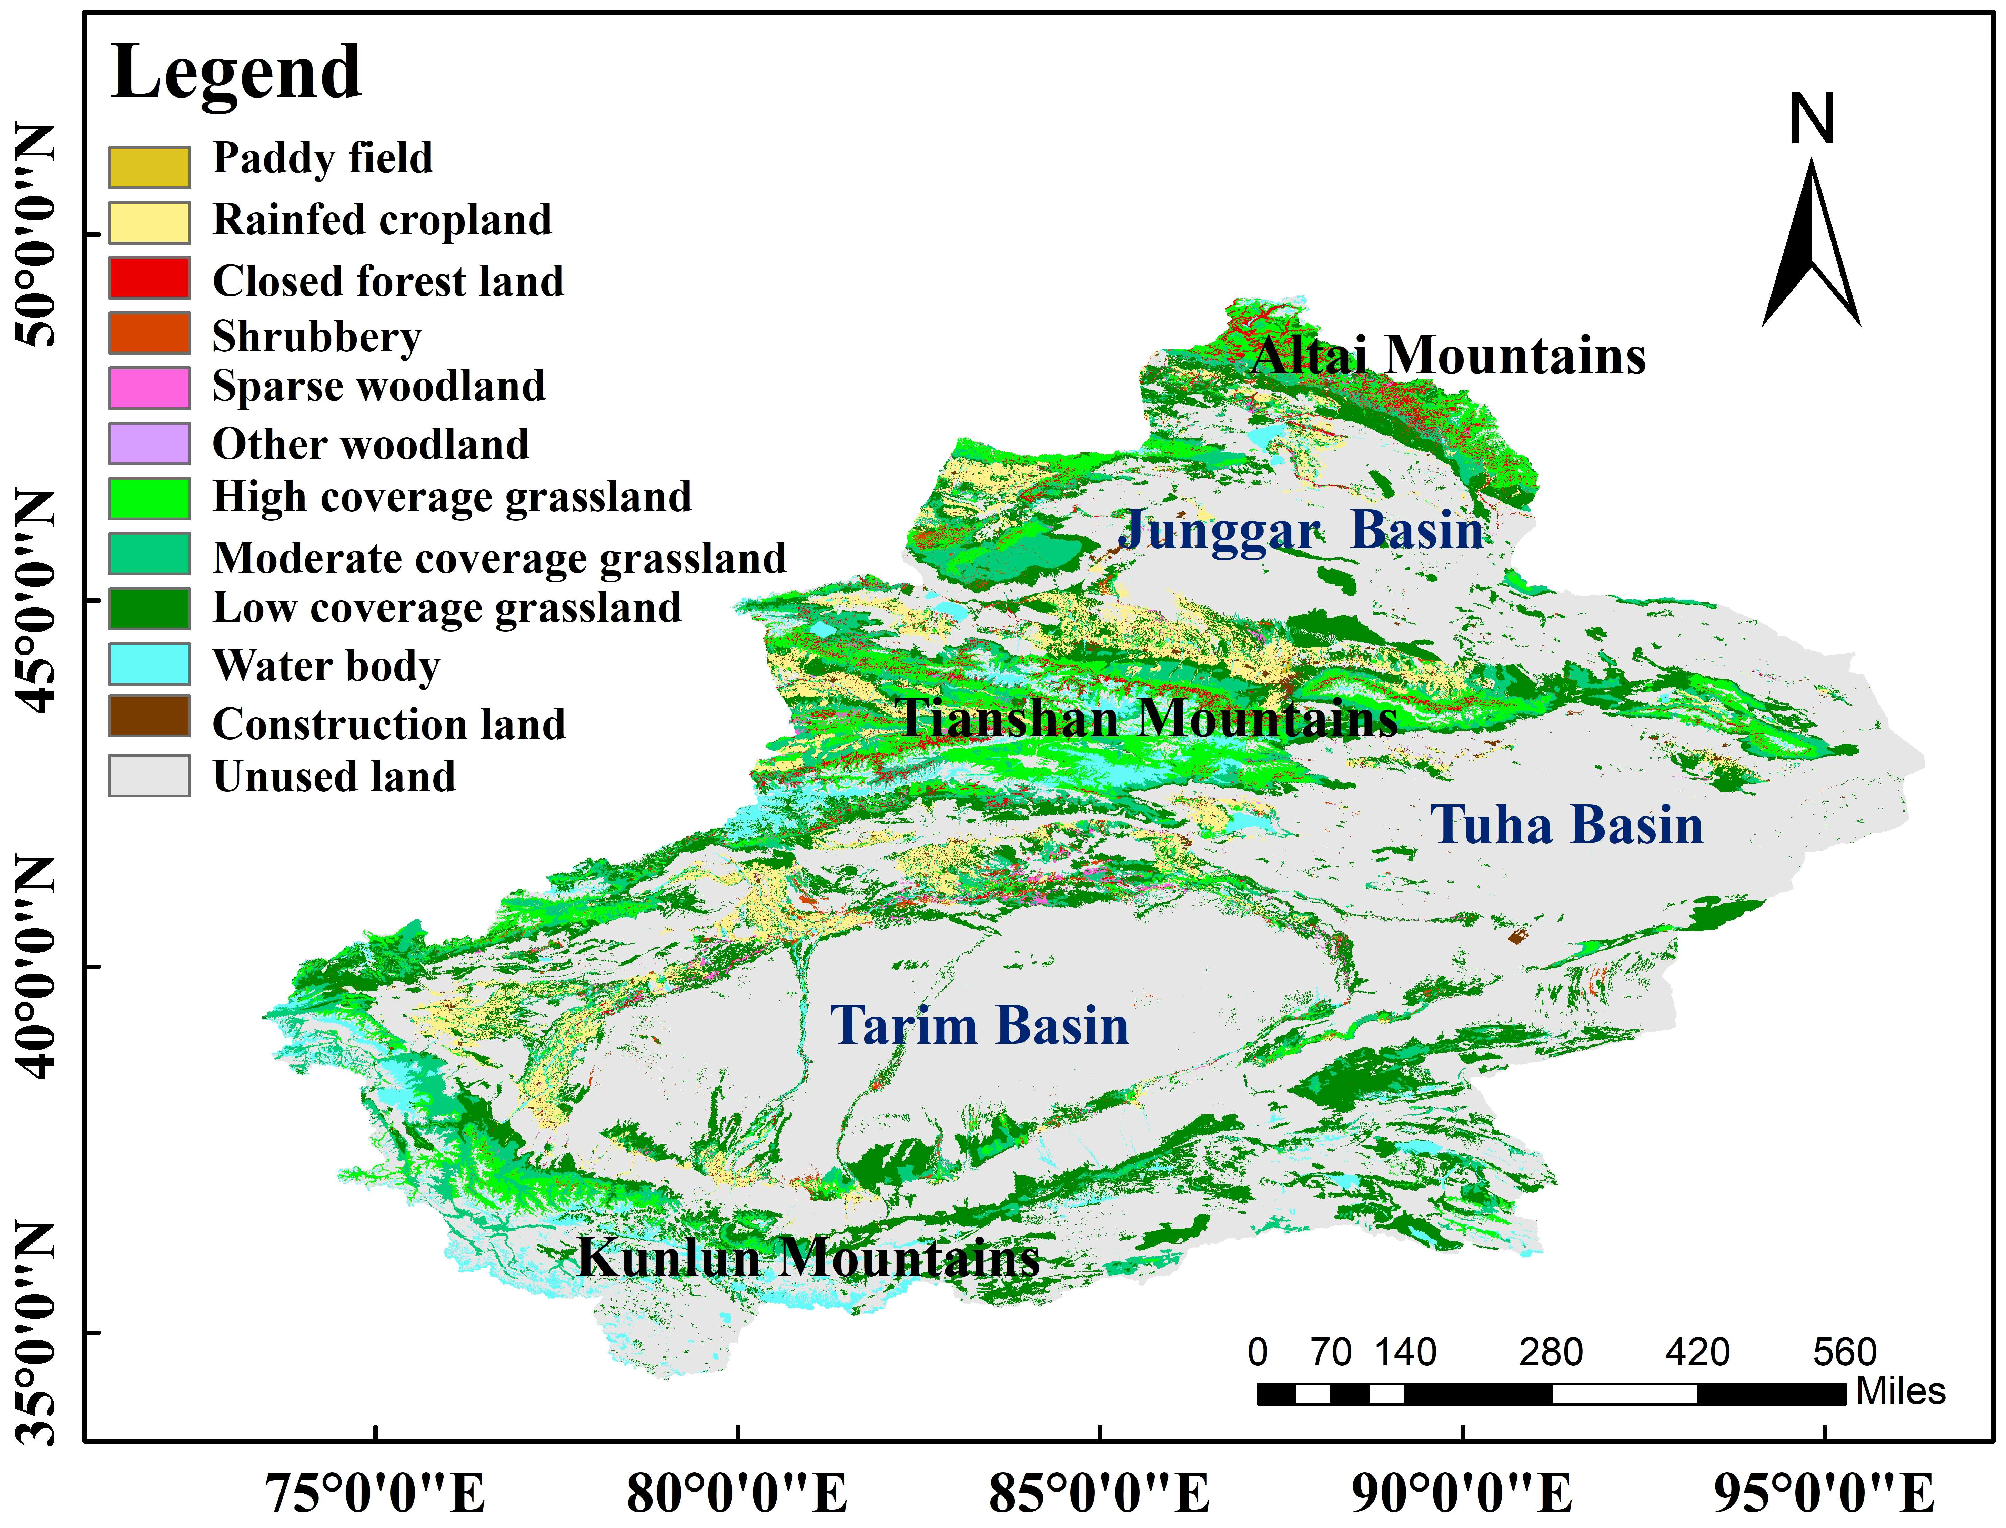
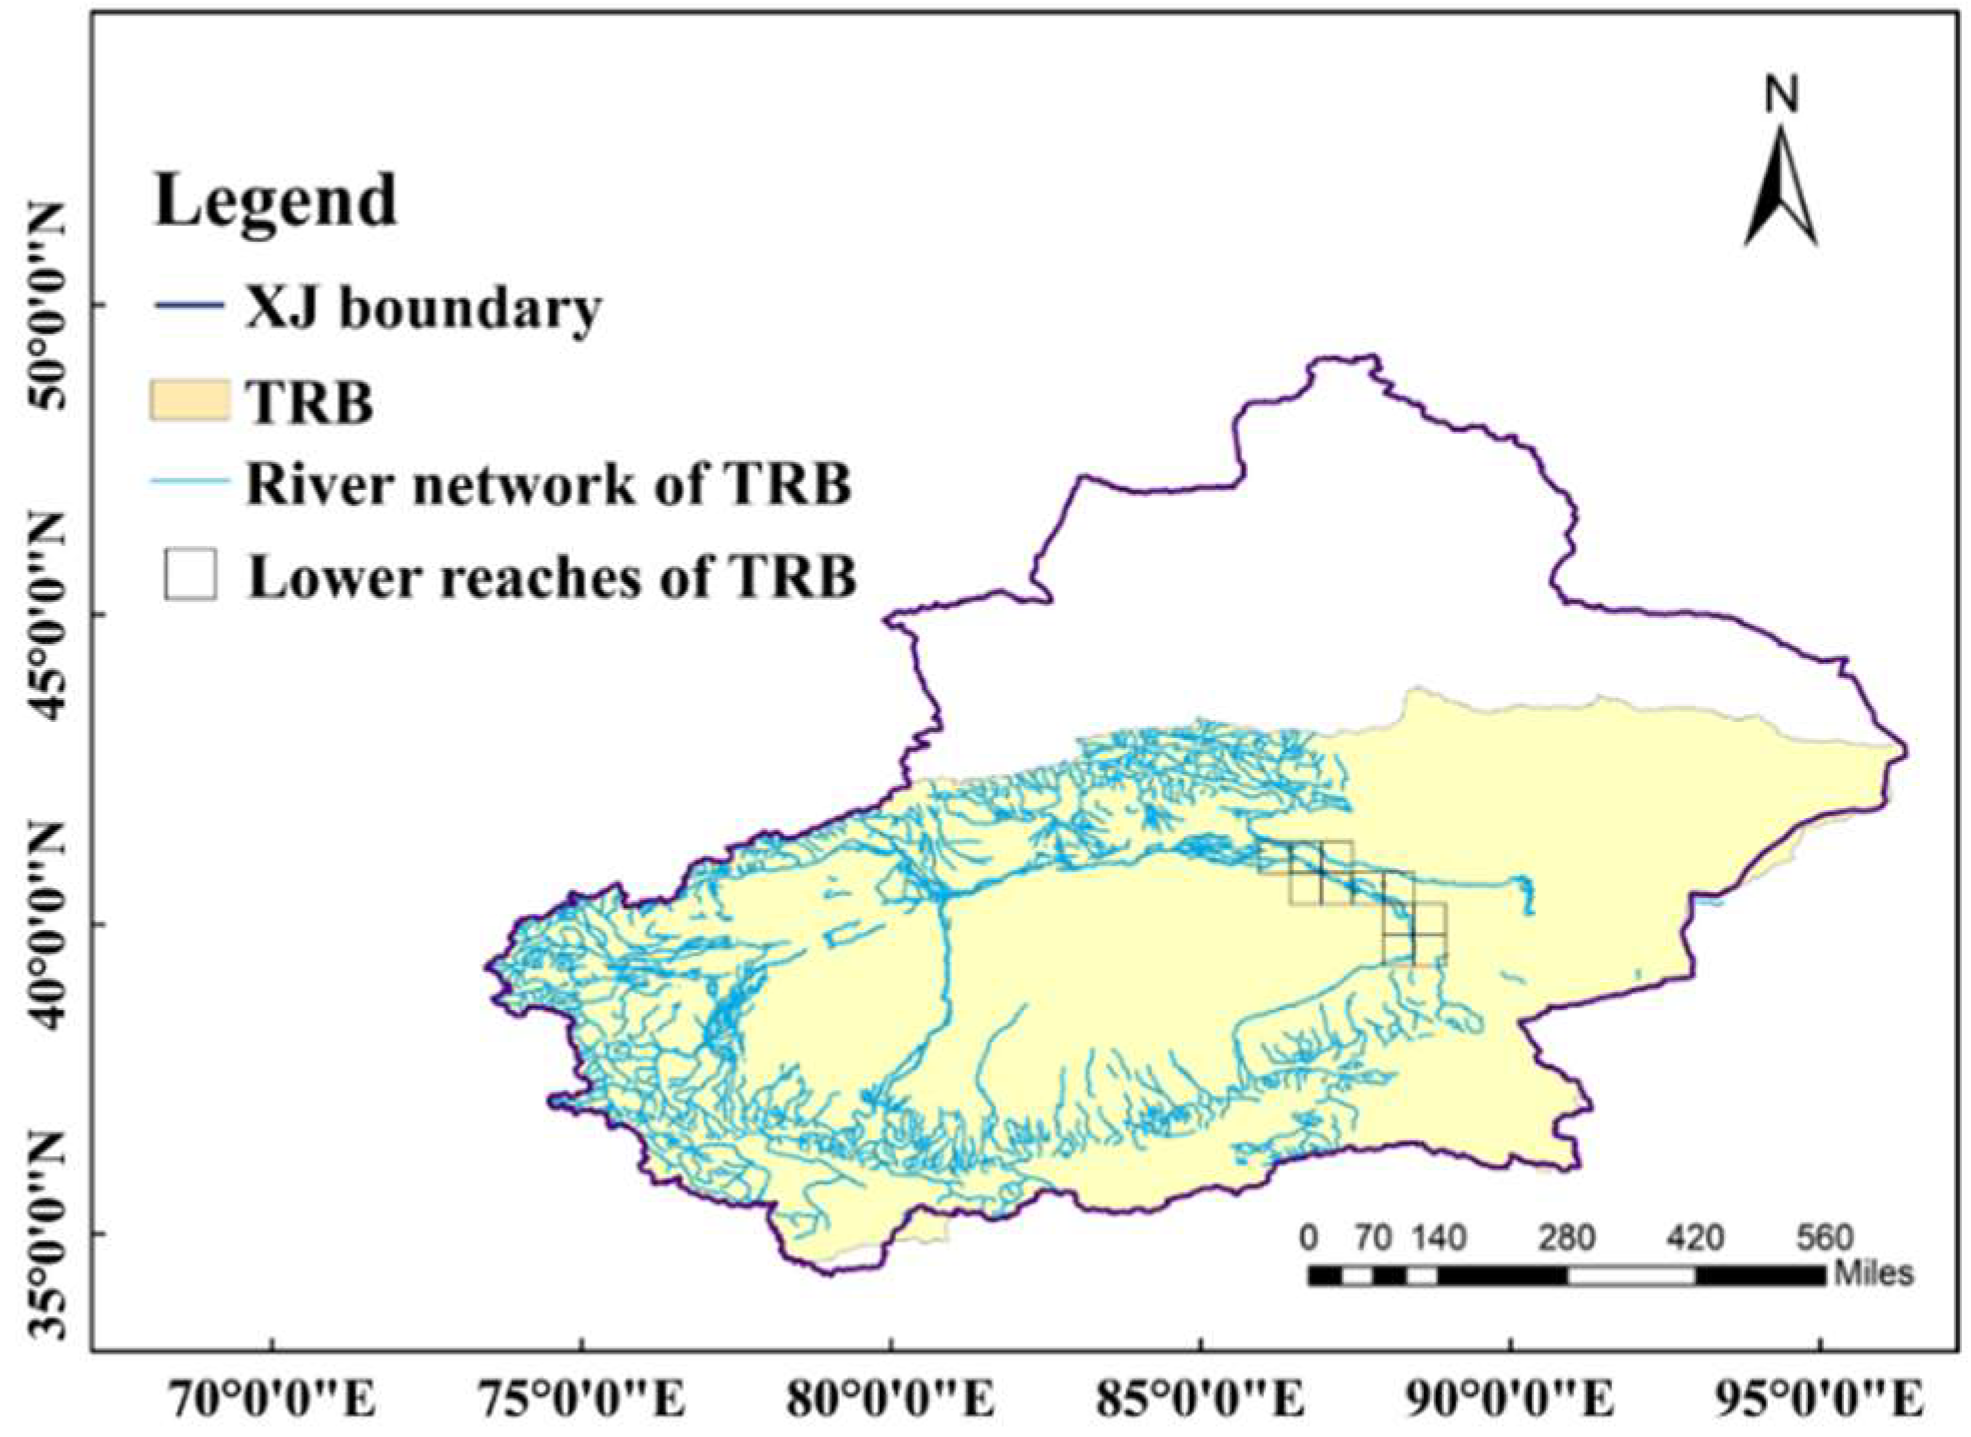
2.1. Study Area and Data

The research area is the Xinjiang Uygur Autonomous Region of China (Xinjiang), which is in northwestern China (34°25′−48°10′N, 73°40′−96°18′E) (Figure 1). Xinjiang covers an area of 1.66 million km2 [52]. The Tianshan Mountains are located in the central part of Xinjiang and are an important geographical dividing line of Xinjiang. Junggar Basin is in the north and Tarim Basin is in the south [53]. Xinjiang is located inland and its climate is controlled by a westerly circulation. The ecological environment of Xinjiang is extremely fragile due to its special geographical location, topography, and climate. Plants in Xinjiang are characterized by few species, low coverage, and simple type structure.
This study used 1982–2015 monthly NDVI data (https://nex.nasa.gov/nex/projects/1349/ (accessed on 1 December 2021)), with a spatial resolution of 1/12° [54,55]. Several studies have demonstrated that the dataset is of good quality [47]. We chose March–November as the vegetation study period: spring (March to May), summer (June to August) and autumn (September to November). Taking spring as an example to explain, the NDVI series is the average of March, April and May of each year, for a total of 34 years of spring NDVI data. Monthly precipitation data in this study were obtained from the National Meteorological Information Center of China, with a spatial resolution of 0.5°. The precipitation data were used to calculate SPI. The SPEI data (SPEI base v.2.5) were obtained from the Global SPEI database. The Global SPEI Database provides reliable information on drought conditions at the global scale with a spatial resolution of 0.5°. The root zone soil moisture (RSM) data used in this study are from the Global Land Data Assimilation System (GLDAS). GLDAS combines satellite and ground meteorological observation data [56,57,58]. And several studies have showed that the simulated soil moisture from GLDAS have good correlation and consistency with ground-based soil moisture [59]. In this study, all data products were resampled to 0.5° to make them consistent for our analysis. The spatial distribution data of land use types were obtained from the Resource and Environment Science and Data Center. The DEM elevation data comes from the Geospatial Data Cloud. The dataset was processed by SRTM3 V4.1 data. Near-surface temperature (TMP) at 0.5° resolution is retrieved from the University of East Anglia Climate Research Unit. Actual evaporation data were available from https://www.gleam.eu/ (accessed on 10 December 2021). The data of effective irrigated area in Xinjiang were from the China Economic and Social Big Data Research Platform.

2.2. Methods

2.2.1. SPI, SPEI and SSMI

Standardized precipitation index (SPI) is proposed by Mckee et al. [60] to consider the probability of precipitation occurrence in a certain period. SPI can describe the characteristics of drought at different time scales. Long-term precipitation usually follows a probability distribution [60]. We converted the distribution to a standard normal distribution. Drought index is time-series data [60,61]. Four drought categories were set in this study: light drought ( 1 S P I < 0.5 ), moderate drought ( 1.5 S P I < 1 ), severe drought ( 2 S P I < 1.5 ) and extreme drought ( S P I 2 ) [50]. The standardized soil moisture index (SSMI) was calculated and graded using the same calculation principle as the SPI. The Standardized Precipitation-Evapotranspiration Index (SPEI) is a drought index that combines precipitation and temperature data [45]. The evapotranspiration calculation of SPEIbase is based on the FAO-56 Penman–Monteith method.

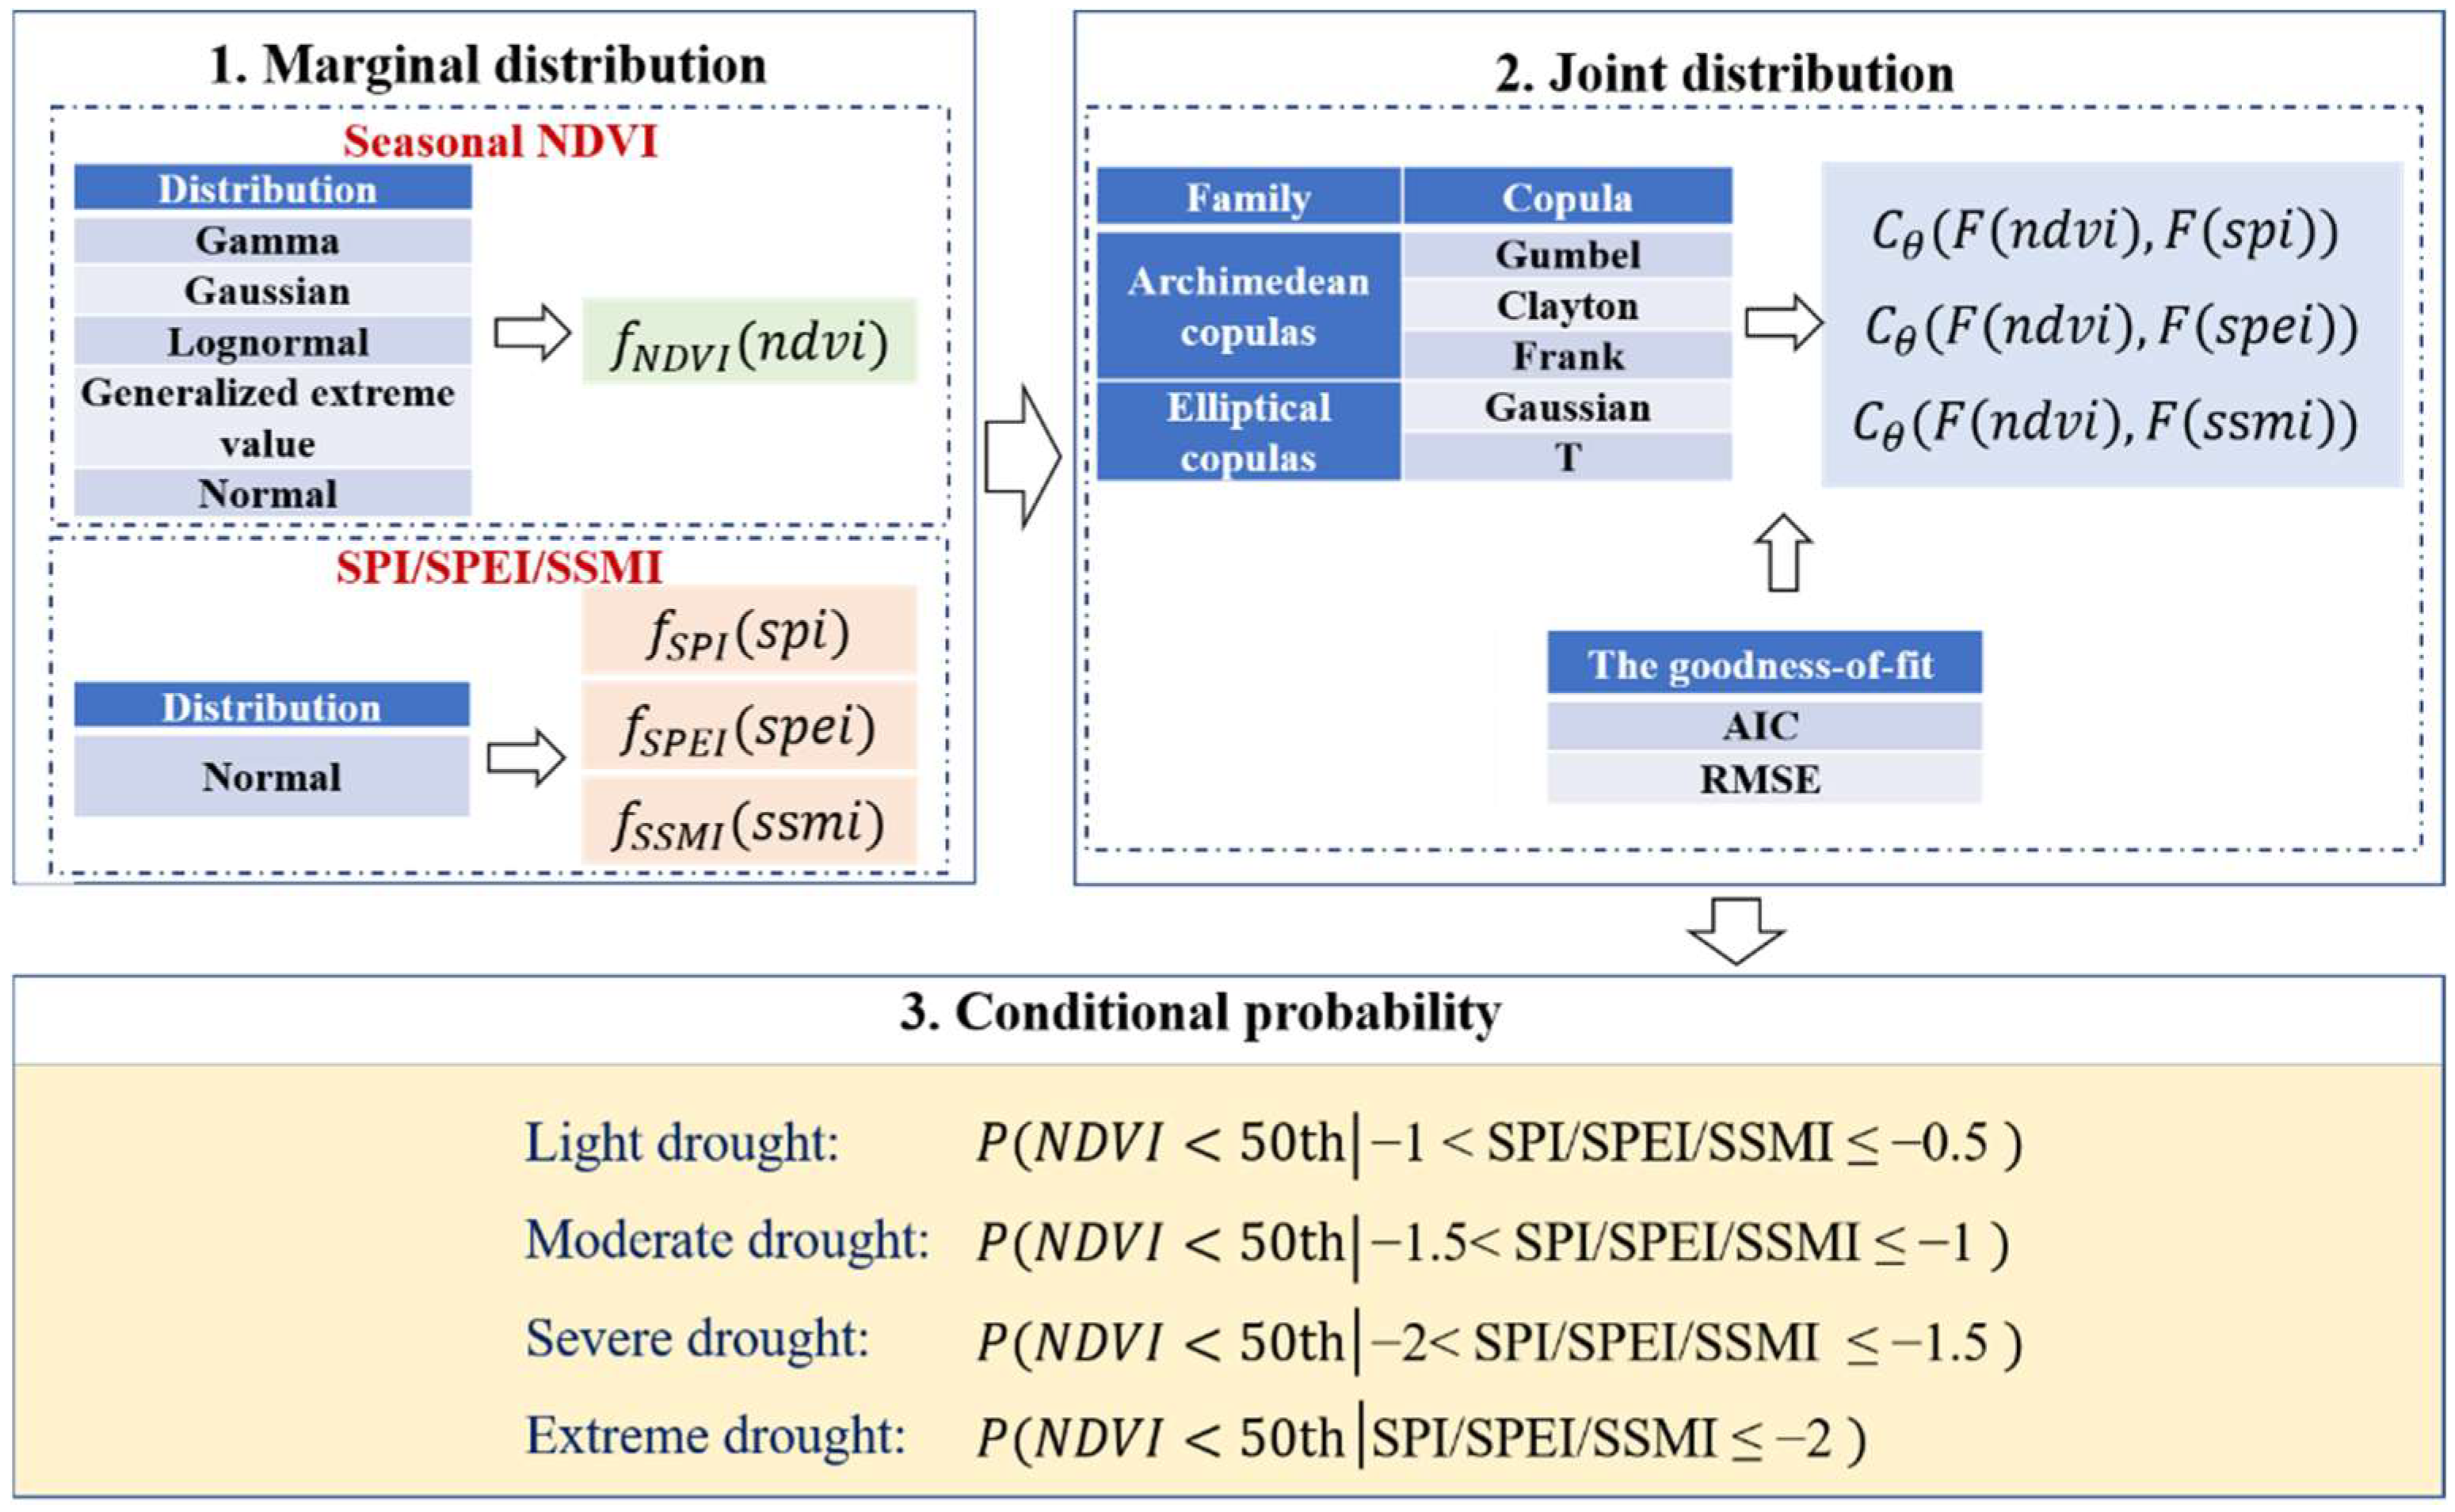
2.2.2. Copula-Based Probabilistic Evaluation Framework

Firstly, five univariate frequency analysis models were used to fit the marginal distribution of NDVI, and to select the model with the best. Normal distribution, gamma distribution, lognormal distribution, Gaussian distribution and generalized extreme value distribution were selected to fit the NDVI series in this study [62]. Normal distribution was used to fit the SPI, SSMI and SPEI.
After fitting the marginal distributions of the two series, the copula that could describe the correlation between variables was selected by the goodness-of-fit tests. The goodness-of-fit tests used in this study are Akaike’s information criterion (AIC) test and root mean square error (RMSE) method [63]. The most common types of copula functions used in hydrologic frequency analysis are elliptical copula and Archimedean copula. It should be noted that Gumbel and Clayton copula cannot be used when two series are negatively correlated.
M and N are assumed to be two random variables [64]:
F ( m , n ) = C θ ( F ( m ) , F ( n ) ) = C θ ( u , v )
where C is the joint copula function, and u and v are the edge distributions of random variables M and N, respectively.
P ( M < m | N n ) = C ( u , v ) v
P ( M < m | n 1 < N n 2 ) = C ( u , v 2 ) C ( u , v 1 ) v 2 v 1
In this study, the joint distribution of NDVI and SPI/SPEI/SSMI was constructed by using the two-dimensional copula function. The loss probability of NDVI below the 50th percentile was calculated respectively for the four drought categories (Figure 2).

2.2.3. Trend Analysis Method

The Mann–Kendall trend method is a continuous non-parametric method with specific calculation formulas referring to the literature [65,66]. When the statistical value |Z| ≥ 1.96, it means that the significance test at the 95% confidence level is passed.

2.2.4. Random Forest Method

The random forest method is a nonparametric statistical method proposed by Breiman [67]. Random forest is a classification regression tree algorithm. The decision tree is a binary classification tree, and two subsets are generated after each segmentation, which is a top-down recursive binary splitting algorithm. In this study, random forest method was used to model the sample set and rank the importance of influencing factors. When the response variables were continuous data, the percentage of increased mean-squared error (%IncMSE) was selected as the indicator. The larger the value of variable %IncMSE is, the more important the variable is and the more relevant it is to the response variable [68].

3. Results

3.1. Spatial Distribution of NDVI in Xinjiang

NDVI in winter was less than 0.1 in most areas of Xinjiang. Winter in Xinjiang is cold and vegetation is sparse. The spatial distribution of NDVI in spring, summer, and autumn was less in the southeast and more in the northwest. The spatial distribution of NDVI was heterogeneous. In summer, NDVI is larger in the Tianshan Mountains, the Ili River Valley, and the Altai Mountains.
The spatial correlations between drought indexes and NDVI were analyzed, and the results are shown in Figure 3. The time scales of the drought indexes were three months. The drought indexes of May, August, and November were considered as the drought indexes of spring, summer, and autumn respectively [69]. The positive correlation between NDVI and SPI/SPEI/SSMI was generally strong in summer. The positive correlation between NDVI and SSMI in autumn was stronger than that of NDVI and SPI/SPEI. In spring, NDVI was negatively correlated with SPI/SPEI/SSMI in many areas.
Xinjiang has special topographic conditions, with few plant species, low vegetation coverage and much unused land such as desert. The NDVI of unused land area is very small, so the results of analyzing the relationship between NDVI and drought in the whole Xinjiang region are prone to large errors.
Desert and other unused land have the largest area, accounting for 60.83% of Xinjiang (Table 1). The vegetation in Xinjiang is mainly distributed in the mountains and the oases around Junggar and Tarim basins, of which the riverbanks are an important vegetation distribution area, forming a typical mountain-oasis-desert ecosystem. The main vegetation types in Xinjiang are cropland, forestland, and grassland, of which the grassland area is the largest, accounting for 80.3% of the total vegetation area. Cropland includes paddy field and dry land (Figure 4). However, the area of paddy fields is very small, accounting for only 0.03%. Cropland is mainly distributed in river delta areas, riverine alluvial plains and other areas where water can be easily diverted. These areas have deep, fertile soil and are suitable for growing a variety of crops. The spatial distribution of vegetation in Xinjiang is as follows: the vegetation coverage in the western part of northern Xinjiang is higher than that in the eastern part, and the vegetation coverage in the mountains is higher than that in the plains. The vegetation coverage in the western part of Southern Xinjiang is higher than that in the eastern part, and higher in the plains than in the mountains.
Therefore, in order to accurately analyze the relationship between vegetation and drought indexes in Xinjiang, this study only analyzed NDVI of cropland, forestland and grassland. Forestland is divided into closed forestland, shrubbery, sparse woodland. Grassland can be divided into high coverage grassland, moderate coverage grassland and low coverage grassland. Paddy field and other woodland were excluded from this study due to their low proportions. The NDVI values of different vegetation types differed most in summer. The NDVI values of the different vegetation types in summer are ranked as follows: closed forestland > high coverage grassland > cropland > sparse woodland > moderate coverage grassland > shrubbery > low coverage grassland. Closed forest land had the largest NDVI. NDVI of different vegetation types showed an increasing trend in different seasons. In spring, closed forest land and shrubbery showed significant upward trend. The NDVI of all vegetation types increased significantly in summer.

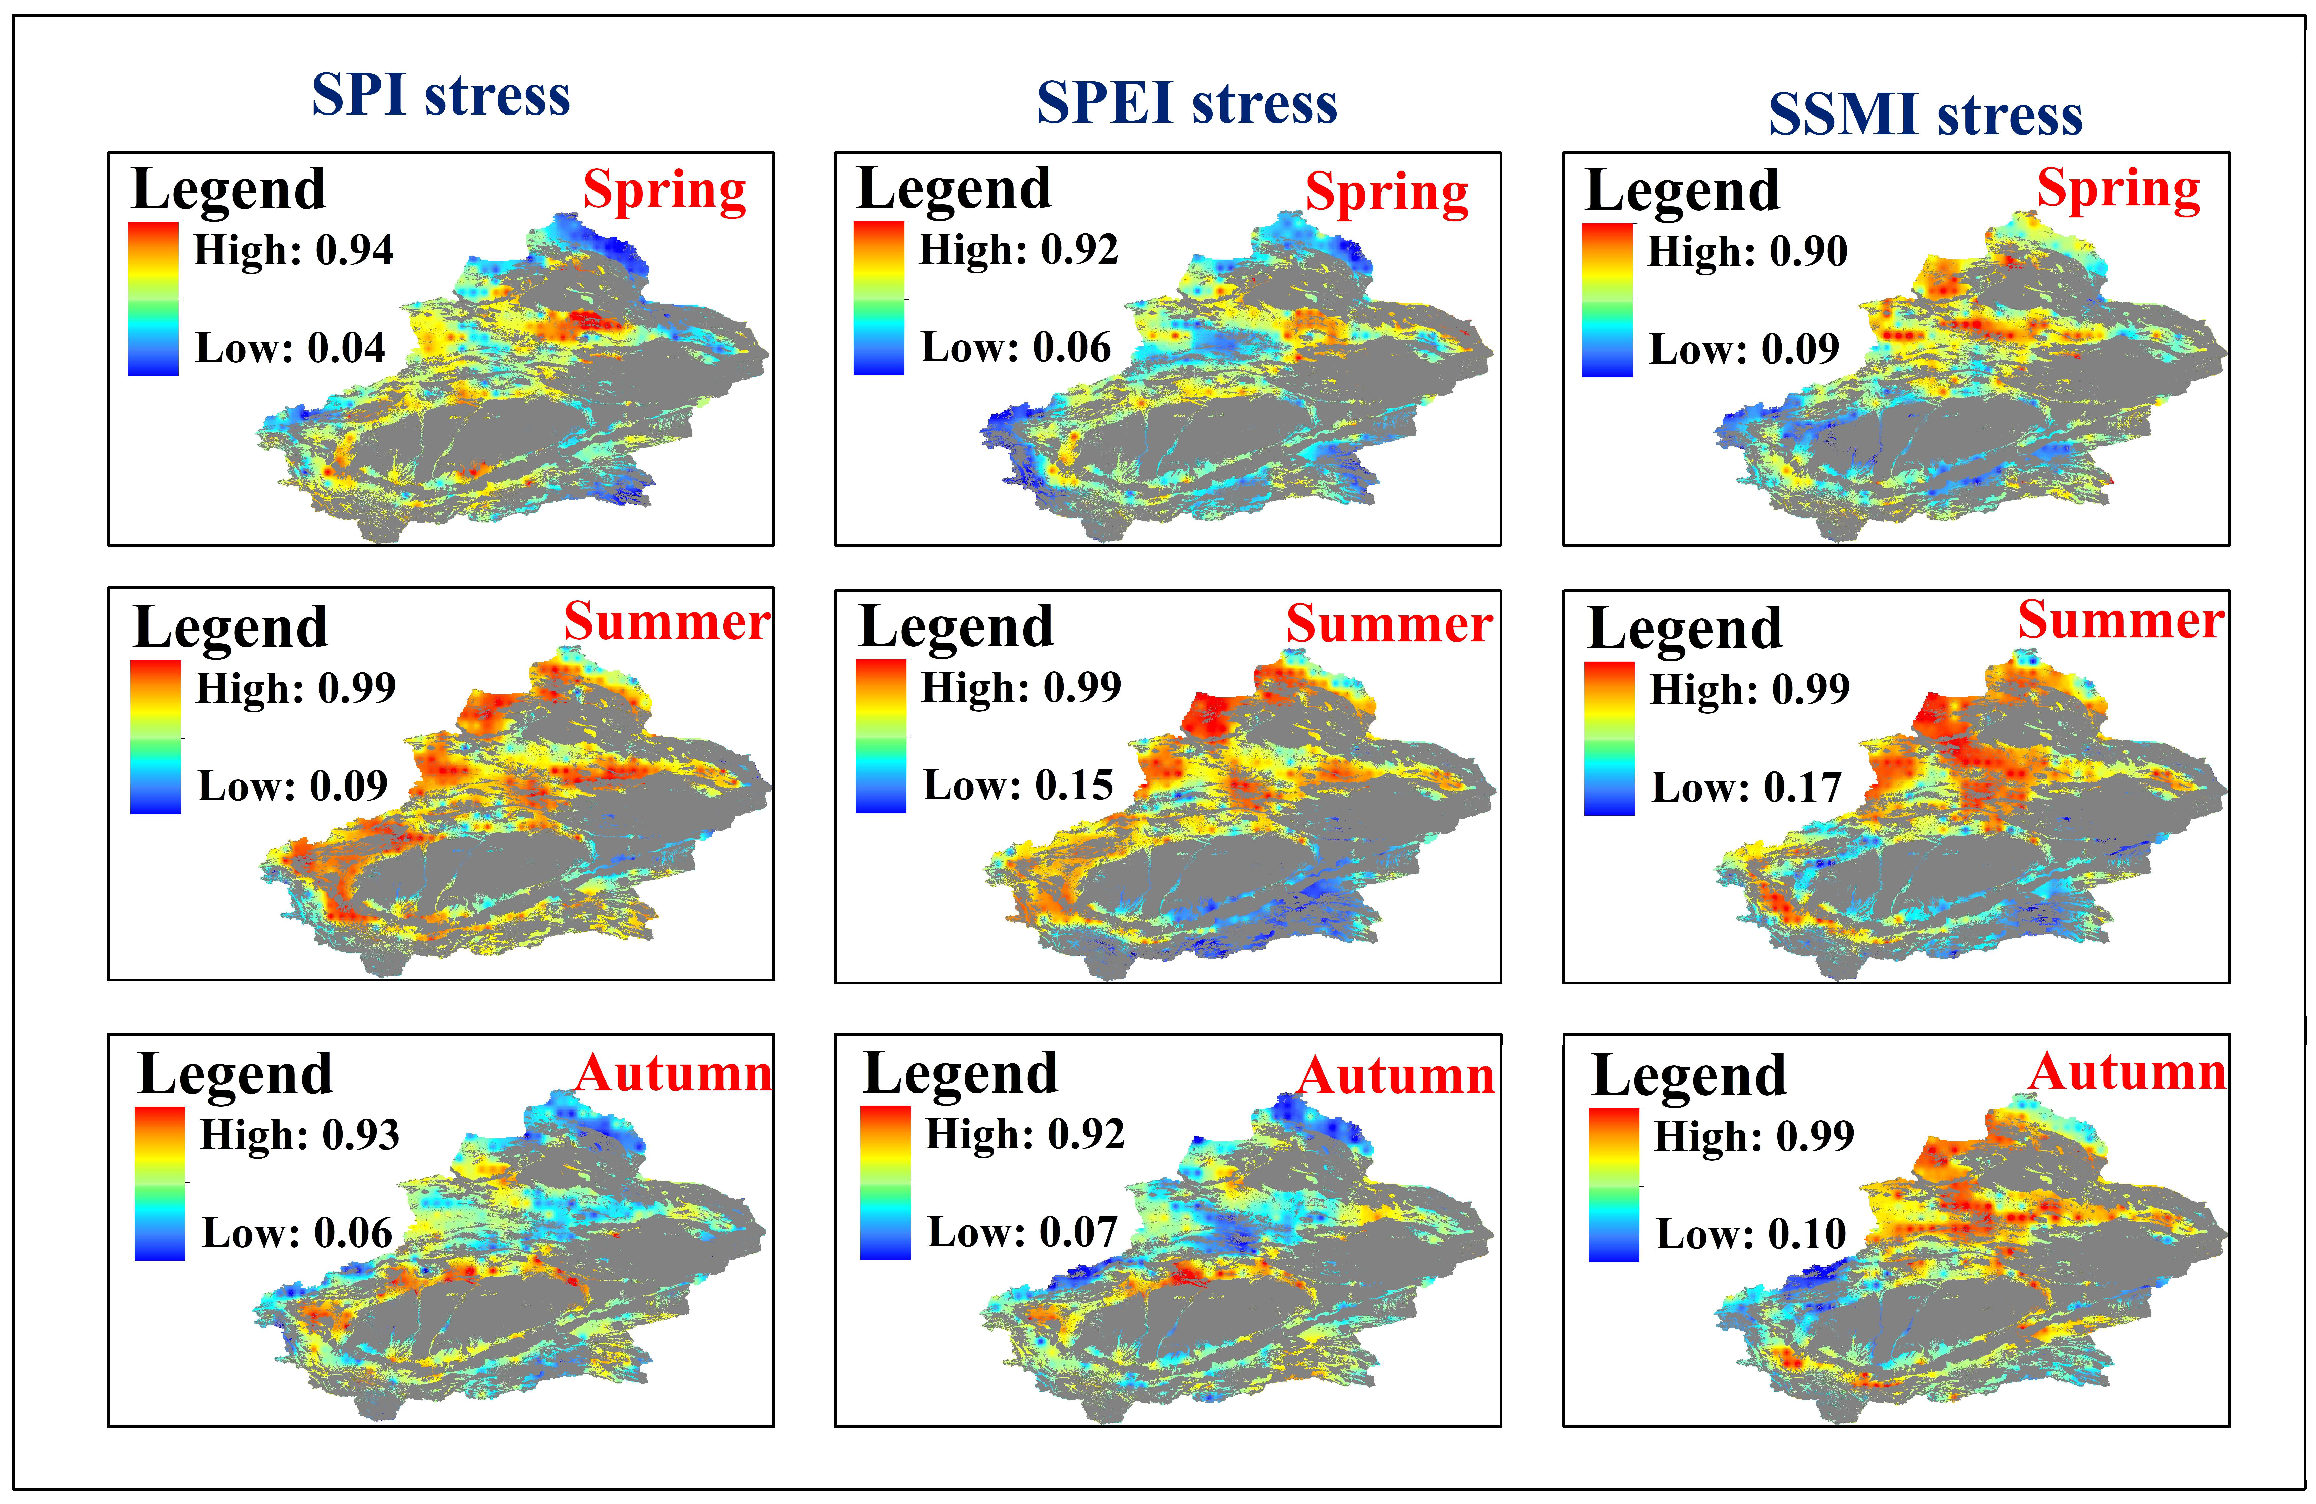
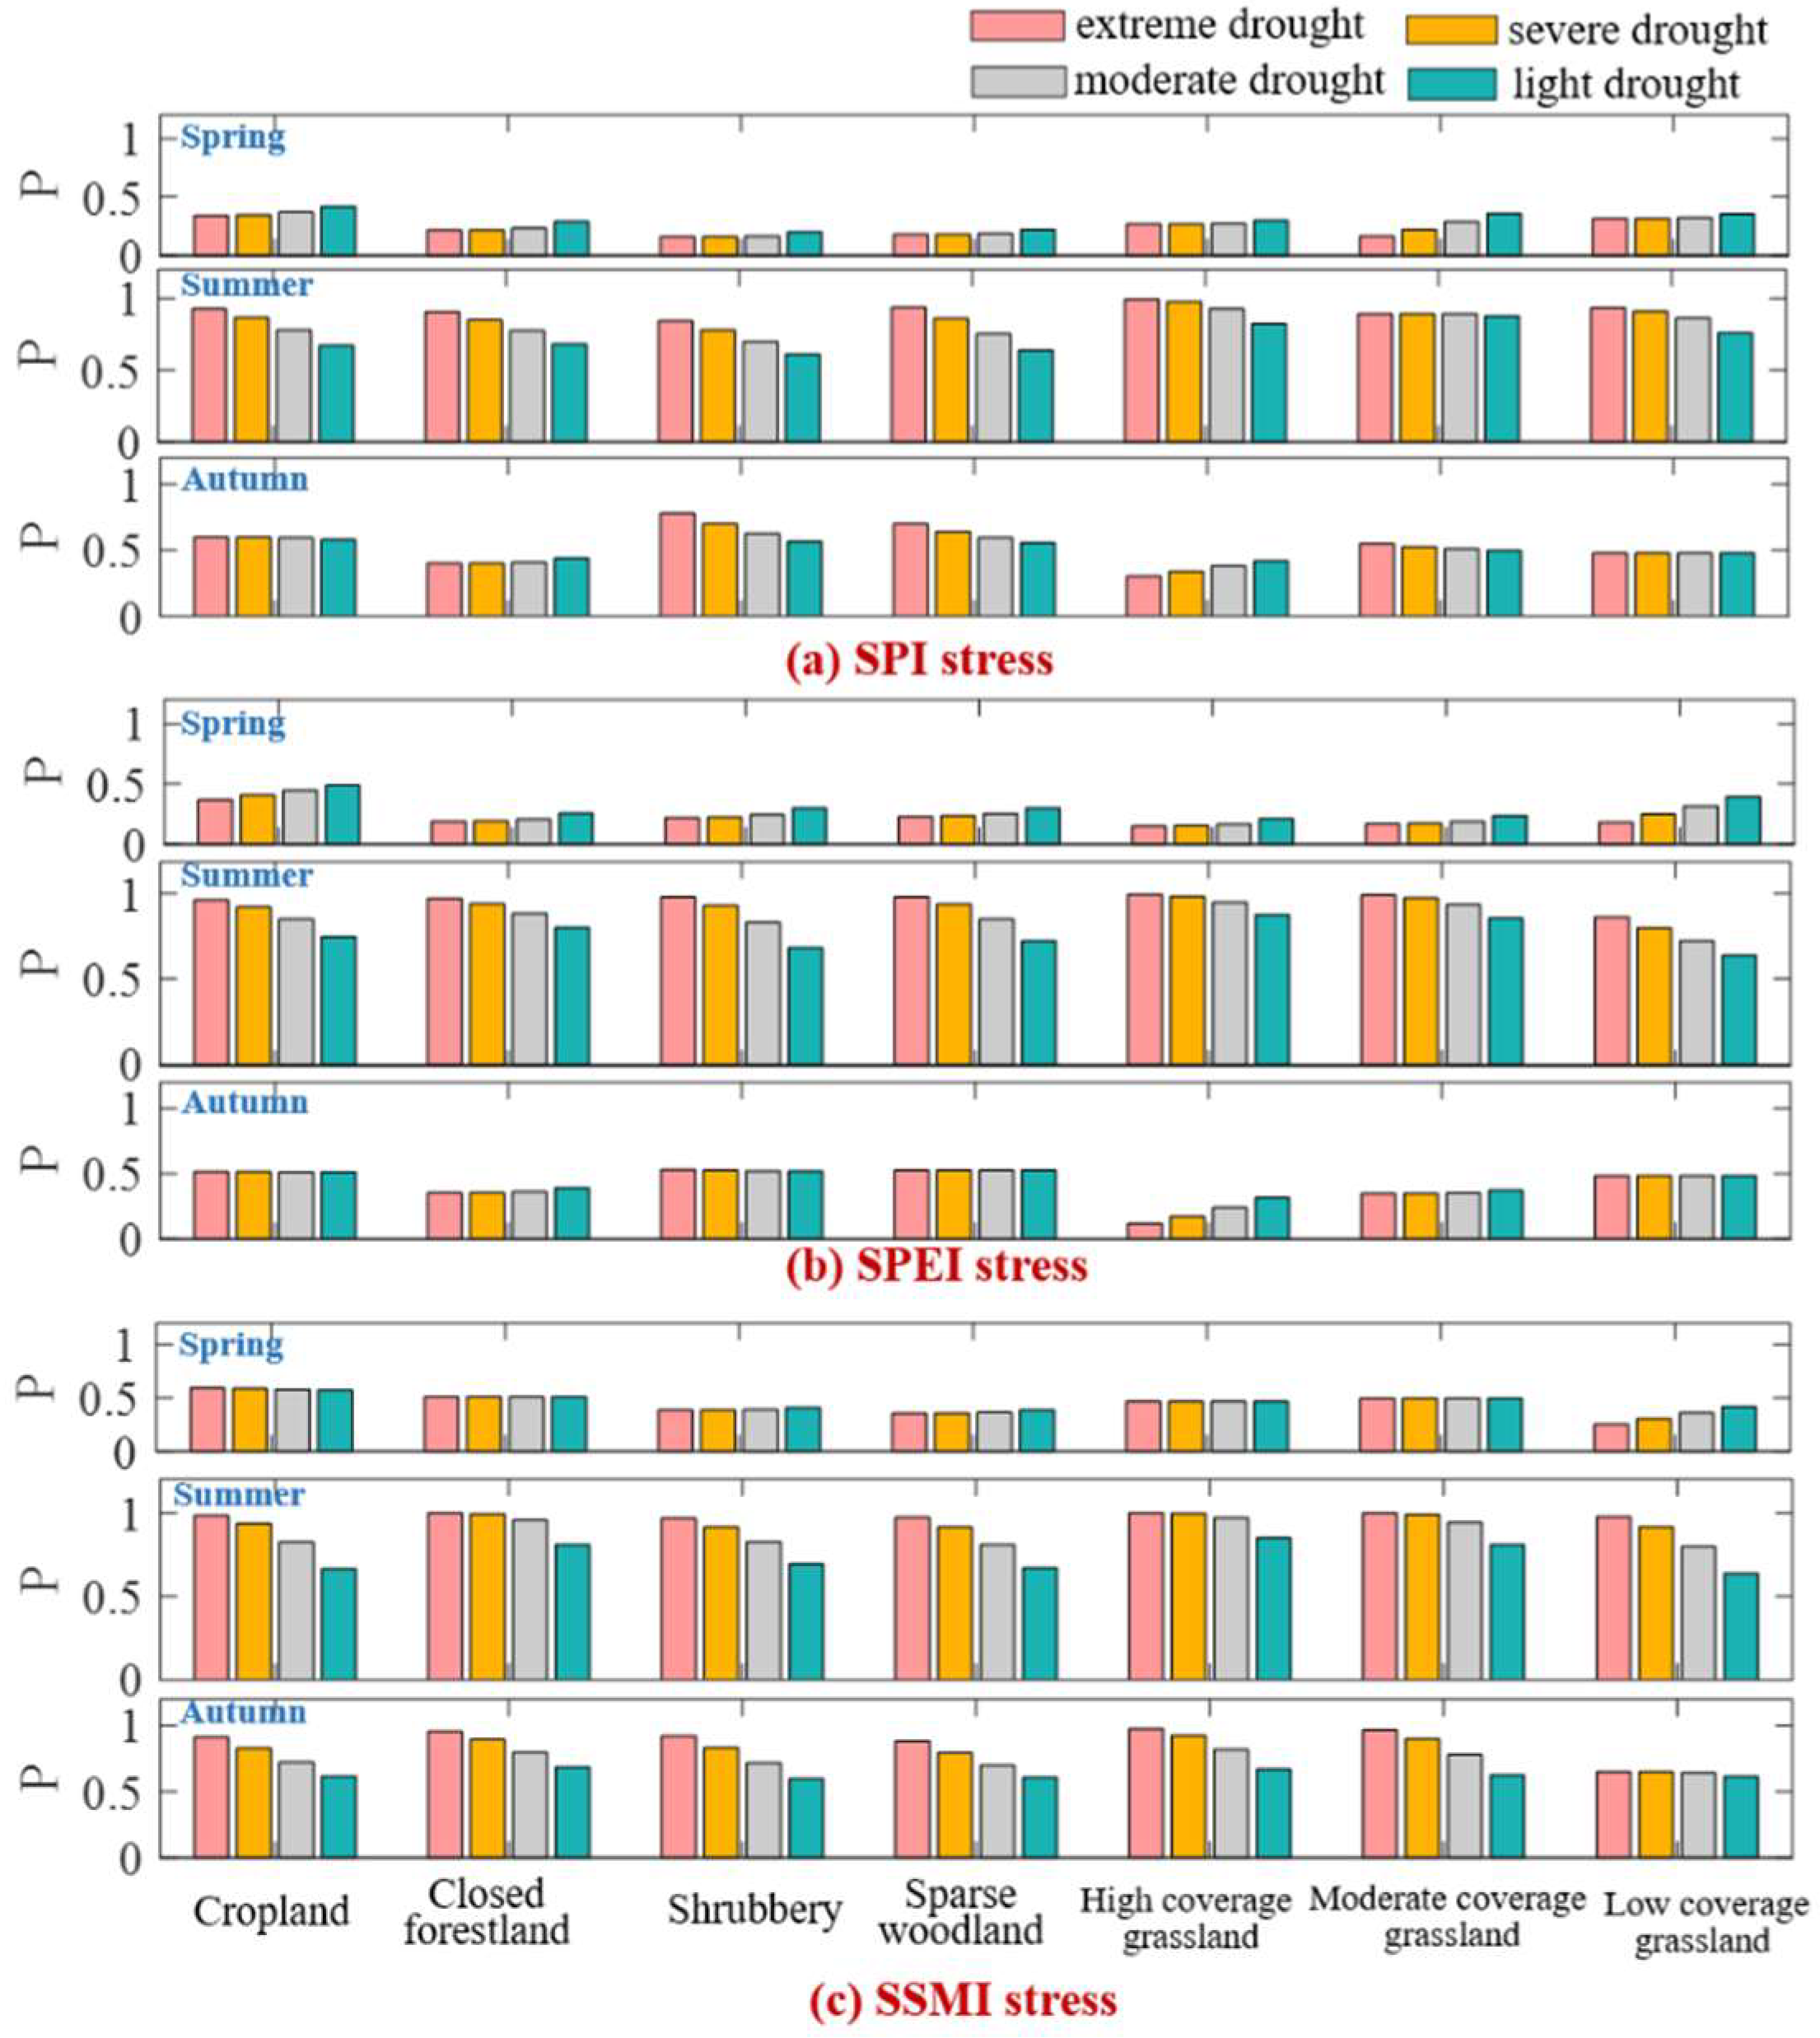
3.2. Analysis of NDVI Vulnerability under Various Drought Conditions of Different Vegetation Types

Copula was used to construct the joint conditional probability function of NDVI and SPI/SPEI/SSMI, and the conditional probability of NDVI vulnerability under different drought conditions was calculated. In this study, the conditional probability greater than 0.5 under drought stress indicated that the drought index stress had a stronger impact on vegetation.
Figure 5 shows the spatial distribution of the conditional probability of NDVI vulnerability under extreme drought. The spatial distribution of NDVI vulnerability under the other three drought conditions was similar to that under extreme drought. The conditional probability of NDVI vulnerability in summer was the highest among the three seasons. In spring and autumn, there were more areas of high NDVI vulnerability under SSMI stress than under SPI and SPEI stress, which were mainly distributed in Tianshan Mountains.
Figure 6 showed the conditional probability of NDVI vulnerability under various drought stress conditions of seven vegetation types. The conditional probability values of NDVI vulnerability under SPI/SPEI stress in spring were all less than 0.5, which implies that SPI/SPEI had little effect on NDVI of seven vegetation types in spring. Nevertheless, SPI/SPEI had an effect on NDVI of seven vegetation types in summer. In autumn, the conditional probability values of NDVI vulnerability under SPI stress were greater than those under SPEI stress. SPI/SPEI had an effect on NDVI of cropland, shrubbery, and sparse woodland in autumn, but had little effect on NDVI of high coverage grassland and closed forestland.
For SSMI stress, only the conditional probability values of NDVI vulnerability of cropland were greater than 0.5 in spring. In summer and autumn, SSMI had an effect on NDVI vulnerability of all seven vegetation types. The conditional probability values of NDVI vulnerability were the highest under D4 drought stress in summer.
In spring, the conditional probability values of cropland under various drought conditions of three drought indexes was the largest. In summer, the conditional probability values of high coverage grassland were the largest under the three drought stresses, especially SPI stress. Furthermore, the vulnerability response of grassland to SPI stress was higher than that of forestland and cropland during light drought and moderate drought in summer. In autumn, the conditional probability of high coverage grassland was the highest under SSMI stress, while it was the lowest under SPEI stress. It can be concluded that grassland is the most sensitive to water deficit among various vegetation types in Xinjiang in summer, and high coverage grassland was most sensitive to root zone soil moisture deficit in autumn. In spring, cropland was most sensitive to water and soil moisture deficit. The conditional probability values of NDVI vulnerability under the three drought indexes were compared to determine which drought index had the greatest stress on NDVI (Table 2).
M = max ( P ( NDVI < 50 t h | SPI ) , P ( NDVI < 50 t h | SPEI ) , P ( NDVI < 50 t h | SSMI ) )
NDVI vulnerability in spring and autumn was mainly influenced by SSMI. In summer, NDVI was affected by SSMI, SPI, and SPEI. This means that NDVI in summer was limited by water, heat, and soil moisture, while NDVI in spring and autumn was influenced by soil moisture.

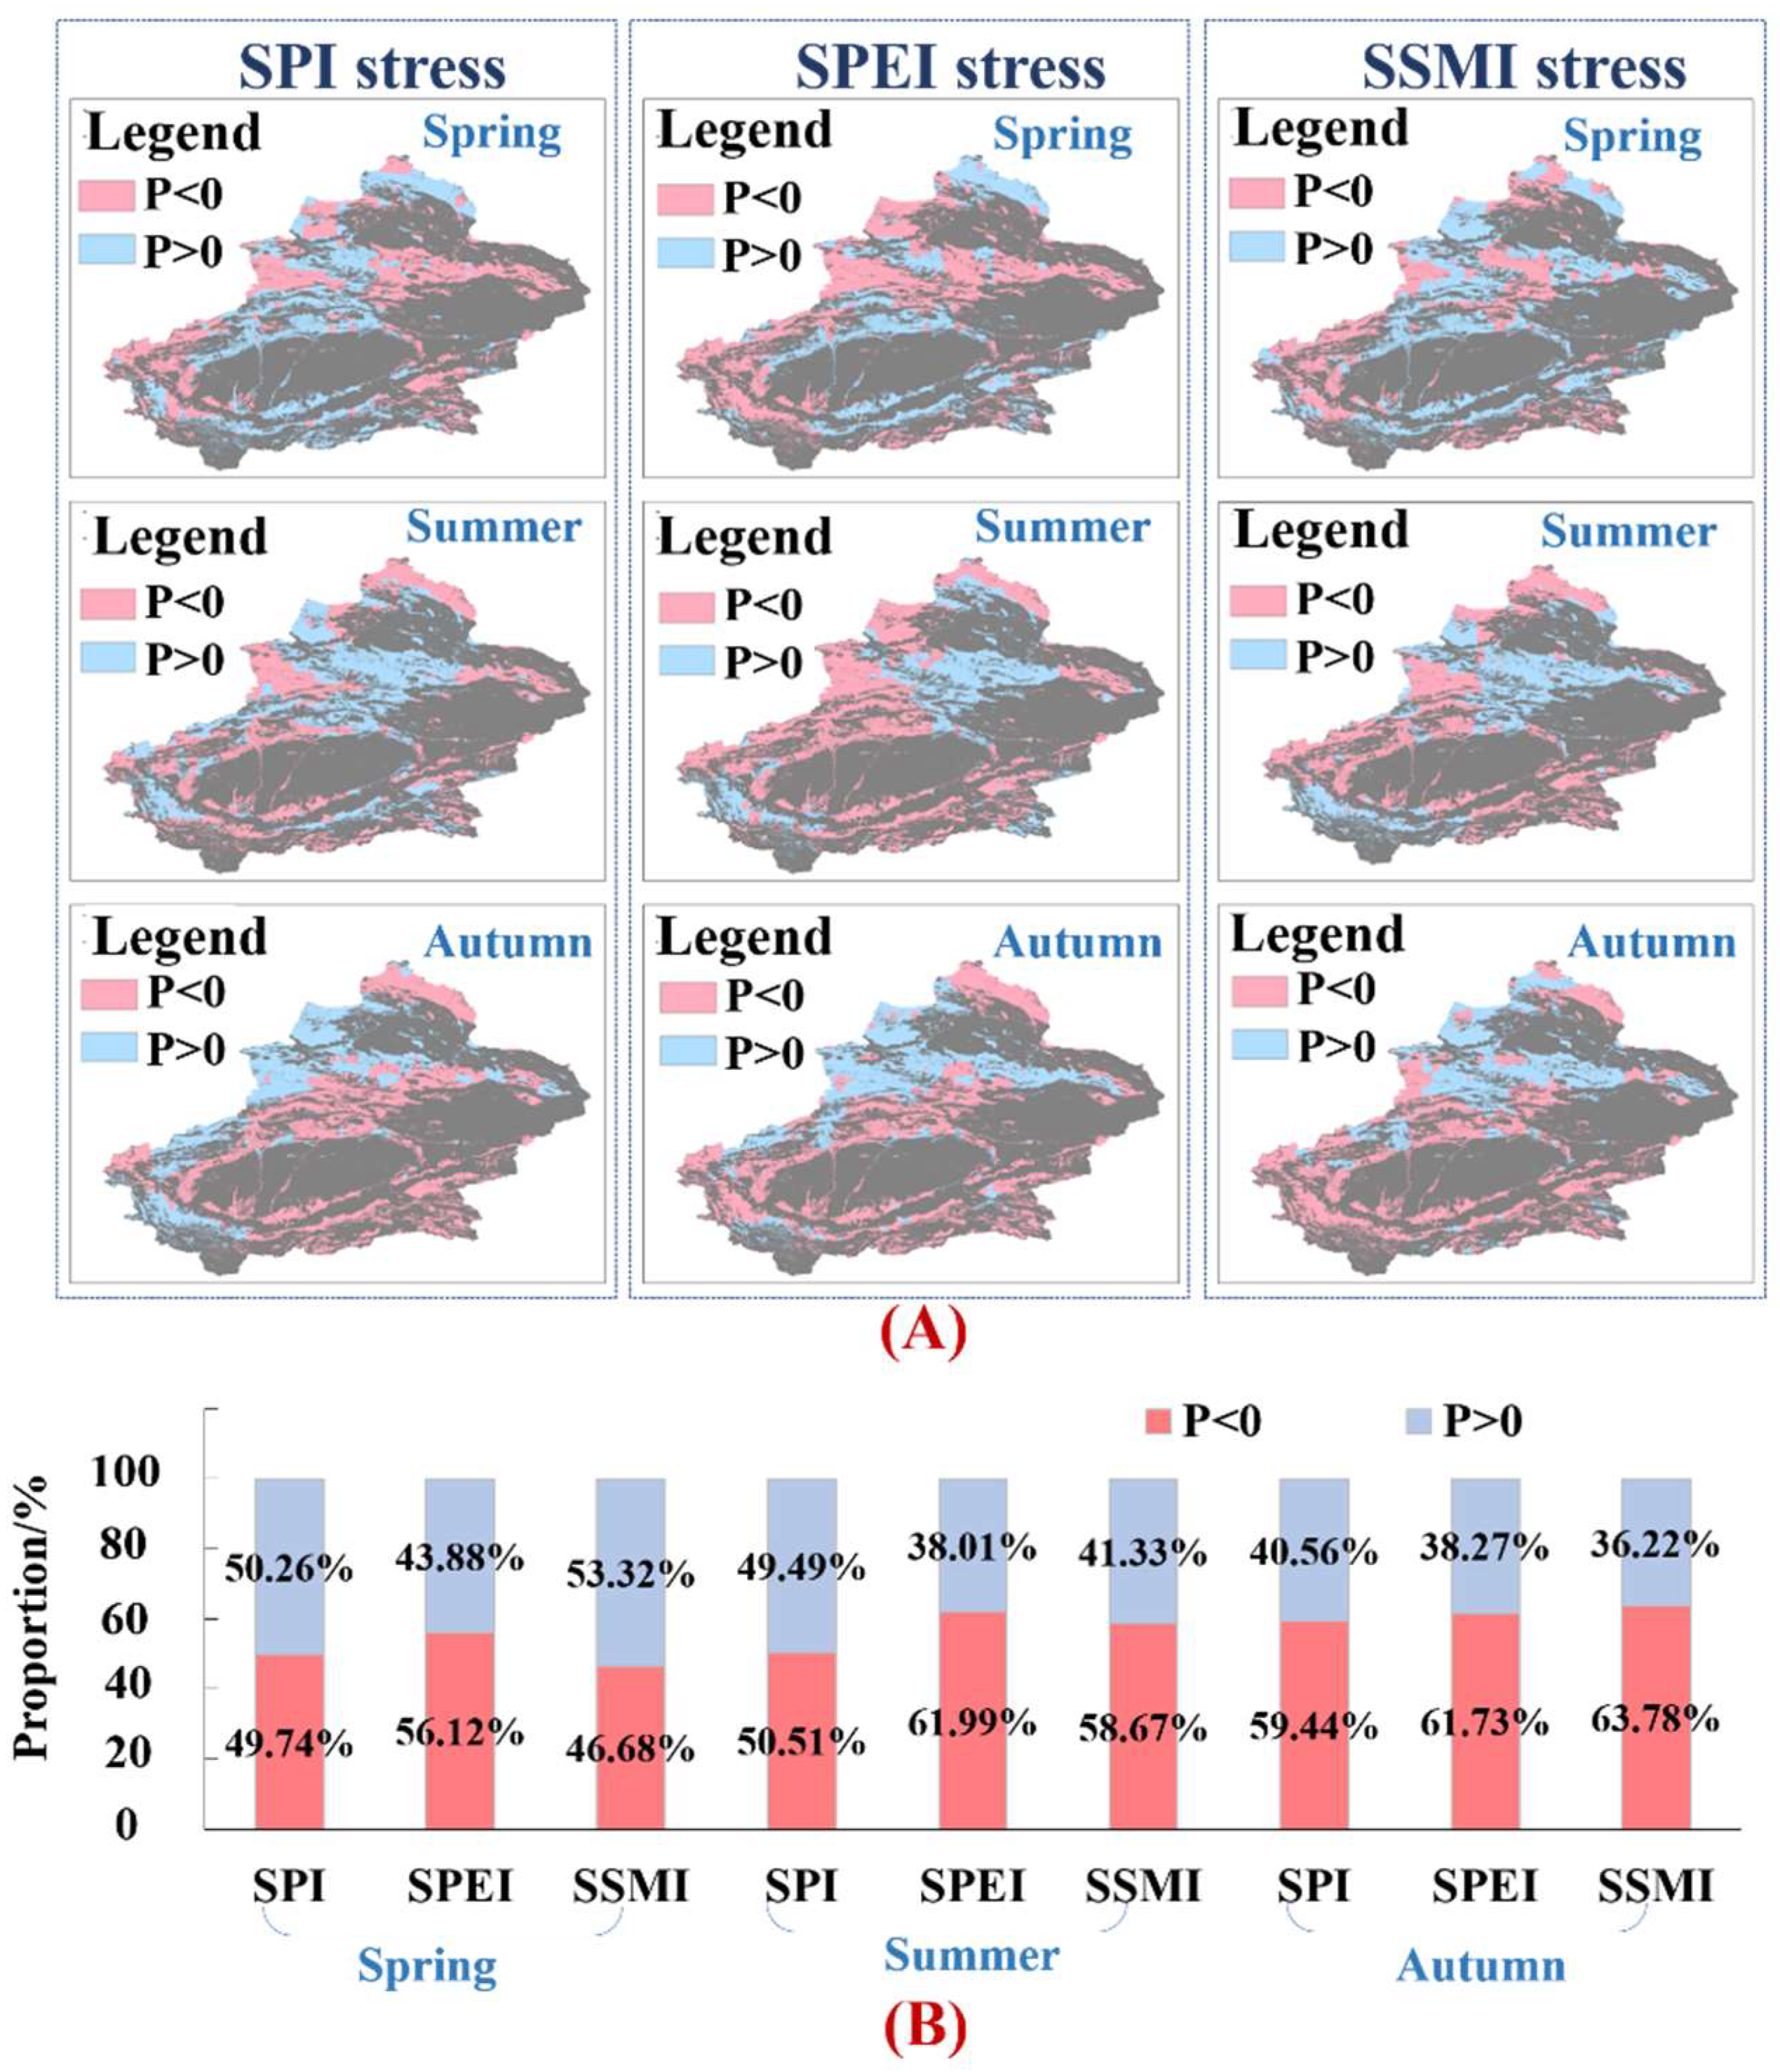
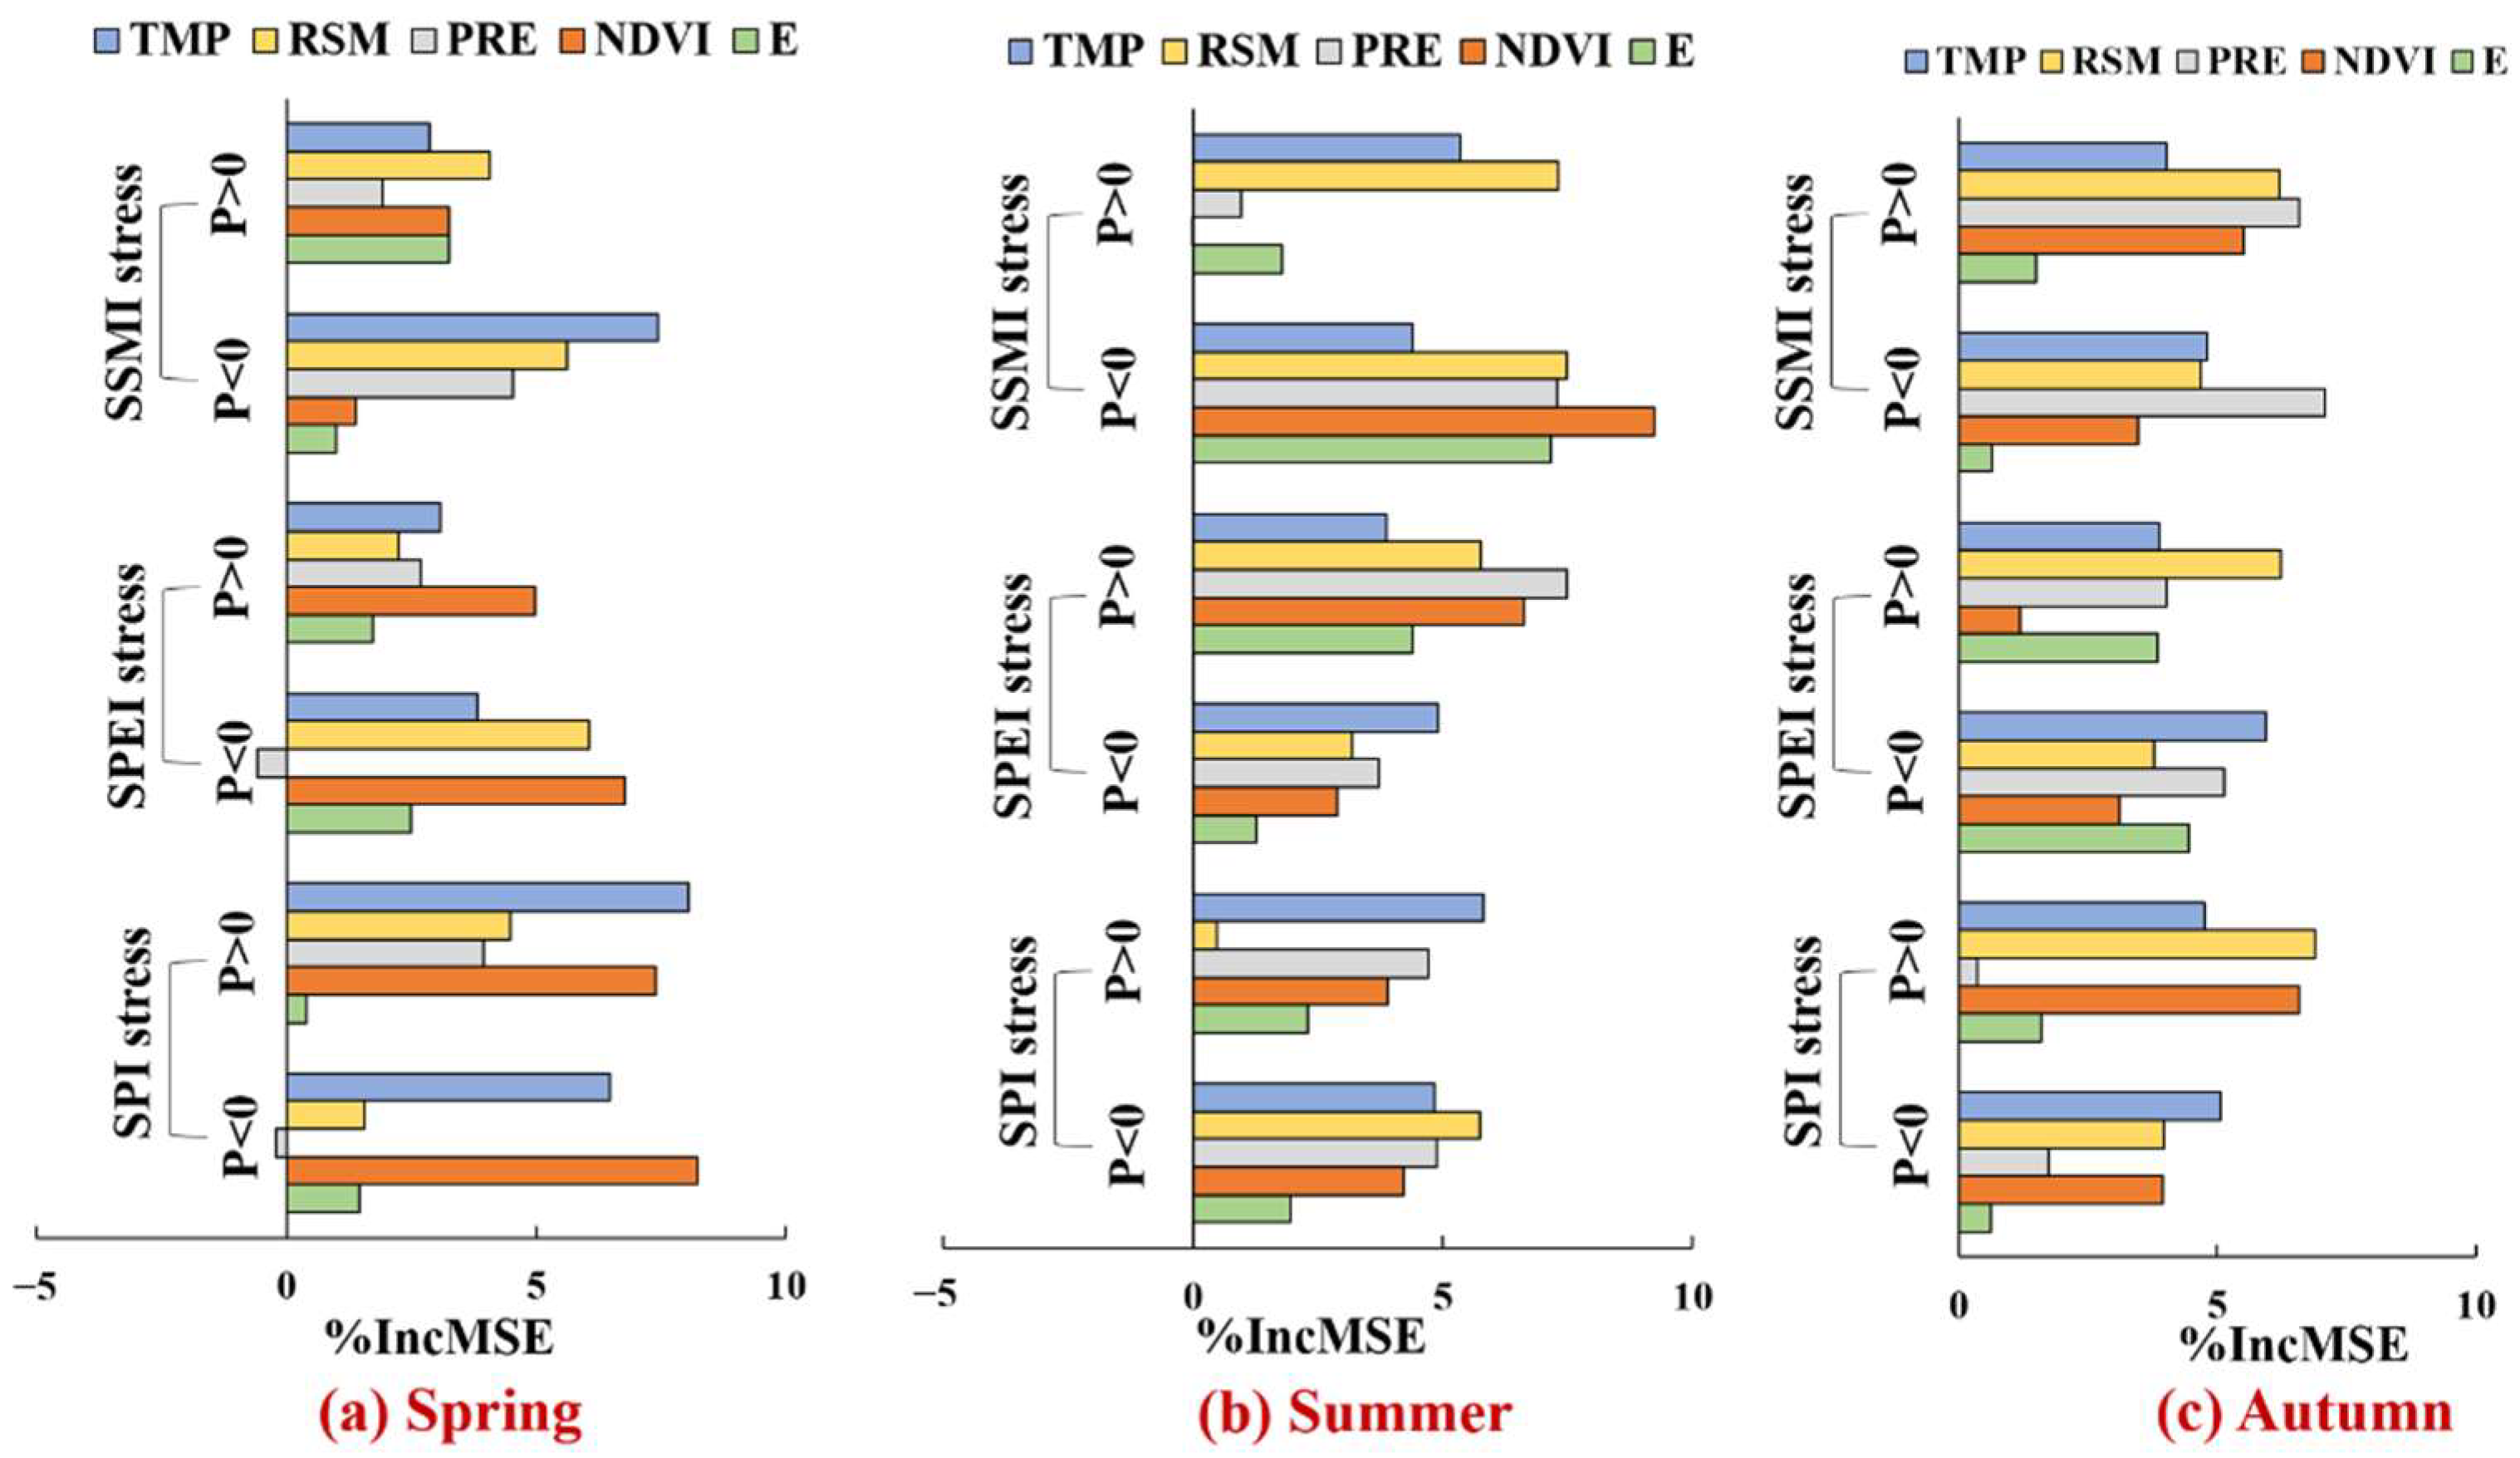
3.3. Analysis on the Change of Vegetation Vulnerability to Drought Stresses and Its Driving Force in Xinjiang

From 2000 to 2003, Xinjiang carried out five emergency ecological water transfers to the Tarim River. With the ecological water transfer projects, the vegetation communities in the lower reaches of the Tarim River Basin (TRB) have changed significantly with the improvement of the ecological environment [70]. Therefore, taking 2003 as the cut-off point, the responses of NDVI in Xinjiang under various drought stress conditions in 1982–2003 (stage1) and 2004–2015 (stage2) were analyzed. P = Pstage1–Pstage2, and if P > 0, it indicates that the conditional probability of NDVI vulnerability in stage 2 is smaller than that in stage 1, that is, the resistance of vegetation to drought is enhanced in stage 2. P < 0 indicates that the conditional probability of NDVI vulnerability increases in stage 2. Figure 7A shows the spatial distribution of P under extreme drought.
P is greater than 0 in most areas of the Altai Mountains in spring, but less than 0 in summer and autumn. The proportion of P > 0 and P < 0 in the region was calculated (Figure 7B). The proportion of SPI, SPEI and SSMI stress with P > 0 was larger in spring than in summer and autumn, and the proportion of P > 0 under SSMI stress in spring was the largest, accounting for 53.32%. Under SPI, SPEI, and SSMI stress, the proportion of P < 0 was the largest in autumn. In summer and autumn, the regional area of P < 0 is larger than that of P > 0, that is, the conditional probability of NDVI to drought increases in a large part of Xinjiang after 2003. The vulnerability of vegetation in most areas became more sensitive to drought.
In order to obtain the driving forces of the change of drought resistance of NDVI in Xinjiang, P (P = Pstage1–Pstage2) and difference of influencing factors (IF) of stage1 and stage2 (IFstage1–IFstage2) of all grids were calculated. Random forest importance ranking method was used to rank the importance of the influencing factors. The influencing factors were precipitation (PRE), actual evaporation (E), NDVI, near-surface temperature (TMP), and root zone soil moisture (RSM).
The importance score of different influencing factors on vegetation vulnerability changes under SPI/SPEI/SSMI stress were calculated (Figure 8). Evaluation index %IncMSE was used in this study. NDVI was the main driving factor for increasing vegetation vulnerability to SPI/SPEI drought stress in spring. TMP was the main driving factor for the increase of vegetation vulnerability to SPI/SPEI drought stress in autumn. The main drivers of increasing vegetation vulnerability to SSMI drought stress in spring, summer, and autumn were TMP, NDVI, and PRE, respectively. RSM was the main driving force of vegetation vulnerability reduction under SPI and SPEI stress in autumn. In spring and summer, RSM was the main influencing factor of vegetation vulnerability reduction under SSMI stress, and TMP was the main influencing factor of vegetation vulnerability reduction under SPI stress. PRE was the main influencing factor of vegetation vulnerability reduction under SPEI stress in summer and SSMI stress in autumn. In conclusion, RSM was the main driving force of vegetation vulnerability decline under drought stresses, while NDVI and TMP were the main driving forces of vegetation vulnerability increase under drought stresses.
Changes in TMP in grids with increased vegetation vulnerability were analysed and TMP increased in all grids. Similarly, the change of NDVI of the grids with increased vegetation vulnerability was statistically analyzed, and it was found that NDVI increased in more than 50% of the grids. With the increase of NDVI, the demand of vegetation for water will increase. Temperature increase may affect the change of vapor pressure deficit (VPD), and several studies have shown that temperature increase will lead to an increase in VPD [71]. VPD reflects the atmospheric water demand, and the increase of VPD may cause water stress to vegetation [72,73]. Vegetation vulnerability under drought stress increased under the combined effect of increased vegetation and high temperatures. The change of RSM in the grids with decreasing vegetation vulnerability under drought stresses was analyzed, more than 50% of the grids were found to have an increase in RSM. Increased soil moisture can help increase the resistance of vegetation to drought stresses.
Several studies [37,74] showed that the cropland area in Xinjiang has been increasing. It is of significance to study the response of cropland to drought. Therefore, the difference between the conditional probability of cropland in Xinjiang to light drought in stage1 and stage2 were analyzed (Figure 9). In spring, the conditional probabilities of cropland to SPEI and SSMI stress in stage 2 were smaller than those in stage 1, decreasing by 10% and 61%, respectively. In summer, the conditional probability values of NDVI vulnerability of cropland to SPI stress was lower in stage2 than in stage1, decreasing by 27%. However, the conditional probability values of NDVI vulnerability to SPEI and SSMI stress in stage2 increased slightly, with an increase of 5%. In autumn, the conditional probability values of NDVI vulnerability to SPI, SPEI, and SSMI stress were higher in stage2 than in stage1, increasing by 10%, 13%, and 50%, respectively. The results showed that the resistance of cropland to spring SPEI/SSMI and summer SPI drought increased. However, in autumn, the resistance of cropland to SPI, SPEI, and SSMI drought all decreased. Therefore, we should pay attention to the light drought of cropland in autumn and timely irrigation.
In addition, the responses of NDVI in the lower reaches of TRB (Figure 10) to drought indexes in stage1 and stage2 were analyzed, and the results are shown in Figure 11. Under multiple drought conditions, the conditional probability values of NDVI vulnerability of the lower reaches of TRB in stage2 was lower than that in stage 1 in different seasons. The resistance of NDVI to drought in the lower reaches of TRB increased after ecological water diversion. In addition, it can be seen from Figure 11 that the decrease of the conditional probability values of NDVI vulnerability in spring was greater than that in summer and autumn. Therefore, it can be inferred that the ecological water transport of TRB helped to enhance the drought resistance of the vegetation in the lower reaches.

4. Discussion

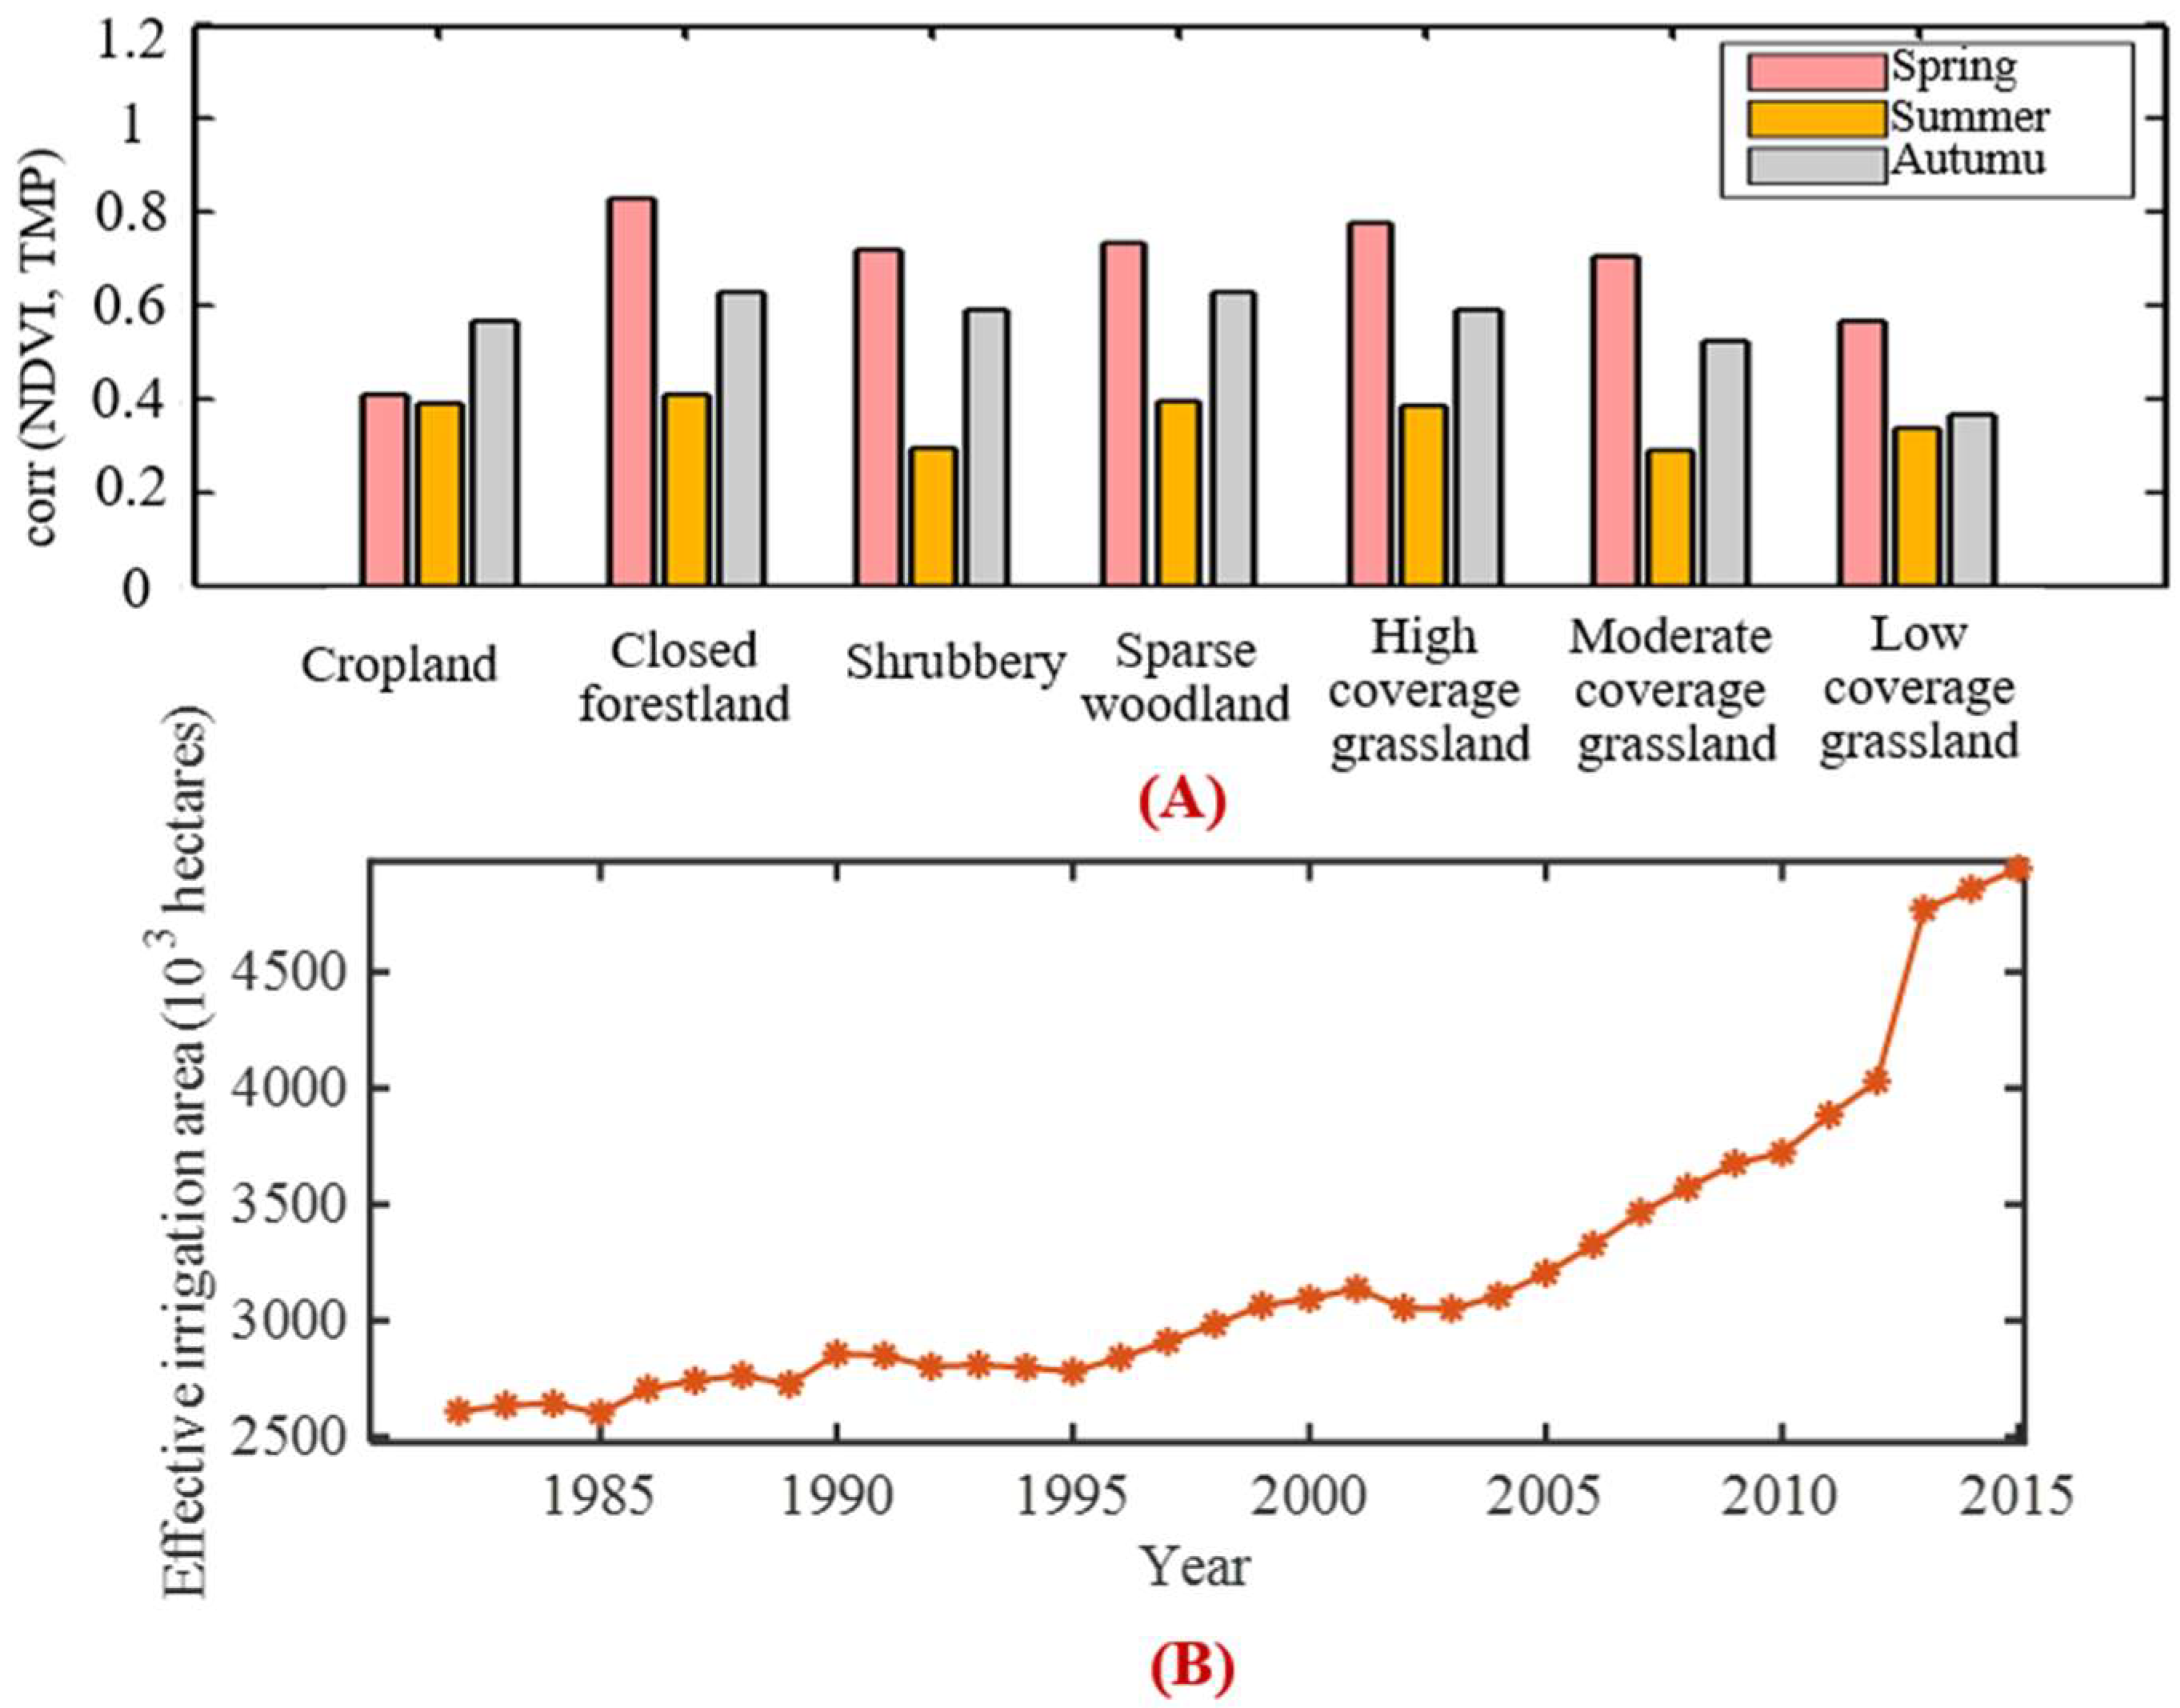
4.1. Analysis of Dominant Factors of NDVI in Spring

There was a significant positive correlation between near-surface temperature (TMP) and NDVI in spring and autumn (Figure 12A). Except for cropland, the positive correlation between NDVI and TMP of the other six vegetation types was the largest in spring. It can be concluded that spring TMP had an influence on NDVI. Xinjiang has scarce surface water resources, but abundant glacier resources and seasonal snow water resources [24,75]. Glacier and perennial snow resources are important water resources for the development of Xinjiang and are particularly important for Xinjiang’s oases [76]. In recent years, the response of glaciers and perennial snow cover to climate change has resulted in significant changes in river, soil and local climate along the coast, and the local hydrological cycle and the whole ecosystem in Xinjiang have been strongly affected [77,78,79]. In spring, the amount of plant stems and leaves increases, and the water demand increases gradually. Due to the low precipitation in spring, meltwater is an important source of water for vegetation growth in Xinjiang. Further, Z values of all pixels were greater than 1.96, implying that TMP had a significant upward trend in spring. In the context of global warming, the spring TMP continues to increase and glacial snowmelt in Xinjiang is likely to increase. Moreover, Xu et al. [80] found that the response of vegetation to temperature in spring was stronger than that to precipitation in central Eurasia. Therefore, the weak positive correlation between vegetation and SSMI/SPI/SPEI in spring may be because vegetation is mainly affected by TMP.

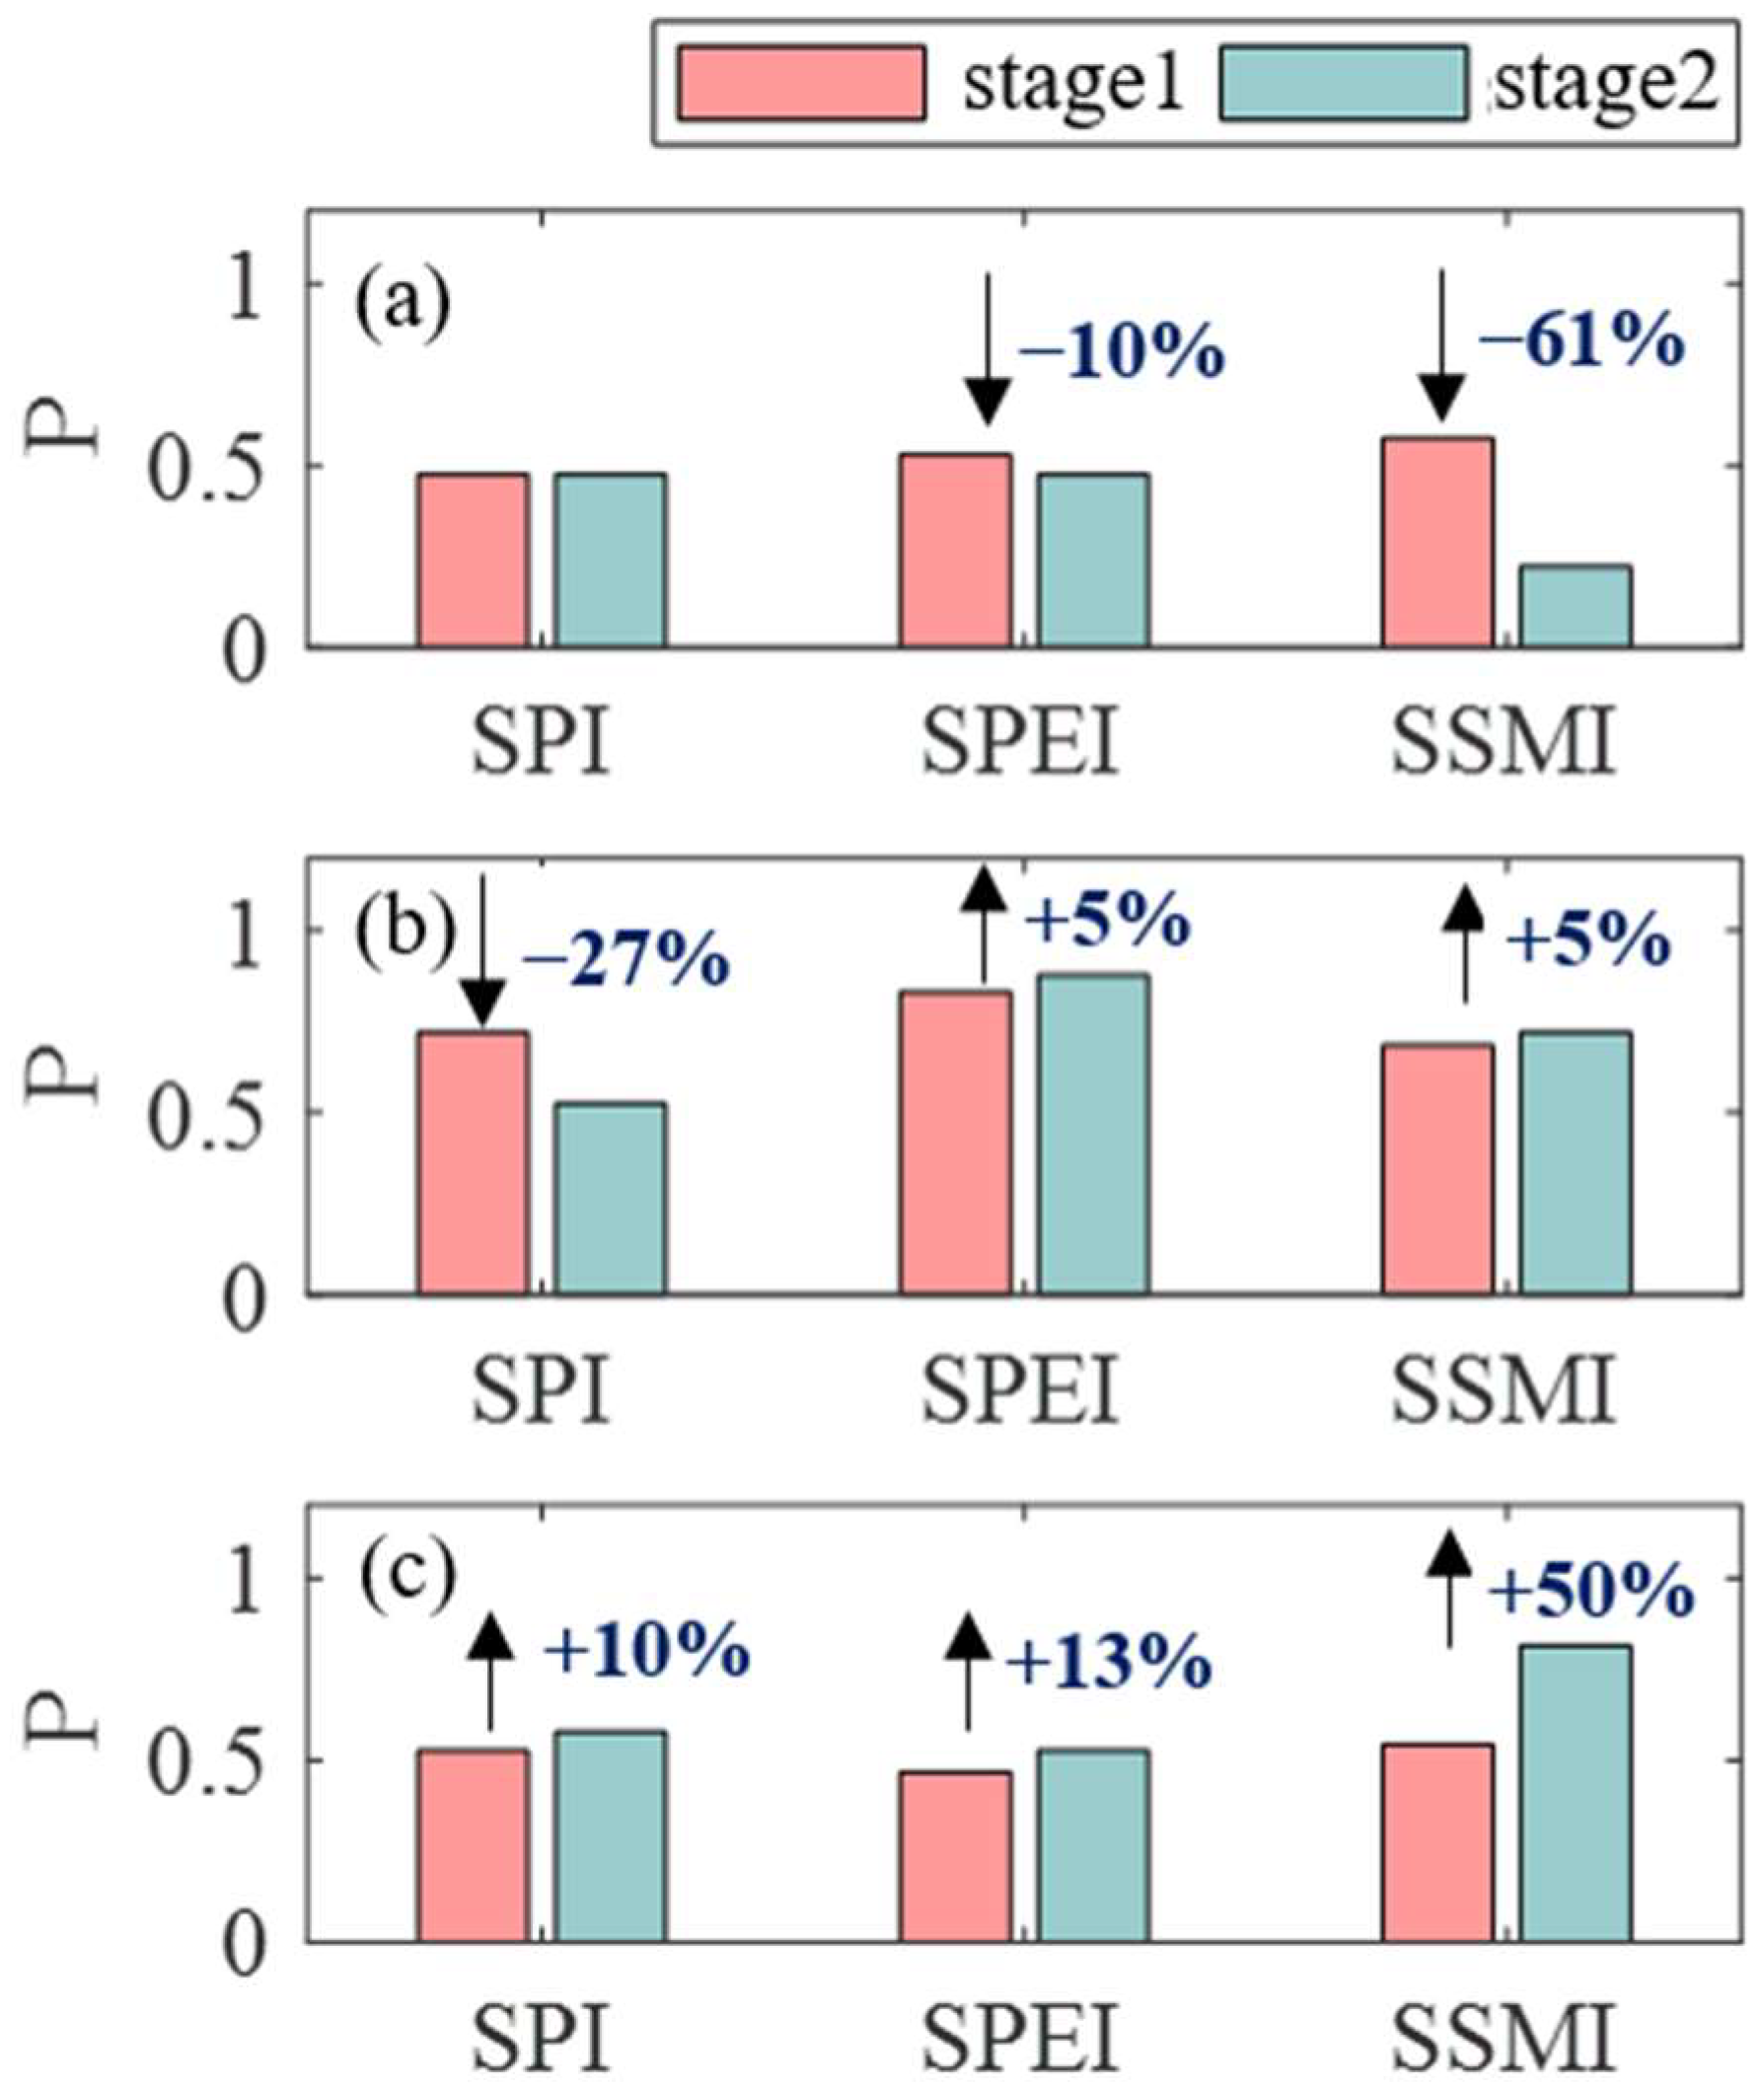
4.2. Analysis on the Causes of Increasing Vulnerability of Cropland to Drought Stresses in Autumn

The conditional probability of cropland vulnerability increased in autumn, which may be due to the increase of cropland areas. The NDVI trend values Z of cropland in autumn is 3.85. The NDVI of cropland in autumn had a significant increasing trend. With less precipitation in autumn, the increasing area of cropland may lead to insufficient water supply for cropland. In addition, it can be seen from Figure 12B that the effective irrigated area in Xinjiang has been increasing, especially after 2003. It can be found from previous studies that the variation trend of the effective irrigated area data of Xinjiang from Statistical Yearbook of Xinjiang was increasing [81], and the figure of variation trend is basically consistent with the results of this study. In addition, the research results of Long et al. showed that the demand for irrigation water in Xinjiang was increasing [82]. Agricultural water consumption in Xinjiang is large, and ecological water transport may reduce irrigation water consumption, resulting in insufficient cropland water consumption. Moreover, the ecological water transport of the Tarim River mainly concentrated from August to October [83]. Therefore, ecological water diversion in autumn may also be responsible for the decreased drought resistance of cropland in autumn.

4.3. Analysis on the Reasons for the Decrease of Vegetation Vulnerability to Drought Stresses in the Lower Reaches of the Tarim River

Human activities had a huge impact on the environment especially in dry areas. Several studies have shown that the groundwater depth of the Tarim River has been significantly increased after ecological water diversion, and the desert environment and degraded vegetation have been effectively restored. Groundwater is the key factor to sustain the survival and growth of desert riparian vegetation, and it is of significance to the restoration of degraded vegetation [84]. Intermittent ecological water transport is an important source of groundwater recharge, which is helpful to raise groundwater depth and promote the dynamic balance of a higher groundwater level. Therefore, ecological water transfers increased the drought resistance of vegetation in the lower reaches of the Tarim River.

5. Conclusions

The Copula framework and random forest method were used to quantitatively analyze the changes of vegetation vulnerability responses under multiple drought stresses in Xinjiang during 1982–2015. Due to the melting of glacier snow, NDVI in spring is likely to be influenced mainly by TMP. SPI/SPEI /SSMI stress significantly affected the vulnerability of all seven vegetation types in summer. And the vegetation vulnerability was most affected by SSMI in autumn. Among the vegetation types in Xinjiang, cropland was most sensitive to the three types of droughts in spring, grassland was most sensitive to water deficit in summer, and grassland with high coverage was most sensitive to soil water deficit in autumn. After 2003, the area of vegetation vulnerability increased more than that of vegetation vulnerability decreased under drought stresses in Xinjiang. The increasing RSM was the main driving force of vegetation vulnerability decline, while growing NDVI and TMP were the main driving force of vegetation vulnerability increase. In stage 2, the conditional probability of cropland vulnerability to SPI/SPEI/SSMI increased in autumn, which may be due to the significant increase of cropland area. In addition, ecological water diversion in autumn may also be the cause.
According to the findings of this study, the irrigation of cropland should be strengthened in spring, and attention should be paid to drought resistance and rational allocation of water resources in summer, and appropriate improvement of grassland species to better cope with the effects of summer drought. Although ecological water diversion alleviated the drought stress on vegetation in the lower reaches of the watershed, there is a contradiction between ecological water transfer and the water use of agricultural irrigation areas, and attention should be paid to coordinating ecological water transfer with multiple objectives to maximize the comprehensive benefits.
The limitations of this study include the lack of in-depth research on the impact of ecological water diversion in the Tarim River Basin. In the future, more research should be carried out on the change of vegetation vulnerability in the Tarim River Basin.

Author Contributions

Conceptualization, S.H. and Q.H.; data curation, X.W.; formal analysis, X.W. and G.L.; investigation, J.L.; methodology, X.W. and H.Y.; resources, H.Y.; software, D.L.; supervision, S.H., Q.H. and Q.B.; visualization, S.H., G.L. and W.D.; writing—original draft, X.W.; writing—review and editing, J.P. and X.W. All authors have read and agreed to the published version of the manuscript.

Funding

This research was jointly funded by the National Key R&D Program of China (grant number 2021YFC3000203), the Shaanxi University Science and Technology Association Youth Talent Promotion Project (grant number 20190413), the Strategic Priority Research Program of the Chinese Academy of Sciences (grant number XDA28060100).

Data Availability Statement

Not applicable.

Conflicts of Interest

The authors declare no conflict of interest.

References

  1. Li, P.; Liu, Z.; Zhou, X.; Xie, B.; Li, Z.; Luo, Y.; Zhu, Q.; Peng, C. Combined control of multiple extreme climate stressors on autumn vegetation phenology on the Tibetan Plateau under past and future climate change. Agric. For. Meteorol. 2021, 308–309, 108571. [Google Scholar] [CrossRef]
  2. Liu, Q.; Zhang, J.; Zhang, H.; Yao, F.; Bai, Y.; Zhang, S.; Meng, X.; Liu, Q. Evaluating the performance of eight drought indices for capturing soil moisture dynamics in various vegetation regions over China. Sci. Total Environ. 2021, 789, 147803. [Google Scholar] [CrossRef]
  3. Intergovernmental Panel on Climate Change. Land-Climate Interactions. In Climate Change and Land; An IPCC Special Report on desertification, land degradation, sustainable land management, food security, and greenhouse gas fluxes in terrestrial ecosystem; Intergovernmental Panel on Climate Change: Geneva, Switzerland, 2019. [Google Scholar]
  4. Kay, J.E. Early climate models successfully predicted global warming. Nature 2020, 578, 45–46. [Google Scholar] [CrossRef] [PubMed]
  5. Chen, X.; Wang, L.; Niu, Z.; Zhang, M.; Li, J. The effects of projected climate change and extreme climate on maize and rice in the Yangtze River Basin, China. Agric. For. Meteorol. 2020, 282–283, 107867. [Google Scholar] [CrossRef]
  6. Martin, E.R. Future Projections of Global Pluvial and Drought Event Characteristics. Geophys. Res. Lett. 2018, 45, 11913–11920. [Google Scholar] [CrossRef]
  7. Yang, Y.; Anderson, M.C.; Gao, F.; Wood, J.D.; Gu, L.; Hain, C. Studying drought-induced forest mortality using high spatiotemporal resolution evapotranspiration data from thermal satellite imaging. Remote Sens. Environ. 2021, 265, 112640. [Google Scholar] [CrossRef]
  8. Wang, L.; Huang, S.; Huang, Q.; Leng, G.; Han, Z.; Zhao, J.; Guo, Y. Vegetation vulnerability and resistance to hydrometeorological stresses in water- and energy-limited watersheds based on a Bayesian framework. CATENA 2021, 196, 104879. [Google Scholar] [CrossRef]
  9. Avetisyan, D.; Borisova, D.; Velizarova, E. Integrated Evaluation of Vegetation Drought Stress through Satellite Remote Sensing. Forests 2021, 12, 974. [Google Scholar] [CrossRef]
  10. Liu, Y.; Zhou, R.; Wen, Z.; Khalifa, M.; Zheng, C.; Ren, H.; Zhang, Z.; Wang, Z. Assessing the impacts of drought on net primary productivity of global land biomes in different climate zones. Ecol. Indic. 2021, 130, 108146. [Google Scholar] [CrossRef]
  11. Deng, C.; Zhang, B.; Cheng, L.; Hu, L.; Chen, F. Vegetation dynamics and their effects on surface water-energy balance over the Three-North Region of China. Agric. For. Meteorol. 2019, 275, 79–90. [Google Scholar] [CrossRef]
  12. Du, J.; Shu, J.; Yin, J.; Yuan, X.; Jiaerheng, A.; Xiong, S.; He, P.; Liu, W. Analysis on spatio-temporal trends and drivers in vegetation growth during recent decades in Xinjiang, China. Int. J. Appl. Earth Obs. Geoinf. 2015, 38, 216–228. [Google Scholar] [CrossRef]
  13. Xu, H.; Wang, X.; Zhang, X. Decreased vegetation growth in response to summer drought in Central Asia from 2000 to 2012. Int. J. Appl. Earth Obs. Geoinf. 2016, 52, 390–402. [Google Scholar] [CrossRef]
  14. Han, H.; Bai, J.; Ma, G.; Yan, J. Vegetation Phenological Changes in Multiple Landforms and Responses to Climate Change. ISPRS Int. J. Geo-Inf. 2020, 9, 111. [Google Scholar] [CrossRef]
  15. Yao, J.; Hu, W.; Chen, Y.; Huo, W.; Zhao, Y.; Mao, W.; Yang, Q. Hydro-climatic changes and their impacts on vegetation in Xinjiang, Central Asia. Sci. Total Environ. 2019, 660, 724–732. [Google Scholar] [CrossRef]
  16. Zhang, F.; Wang, C.H.; Wang, Z.H. Response of Natural Vegetation to Climate in Dryland Ecosystems: A Comparative Study between Xinjiang and Arizona. Remote Sens. 2020, 12, 3567. [Google Scholar] [CrossRef]
  17. Li, C.; Zhang, C.; Luo, G.; Chen, X. Modeling the carbon dynamics of the dryland ecosystems in Xinjiang, China from 1981 to 2007—The spatiotemporal patterns and climate controls. Ecol. Model. 2013, 267, 148–157. [Google Scholar] [CrossRef]
  18. Fang, X.; Chen, Z.; Guo, X.; Zhu, S.; Liu, T.; Li, C.; He, B. Impacts and uncertainties of climate/CO2 change on net primary productivity in Xinjiang, China (2000–2014): A modelling approach. Ecol. Model. 2019, 408, 108742. [Google Scholar] [CrossRef]
  19. Yang, L.; Wei, W.; Wang, T.; Li, L. Temporal-spatial variations of vegetation cover and surface soil moisture in the growing season across the mountain-oasis-desert system in Xinjiang, China. Geocarto Int. 2021, 37, 3912–3940. [Google Scholar] [CrossRef]
  20. Zheng, Z.; Ma, Z.; Li, M.; Xia, J. Regional water budgets and hydroclimatic trend variations in Xinjiang from 1951 to 2000. Clim. Chang. 2017, 144, 447–460. [Google Scholar] [CrossRef]
  21. Feng, G.L.; Wu, Y.P. Signal of acceleration and physical mechanism of water cycle in Xinjiang, China. PLoS ONE 2016, 11, e0167387. [Google Scholar] [CrossRef] [Green Version]
  22. Yao, J.; Chen, Y.; Zhao, Y.; Guan, X.; Mao, W.; Yang, L. Climatic and associated atmospheric water cycle changes over the Xinjiang, China. J. Hydrol. 2020, 585, 124823. [Google Scholar] [CrossRef]
  23. Li, Z.; Chen, Y.; Fang, G.; Li, Y. Multivariate assessment and attribution of droughts in Central Asia. Sci. Rep. 2017, 7, 1316. [Google Scholar] [CrossRef]
  24. Chen, Y.; Li, W.; Deng, H.; Fang, G.; Li, Z. Changes in Central Asia’s water tower: Past, present and future. Sci. Rep. 2016, 6, 35458. [Google Scholar] [CrossRef]
  25. Ling, H.; Guo, B.; Zhang, G.; Xu, H.; Deng, X. Evaluation of the ecological protective effect of the “large basin” comprehensive management system in the Tarim River basin, China. Sci. Total Environ. 2019, 650, 1696–1706. [Google Scholar] [CrossRef]
  26. Zhang, H.; Xue, L.; Wei, G.; Dong, Z.; Meng, X. Assessing Vegetation Dynamics and Landscape Ecological Risk on the Mainstream of the Tarim River, China. Water 2020, 12, 2156. [Google Scholar] [CrossRef]
  27. Guo, H.; Jiapaer, G.; Bao, A.; Li, X.; Huang, Y.; Ndayisaba, F.; Meng, F. Effects of the Tarim River’s middle stream water transport dike on the fractional cover of desert riparian vegetation. Ecol. Eng. 2017, 99, 333–342. [Google Scholar] [CrossRef]
  28. Tao, H.; Gemmer, M.; Song, Y.; Jiang, T. Ecohydrological responses on water diversion in the lower reaches of the Tarim River, China. Water Resour. Res. 2008, 44. [Google Scholar] [CrossRef]
  29. Yang, F.; Xue, L.; Wei, G.; Chi, Y.; Yang, G. Study on the dominant causes of streamflow alteration and effects of the current water diversion in the Tarim River Basin, China. Hydrol. Processes 2018, 32, 3391–3401. [Google Scholar] [CrossRef]
  30. Bao, A.; Huang, Y.; Ma, Y.; Guo, H.; Wang, Y. Assessing the effect of EWDP on vegetation restoration by remote sensing in the lower reaches of the Tarim River. Ecol. Indic. 2017, 74, 261–275. [Google Scholar] [CrossRef]
  31. Birkmann, J.; Cardona, O.D.; Carreño, M.L.; Barbat, A.H.; Pelling, M.; Schneiderbauer, S.; Kienberger, S.; Keiler, M.; Alexander, D.E.; Zeil, P.; et al. Theoretical and conceptual framework for the assessment of vulnerability to natural hazards and climate change in Europe: The MOVE framework. Assess. Vulnerability Nat. Hazards 2014, 1–19. [Google Scholar] [CrossRef]
  32. Proag, V. The Concept of Vulnerability and Resilience. Procedia Econ. Financ. 2014, 18, 369–376. [Google Scholar] [CrossRef]
  33. Jiang, L.L.; Liu, B.; Yuan, Y. Quantifying Vegetation Vulnerability to Climate Variability in China. Remote Sens. 2022, 14, 3491. [Google Scholar] [CrossRef]
  34. Shukla, P.R.; Skeg, J.; Buendia, E.C.; Masson-Delmotte, V.; Pörtner, H.O.; Roberts, D.C.; Zhai, P.; Slade, R.; Connors, S.; Van Diemen, S.; et al. Climate Change and Land: An IPCC Special Report on Climate Change, Desertification, Land Degradation, Sustainable Land Management, Food Security, and Greenhouse Gas Fluxes in Terrestrial Ecosystems; IPCC: Berlin, Germany, 2019. [Google Scholar]
  35. Cui, L.; Shi, J. Temporal and spatial response of vegetation NDVI to temperature and precipitation in eastern China. J. Geogr. Sci. 2010, 20, 163–176. [Google Scholar] [CrossRef]
  36. Wu, D.; Zhao, X.; Liang, S.; Zhou, T.; Huang, K.; Tang, B.; Zhao, W. Time-lag effects of global vegetation responses to climate change. Glob. Chang. Biol. 2015, 21, 3520–3531. [Google Scholar] [CrossRef] [PubMed]
  37. He, K.; Wu, S.; Yang, Y.; Wang, D.; Zhang, S.; Yin, N. Dynamic changes of land use and oasis in Xinjiang in the last 40 years. Arid Land Geogr. 2018, 41, 1333–1340. (In Chinese) [Google Scholar]
  38. Li, X.; Qu, Y. Evaluation of Vegetation Responses to Climatic Factors and Global Vegetation Trends using GLASS LAI from 1982 to 2010. Can. J. Remote Sens. 2019, 44, 357–372. [Google Scholar] [CrossRef]
  39. Wang, Y.; Fu, B.; Liu, Y.; Li, Y.; Feng, X.; Wang, S. Response of vegetation to drought in the Tibetan Plateau: Elevation differentiation and the dominant factors. Agric. For. Meteorol. 2021, 306, 108468. [Google Scholar] [CrossRef]
  40. Chen, F.H.; Huang, W. Multi-scale climate variations in the arid Central Asia. Adv. Clim. Chang. Res. 2017, 8, 1–2. [Google Scholar] [CrossRef]
  41. Li, Z.; Zhou, T.; Zhao, X.; Huang, K.; Wu, H.; Du, L. Diverse spatiotemporal responses in vegetation growth to droughts in China. Environ. Earth Sci. 2015, 75, 1–13. [Google Scholar] [CrossRef]
  42. Zhu, S.; Xiao, Z.; Luo, X.; Zhang, H.; Liu, X.; Wang, R.; Zhang, M.; Huo, Z. Multidimensional Response Evaluation of Remote-Sensing Vegetation Change to Drought Stress in the Three-River Headwaters, China. IEEE J. Sel. Top. Appl. Earth Obs. Remote Sens. 2020, 13, 6249–6259. [Google Scholar] [CrossRef]
  43. Stagge, J.H.; Tallaksen, L.M.; Gudmundsson, L.; Van Loon, A.F.; Stahl, K. Candidate distributions for climatological drought indices (SPI and SPEI). Int. J. Climatol. 2015, 35, 4027–4040. [Google Scholar] [CrossRef]
  44. Fang, W.; Huang, S.; Huang, Q.; Huang, G.; Wang, H.; Leng, G.; Wang, L.; Li, P.; Ma, L. Bivariate probabilistic quantification of drought impacts on terrestrial vegetation dynamics in mainland China. J. Hydrol. 2019, 577, 123980. [Google Scholar] [CrossRef]
  45. Vicente-Serrano, S.M.; Beguería, S.; López-Moreno, J.I. A Multiscalar Drought Index Sensitive to Global Warming: The Standardized Precipitation Evapotranspiration Index. J. Clim. 2010, 23, 1696–1718. [Google Scholar] [CrossRef]
  46. Peng, J.; Dadson, S.; Hirpa, F.; Dyer, E.; Lees, T.; Funk, C.; Miralles, D.; Vicente-Serrano, S. A pan-African high resolution drought index dataset. Earth Syst. Sci. Data 2020, 12, 753–769. [Google Scholar] [CrossRef]
  47. Rhee, J.; Park, K.; Lee, S.; Jang, S.; Yoon, S. Detecting hydrological droughts in ungauged areas from remotely sensed hydro-meteorological variables using rule-based models. Nat. Hazards 2020, 103, 2961–2988. [Google Scholar] [CrossRef]
  48. Measho, S.; Chen, B.; Trisurat, Y.; Pellikka, P.; Guo, L.; Arunyawat, S.; Tuankrua, V.; Ogbazghi, W.; Yemane, T. Spatio-Temporal Analysis of Vegetation Dynamics as a Response to Climate Variability and Drought Patterns in the Semiarid Region. Eritrea. Remote Sens. 2019, 11, 724. [Google Scholar] [CrossRef]
  49. Sklar, M. Fonctions de repartition an dimensions et leurs marges. Publ. Inst. Statist. Univ. Paris 1959, 8, 229–231. [Google Scholar]
  50. Fang, W.; Huang, S.; Huang, Q.; Huang, G.; Wang, H.; Leng, G.; Wang, L.; Guo, Y. Probabilistic assessment of remote sensing-based terrestrial vegetation vulnerability to drought stress of the Loess Plateau in China. Remote Sens. Environ. 2019, 232, 111290. [Google Scholar] [CrossRef]
  51. Li, H.W.; Li, Y.P.; Huang, G.H.; Sun, J. Quantifying effects of compound dry-hot extremes on vegetation in Xinjiang (China) using a vine-copula conditional probability model. Agric. For. Meteorol. 2021, 311, 108658. [Google Scholar] [CrossRef]
  52. Yu, H.; Bian, Z.; Mu, S.; Yuan, J.; Chen, F. Effects of Climate Change on Land Cover Change and Vegetation Dynamics in Xinjiang, China. Int. J. Environ. Res. Public Health 2020, 17, 4865. [Google Scholar] [CrossRef]
  53. Yao, J.; Chen, Y.; Zhao, Y.; Mao, W.; Xu, X.; Liu, Y.; Yang, Q. Response of vegetation NDVI to climatic extremes in the arid region of Central Asia: A case study in Xinjiang, China. Theor. Appl. Clim. 2018, 131, 1503–1515. [Google Scholar] [CrossRef]
  54. Deering, D.W. Rangeland Reflectance Characteristics Measured by Aircraft and Spacecraft Sensors. Master’s Thesis, Texas A M University, College Station, TX, USA, 1978. [Google Scholar]
  55. Ali, S.; Henchiri, M.; Sha, Z.; Wilson, K.; Yun, B.; Yao, F.; Zhang, J. A time series of land cover maps of South Asia from 2001 to 2015 generated using AVHRR GIMMS NDVI3g data. Environ. Sci. Pollut. Res. 2020, 27, 20309–20320. [Google Scholar] [CrossRef] [PubMed]
  56. Han, Z.; Huang, S.; Huang, Q.; Leng, G.; Liu, Y.; Bai, Q.; He, P.; Liang, H.; Shi, W. GRACE-based high-resolution propagation threshold from meteorological to groundwater drought. Agric. For. Meteorol. 2021, 307, 108476. [Google Scholar] [CrossRef]
  57. Mahmud, T.; Sifa, S.F.; Islam, N.N.; Rafsan, M.; Kamal, A.S.M.; Hossain, M.; Rahman, M.; Chakraborty, T.R. Drought dynamics of Northwestern Teesta Floodplain of Bangladesh: A remote sensing approach to ascertain the cause and effect. Environ. Monit. Assess. 2021, 193. [Google Scholar] [CrossRef] [PubMed]
  58. Zuo, J.; Xu, J.; Li, W.; Yang, D. Understanding shallow soil moisture variation in the data-scarce area and its relationship with climate change by GLDAS data. PLoS ONE 2019, 14, e0217020. [Google Scholar] [CrossRef] [PubMed]
  59. Liu, L.; Wei, D.; Wang, X.; Cheng, S. Multi-data Intercomparison of Soil Moisture over China. J. Arid. Meteorol. 2019, 37, 40–47. (In Chinese) [Google Scholar]
  60. Mckee, T.B.; Doesken, N.J.; Kleist, J. The relationship of drought frequency and duration to time scales. In Proceedings of the 8th Conference on Applied Climatology, Anaheim, CA, USA, 17–22 January 1993. [Google Scholar]
  61. Han, Z.; Huang, Q.; Huang, S.; Leng, G.; Bai, Q.; Liang, H.; Wang, L.; Zhao, J.; Fang, W. Spatial-temporal dynamics of agricultural drought in the Loess Plateau under a changing environment: Characteristics and potential influencing factors. Agric. Water Manag. 2021, 244, 106540. [Google Scholar] [CrossRef]
  62. Olkin, I.; Trikalinos, T.A. Constructions for a bivariate beta distribution. Stat. Probab. Lett. 2015, 96, 54–60. [Google Scholar] [CrossRef]
  63. Yu, K.X.; Xiong, L.; Li, P.; Li, Z.; Zhang, X.; Sun, Q. Analyzing the Impacts of Climatic and Physiographic Factors on Low Flow Distributions. Water Resour. Manag. 2018, 32, 881–896. [Google Scholar] [CrossRef]
  64. Madadgar, S.; AghaKouchak, A.; Farahmand, A.; Davis, S.J. Probabilistic estimates of drought impacts on agricultural production. Geophys. Res. Lett. 2017, 44, 7799–7807. [Google Scholar] [CrossRef]
  65. Mann, H.B. Non-Parametric test against trend. Econometrica 1945, 13, 245–259. [Google Scholar] [CrossRef]
  66. Kendall, M.G. Rank Correlation Methods; Springer: Boston, MA, USA, 1955. [Google Scholar]
  67. Breiman, L. Random forests. Mach. Learn. 2001, 45, 5–32. [Google Scholar] [CrossRef]
  68. Wang, Y.; Wen, H.; Sun, D.; Li, Y. Quantitative Assessment of Landslide Risk Based on Susceptibility Mapping Using Random Forest and GeoDetector. Remote Sens. 2021, 13, 2625. [Google Scholar] [CrossRef]
  69. Wang, Y.; Zhang, T.; Chen, X.; Li, J.; Feng, P. Spatial and temporal characteristics of droughts in Luanhe River basin, China. Theor. Appl. Climatol. 2017, 131, 1369–1385. [Google Scholar] [CrossRef]
  70. Chen, Y.; Chen, Y.; Xu, C.; Ye, Z.; Li, Z.; Zhu, C.; Ma, X. Effects of ecological water conveyance on groundwater depth in the lower reaches of the Tarim River. Arid Land Geogr. 2021, 44, 8. (In Chinese) [Google Scholar]
  71. Matsoukas, C.; Benas, N.; Hatzianastassiou, N.; Pavlakis, K.G.; Kanakidou, M.; Vardavas, I. Potential evaporation trends over land between 1983–2008, driven by radiative fluxes or vapour-pressure deficit? Atmos. Chem. Phys. 2011, 11, 7601–7616. [Google Scholar] [CrossRef]
  72. Seager, R.; Hooks, A.; Williams, A.P.; Cook, B.; Nakamura, J.; Henderson, N. Climatology, Variability, and Trends in the U.S. Vapor Pressure Deficit, an Important Fire-Related Meteorological Quantity. J. Appl. Meteorol. Climatol. 2015, 54, 1121–1141. [Google Scholar] [CrossRef]
  73. Yuan, W.; Zheng, Y.; Piao, S.; Ciais, P.; Lombardozzi, D.; Wang, Y.; Ryu, Y.; Chen, G.; Dong, W.; Hu, Z.; et al. Increased atmospheric vapor pressure deficit reduces global vegetation growth. Sci. Adv. 2019, 5, eaax1396. [Google Scholar] [CrossRef]
  74. Zhang, S.; Wang, Y.; Xia, T.T.; Chang, X.; Li, Z. Effects of land use/cover change on ecosystem service value under the ecological water conveyance of the Tarim River. Arid Land Geogr. 2021, 44, 739–749. (In Chinese) [Google Scholar]
  75. Shen, Y.; Chen, Y.; Liu, C.; Smettem, K. Ecohydrology of the inland river basins in the Northwestern Arid Region of China. Ecohydrology 2013, 6, 905–908. [Google Scholar] [CrossRef]
  76. Duethmann, D.; Bolch, T.; Farinotti, D.; Kriegel, D.; Vorogushyn, S.; Merz, B.; Pieczonka, T.; Jiang, T.; Su, B.; Güntner, A. Attribution of streamflow trends in snow and glacier melt-dominated catchments of the Tarim River, Central Asia. Water Resour. Res. 2015, 51, 4727–4750. [Google Scholar] [CrossRef]
  77. Shen, Y.P.; Su, H.C.; Wang, G.Y.; Mao, W.M.; Wang, S.D.; Han, P.; Wang, N.; Li, Z.Q. The responses of glacier and snow cover to climate change in Xinjiang (I): Hydrological effect. J. Glaciol. Geocryol. 2013, 35, 513–527. (In Chinese) [Google Scholar]
  78. Chen, Y.; Li, Z.; Fan, Y.; Wang, H.; Deng, H. Progress and prospects of climate change impacts on hydrology in the arid region of northwest China. Environ. Res. 2015, 139, 11–19. [Google Scholar] [CrossRef]
  79. Shen, Y.J.; Shen, Y.; Guo, Y.; Zhang, Y.; Pei, H.; Brenning, A. Review of historical and projected future climatic and hydrological changes in mountainous semiarid Xinjiang (northwestern China), central Asia. CATENA 2019, 187, 104343. [Google Scholar] [CrossRef]
  80. Xu, H.; Wang, X.; Yang, T. Trend shifts in satellite-derived vegetation growth in Central Eurasia, 1982–2013. Sci. Total Environ. 2017, 579, 1658–1674. [Google Scholar] [CrossRef] [PubMed]
  81. Lai, J.; Li, Y.; Chen, J.; Niu, G.Y.; Lin, P.; Li, Q.; Wang, L.; Han, J.; Luo, Z.; Sun, Y. Massive crop expansion threatens agriculture and water sustainability in northwestern China. Environ. Res. Lett. 2022, 17, 034003. [Google Scholar] [CrossRef]
  82. Long, A.; Zhang, P.; Hai, Y.; Deng, X.; Li, J.; Wang, J. Spatio-Temporal Variations of Crop Water Footprint and Its Influencing Factors in Xinjiang, China during 1988–2017. Sustainability 2020, 12, 9678. [Google Scholar] [CrossRef]
  83. Ye, M.; Xu, H.; Ren, M. Primary Study on the Rational Time of Ecological Water Conveyance to Lower Reaches of the Tarim River. Arid Zone Res. 2012, 29, 907–912. (In Chinese) [Google Scholar]
  84. Zhang, X.Q.; Xia, Q.Q.; Chen, Y.N.; Xia, Z.; Zhu, C.; Li, J.; Hao, H.; Xiang, Y. Effects of ecological water conveyance on gross primary productivity of vegetation in Tarim River in recent 20 years. Arid Land Geogr. 2021, 44, 718–728. (In Chinese) [Google Scholar]
Figure 1. Map of Xinjiang, China.
Remotesensing 14 04231 g001
Figure 2. Conditional probability estimation of vegetation decline under multiple drought categories based on copula-based probabilistic framework.
Remotesensing 14 04231 g002
Figure 3. Spatial correlation between NDVI and SPI/SPEI/SSMI.
Remotesensing 14 04231 g003
Figure 4. Land use map in Xinjiang (secondary classification).
Remotesensing 14 04231 g004
Figure 5. The spatial distribution of the conditional probability of NDVI vulnerability under extreme drought.
Remotesensing 14 04231 g005
Figure 6. The conditional probability of NDVI vulnerability of seven vegetation types under SPI stress (a), SPEI stress (b) and SSMI stress (c).
Remotesensing 14 04231 g006
Figure 7. (A) The spatial distribution of P (Pstage1–Pstage2) under extreme drought; (B) the regional proportion of P < 0 and P > 0 under extreme drought.
Remotesensing 14 04231 g007
Figure 8. Importance score of different influencing factors on vegetation vulnerability changes under SPI/SPEI/SSMI stress: (a) spring, (b) summer and (c) autumn.
Remotesensing 14 04231 g008
Figure 9. Comparison of conditional probability of cropland vulnerability between stage 2 and stage 1 under light drought stress: (a) spring, (b) summer and (c) autumn.
Remotesensing 14 04231 g009
Figure 10. The lower reaches of TRB.
Remotesensing 14 04231 g010
Figure 11. Comparison of conditional probability of NDVI vulnerability of the lower reaches of TRB between stage 2 and stage 1 under SPI stress (a), SPEI stress (b) and SSMI stress (c).
Remotesensing 14 04231 g011
Figure 12. (A) The correlation between NDVI and TMP; (B) dynamic change of effective irrigated area in Xinjiang.
Remotesensing 14 04231 g012
Table 1. Vegetation types and area proportions in Xinjiang.
Primary ClassificationSecondary ClassificationProportion/%Proportion/%
GrasslandHigh coverage grassland6.9428.59
Moderate coverage grassland6.97
Low coverage grassland14.68
CroplandPaddy field0.034.71
Rainfed cropland4.68
ForestlandClosed forest land1.272.26
Shrubbery0.54
Sparse woodland0.40
Other woodland0.05
Other land typesWater body3.2064.44
Construction land0.41
Unused land60.83
Table 2. Dominant drought stress factors of vegetation vulnerability.
Vegetation TypesSpringSummerAutumn
CroplandSSMILight/moderate drought: SPEI;
Severe/extreme drought: SSMI
SSMI
Closed forestland SSMISSMISSMI
ShrubberySSMILight drought: SSMI;
Moderate/severe/extreme drought: SPEI
SSMI
Sparse woodlandSSMISPEISSMI
High coverage grasslandSSMILight drought: SPEI;
Moderate/severe/extreme drought: SSMI
SSMI
Moderate coverage grasslandSSMILight drought: SPI;
Moderate/severe/extreme drought: SSMI
SSMI
Low coverage grasslandLight/moderate drought: SSMI;
Severe/extreme drought: SPI;
Light/moderate drought: SPI
Severe/extreme drought: SSMI;
SSMI
Publisher’s Note: MDPI stays neutral with regard to jurisdictional claims in published maps and institutional affiliations.

