1. Introduction
Against the international background of global sustainable development and countries committed to building a community with a shared future for humankind, solar energy has unique advantages, such as inexhaustibility, no transportation, and no pollution [
1]. As an important energy source to alleviate the future world energy crisis, solar energy has become a major research interest, and the photovoltaic power generation industry is in full swing. Under the guidance of various countries’ photovoltaic policies [
2,
3,
4,
5,
6,
7] and the promotion of the market, the global photovoltaic installed capacity has grown steadily and rapidly. By the end of 2020, the global photovoltaic installed capacity exceeded 760.4 GW [
8]. By the end of 2021, China’s photovoltaic grid-connected installed capacity reached 306 GW [
9]. How to supervise the large-scale and fast-growing photovoltaic power plants from a macro perspective is an urgent problem to be solved in the fields of land survey and resource and environmental monitoring [
10]. Satellite remote sensing images have the advantages of a large detection range, fast data acquisition, high update frequency, and freedom from ground conditions [
11]. It is worth mentioning that photovoltaic power plants have an obvious texture, geometry, spectrum, and other characteristics in remote sensing images. Therefore, it is of great significance to propose a hierarchical information extraction method for centralized photovoltaic power plants based on multi-source satellite remote sensing images. This section mainly describes the research status from the aspects of traditional photovoltaic power plant identification methods, photovoltaic power plant identification methods based on deep learning, and small-target identification methods [
12].
This paragraph describes traditional methods used for photovoltaic panels extraction. Zhang et al. extracted photovoltaic power plants from a Landsat-8 image using a random forest model on the Google Earth Engine platform [
13]. The input of the model is the texture features calculated by the grayscale co-occurrence matrix, the normalized difference vegetation index (NDVI), the normalized difference building index (NDBI), the modified normalized difference water index (MNDWI), the reflectivity, and the thermal spectrum features. Experiments verified that the texture features of the gray-scale co-occurrence matrix can significantly improve the accuracy of the model to identify photovoltaics. However, the gray-scale co-occurrence matrix is complexly calculated pixel by pixel, based on the neighborhood around the pixel, and the calculation amount is very large, which will greatly reduce the efficiency of the model and increase the time cost. It is not suitable for large-scale extraction of photovoltaic panels. Li et al. used the spectral-information-rich Landsat-8 Operational Land Imager (OLI) data to calculate the normalized building index and brightness, two spectral characteristics, to separate the solar cell array, construction land, road, and fallow land. For high-resolution remote sensing images such as the GaoFen-1 image, the authors distinguish solar photovoltaic arrays from other ground objects based on geometric and texture features [
14]. Wang et al. used a one-class support vector machine (OC-SVM) method to extract photovoltaic power stations along the coast of Jiangsu Province and used the modified optimum index factor (MOIF) for extracting photovoltaic power stations. Compared with the traditional optimal index factor (OIF) band combination method, the MOIF improves the extraction accuracy of photovoltaic panels [
15]. Therefore, it is not an optimal method to extract photovoltaic panels from GaoFen satellite images that are not so rich in spectral information, relying on geometric and texture features to identify photovoltaic panels in a large range.
This paragraph describes deep learning methods used for photovoltaic panel extraction. Costa et al. used deep learning methods to select 24 study areas in Brazil to identify and monitor photovoltaic power plants in Sentinel-2 images [
16]. The research compares the effects of four common frameworks, U-Net [
17], DeepLabv3+ [
18], Feature pyramid networks (FPN) [
19], and Pyramid Scene Parsing Network (PSPNet) [
20], in photovoltaic panel recognition. Although the U-Net architecture presented the best results in the photovoltaic identification process, it did not show much difference from other architectures. Therefore, when using deep learning methods for ground object information recognition, although the recognition accuracy is closely related to the structure of the model, the recognition effect is more dependent on the construction of the dataset. Using deep learning methods [
21] to directly perform semantic segmentation of photovoltaic panels on high-resolution remote sensing images is not an optimal method as it may bring unnecessary computational consumption when photovoltaic panel pixels are much lower in number than non-photovoltaic panels.
This paragraph describes scene-oriented photovoltaic panel positioning methods. Wang et al. selected seven pre-trained convolutional neural network models for the scene classification of photovoltaic power plants in Landsat 8 OLI images [
10]. The sample set contains 120 positive and negative sample images of 56 × 56 pixels in RGB bands, including as many photovoltaic panels of different forms as possible. After adopting the strategies of transfer learning and model fine-tuning, the scene recognition of photovoltaic panels was carried out. The results show that it is feasible to use the convolutional neural network model to perform scene recognition of photovoltaic panels on medium-resolution remote sensing images. However, scene classification cannot obtain fine photovoltaic boundary information, so it is far from sufficient to only perform scene recognition on photovoltaic panels.
Therefore, this paper proposes a hierarchical information extraction method of centralized photovoltaic power plants based on multi-source remote sensing images and conducts large-scale photovoltaic power plant distribution mapping [
22]. The method firstly performs scene classification of photovoltaic panels in medium-resolution remote sensing image, and obtains the area containing photovoltaic panels or suspected photovoltaic panels, which greatly reduces the background area without photovoltaic panels and balances the number of positive and negative targets. We use this as a mask to accurately identify photovoltaic panels in high-resolution remote sensing images. This method not only avoids the problem of unbalanced positive and negative targets faced by using deep learning methods to directly perform semantic segmentation on photovoltaic panels, but also improves the speed of photovoltaic panel identification on a large scale, greatly improves recognition efficiency and saves computing resources.
3. Methods
In order to make full use of the characteristics of remote sensing images with different spatial resolutions, improve the accuracy and efficiency of extracting photovoltaic panels, and save computing resources, this paper proposes a hierarchical information extraction method for large-scale centralized photovoltaic power plants based on multi-source remote sensing images.
This method is divided into two main parts: in the first part, the deep learning scene classification model is used to locate the photovoltaic power plants on the 16-m spatial resolution image; in the second part, the semantic segmentation model is used to extract photovoltaic panels precisely on the 2-m spatial resolution image.
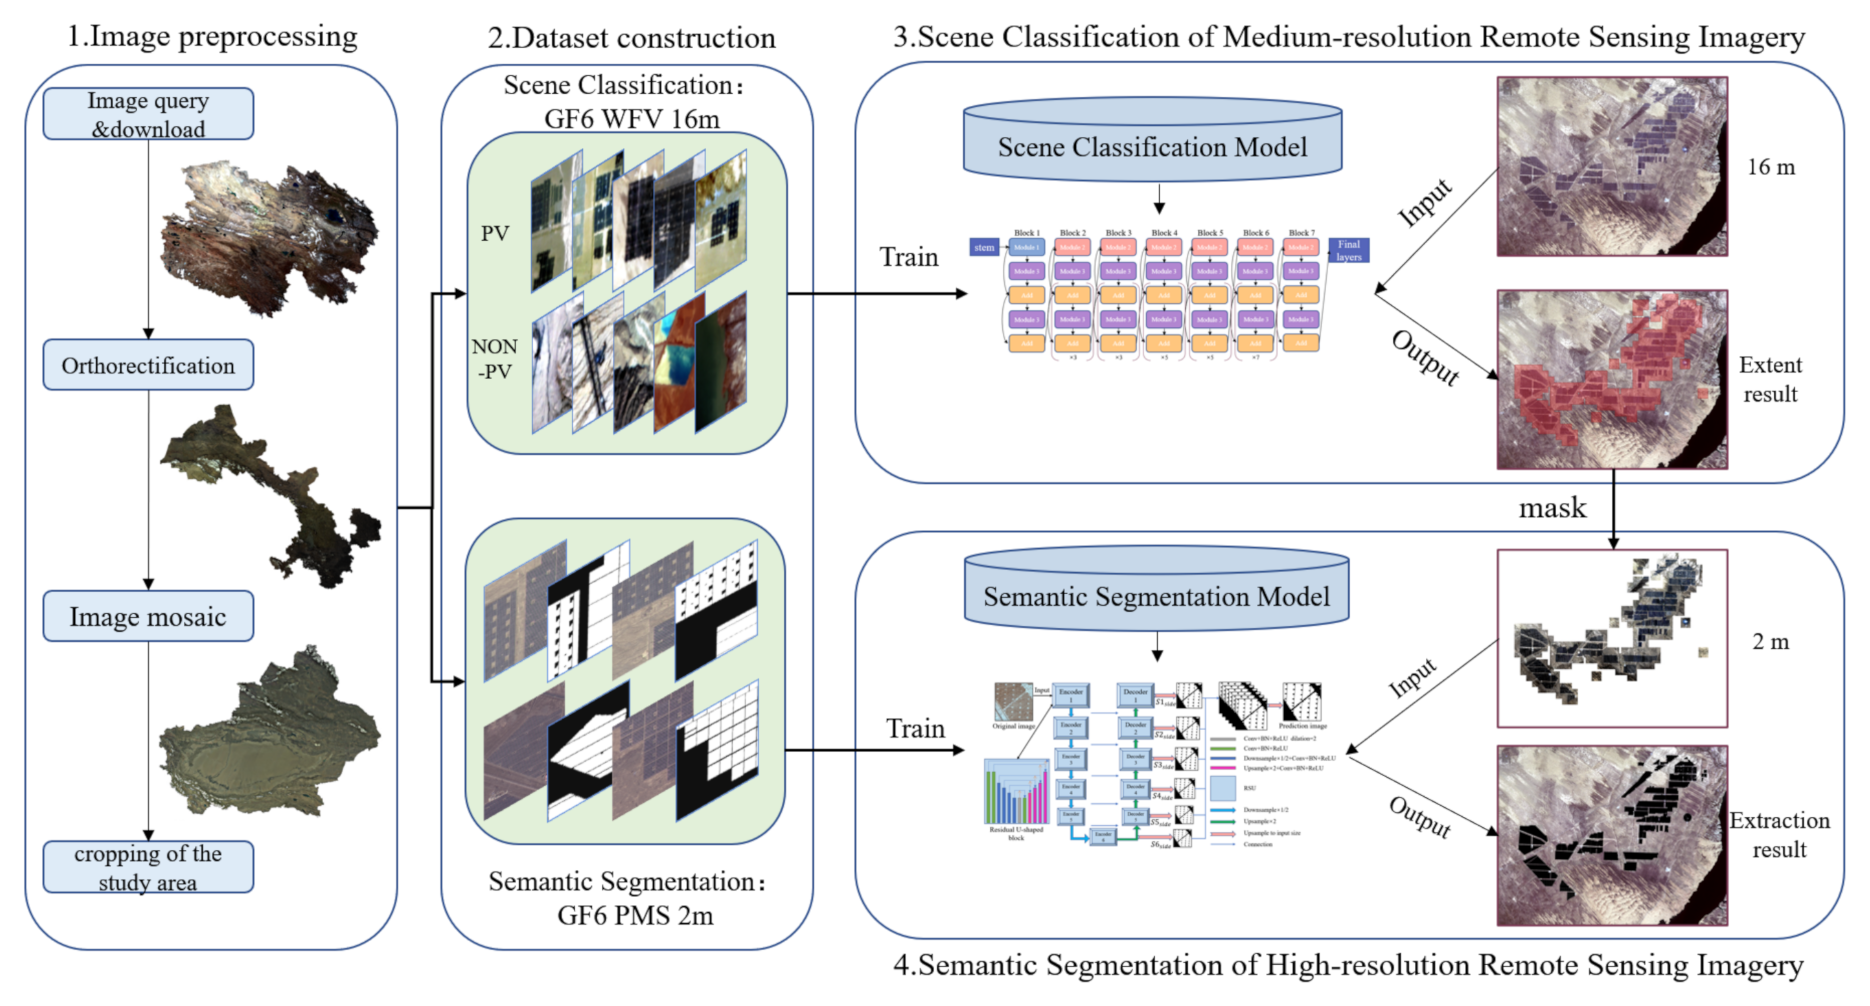
The technical framework of this method is shown in
Figure 5:
The first step is remote sensing image preprocessing. For remote sensing images with a spatial resolution of 16 m, the original images were subjected to orthorectification, bit-depth adjustment, image mosaicking, and cropping of the study area; for remote sensing images with a spatial resolution of 2 m, the original images were subjected to orthographic correction, sharpening fusion, bit-depth adjustment, image mosaicking, and cropping of the study area.
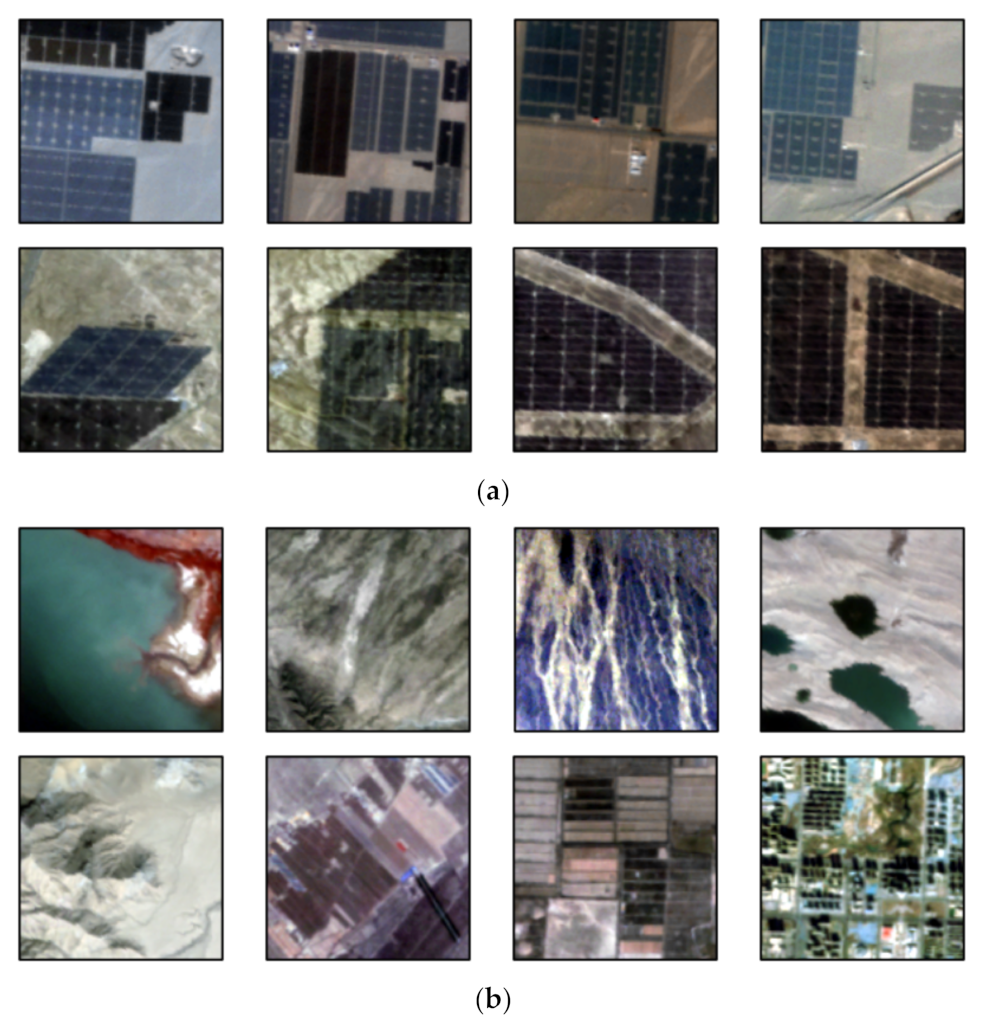
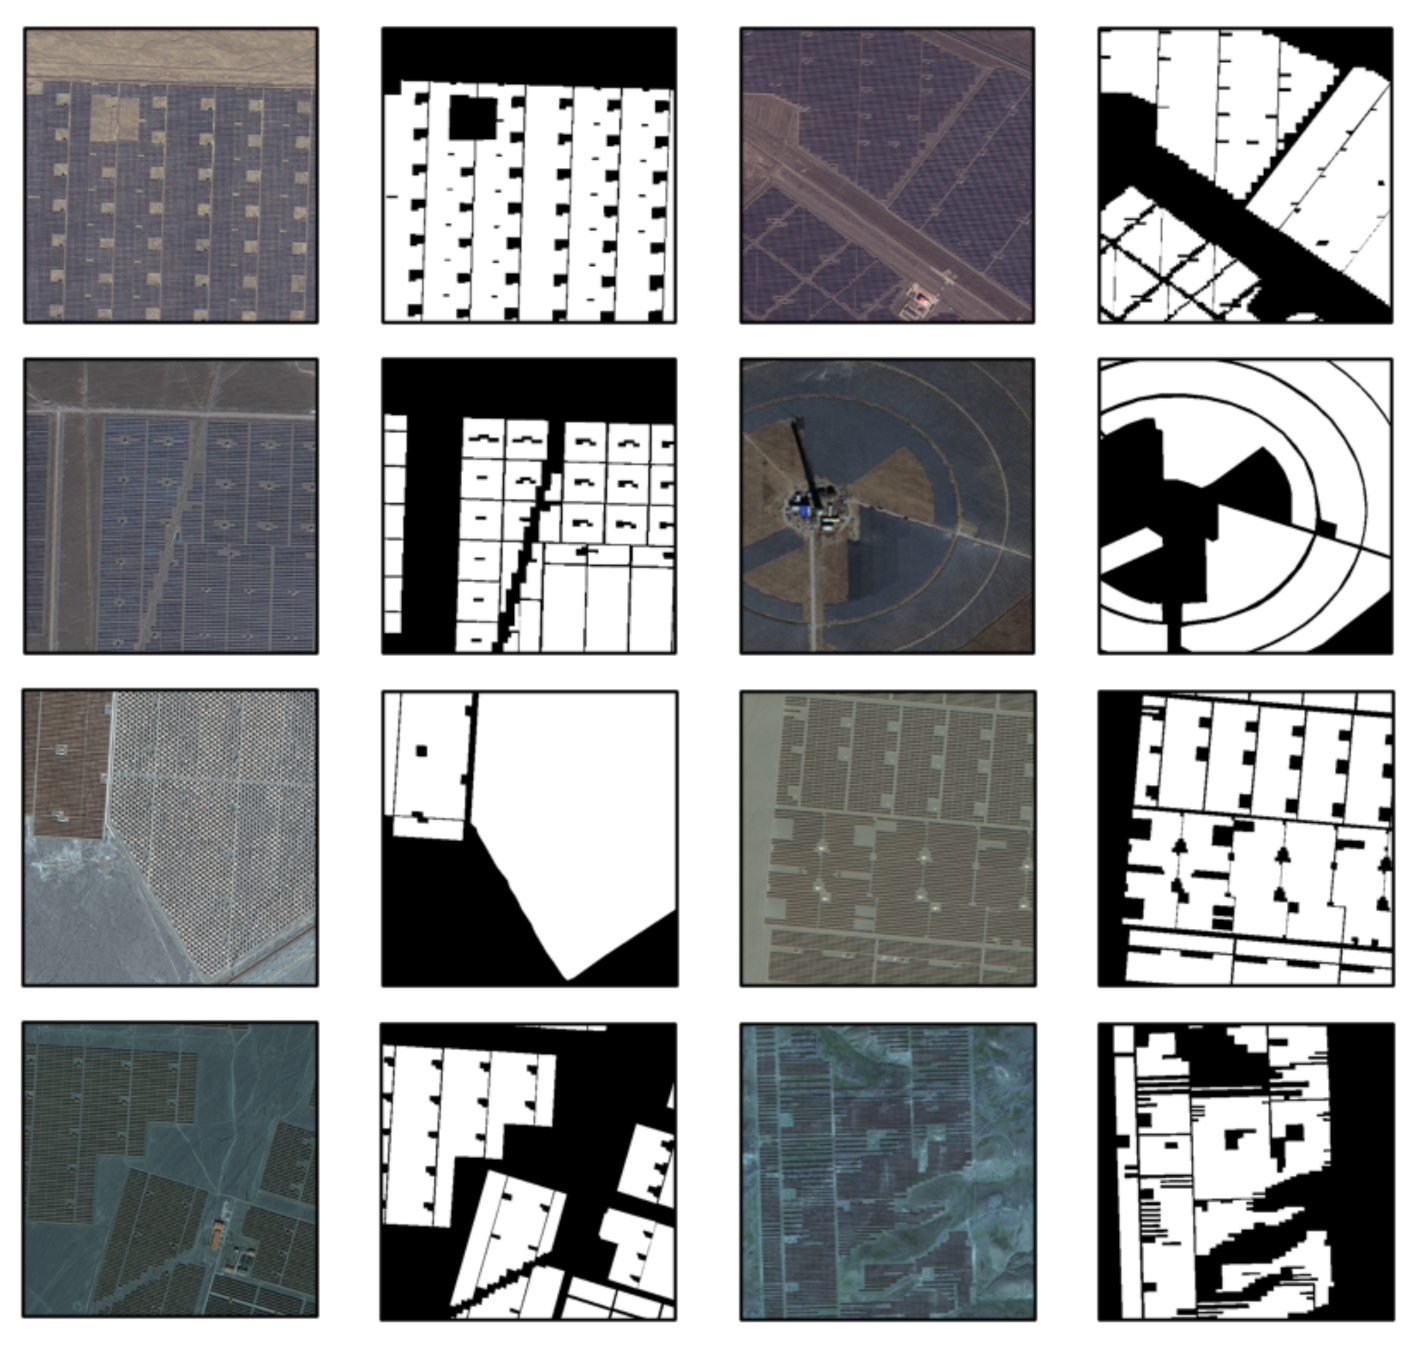
The second step is dataset construction, as mentioned in
Section 2. Based on images with a spatial resolution of 16 m, a scene classification dataset is constructed. The dataset includes two types of areas, including photovoltaic samples and areas without photovoltaic samples; based on images with a spatial resolution of 2 m, a semantic segmentation dataset is constructed. The pixels in the dataset are divided into photovoltaic pixels and non-photovoltaic pixels.
The third step is to classify scenes with or without photovoltaic panels based on 16-m spatial resolution remote sensing images. In order to quickly locate the spatial information of the centralized photovoltaic panels and greatly reduce the scope of the study area, a scene classification model, such as the EfficientNet-b5 model, is trained based on the scene classification dataset. The model is based on a model trained on tens of millions of ImageNet datasets. The input to the model is a 16-m spatial resolution image, and the output of the model is the geographical range of the area that contains or may contain photovoltaic panels. The output geographic range is saved as a shape file through a script file written in advance.
The fourth step is to accurately identify photovoltaic panels based on 2-m spatial resolution remote sensing images. A semantic segmentation model such as the U2-Net model is trained based on the semantic segmentation dataset. According to the geographic range output in step three, we directly read the high-resolution remote sensing image of the corresponding area. The input to the model is two-meter resolution images of the area that contains or may contain photovoltaic panels, and the output of the model is the exact extraction result of the photovoltaic panels.
This framework enables fast and precise extraction of centralized photovoltaic panels in a large-scale area.
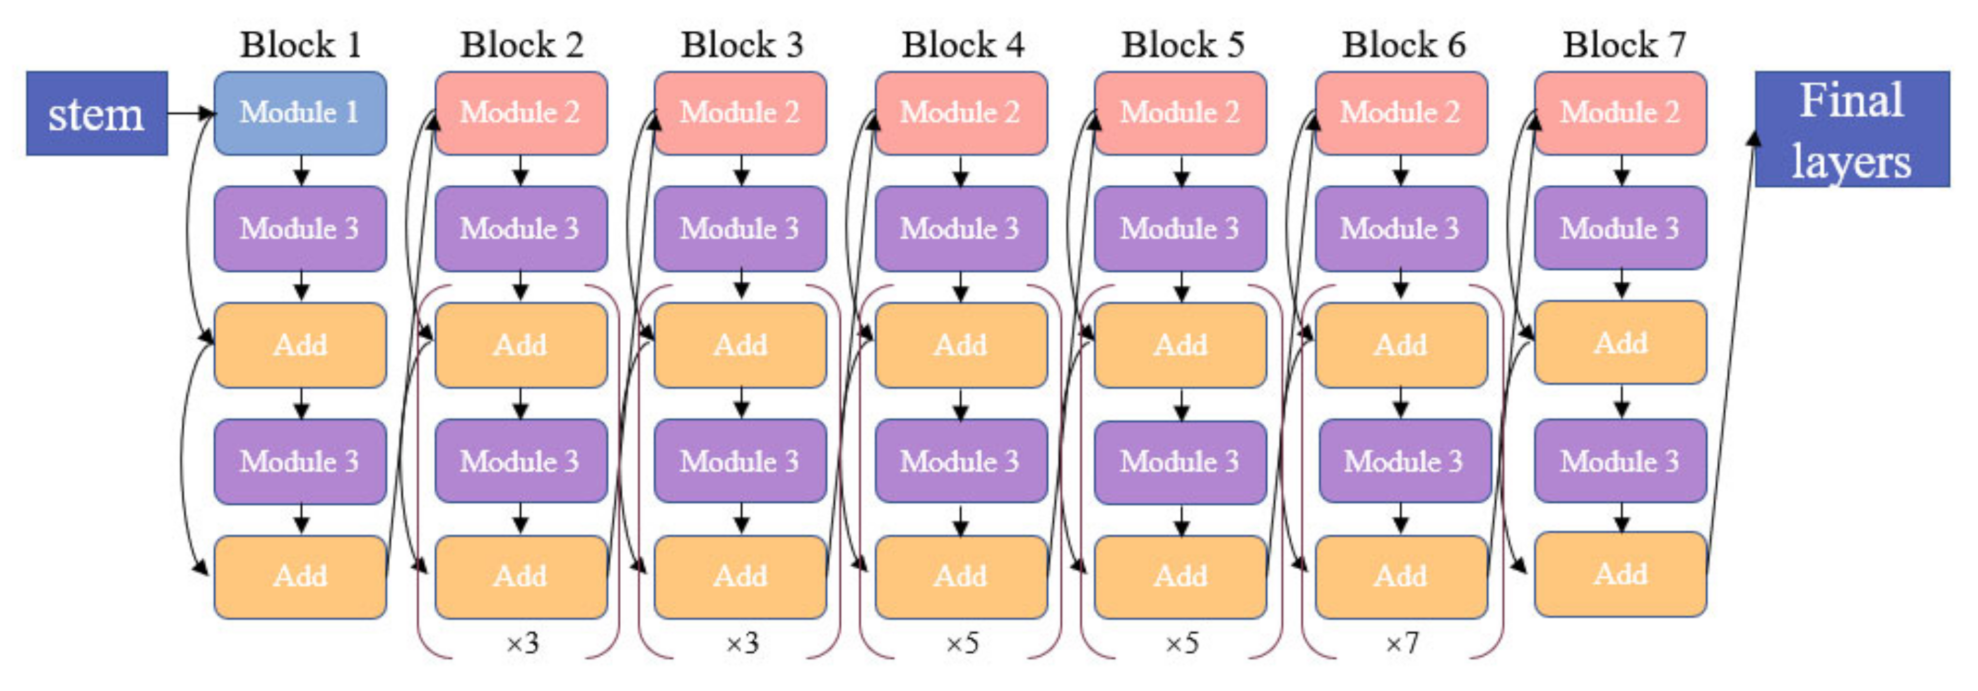
3.1. EfficientNet
EfficientNet is a new network model proposed by Tan et al. in 2019 [
28]. The main innovation of EfficientNet is to improve the accuracy of the model through model scaling. The backbone network of the model uses MBCConv in MobileNet V2 [
29] and uses the squeeze and excitation method in SENet [
30] to optimize the network structure. The model uses grid search to balance the scaling ratios of the three dimensions of network width, depth, and resolution to obtain higher accuracy and efficiency. Tan et al. obtained the B1-B7 network by extending the baseline network, and applied the series network of EfficientNet to ImageNet dataset. Comparing the series of EfficientNet networks with classic networks such as ResNet [
31], DenseNet [
32], etc., EfficientNet rapidly improves accuracy without a significant increase in the number of parameters. Therefore, the effect of the EfficientNet model is far better than other classical models. Considering the influencing factors such as model accuracy, efficiency, computing power, etc., the EfficientNet-B5 model with relatively high accuracy and relatively few parameters is used in this experiment to locate the spatial information of photovoltaic panels. Its network structure is shown in
Figure 6.
3.2. U2-Net
The U
2-Net is a simple and powerful deep network architecture for salient object detection proposed by Qin et al. in 2020 [
33]. The model structure is a two-layer nested U-shaped structure, which is upgraded and improved on the basis of the U-Net network [
17]. The Residual U-shaped module (RSU) included in the U
2-Net network is able to capture multi-scale deep features.
The double-nested U-shaped structure of U2-Net has two significant advantages: First, the RSU module included in the model mixes receptive fields of different sizes, which can capture more and richer contextual information at different scales; Second, although the model increases the depth of the network, the entire model architecture does not significantly increase the computational cost due to the pooling operation used in the RSU module.
Considering the influencing factors such as model accuracy and calculation cost, the U
2-Net model is used in this experiment to accurately identify photovoltaic panels, and its network structure is shown in
Figure 7.
3.3. Accuracy Evaluation Method
The rapid identification method for large-scale centralized photovoltaic power plants proposed in this paper is divided into two steps: photovoltaic power plant spatial information positioning and photovoltaic panel accurate identification. Therefore, the accuracy evaluation method of this experiment is also divided into two parts.
For the spatial information positioning process of photovoltaic power plants based on medium-resolution remote sensing images, two indicators, and , are used to evaluate the accuracy. This process is concerned with whether the scenes involving photovoltaics are correctly predicted. Therefore, these two evaluation indicators are aimed at scenes including photovoltaics.
represents the proportion of a category that is correctly classified in the classification results.
represents the proportion of a category that is correctly predicted in reality.
The evaluation process selects part of the study area as the test area. The three result parameters in
Table 3 were obtained by manual interpretation.
The parameter
represents the number of scenes that include photovoltaics both in reality and in the predicted result; the parameter
represents the number of scenes which that do not include photovoltaics in reality but include photovoltaics in the predicted result; and the parameter
represents the number of scenes that include photovoltaics in reality but do not include photovoltaics in the predicted result.
The evaluation indicator can evaluate the prediction accuracy of the model for photovoltaic category. The evaluation index can measure the impact of scene classification on the extraction of photovoltaic panels.
For the accurate identification process of photovoltaic panels based on high-resolution remote sensing images, several evaluation indicators commonly used in semantic segmentation are used to evaluate the accuracy, including Accuracy,
,
, F1, and Intersection over Union (IoU). The above evaluation indicators are all calculated based on the confusion matrix [
34], as shown in
Table 4.
Accuracy indicates the percentage of correctly predicted samples in the total samples. The value ranges from 0 to 1. The larger the value, the better the prediction effect:
indicates the proportion of all the samples predicted to be positive samples, the true label is a positive sample, the value range is 0 to 1, and the larger the value, the better the prediction effect:
indicates the proportion of all samples whose true labels are positive samples that are predicted to be positive samples. The value ranges from 0 to 1. The larger the value, the better the prediction effect:
F1 is the harmonic mean of
and
, ranging from 0 to 1. The larger the value, the better the prediction effect:
IoU represents the ratio of the intersection and union between the prediction result of a certain category and the real label. The value ranges from 0 to 1. The larger the value, the better the prediction effect:
4. Experimental Process and Result Analysis
4.1. Parameter Setting of Scene Classification Experiment
The first layer of the hierarchical information extraction method is to use the deep learning scene classification EfficientNet-B5 model to locate the photovoltaic power plants on medium-resolution remote sensing images.
We implemented our network on the PyTorch [
35] framework and executed it on a 64-bit Ubuntu 20.04 computer with 12 GB memory NVIDIA TITAN V. This experiment uses the EfficientNet-B5 model pre-trained on the tens of millions of ImageNet datasets [
36]. The input and output layers of the model are modified to make the model suitable for eight-band image input and binary classification output. A total of 22,025 samples with a 128 × 128 pixel size are randomly divided into the train set, validation set and test set input model in a ratio of 7:1:2. In this work, we use the stochastic gradient descent (SGD) optimizer with an initial learning rate of 0.005, a momentum of 0.9, and a weight decay of 0.0001. The experiment adopts a fixed-step size-decay strategy [
37] for the learning rate parameter; the learning rate is changed to 0.1 times the original every 30 epochs, and a total of 100 epochs are trained. During the model training process, the accuracy of the validation set reached a maximum of 99.97%, and the model was saved for prediction. A large-scale image is input into the model in the form of a fixed window sliding, and finally the areas containing the photovoltaic panels are obtained.
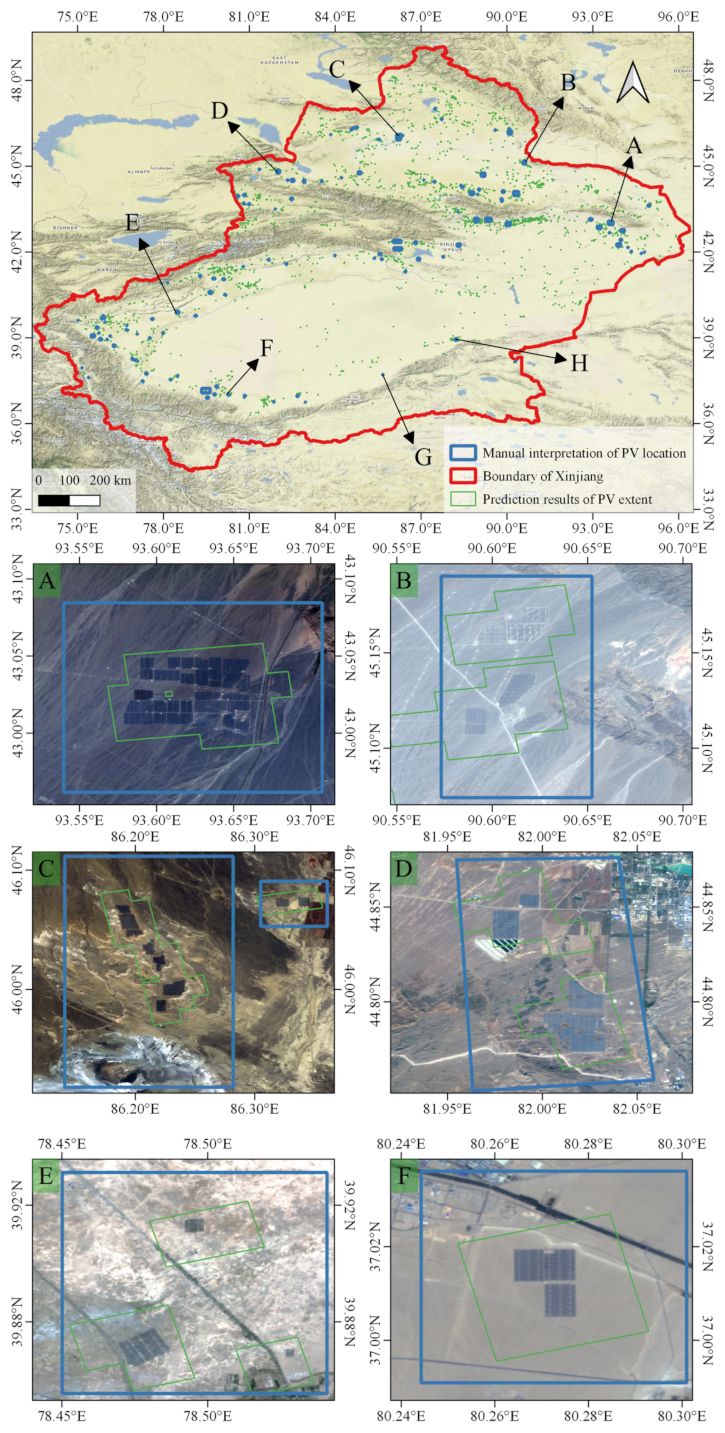
4.2. Scene Classification Results and Analysis
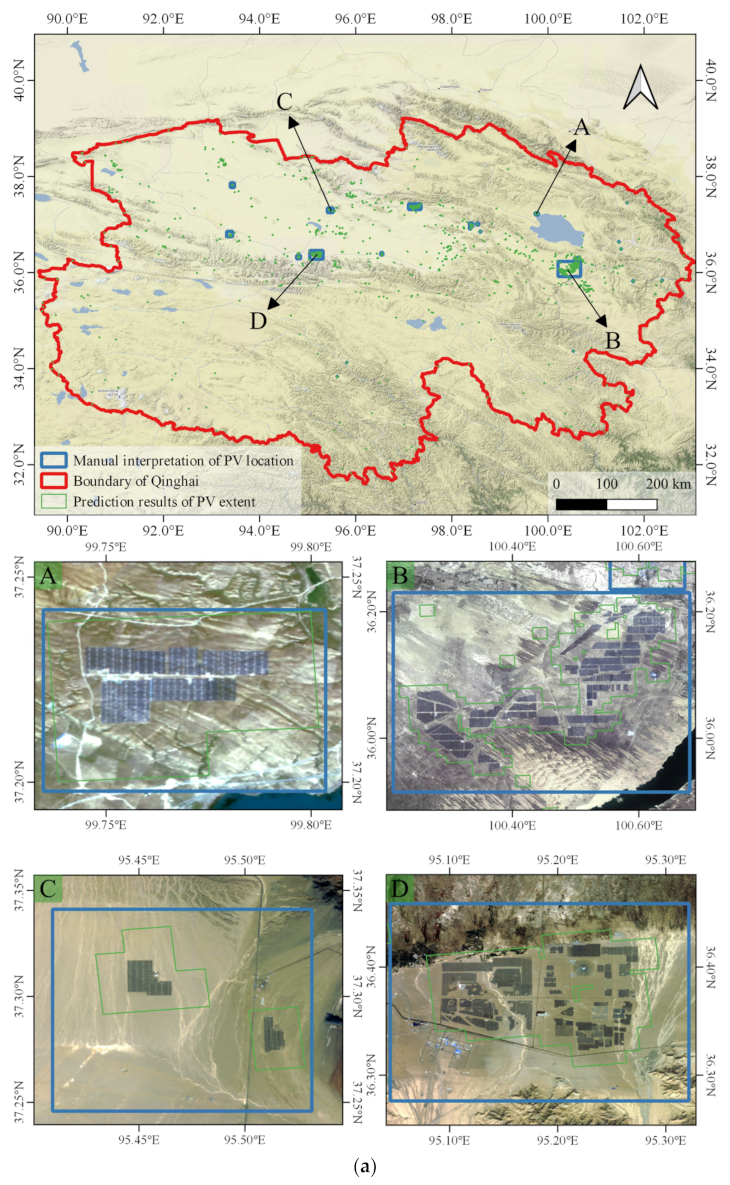
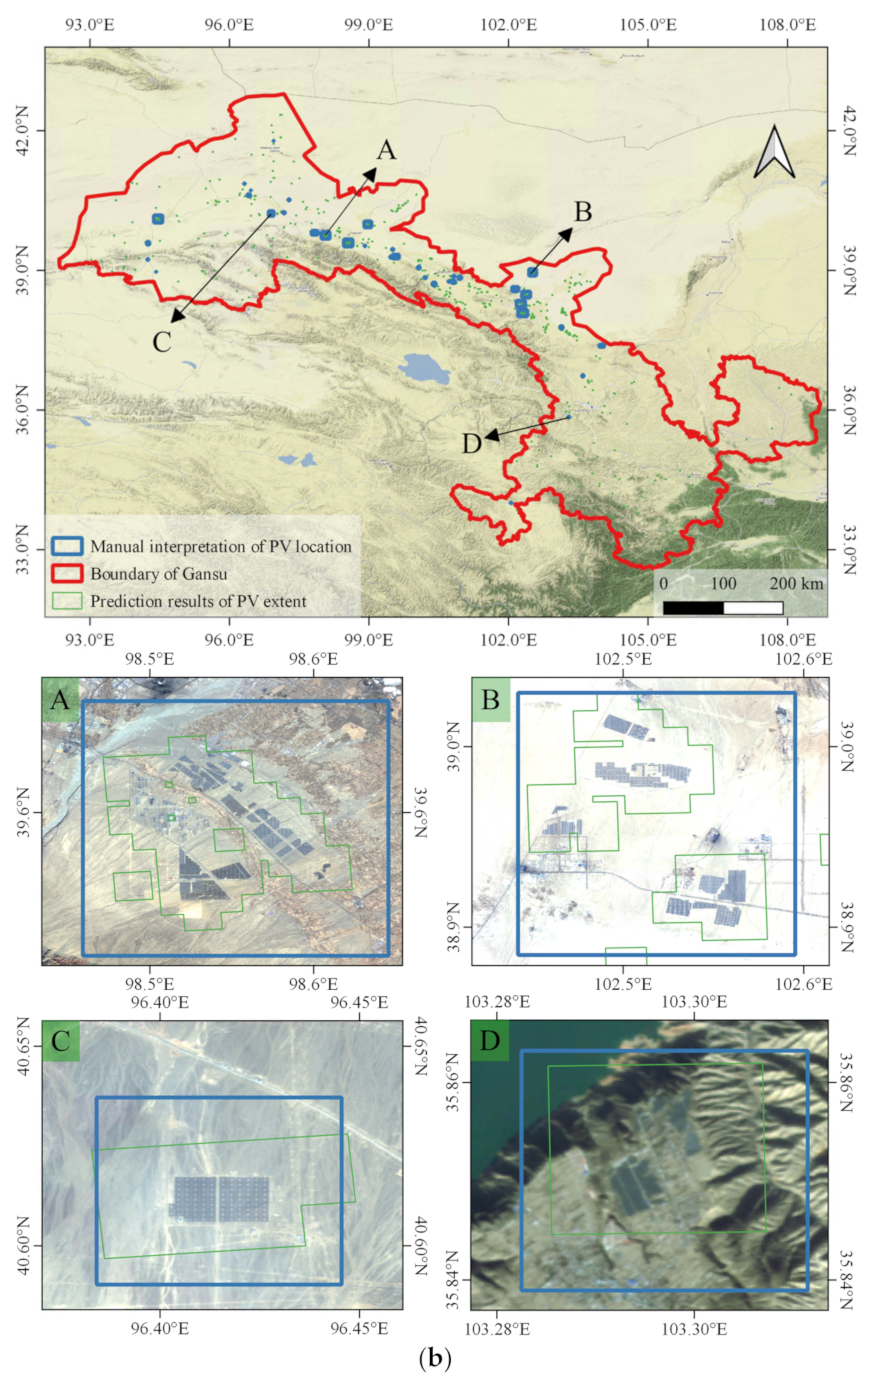
The spatial information positioning results of the photovoltaic power plants in Qinghai Province, Gansu Province and Xinjiang Uygur Autonomous Region are shown in
Figure 8a,
Figure 8b, and
Figure 8c, respectively.
The red vector range is the provincial administrative boundary of each province, the blue vector range is the visually interpreted area containing photovoltaic panels and only represents a rough positioning, and the green vector range is the area predicted by the model or suspected to contain photovoltaic panels. The purpose of this step is to locate the spatial information of the photovoltaic panels and to reduce the false negatives of the photovoltaic panels on the basis of ensuring that the photovoltaic panels are not missed.
In Qinghai Province, a total of 18 photovoltaic power plants were input into the model as the training dataset, and the model detected a total of 22 photovoltaic power plants, of which the number of undetected photovoltaic power plants in the training dataset was 0. In Gansu Province, a total of 36 photovoltaic power plants were input into the model as the training dataset, and the model detected a total of 44 photovoltaic power plants, of which the number of undetected photovoltaic power plants in the training dataset was 0. Finally, in Xinjiang Uygur Autonomous Region, a total of 88 photovoltaic power plants were input into the model as the training dataset, and the model detected a total of 118 photovoltaic power plants, of which the number of undetected photovoltaic power plants in the training dataset was 0.
Gansu Province was selected as the test area in this experiment, and the scene classification results in Gansu Province were visually interpreted. Through manual interpretation, there are 1029 scenes predicted by the model to include photovoltaics in Gansu Province. There are 549 scenes that actually contain photovoltaics in the prediction results and 480 scenes that do not contain photovoltaics. It is worth mentioning that the forecast results include all photovoltaics in Gansu Province.
The evaluation index is 100%, indicating that all photovoltaic power plants in Gansu Province have been detected, and there is no effect on the precise identification steps of photovoltaic panels; the evaluation index is 54.3%, indicating that under the premise of excluding non-PV scenes to a large extent, the accuracy rate of the prediction results is still more than half.
This paper demonstrates the feasibility of the method through experiments. This method largely eliminates areas without photovoltaic panels and largely preserves areas where photovoltaic panels are present. Therefore, this method can be used for practical promotion and application.
4.3. Parameter Setting of Semantic Segmentation Experiment
The second layer of the hierarchical information extraction method is to use the deep learning semantic segmentation U2-Net model to extract the photovoltaic panels precisely on high-resolution remote sensing images.
We implemented our network on the PyTorch [
35] framework and executed it on a 64-bit Ubuntu 20.04 computer with a 12 GB-memory NVIDIA TITAN V. This experiment uses the double-nested U
2-Net model. In total, 10,000 pairs of 512 × 512 pixel size samples with a spatial resolution of 2 m were randomly divided into a training set, validation set and test set input model in a ratio of 16:5:5. In this work, we use the stochastic gradient descent (SGD) optimizer with an initial learning rate of 0.001, a momentum of 0.9 and a weight decay of 0.0001. The experiment adopts a fixed-step-size decay strategy [
37] for the learning rate parameter; the learning rate is changed to 0.5 times the original every 20 epochs, and a total of 100 epochs are trained. During model training, the highest accuracy on the validation set was 97.415%, and the model was saved for prediction. The small-scale two-meter spatial resolution image including the photovoltaic panel area is input into the model, and the precise distribution of the photovoltaic panels is finally obtained.
4.4. Semantic Segmentation Results and Analysis
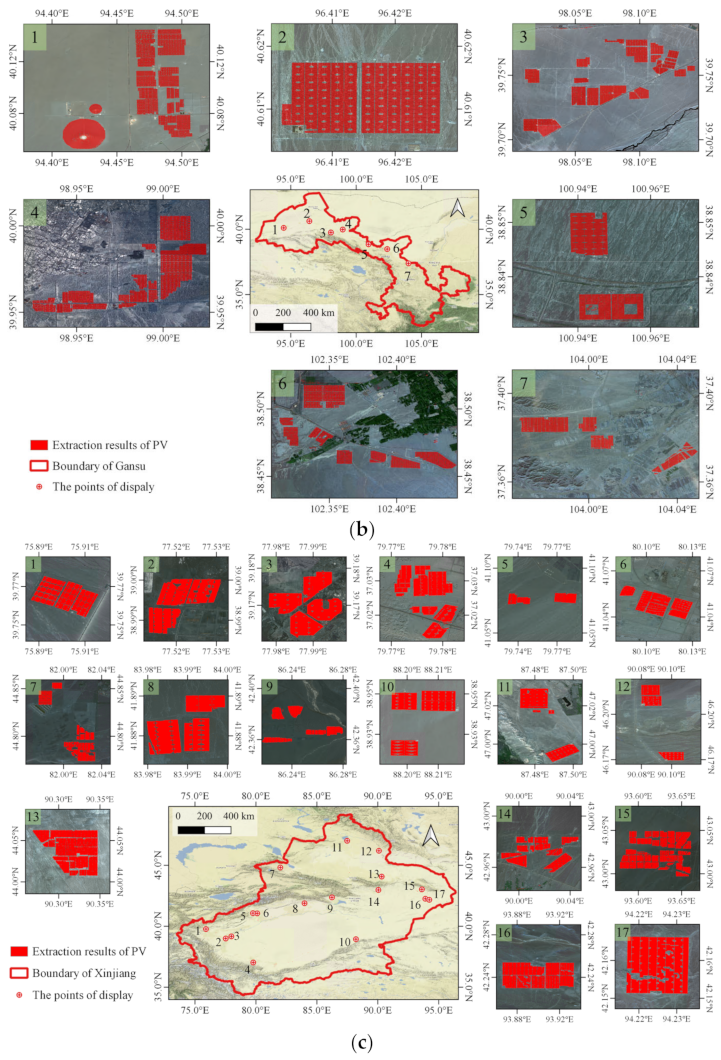
The precise extraction result of the photovoltaic panels in Qinghai Province, Gansu Province and Xinjiang Uygur Autonomous Region are shown in
Figure 9a,
Figure 9b, and
Figure 9c, respectively:
The red vector range is the provincial administrative boundary of each province, and the red grid range is the result of the precise extraction of photovoltaic panels. The performance of the model on the test set is shown in
Table 5. The extraction results of the centralized photovoltaic power plants in this experiment can provide data support for the estimation of photovoltaic power generation, the macro-control of the photovoltaic industry, and national decision-making.
The overall accuracy of the model on the test set is 97.686%. This method realizes high-precision and rapid extraction of photovoltaic panels in a large area.
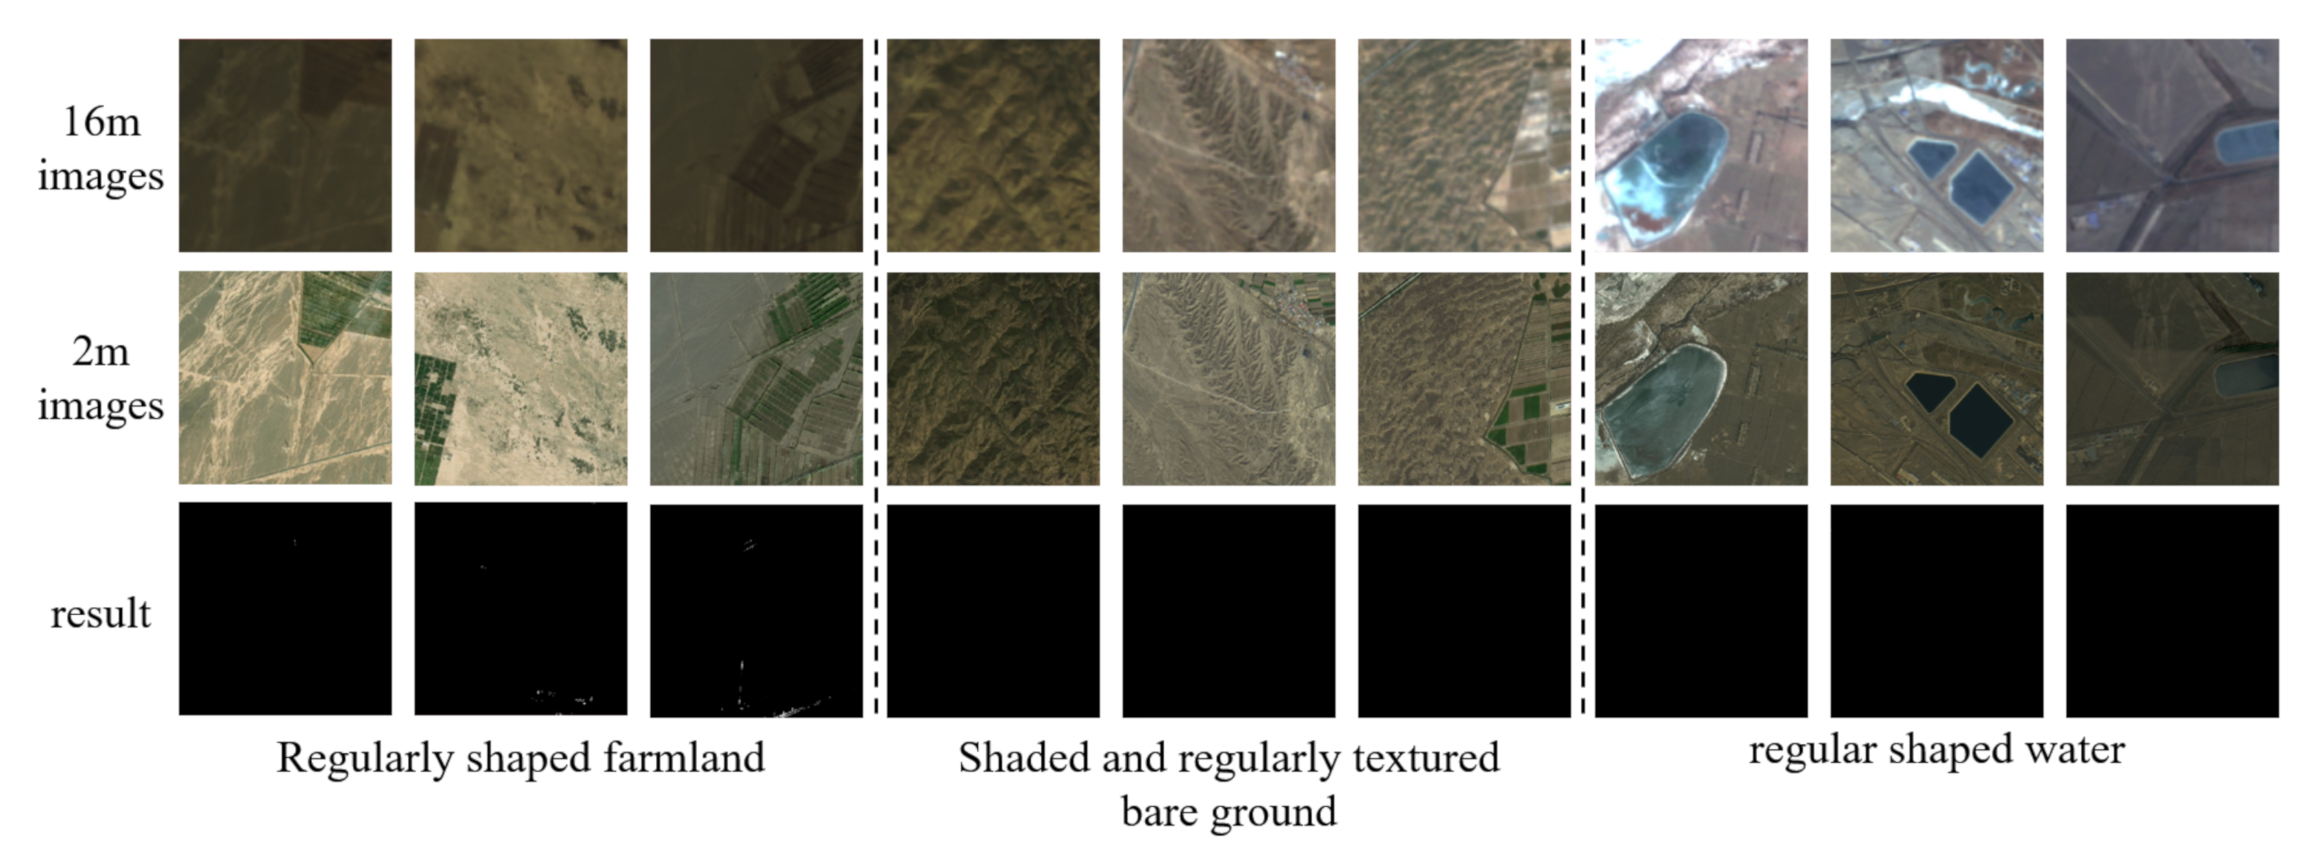
In the process of scene classification based on remote sensing images with a spatial resolution of 16 m, there are some confusion classes, including regularly shaped farmland, shaded and regularly textured bare ground, and regular shaped water. However, these confusion classes are almost eliminated in the second step, semantic segmentation, of the proposed method.
Three main classes that are easily misclassified as scenes containing photovoltaic panels are shown in
Figure 10. The first row of images are scenes that were mistaken for containing photovoltaic panels in the 16-m spatial resolution remote sensing image; the second row of images are the 2-m spatial resolution remote sensing images corresponding to the first row of images; the third row of images are extraction results.
Additionally,
Section 4.5 of this paper will verify the superiority of the method proposed in this paper in terms of accuracy and efficiency through two sets of comparative experiments.
4.5. Comparative Experiments
In order to prove the superiority of the method proposed in this paper, two sets of comparative experiments are designed.
First, in order to demonstrate the superiority of the method proposed in this paper in terms of accuracy, the method proposed in this paper is compared with four classical methods including DeepLabV3+, U-Net, SegNet, and FCN8s to conduct comparative experiments on the same dataset. The dataset is divided into a training set, validation set, and test set according to the ratio of 16:5:5. The quantitative results of the five methods on the test set are shown in
Table 6.
It can be seen from the data in
Table 6 that the hierarchical information extraction method proposed in this paper has the highest accuracy. F1 is the index for comprehensive evaluation of
and
, and the method proposed in this paper also has the highest F1. IoU is typically reported as the top-level performance of a semantic segmentation model, and the method proposed in this paper still has the highest IoU.
Therefore, the hierarchical information extraction method has superiority in accuracy in large-scale photovoltaic identification tasks.
Second, in order to demonstrate the superiority of the method proposed in this paper in terms of efficiency, Gansu Province was selected as the test area for comparative experiments. Five methods, including the method proposed in this paper, FCN8s, SegNet, U-Net, and DeepLabV3+, were used to identify photovoltaic panels in Gansu Province. The time taken by each method is shown in
Table 7.
It can be seen from
Table 7 that the method proposed in this paper takes the shortest time of 7.317 h and has the highest efficiency. The shortest time of the other four methods is 12.333 h for FCN8s; the longest time of the other four methods is 28.733 h for DeepLabV3+. Compared with the FCN8s, the method proposed in this paper improves the efficiency by 40.7%.
Therefore, the hierarchical information extraction method has superiority in time in large-scale photovoltaic identification tasks.
5. Conclusions
This study proposed a hierarchical information extraction method for large-scale centralized photovoltaic power plants based on multi-source remote sensing images. This method takes full advantage of the characteristics of remote sensing images with different spatial resolutions. Firstly, the spatial information positioning of photovoltaic panels is quickly realized in the remote sensing image with a spatial resolution of 16 m. The advantages of this step are as follows: (1) The area that does not contain photovoltaic power plants is greatly reduced, the number of positive and negative targets is balanced, and the impact of the imbalance of positive and negative samples on the precise extraction of photovoltaic panels is reduced. (2) The input range of high-resolution remote sensing images is greatly reduced, the waste of resources is avoided, and the efficiency and accuracy of the identification of photovoltaic panels are improved. Secondly, the accurate identification of photovoltaic panels is realized in remote sensing images with a spatial resolution of 2 m. This step can assist the refined management of large photovoltaic power plants and provide data and information support for the country to make relevant decisions and global sustainable development.
This study realizes the distribution mapping of large-scale and high-resolution centralized photovoltaic power panels based on experiments in three northwestern Chinese provinces.
In summary, clean energy such as solar energy plays an important role in the era of sustainable development. Accurately obtaining the location, spatial distribution, and area information of photovoltaic power plants is of great significance for optimizing the energy structure and rationally exploiting non-renewable energy. Remote sensing provides a new way to objectively and impartially obtain the production capacity of photovoltaic power plants through non-contact, long-distance, and large-scale measurements. The hierarchical information extraction method for centralized photovoltaic power plants based on multi-source remote sensing images is effective in large-scale range. Finally, it will definitely provide technical support for related industries and can be popularized and applied.


 ,
, 


