1. Introduction
Visible Infrared Imaging Radiometer Suite (VIIRS) Environmental Data Records (EDR) Imagery is a Priority One product that is generated from VIIRS Sensor Data Records (SDRs), and is remapped to a fixed Ground Track Mercator (GTM) grid. This remapping eliminates overlapping pixels and apparent gaps in un-remapped SDR Imagery due to the pattern of “bowtie deletions” unique to the VIIRS instrument [
1], re-grids the data onto a constant spatial resolution grid, and provides an EDR Imagery product that is easier to use compared to un-remapped SDR Imagery. While for most bands the SDR and EDR radiances or reflectances are the same, for the Day/Night Band (DNB) the SDR is processed into Near Constant Contrast (NCC) Imagery, a user-friendly dynamically-scaled product whose upkeep is the responsibility of the EDR Imagery Team.
Major advantages of VIIRS polar-orbiting imagery over geostationary imagery are its higher spatial resolution, its more frequent and better coverage of high-latitude and polar regions, and its global coverage. Understood disadvantages of polar-orbiting imagery are lower temporal resolution at mid to low latitudes within the geostationary field of regard. In practice, the polar-orbiting and geostationary satellite assets are used in a complementary way to provide maximum benefit to end-users with varying needs across the globe.
Many applications of VIIRS imagery have been realized since its inception, including in the topics of: Ocean Color [
2], Sea Surface Temperature [
3], Sea Ice [
4], Snow Cover [
5], Land Surface Temperature [
6], Vegetation [
7], Aerosols [
8], Wildfires [
9,
10], Clouds [
11], and Volcanic Eruptions [
12], among others. Numerous applications of the DNB and NCC have also been documented [
13,
14,
15,
16,
17].
VIIRS imagery validation starts with the pre-launch preparations leading up to the checkout of first-light imagery available soon after the launch of each Joint Polar Satellite System (JPSS) satellite [
18,
19]. This initial validation period is nearly coincident with the validation of VIIRS SDR radiances and reflectances, with imagery as the first of many EDRs to be validated. Longer-term imagery validation continues throughout the operational life of each VIIRS instrument. Imagery quality is scrutinized, looking for any of the typical imagery problems such as noise (including static/electronic cross-talk and stray-light), striping, banding, pixel drop-outs, and the overall ability to utilize VIIRS imagery for analysis and forecasting purposes.
The VIIRS EDR Imagery Team was involved in four major ground system software code changes. The first code change was needed when NCC Imagery was at first not being routinely generated from the DNB for all nighttime scenes. This was due to the fact that the DNB-to-NCC look-up-table (LUT) was originally developed based on the assumption that the DNB performance would be similar to the Operational Linescan System (OLS). However, during post-launch testing of S-NPP VIIRS, it was determined that the DNB is sensitive to radiation over a much broader dynamic range than OLS, requiring redevelopment of the LUT [
20]. Ever since the code change was implemented in 2013, the NCC product has been routinely available for all daytime and nighttime data.
The second major code change was to apply Terrain Correction (TC) to the geolocation data applied to VIIRS EDR Imagery in 2020, using parts of the code that is applied to the VIIRS SDR geolocation files. This change in imagery navigation was requested by imagery users, to be able to better follow fires, nighttime lights, and other surface features in VIIRS imagery that would appear to shift from one orbit to the next or between satellites. The change was particularly impactful to the use of DNB imagery of city lights, which prior to this correction would often appear to shift along-scan between different viewing angles for any cities not located near mean sea level.
The third major code change, implemented in 2021, was needed to fix a banding anomaly with the NCC Imagery, discovered only after years of use because of the subtle nature of the banding. This anomaly was due to an error in the specification of the bi-directional reflectance distribution functions (BRDF) used in the estimation of surface reflectance behavior as a function of satellite/lunar geometry.
The fourth major code change was the increase from 6 M-band EDRs to all 16 M-band EDRs in 2021. A form of true-color and other commonly used multi-band imagery products are now possible from VIIRS EDRs. Prior to this code change, the VIIRS SDRs had to be used (and then mapped) for these high-priority multi-spectral products. As the VIIRS EDRs are already re-mapped to the GTM projection, the code change made these various multi-spectral products more readily accessible to some end-users.
Imagery product generation has been an important duty of the VIIRS EDR Imagery Team from the beginning. These imagery products are typically two or three-band and RGB imagery combinations that are also generated from other multi-spectral operational satellite systems. However, some new products are available only from VIIRS, utilizing bands and band combinations that are not available with other instruments. Typically, imagery products are generated routinely and displayed online in real-time for users to evaluate and provide feedback.
Finally, with National Weather Service (NWS) users primarily in mind, some Imagery products are specifically tailored to be available to NWS regions or offices which collaborate on their evaluation and provide feedback. This tailoring may start with case studies and blogs to show the value of the new imagery products, followed by imagery users acquiring the ability to generate the new product natively and use it in their particular analysis and forecasting situations. Online training materials and live training are also provided to aid NWS users based on the experiences of the Imagery Team in their product generation and applications.
This article summarizes VIIRS EDR Imagery Team activities over the past 10 years, primarily in terms of imagery validation (the major focus of this article), but including imagery product generation and display and imagery user interactions. A visual summary of the team’s general responsibilities is shown in
Table 1. The next two sections will characterize the makeup of the VIIRS EDR Imagery Team and describe how the VIIRS EDR’s differ from SDR’s, respectively.
Section 4 will detail the four major ground system code changes that the team has been involved with, while
Section 5 will highlight Imagery Team activities related to the generation and display of Imagery products. The final section will summarize Imagery Team activities and discuss continuing efforts.
2. VIIRS EDR Imagery Team and Its Interactions
The VIIRS EDR Imagery Team was formed in 2010, during the pre-launch phase for the first of the JPSS series, the Suomi National Polar-Orbiting Partnership (S-NPP). Some of the original Team members were part of Northrup Grumman (NG) Corporation, which developed the ground system and software to produce VIIRS imagery. When NESDIS’ Satellite Applications and Research (StAR) took control of the JPSS Program science and algorithms, the EDR software became the responsibility of the VIIRS Imagery Team. NG personnel (and their sub-contractors at Raytheon Technologies) helped with the software transition to StAR, but then NG phased out after the first few years. Another particularly helpful interaction was that of The Aerospace Corporation, which continued with the Imagery Team for most of the first 10 years, providing the background and historical basis that was helpful in many of the software issues and updates that are covered in this recounting of the Team’s imagery validation efforts.
The majority of current VIIRS EDR Team members are associated with NOAA Cooperative institutes, specifically the Cooperative Institute for Research in the Atmosphere (CIRA) at Colorado State University (CSU), and the Cooperative Institute for Meteorological Satellites Studies (CIMSS) at the University of Wisconsin—Madison. CIRA team members provide varying expertise, including but not limited to VIIRS image display, calibration and validation, imagery and DNB expertise, IT systems and data management, training, and user engagement. CIMSS team members contribute additional VIIRS imagery knowledge, and develop publicly available software packages for displaying VIIRS imagery, including two versions of the Man-computer Interactive Data Access System (McIDAS-X and McIDAS-V) and the Community Satellite Processing Package (CSPP). CSPP is the primary software for producing VIIRS SDR files from Direct Broadcast ground stations [
21].
Other team members provide additional and unique expertise. The US Naval Research Laboratory (NRL)—Monterey was among the first users of VIIRS Imagery, displaying it in real-time on their NexSat website [
22]. NRL contributed to validation by having access to VIIRS, allowing users the lowest latency imagery during that early post-launch period. Since Raytheon Technologies developed much of the EDR version of the Imagery, they have detailed knowledge of the VIIRS code and have been very helpful with code changes. Team members from the Colorado School of Mines also offer a long history of DNB expertise. Representatives of the Geographic Information Network of Alaska (GINA) at the University of Alaska—Fairbanks and of NWS/Alaska contribute a great user perspective, as well as knowledge and widespread use of direct broadcast systems. Finally, federal team members, including members of the Regional and Mesoscale Meteorology Branch (RAMMB) at Colorado State University, provide the team with leadership in addition to knowledge about imagery and imagery users.
3. VIIRS EDR Imagery Compared to VIIRS SDRs
The VIIRS Imagery Team holds responsibility for the validation of the EDR version of VIIRS imagery. This role is distinct from the VIIRS SDRs, which are validated and calibrated by the VIIRS SDR Team [
23]. While the EDR Imagery is a remapped version of the SDR product for most bands, using the same VIIRS radiances and reflectances, the NCC is a unique product, designed specifically for imagery users. Much of the Imagery Team effort revolves around that NCC product in particular. Otherwise, radiance and reflectance issues with the other bands that are discovered by the Imagery Team are shared with the VIIRS SDR Team, which handles those calibration issues and resolves them at the SDR level.
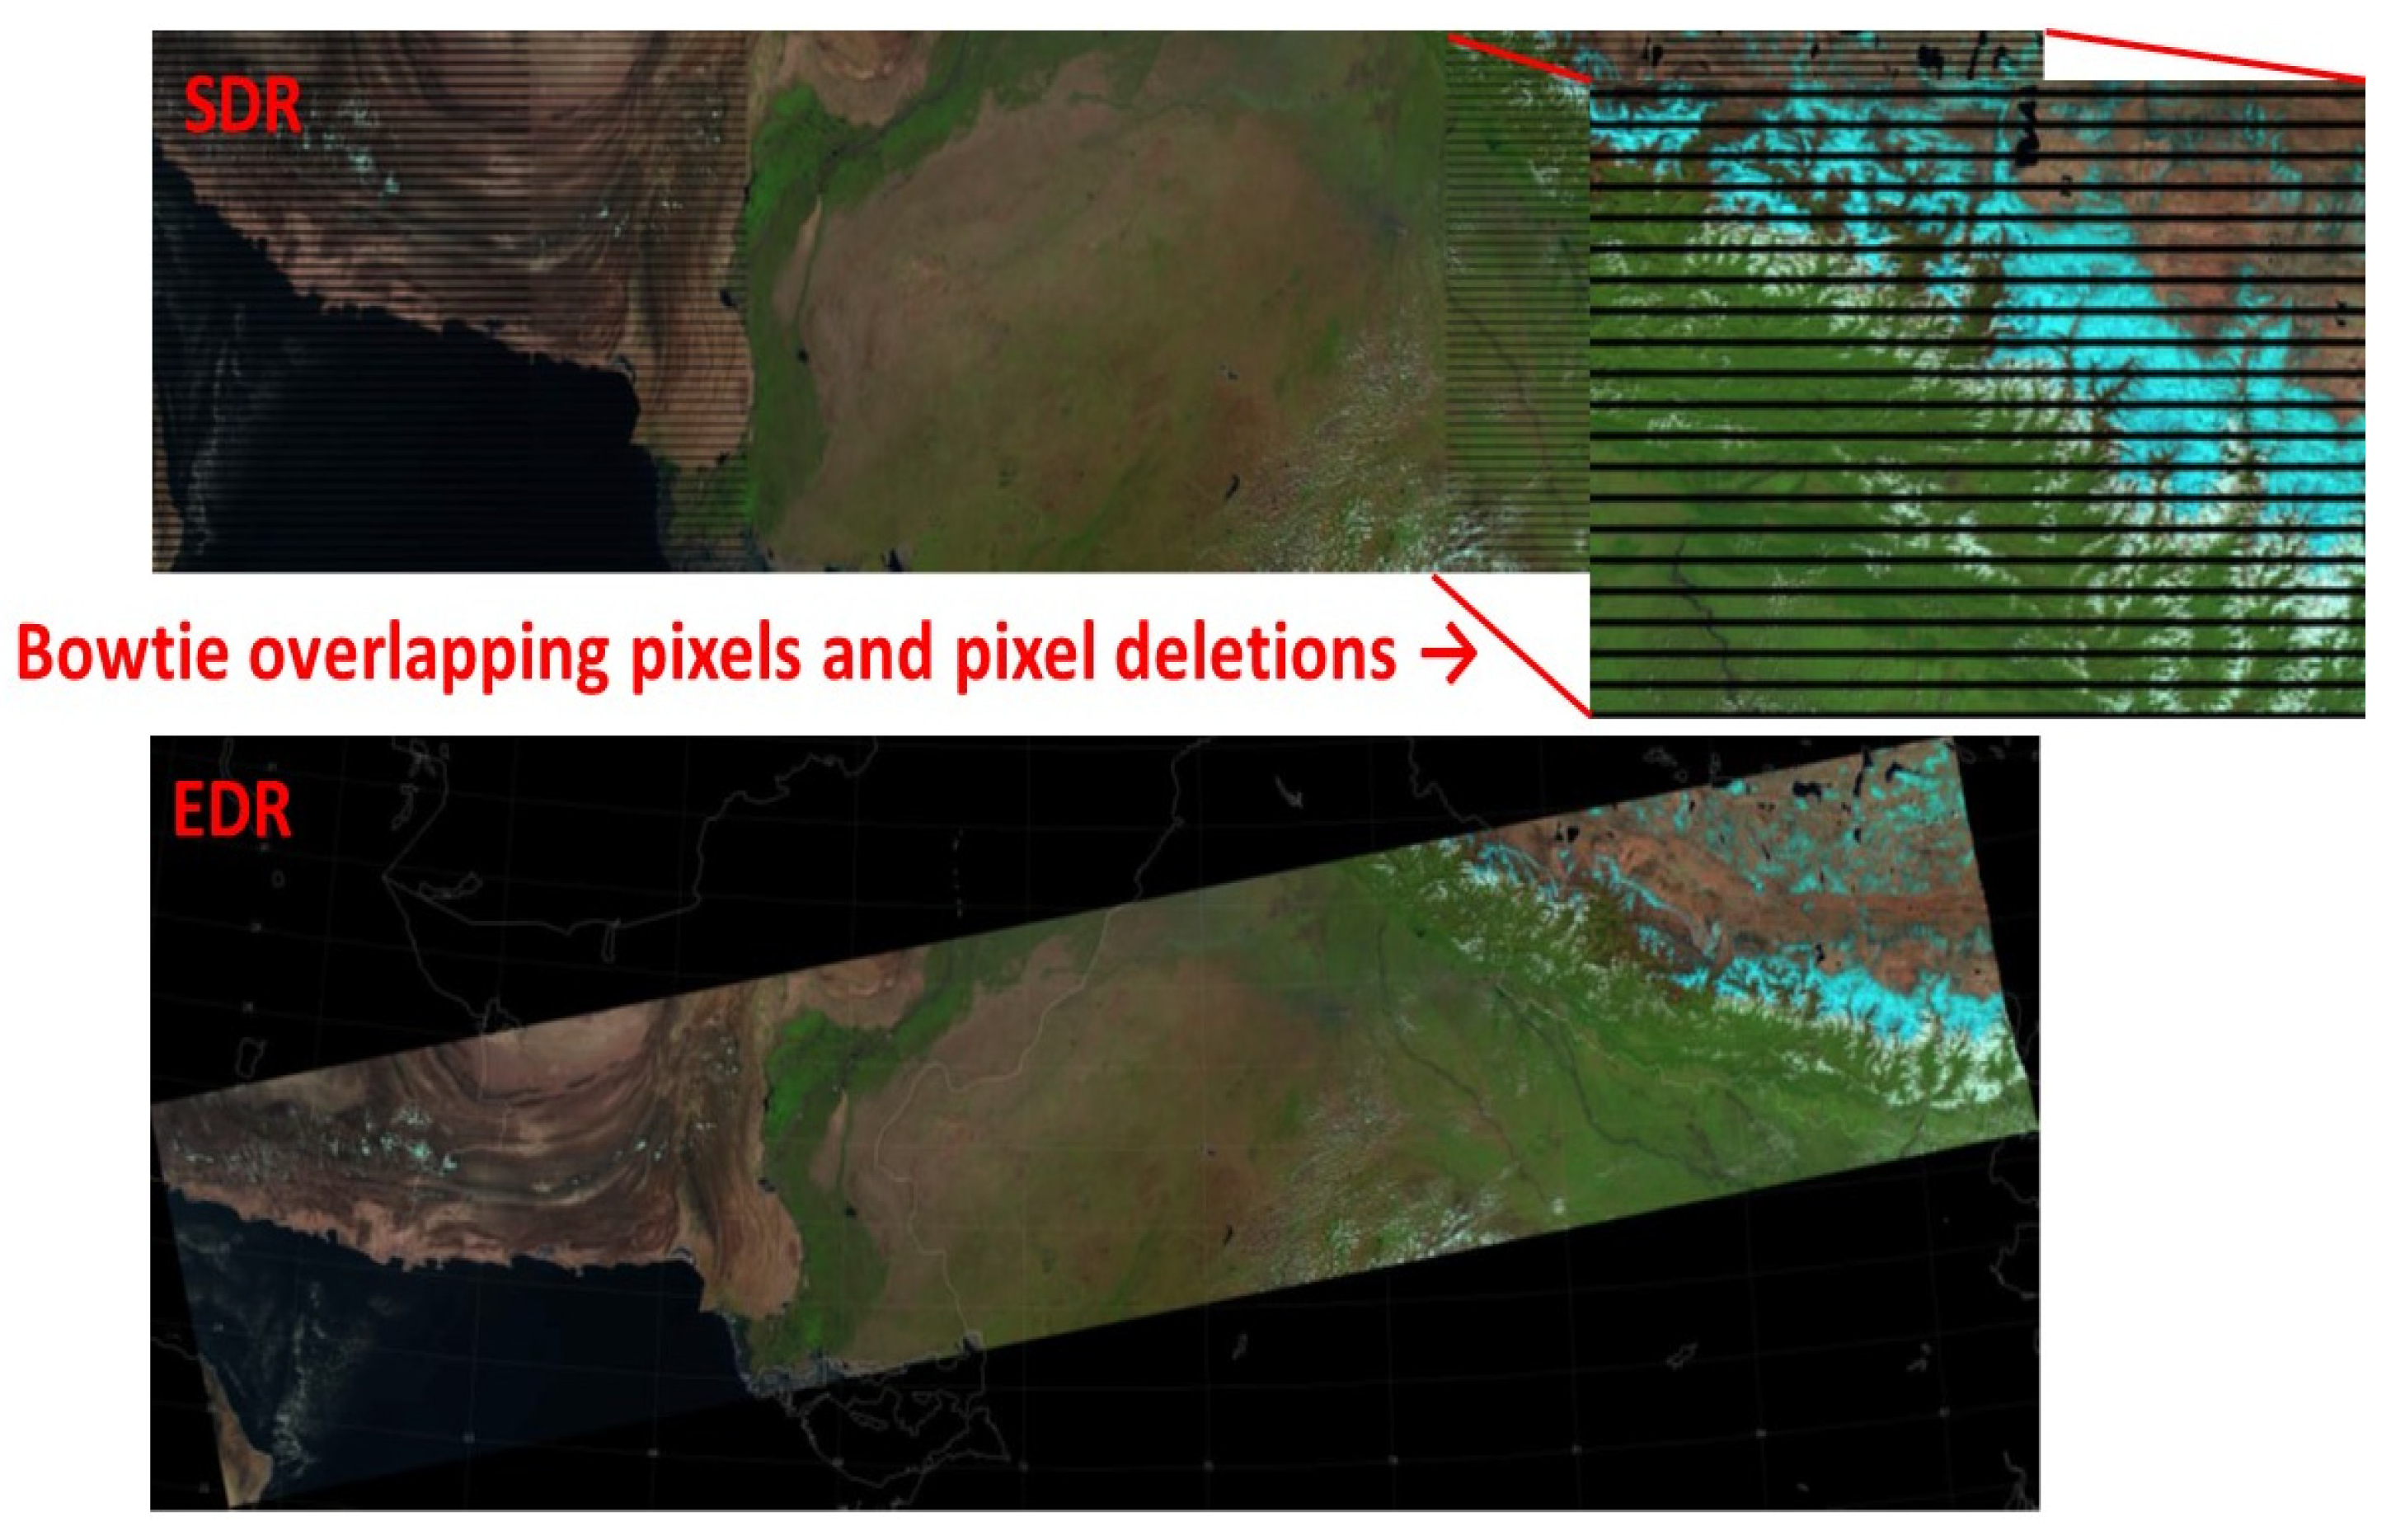
To help explain the main differences between SDR and EDR Imagery,
Figure 1 shows an SDR granule and the associated EDR granule for the ‘natural-color’ image created from the appropriate VIIRS component bands. The main feature of the EDR is the remapping of the data into the GTM projection, which eliminates the pixels that are purposely deleted (so-called “bow-tie” pixels) from the VIIRS SDR because they contain overlapping information. The EDR granule also accounts for any overlap of the remaining SDR pixels, by producing an image in the GTM grid that takes data from only the closest valid SDR pixel to a given GTM grid point. In addition, the remapping to the GTM grid ignores fill values not related to the bowtie overlap, such as the bad detector present in the I3 band on NOAA-20. Otherwise, both the VIIRS I-band and M-bands contain the same radiances and reflectances, with no additional processing other than the GTM remapping.
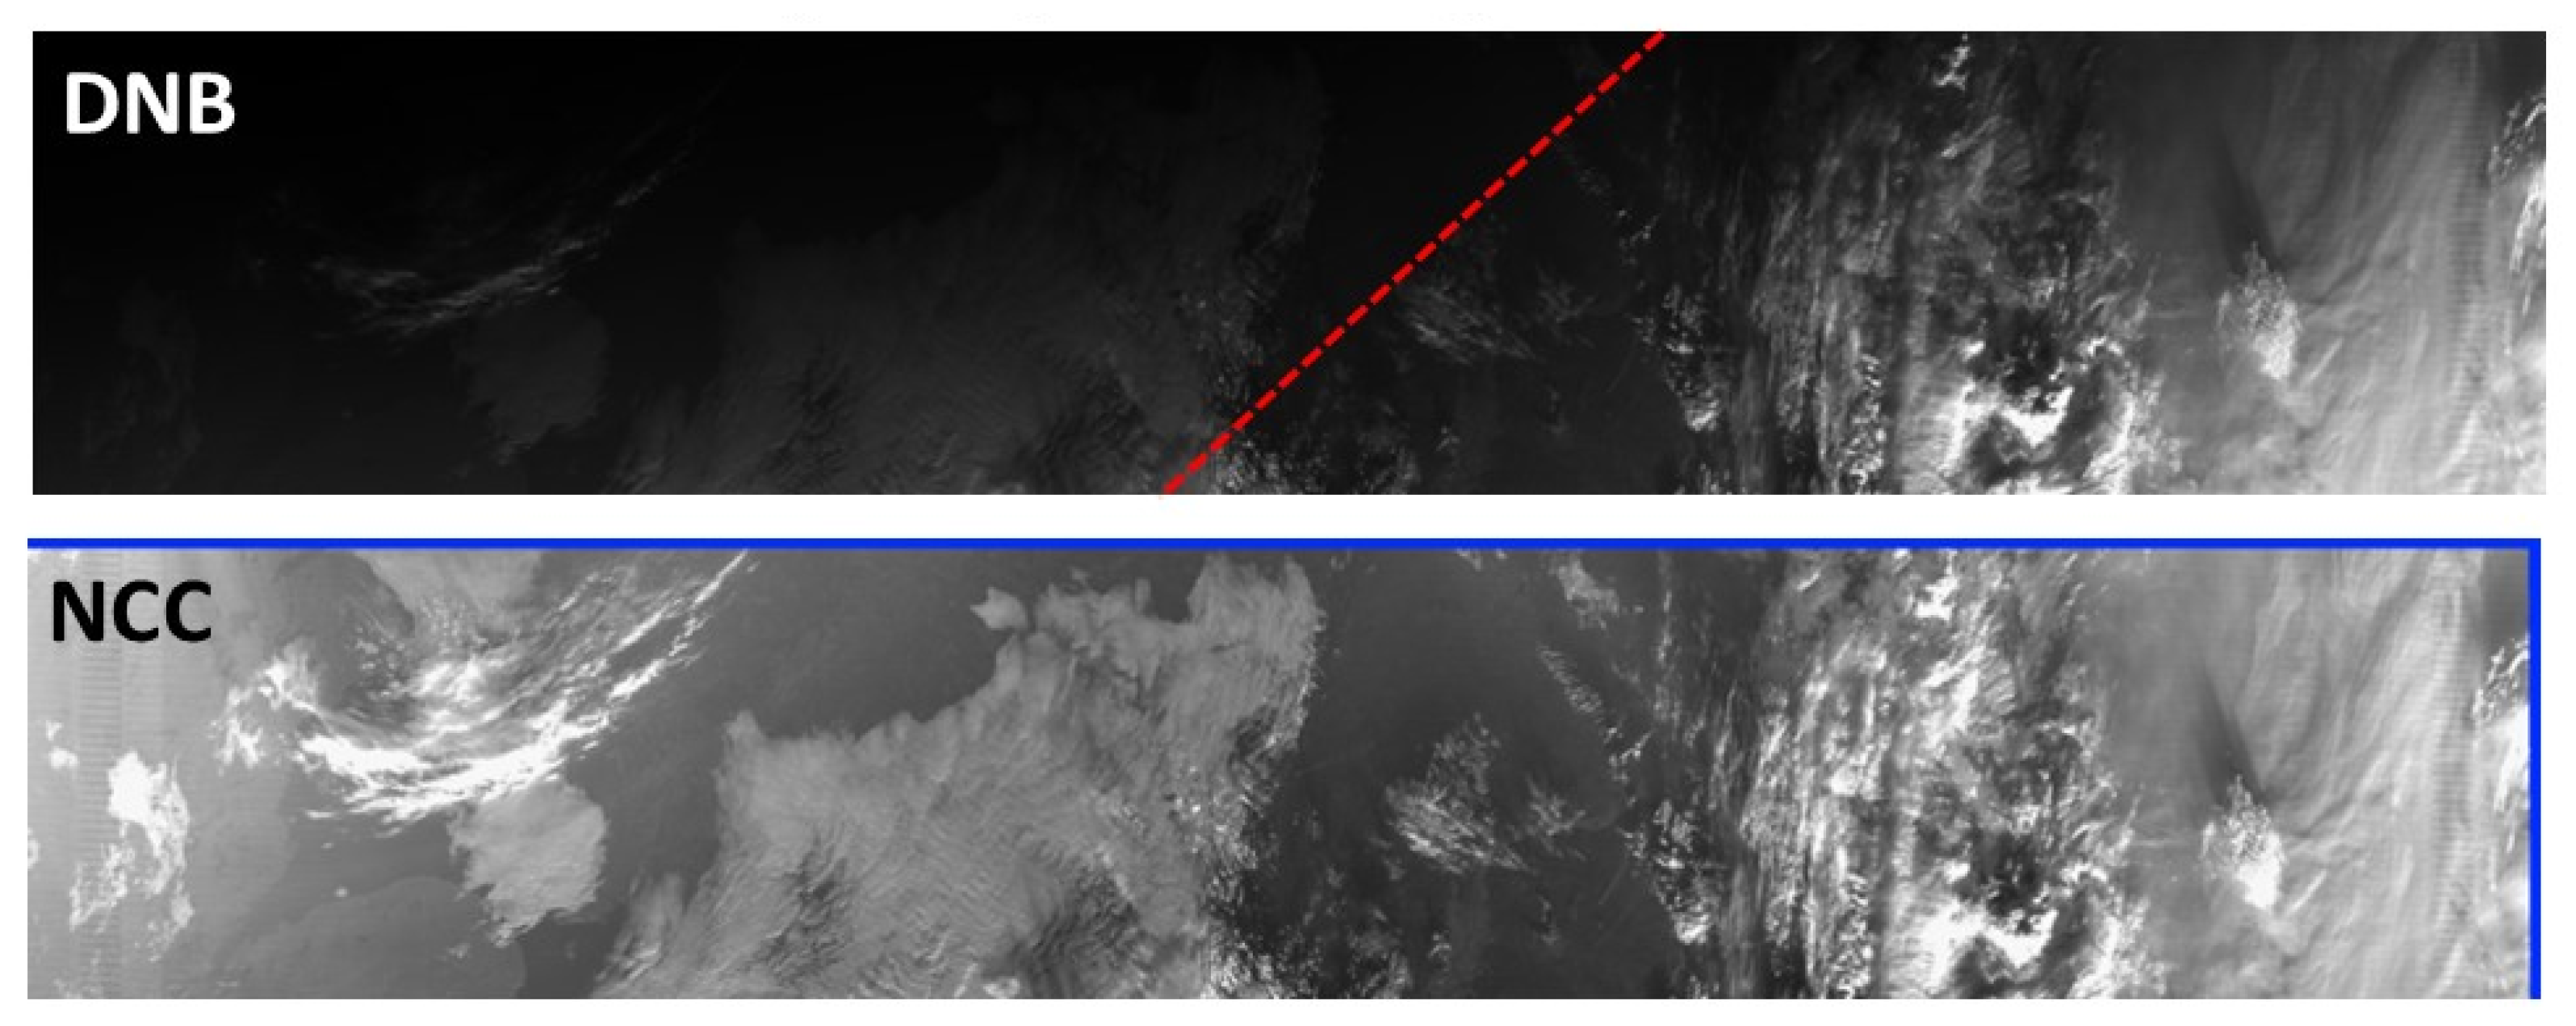
Figure 2 shows the difference between the DNB (SDR) and NCC (Imagery EDR) granules. The NCC is an imagery product that is generated from the DNB and is mapped into the same GTM grid as the other VIIRS I-bands and M-bands. However, unlike the other VIIRS bands, the NCC is compressed from the original radiance units to an albedo-like product to make it easier to display DNB data. The radiance data provided by the DNB may vary by up to seven orders of magnitude in value from no-moon to full-sun conditions, which is difficult to represent in imagery file formats and display software that are limited to 256 gradations of scale [
24]. The NCC algorithm converts this radiance into a pseudo-albedo, scaled using a LUT created specifically for the DNB-to-NCC processing. The example granules in
Figure 2 cross the day-night terminator, showing how the NCC provides an image that normalizes the brightness across the granule compared to a DNB image rendered from the SDR. The NCC granule may still contain up to three orders of magnitude, from the darkest to the brightest pseudo-albedos.
4. VIIRS EDR Imagery Major Code-Change Fixes and Updates
While there have been a large number of small issues with the VIIRS EDR Imagery, the following subsections cover only the four major code changes and updates that the Team has undertaken over the first 10 years of VIIRS operations. The four major code changes are summarized in
Table 2.
4.1. NCC Imagery Initial Fix (2013)
As VIIRS on S-NPP was initially being validated, a large amount of the NCC Imagery was missing or consisted of fill values. These were mostly nighttime cases as well as any areas where the solar or lunar zenith angle was greater than 105°. The cause of this missing data was the original DNB-to-NCC Look Up Table (LUT) that was supplied with VIIRS. NCC Imagery was thought to be too dark to provide imagery of clouds under no-moon conditions. It was then discovered that airglow [
13] provided sufficient light to produce DNB and the NCC product under any lighting conditions.
The fix for this problem was provided by Northrup Grumman [
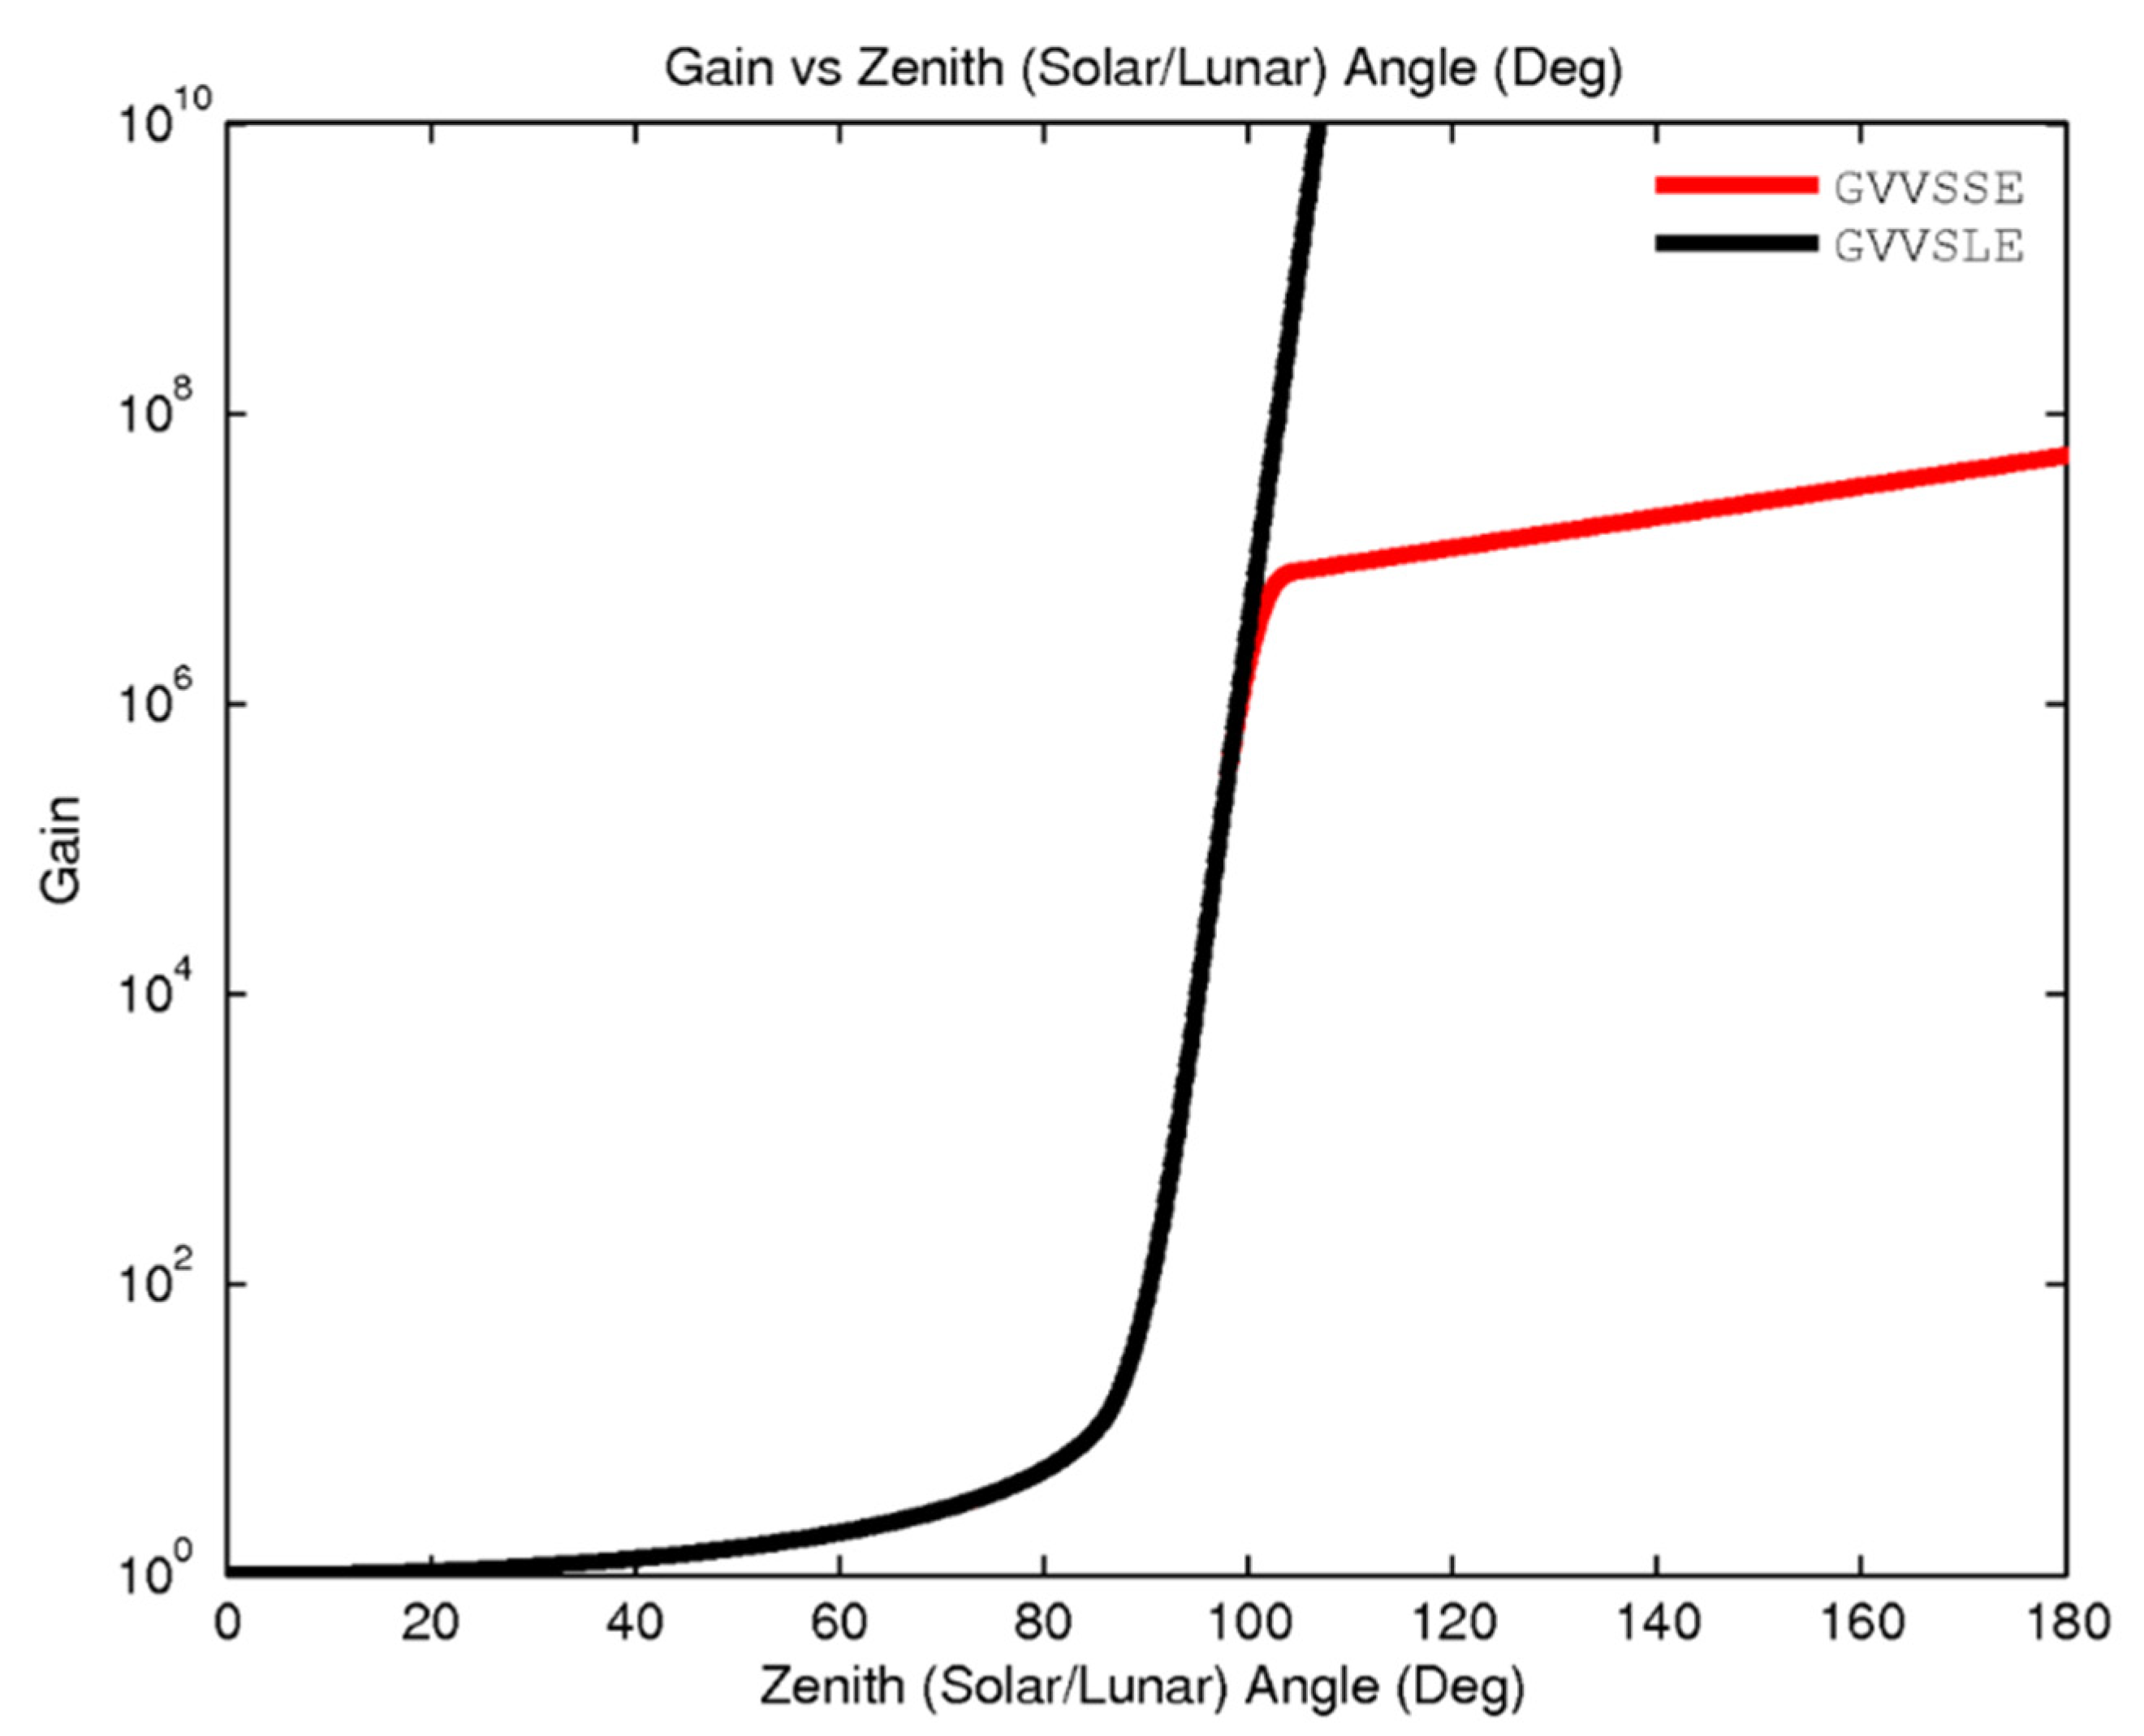
20], which was still supporting the JPSS Program at the time. A new LUT for converting DNB into NCC was provided, and was expanded from 105° to 180° to include no-moon conditions. This LUT was implemented in 2013, and since that time the NCC Imagery has been available and useful under all solar and lunar illuminations.
Figure 3 shows the new NCC LUT (in terms of Gain Value Versus Scene Solar Elevation, GVVSSE, vs. Lunar Elevation, GVVSLE) that was expanded from the original maximum of 105° to 180° zenith angle, to account for the presence of airglow. Airglow is otherwise most obvious when both the sun and the moon are beyond 105°, or basically no moon nighttime conditions. Airglow is now accounted for using statistics run on multiple granules of DNB across the full range of solar zenith angles (extending to 180°), and has been encoded in the GVVSSE table as described by Liang et al. [
20].
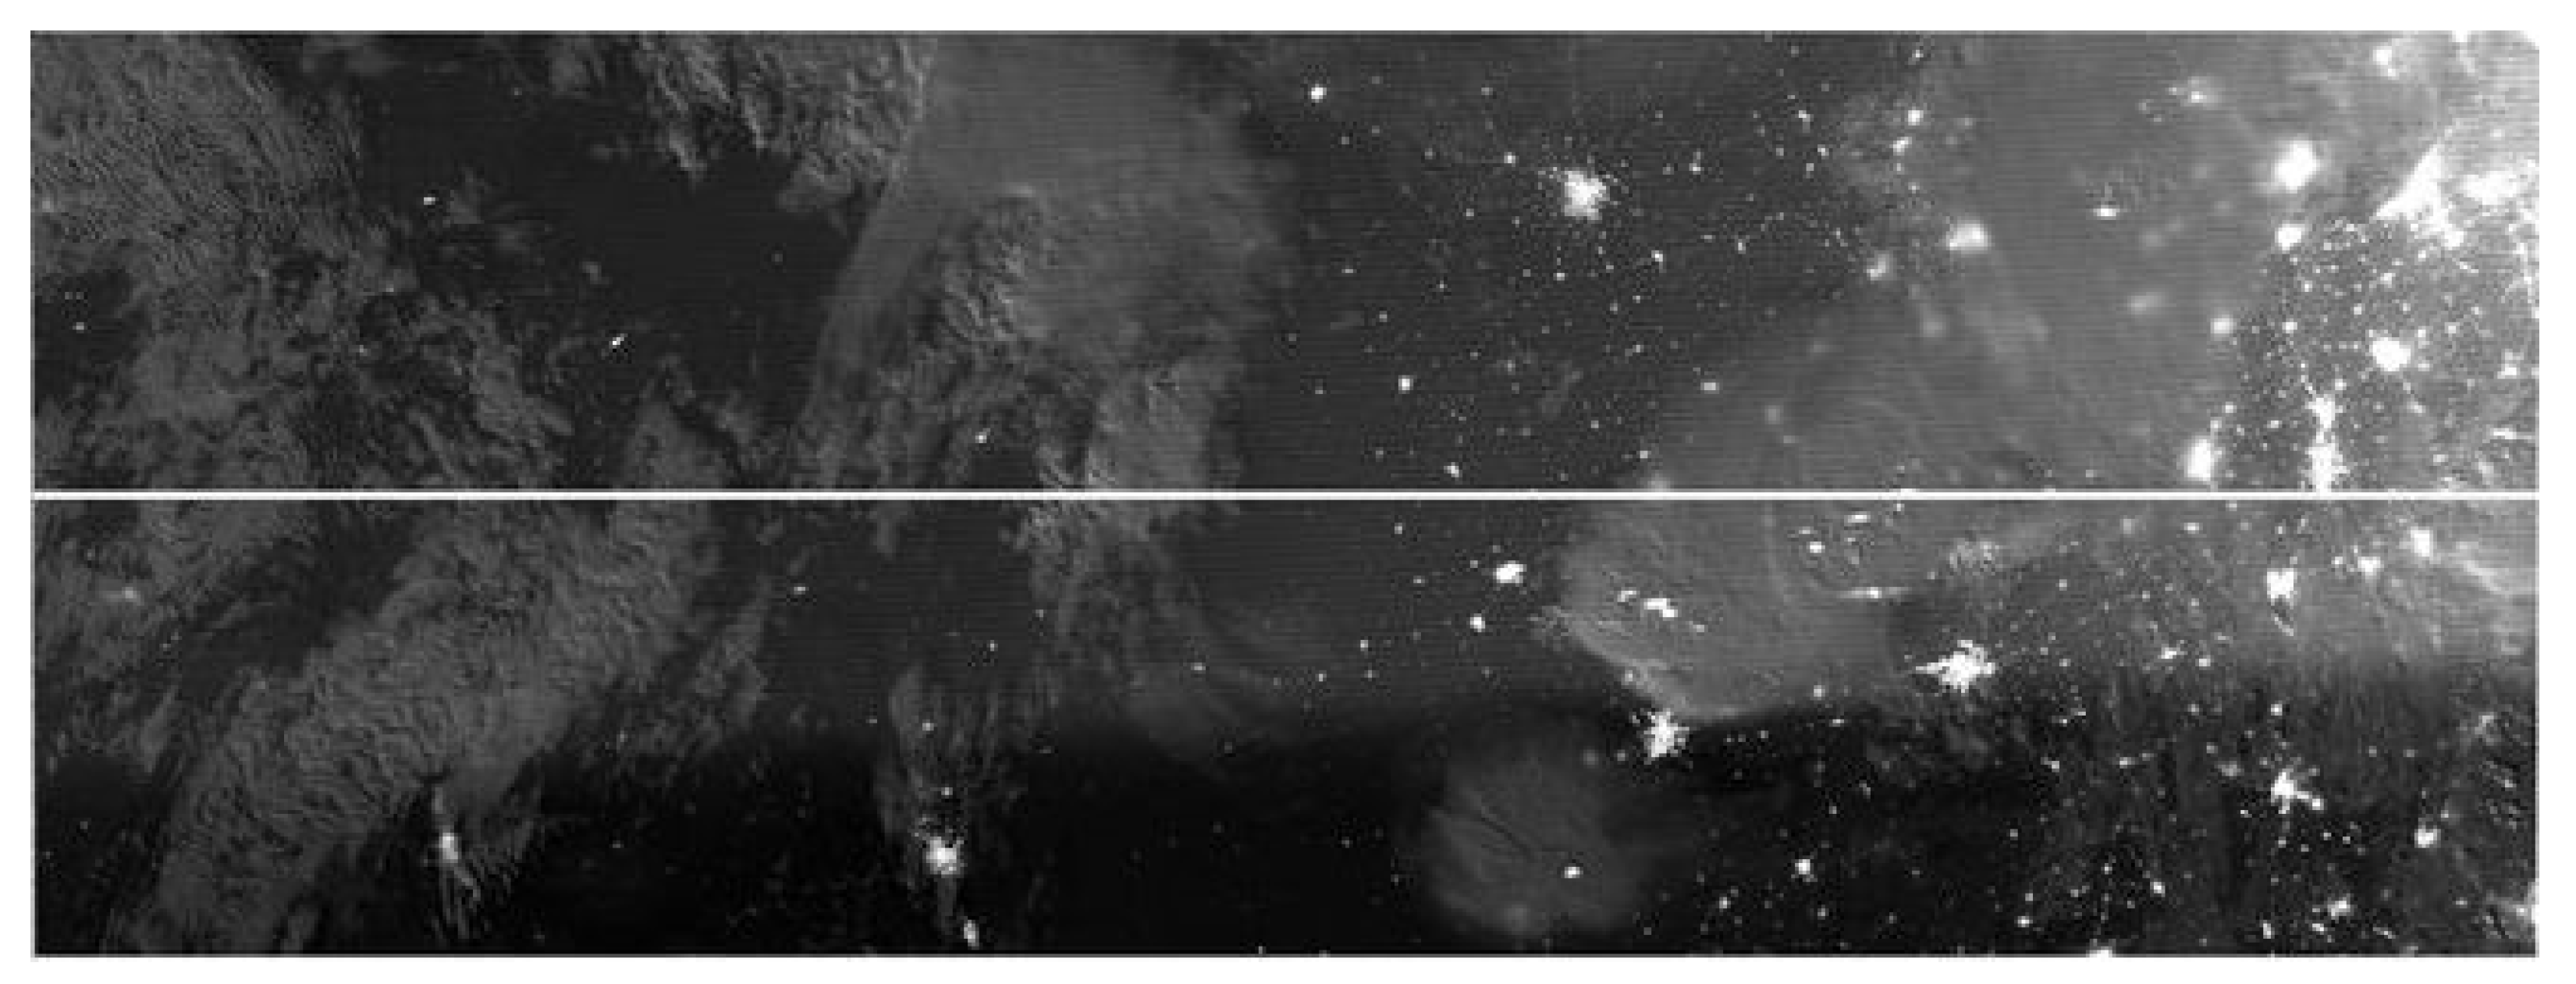
Figure 4 presents two NCC granules containing clouds that are visible primarily due to airglow under otherwise no-moon conditions. Besides the cloud features, the discrete bright patches are city lights. These moon-free NCC images are possible because the LUT was expanded to allow for NCC to be produced under all sun and moon geometric conditions.
No significant code changes took place for many years after the initial NCC Imagery fix, since VIIRS from S-NPP and then JPSS-1/NOAA-20 (launched in 2017) both were producing good quality imagery. The only issue with the NCC was that it now had to be produced from DNB that was altered due to increased pixel aggregation at the trailing edge of the granule because of otherwise noisy data in those locations arising from detector cross-talk that was identified in pre-launch testing. A by-product of this aggregation change was an extended DNB granule that went beyond the normal maximum scan angle for VIIRS of 56.28°. This extended granule was included to complete the full number of pixels in the fixed DNB granule size. But, this caused the DNB granule to be asymmetric, in that nadir for the granule was not in the swath center.
The main concern for the NCC product was that it could still be correctly produced with nadir at the center and with an equal number of pixels on each side of the nadir. The mapping of NCC to the GTM worked as designed, resulting in the extended granule pixels being ignored. The result is that the NCC granule matches the spatial extent of the other EDR granules and the extended granule portion of the NOAA-20 DNB swath is cropped off. As this avoided any code changes, it ended up being a non-issue for the EDR Imagery Team.
4.2. Terrain Correction to VIIRS EDRs (2020)
A long-term mission of the Imagery Team was to implement TC in the VIIRS EDRs. This was delayed until well after the launch of JPSS-1 and its checkout. TC was previously available only with VIIRS SDRs, but EDR Imagery users desired to be able to track surface features from overlapping granules on different orbits, or between overlapping granules from different satellites. This was especially important after there were two JPSS satellites in operations and more frequent examples were available of overlapping scenes with VIIRS observations taken from different scan angles.
This stability of VIIRS-observed features would be especially helpful for monitoring hotspots from wildfires or lights from cities or other sources tied to the surface of the Earth, especially when those surface light sources occurred at elevations significantly above (or in rarer cases, below) the ellipsoid. In non-terrain-corrected imagery, those features would shift dramatically because of large variations in viewing angles, as is common for imagery from low orbit.
The easy part of this task was that the TC code was already available within the VIIRS software. That software needed to be made available to the EDR version of imagery. For this implementation, code changes were required to replace the non-terrain-corrected version of EDR with the terrain-corrected version, since the Imagery Team decided to not maintain the old non-terrain-corrected EDRs. Thus, no new files or additional bandwidth were required for this transition.
Testing of the code changes utilized the Algorithm Development Library (ADL) team, through the normal ground system code change process wherein the Imagery Team checked the resulting terrain-corrected imagery at each step toward operational implementation. In addition, the NASA Geo Team [
25] and Raytheon personnel were involved in this implementation, as well as the NWS as a requestor of this change, but also to help validate, and then as users of the terrain-corrected EDR Imagery for analysis and forecasting purposes.
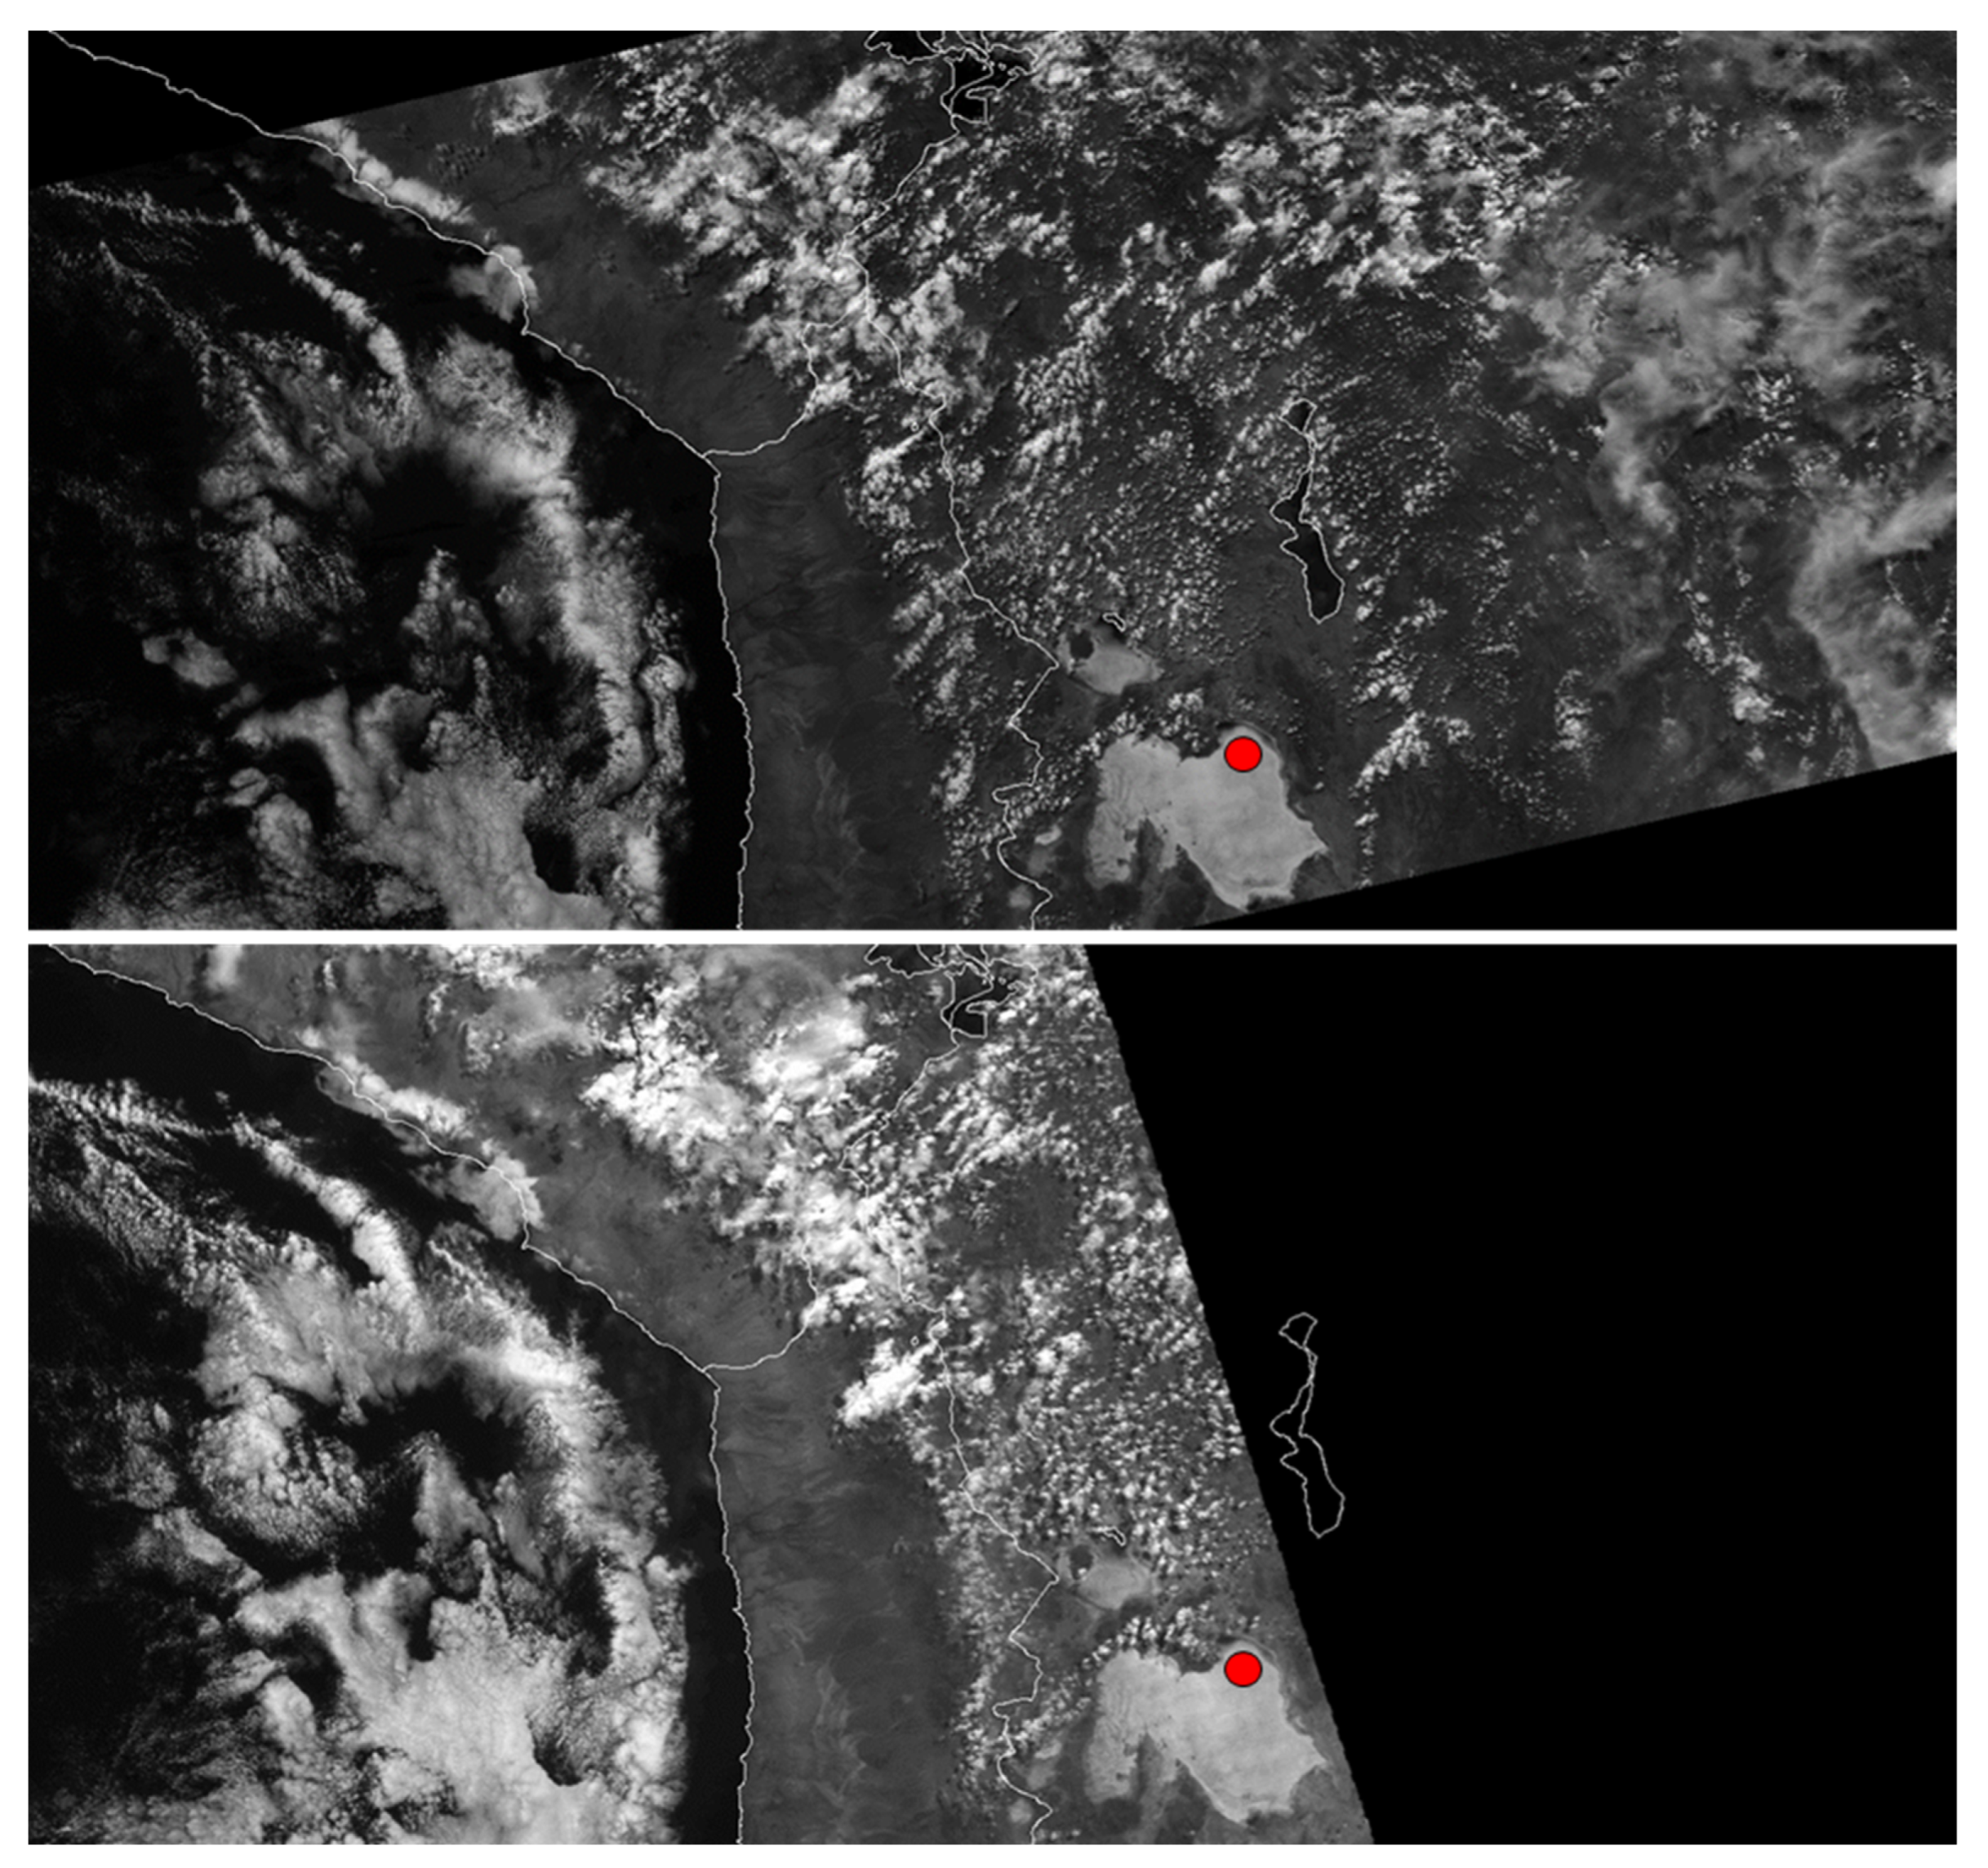
The results of TC on VIIRS EDR Imagery are most noticeable for features at higher elevations, such as the high-altitude regions of the central Andes (4000–6000 m AMSL). The example in
Figure 5 shows views near nadir by NOAA-20 and the near edge of the scan by S-NPP with no apparent motion of the surface features between the orbits, whereas the clouds may change or move during the time difference between the two views. Numerous other examples of the application of terrain-corrected imagery were used to support this code change. Many of those cases were good examples of the use of VIIRS to monitor wildfires that should be stable but may otherwise change over time as wildfires grow or spread. This is important information that can be derived from high-resolution satellite imagery. Whereas surface feature shifts were minimized, one caveat of the TC is that a cloud layer of uniform height over dramatically varying terrain height will suffer “terrain induced shifts” (basically, parallax shifting due to the TC) and thus some spatial distortions in these areas.
4.3. NCC Banding Anomaly Code Fix (2021)
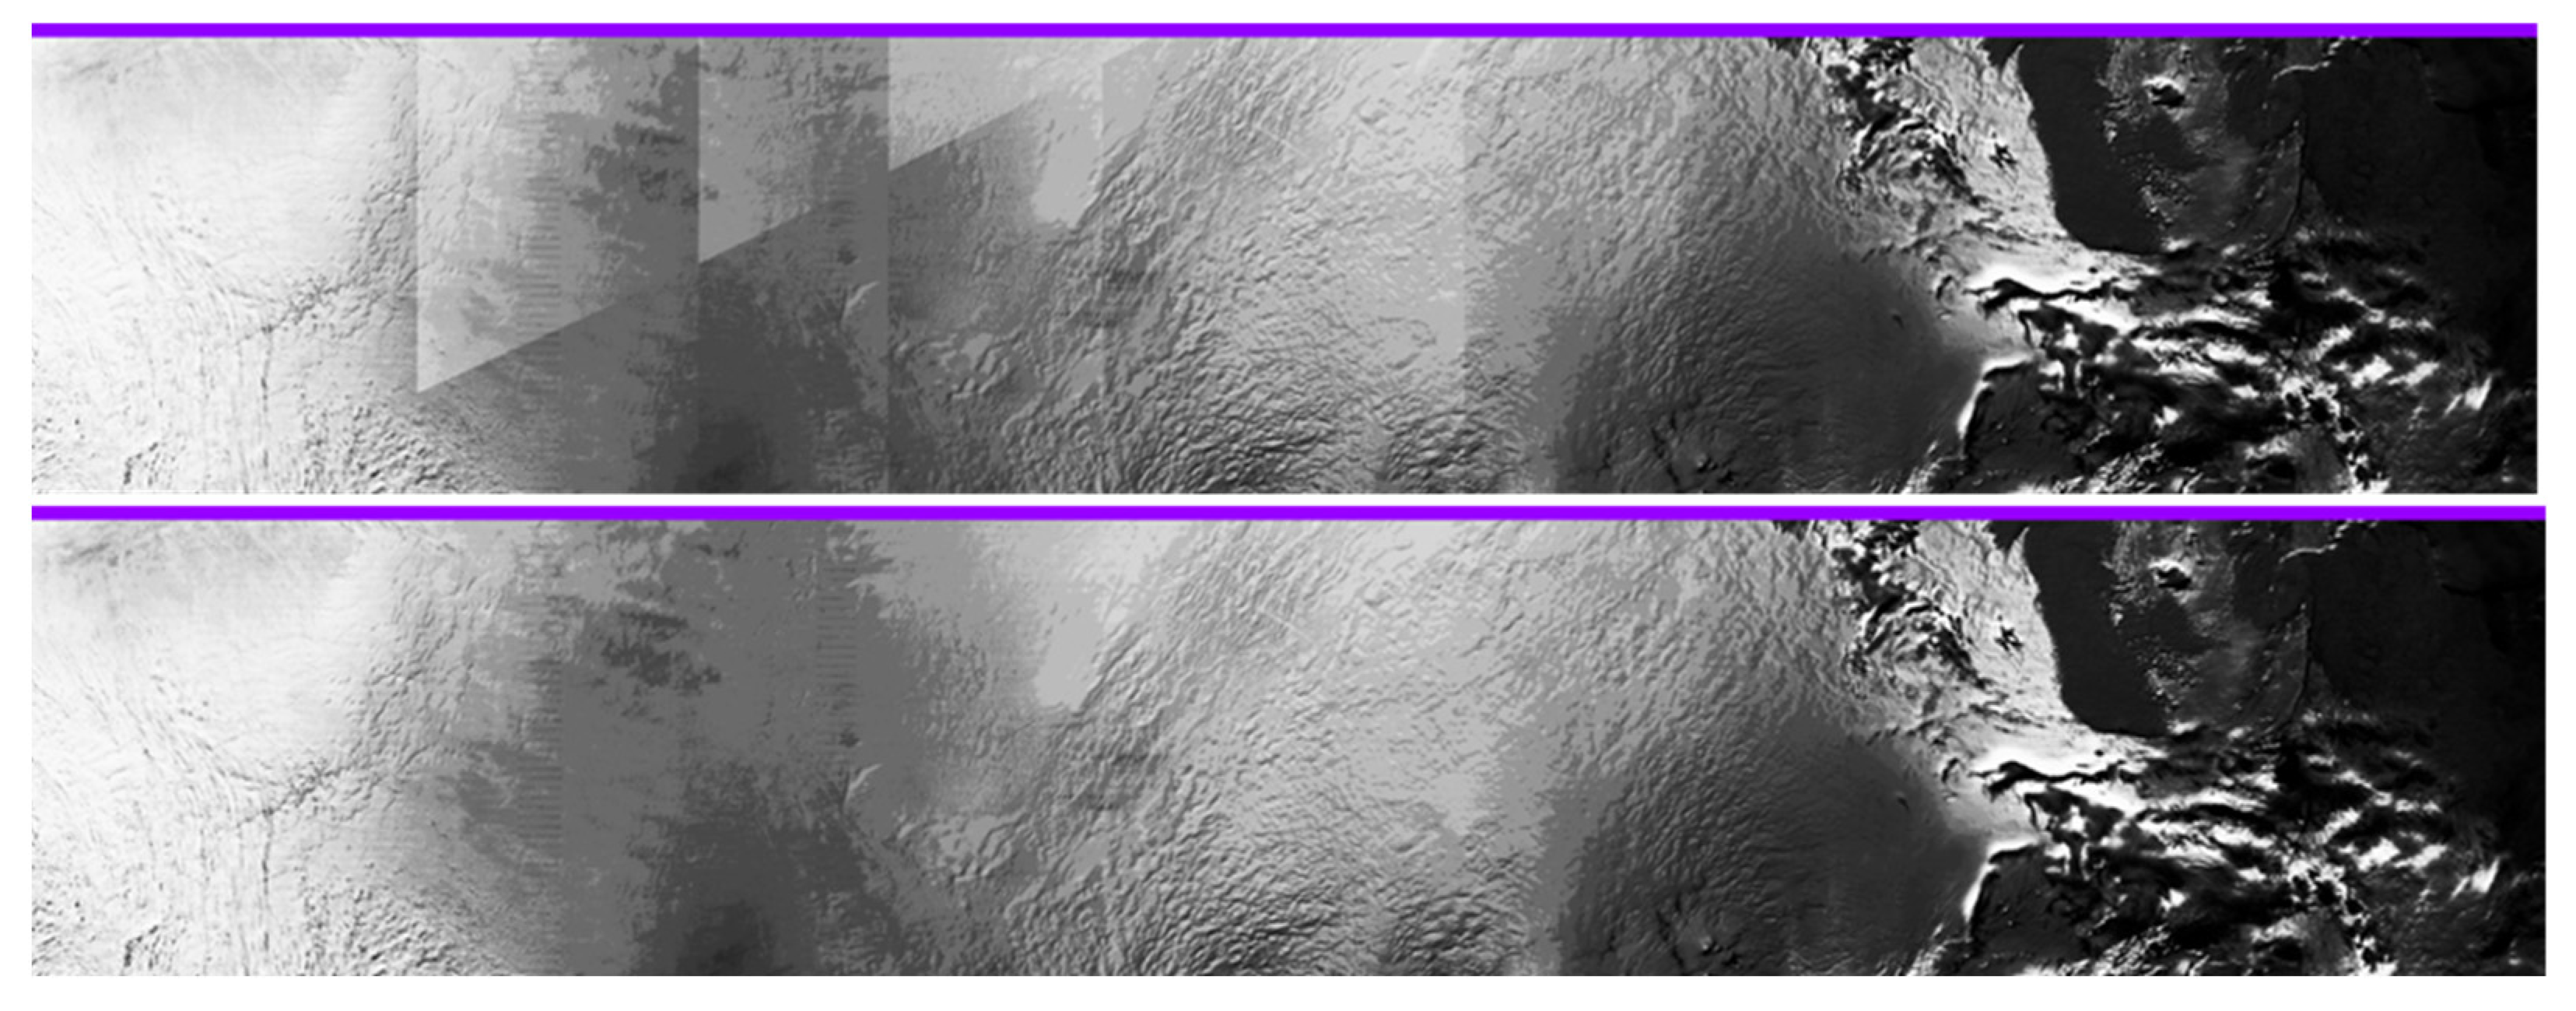
The next VIIRS EDR Imagery code change was needed as a result of discovering banding in the NCC Imagery (i.e., not present in the VIIRS DNB SDR) under fairly bright and homogeneous conditions. The banding that was found was a darker-to-lighter or a lighter-to-darker contrast in the NCC Imagery, most often seen as along-track brightness jumps in the VIIRS granule. Striping, on the other hand, is a term associated with along-scan variations extending the length of the VIIRS granule. Both vertical and other angular brightness jumps were found under ideal conditions. These un-desirable jumps were associated with the instrument scan angle and the solar zenith angle respectively.
After examining the NCC radiances or reflectances for some of these banding cases, it was found that improper interpolation was used to find the scan, zenith, and relative angles for each pixel, from a relatively coarse array of coefficients that were available for these angles. Since the three-dimensional interpolation was conducted incorrectly, this resulted in brightness jumps rather than a smooth transition across these angles. These jumps were small, and therefore only seen in highly homogeneous and bright conditions such as over Antarctica or Greenland. While only noticeable in those areas, these jumps were found everywhere when the NCC Imagery was examined closely. However, any larger natural brightness variations in the NCC often masked these jumps, and therefore this banding was seldom noticed. As well, it must have been ignored or dismissed when it was found on rare occasions. Thus, it truly was an anomaly in the sense of the frequency of occurrence, yet it was a consistent error or problem just above the noise level for the NCC Imagery.
The code changes to fix this banding were worked through the steps for operational ground system changes, along with the numerous stages at which the imagery output was checked to be sure the code changes eliminated the banding and did not otherwise have any adverse effects on the NCC Imagery.
Figure 6 is an example of the banding anomaly in an NCC granule compared with the same granule after the code changes were implemented to correct that banding. A homogenous and bright scene such as this over Antarctica was necessary for the Imagery Team to notice this problem. Other banding examples were elusive but were found in imagery from many years earlier, back to the first VIIRS images. As well, being the problem was an error in the tri-linear interpolation used in the VIIRS software, it affected all NCC Imagery, however only to be noticed under special conditions after many years of imagery validation!
4.4. Six (6) to Sixteen (16) M-Band EDRs (2021)
Also in 2021, the code changes to produce EDRs from all 16 M-bands was finally approved by the JPSS Program and scheduled for operational transition. All-band EDRs had been a goal of the Imagery Team almost since the start. All 16 M-bands are needed for many of the valuable multi-spectral and RGB products developed for imagery users. Even the production of True-Color Imagery from VIIRS EDRs was not possible because only one of the true-color components was among the six M-bands that were routinely available.
Because of bandwidth issues, only six of the 16 M bands were originally available as EDRs. The default set of M-band EDRs included bands M1 (0.412 μm), M4 (0.555 μm), M9 (1.38 μm), M14 (8.55 μm), M15 (10.76 μm), and M16 (12.01 μm). The other M-bands were produced only as SDRs, so many multi-spectral products could be generated and provided to users. However, the restriction on the number of EDRs limited some imagery users. The set of six M-bands, although considered to be selectable, was fixed for all practical purposes because of the way the imagery code was provided. Any change to the band selections would have required the code to be reconfigured and recompiled. The switch to all 16 M-bands, therefore, eliminated any such band-selection issues, as well as not placing any emphasis on certain bands and de-emphasizing other bands.
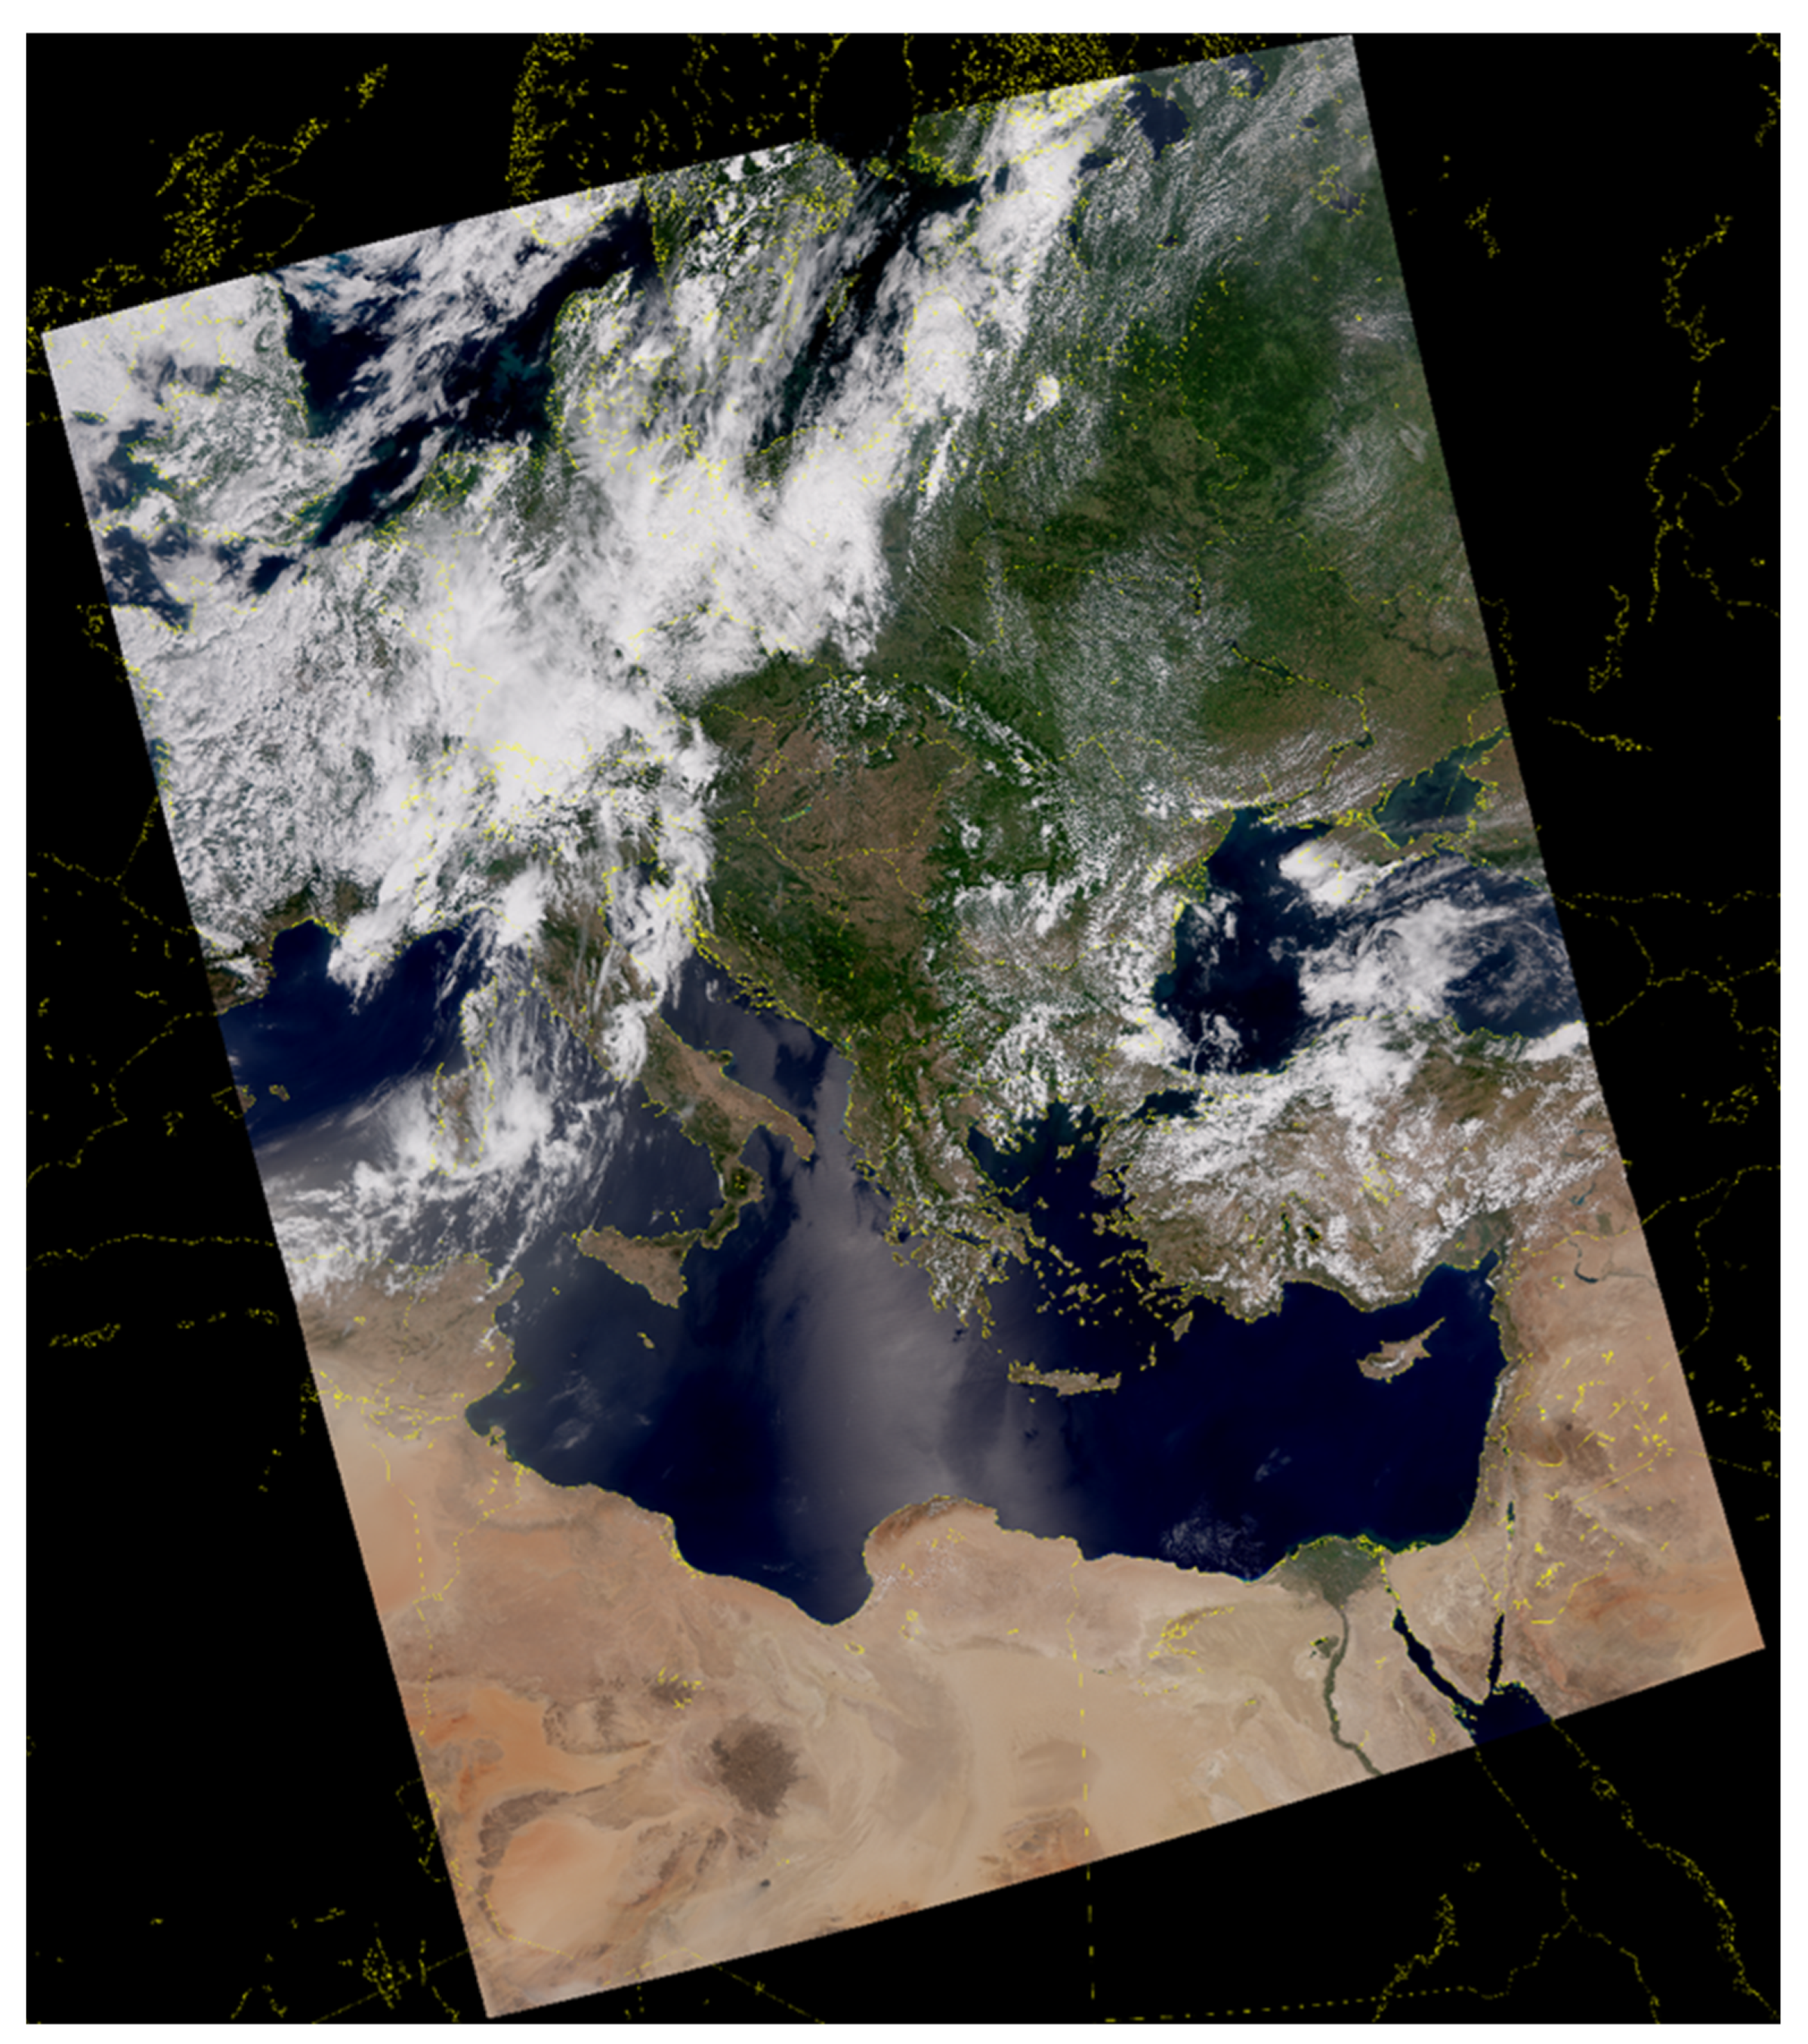
The JPSS Program was supportive of this change once the bandwidth was no longer a limitation. They worked directly with Raytheon Technologies to implement those 16 M-band code changes. The Imagery Team validated the imagery and image products that can be generated from the new EDRs. One product, in particular, a version of True-Color Imagery as seen in
Figure 7, can now be created directly from VIIRS EDRs for bands M3, M4, and M5. This and other image products are now possible since all bands are available from the VIIRS EDRs.
5. VIIRS Imagery Product Generation and Display
While this paper focuses primarily on the VIIRS validation tasks of the EDR Imagery Team, many of the Team members have also been involved in image product development and collaborations with imagery users. The development of the VIIRS Sea Spray RGB is an example of how the VIIRS EDR Imagery Team interacts closely with its users (NWS Alaska and GINA in this case) to identify new applications of VIIRS imagery and develop associated products [
26]. While Alaska is a prime user of VIIRS imagery, continental US NWS sites also express interest in VIIRS for its higher spatial resolution than currently available from geostationary imagery such as GOES.
The Satellite Liaison Blog has been particularly useful for demonstrating the applications of satellite imagery, including VIIRS (
https://satelliteliaisonblog.com/?s=viirs, accessed on 4 April 2022). A couple of examples of VIIRS products are provided here.
Figure 8 is VIIRS Snowmelt RGB from 28 February 2021 with annotations for the relevant features differentiated in the imagery. As well,
Figure 9 is an overnight NCC image of wildfire smoke from 19 September 2021, which was leveraged in NWS operations. Both images are accompanied by links to the full blog about each case.
Imagery users can find information on VIIRS products from many sources: blogs, reports, and published literature. While the Imagery Team interacts with imagery users and applications, the topic of VIIRS products is best covered in more detail elsewhere as it is not the primary focus of this report on VIIRS validation activities.
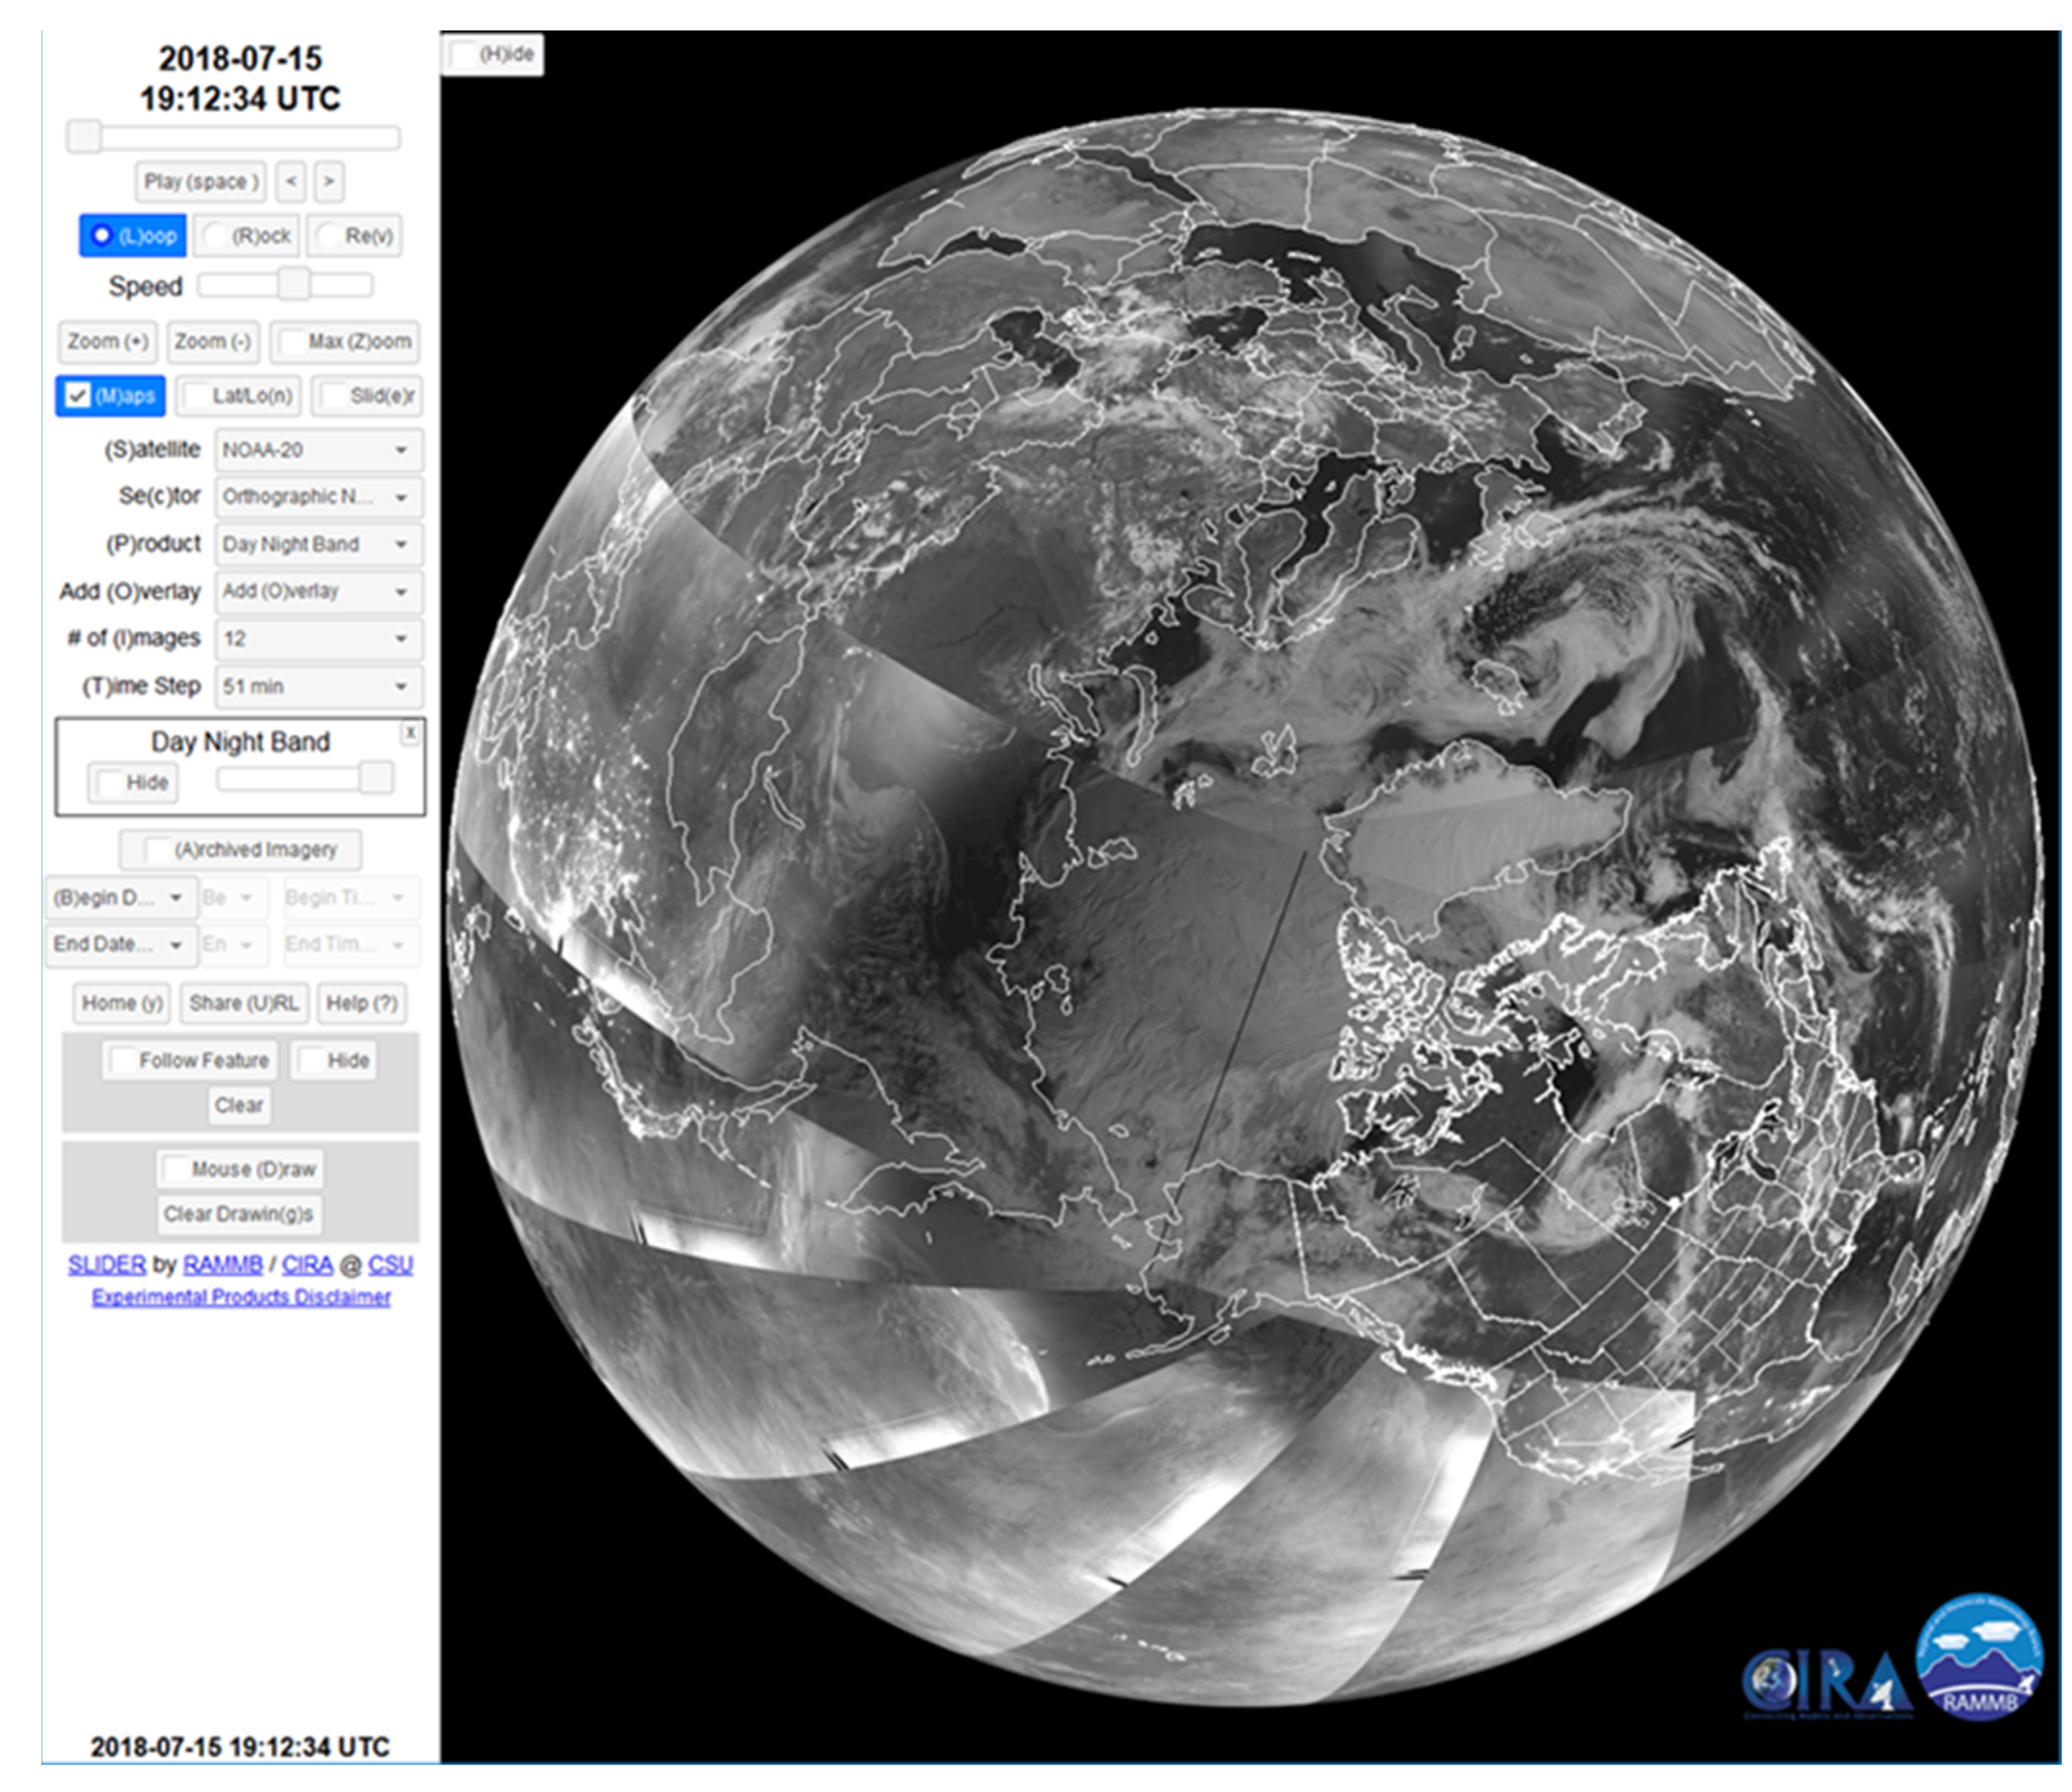
Also, the primary real-time display for satellite imagery at CIRA, its Satellite Loop Interactive Data Explorer in Real-Time (SLIDER), was developed initially to display real-time geostationary satellite imagery. VIIRS was added after the initially published announcement of SLIDER capabilities [
27]. The two primary projections for VIIRS in SLIDER, from the North and South Poles, take advantage of the numerous orbits over those regions, whereas an equator-centered projection would have large time gaps between the images.
Figure 10 is an example of a North Pole-centered image of VIIRS DNB. The control panel at the left can be used to change the display to any of the other VIIRS bands or other imagery products. Users can zoom in to the full resolution of VIIRS at any location on SLIDER, either 375 m or 750 m depending on the band, as well as see a time-sequence of VIIRS imagery.
6. Conclusions
This paper has covered the major code changes that involved the EDR Imagery Team: (1) the initial problem with nighttime NCC Imagery largely being unavailable until a new LUT was devised by Northrup Grumman to account for very small radiances, extending useful NCC imagery into even no moon conditions (airglow); (2) TC of EDR Imagery as a user-requested change that went through the code change process including numerous validation steps; (3) an NCC banding anomaly that was subtle and therefore not discovered for many years, but was found to be an error in the operational code related to tri-linear interpolation software; and, (4) the change from 6-to-16 M-band EDRs, to allow more access to VIIRS imagery and imagery products for end users.
Besides these major code changes, the Imagery Team has dealt with numerous other issues, many of which have been resolved thanks to the cooperation of the VIIRS SDR Team, which is more concerned with calibration than validation of the imagery. The Imagery Team will continue to validate VIIRS imagery for further VIIRS instrumentation on JPSS-2, 3, and 4 (which will become NOAA-21, 22, and 23 if successfully orbited), and tackle any future imagery issues as they arise. In particular, the NCC product, which is the main operational code for which the Imagery Team is responsible, is a unique, very valuable, and widely-used imagery product. The wide application of NCC by users may result in further improvements, requiring code changes, or possibly alternative NCC-type products, some of which have already been proposed [
24,
28].
The Imagery Team will continue to work closely with its users, identifying unique imagery applications and developing appropriate new multispectral products, displays, and enhancements. Additions to Polar SLIDER will also continue in an effort to make VIIRS imagery accessible to a wider variety of users for a range of applications.
