Abstract
Investigation of subsidence situations is important for the design of railway lines. Traditional geological investigations are expensive. Multi-temporal InSAR (MT-InSAR) analysis has shown great potential for detecting subsidence areas along large-scale manmade linear features (LMLFs). The disadvantage of applying high-resolution SAR data such as that from TerraSAR-X and COSMO-SkyMed data is the high cost. By contrast, the free and open data from Sentinel-1 A/B offer an unprecedented opportunity for InSAR applications. Despite these advantages, research investigating the potential for monitoring subsidence along LMSFs using multi-temporal Sentinel-1 InSAR data at the design stage of LMSFs is limited. This paper explores the monitoring ability of MT-InSAR analysis with Sentinel-1 A/B multi-temporal data in an experiment along the planned Jakarta-Bandung high-speed railway in Bandung, Indonesia. Subsidence patterns along the route of the planned high-speed railway were analyzed in detail. By means of validation using 12 leveling points, the root mean square error (RMSE) of the average displacement velocity that was obtained from the MT-InSAR results was found to be 10.31 mm/yr. This paper demonstrates the potential of Sentinel-1 multi-temporal INSAR data to detect potential subsidence areas along planned LMLFs (e.g., the planned high-speed railway that is the focus of this study), serving as a reference for further planning of monitoring subsidence over planned LMLFs.
1. Introduction
The investigation of the natural environment and geological conditions of a railway plays a quite important role in the early days of designing a new railway line, especially for a high-speed railway. More than 29,000 km of high-speed railways had been built in China through to the year-end of 2018, representing more than two-thirds of the global high-speed railway track length. The stability of high-speed railway structures will be affected by regional ground subsidence, which will directly affect train running speed and the security of operations. Regional subsidence is caused by various factors, including groundwater extraction, geological conditions, and seasonal variations. Precise deformation history extraction, subsidence mechanism investigation, and prediction of subsidence trends are all of great significance for the stability and security of high-speed railway operations.
Both precision leveling and GNSS measurement are major methods for monitoring subsidence along high-speed railways. Both provide highly precise measurements over single stations, with the limitation of low spatial sampling. When analyzing geological conditions and investigating subsidence mechanisms, precise deformation information featuring high temporal/spatial sampling over a wide area of coverage is in high demand. Neither leveling nor GNSS can meet these requirements, however, under the constraints of cost.
By contrast, differential interferometry (D-InSAR) is able to measure deformation with high precision and high spatial resolution while offering a wide area of coverage. With the successful launch of next-generation SAR satellites, different bands of SAR data are available for deformation monitoring under real conditions and restrictions [1]. The primary limitations of D-InSAR are those of temporal/spatial de-correlation and its susceptibility to atmospheric disturbance.
Permanent scatterer (PS) InSAR [2,3,4] was proposed in 2001 to avoid these limitations of D-InSAR. Its theoretical accuracy can approach the millimeter or even sub-millimeter level. Building on the basic principle of PS InSAR, other multi-temporal InSAR (MT-InSAR) technologies [5,6,7] have been proposed: interferometric point target analysis (IPTA) [8], spatial–temporal unwrapping network (STUN) [9], quasi-PS (QPS), and small baseline subset (SBAS) [10,11,12]. Recently, methods for detecting both point-like targets and distributed scatters [13,14] have been explored. The successful subsidence monitoring application of SqueeSAR in urban areas can be referred to [15]. Higher-order PS analysis [16] and TomoSAR [17] can be used to extract height and deformation information of built areas. Moreover, multi-view TomoSAR point clouds can be applied to reconstruct building facades [18,19,20].
High-resolution SAR satellites show great promise for monitoring subsidence along large-scale manmade linear features (LMLFs), including railways [21,22,23] and subways [24]. Thermal expansion maps of buildings and bridges can be generated using very high-resolution SAR data [25,26,27,28]. Since the collection of high-resolution SAR data is expensive, much attention has been attracted to the free and open Sentinel-1 data applications from researchers [29]. The successful launches of Sentinel-1 A/B in May 2014 and April 2016, respectively, offered an unprecedented opportunity for InSAR applications. Sentinel-1 works in C bands at a resolution of 5 m in range and 20 m in azimuth. The short revisit period (12 days) provides the possibility for extensive high-quality InSAR data. Sentinel-1 SAR data has been widely applied in monitoring fast and slow movement and they are including landslides [30], earthquakes [31,32], and ground motion [33]. Parallel Sentinel-1 InSAR processing was explored with combination of InSAR time series processing and GPU hardware and it has high potential for emergency monitoring due to geological disasters [34]. The highest distinct earthflow movements are detected as 15 cm/year in the east-west direction by integrated analysis of ascending and descending InSAR data from S1 data [35]. Braun studied generation DEM with S1 and analyzed the influence for generation high precision DEM with S1 [36]. The deformation of 73 urban cities in Japan during 2014–2020 were derived using LiCSAR products and LiCSBAS and formed this nationwide monitoring approach for wide area deformation monitoring [37]. In Indonesia, the vertical height difference was calculated between the two DEM that were generated by TerraSAR-X INSAR data in 2010 and S1 data in 2018, respectively, and it ranges from 0.2 m to 0.5 m [38]. The annual average subsidence velocity of Jakarta is 3.4 cm from 2017 to 2019 with the application of S1 time series analysis [39].
The previous study [40,41] proved that many areas of Bandung City are affected by serious subsidence as a result of underground mining, underground water withdrawal, and other natural and manmade factors. GNSS measurements that were taken from 2000 to 2011 found that the subsidence velocity of several areas was about 8 cm/yr, with a maximum velocity of 23 cm/yr. However, since traditional geological investigation is expensive, InSAR time series analysis offers one way of monitoring subsidence over the path of the planned high-speed railway, potentially offering guidance for the design of future high-speed railways.
This paper offers analysis of MT-InSAR data with Sentinel-1 images along the path of the planned Jakarta–Bandung high-speed railway. An estimate of the precision of the monitoring subsidence made using Sentinel-1 MT-InSAR data is made and the result validated using leveling measurements along the planned Jakarta–Bandung route. Sentinel-1 MT-InSAR analysis was carried out using SARProz [42]. The results offer a solution for investigating ground stability conditions in a sustainable, low-cost manner involving little manual participation, that is likely to be of use in planning and subsidence monitoring for future high-speed railways construction.
2. Study Area, SAR Datasets, and Leveling Data
2.1. Study Area
The Jakarta–Bandung high-speed railway is the first high speed railway in Indonesia. It is planned to run from Jakarta, the capital of Indonesia, to Bandung station, connecting the two major cities of Jakarta District and Bandung. The total length is 142 km and a maximum designed speed of 350 km per hour. The subsidence along the planned Jakarta-Bandung high-speed railway will greatly affect the construction and operation safety of it and the consequences due to subsidence will be difficult to predict clearly. Therefore, monitoring of the subsidence along the Jakarta–Bandung high-speed railway is of great importance to the design, construction, operation, and maintenance of the railway route.
Traditional GNSS and leveling are kinds of high precise single-point measuring techniques. Compared to that, InSAR observations provide high spatial sampling with wide area coverage. Then, one appropriate way is to apply InSAR to explore the whole subsidence situation and displacement history along the planned Jakarta-Bandung high-speed railway.
The overall startup of the construction of Jakarta–Bandung high-speed railway began in June 2018 and it is planned to be completed in 2023. When completed, the running time between Jakarta and Bandung will be reduced to 40 min from currently more than three hours.
The geographic location of the study area and SAR datasets of Sentinel-1 data are illustrated in Figure 1. Part of the planned Jakarta–Bandung high-speed railway, located in Bandung as shown in Figure 1, is selected as the study area. The planned railway declines as shown by the red line in Figure 1c.
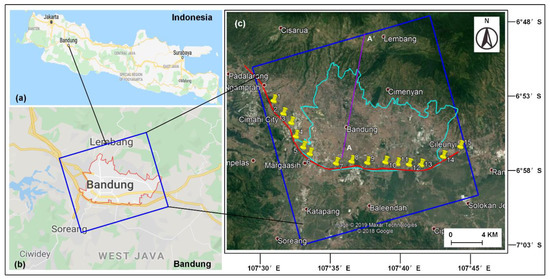
Figure 1.
The geographic location of the study area and SAR datasets of Sentinel-1 data. The Spatial coverage of the study area of Sentinel-1 data is declined with a blue rectangle in (b,c). The red area in (b) and light blue area in (c) represents the Bandung municipality. The red line highlights part of the planned Jakarta-Bandung high-speed railway. The purple line that is named A-A’ presents the location of the aquifer profile as illustrated in Figure 2. The collected 15 leveling points along the planned railway are marked with yellow place marks. The geographical maps of (a,b) and the background map of (c) are from Google maps.
Bandung is a large mountainous basin that is surrounded by volcanic highlands that is located in West Java province, Indonesia. The elevation of central areas of the basin ranges from 650 to 700 m, surrounded by the Upper Tertiary and Quaternary volcanic areas with the height of 2400 m. Previous investigation revealed surface subsidence occurs in several cities in Indonesia [40].
With the rapid development of industry and urbanization, the surface of these areas is at great risk of subsidence in the near future. Accordingly, we must investigate the location of subsiding centers in Bandung City and extract their precise displacement history, using it to understand whether the planned railway line will cross subsiding centers, and the degree of subsidence that is involved before embarking on railway line design. A relatively long period of displacement history is required for railway line design, and thus InSAR time series analysis will be the only one appropriate method to explore the whole displacement history along the planned high-speed railway.
In most cases, compressible deposits progressively compact and then result in land subsidence. Unconsolidated sediments with high porosity can be considered as compressible deposits. Bandung City is located on compressible deposits as revealed in [40], and then it is more likely to be affected by surface subsidence, especially it is densely populated.
The total decrease of groundwater ranged from 20 m to 100 m in different areas from 1980 to 2004. The decrease of the groundwater level varies both in the spatial and temporal direction [43]. The aquifer profile of Bandung City is plotted as Figure 2. Bandung basin is composed of a different formation and they are formations of the Kosambi, Cibeureum, and Cikapundung formations. The aquifer profile from south to north is composed of a discharge area and recharge area. The Bandung City is mostly located in a discharge area since the elevation is lower than the north mountain area.
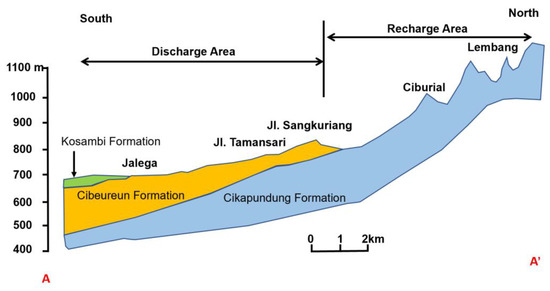
Figure 2.
The aquifer profile A–A’ (in Figure 1) of Bandung City.
2.2. SAR Datasets and Leveling Data
We carried out the monitoring work at the design stage of Jakarta–Bandung high-speed railway. The available SAR datasets comprise of 57 sets of Sentinel-1 A/B imagery that were acquired from 12 October 2014 to 7 December 2017. Sentinel-1 A/B images are collected using a VV polarization model with a spatial resolution of 5 m × 20 m on the ground and the satellite information of Sentinel-1 A/B is listed in Table 1. VV is a form of co-polarization, and it represents transmitting and receiving electromagnetic signals vertically. The incidence angle of Sentinel-1 is 43.78 degrees. Detailed acquisition information is listed in Table 2.

Table 1.
Sentinel-1A/1B satellite information.
Table 2.
Sentinel-1 A/B datasets.
Figure 1 shows the 15 leveling points that were collected, indicating their locations with yellow dots. Leveling data were collected in May 2016 and April 2017. Using the national standard for secondary leveling measurement, the collection of leveling points was made at 2 mm/km height accuracy. Related discussions of uncertainties that were encountered during validation between MT-InSAR and leveling are described elsewhere [22,44].
For the purposes of our validation work, leveling data were assumed to be collected on 15 May 2016 and 15 April 2017, respectively, with the exact acquisition dates being unknown. Leveling benchmarks were recorded at a set interval along the railway and were numbered 1 to 15.
3. MT-InSAR Analysis with Sentinel-1 A/B
3.1. The Processing Framework of MT-InSAR Analysis
Several different MT-InSAR analysis techniques can be alternative methods to process the available Sentinel-1 A/B SAR datasets. They are the PS InSAR method [2,45,46], interferometric point target analysis (IPTA) [8], spatial–temporal unwrapping network (STUN) [9], quasi-PS (QPS), and small baseline subset (SBAS) [10,11,12] as well as other MT-InSAR methods that were mentioned above. In our work, the classical PS InSAR method was used to process the available Sentinel-1 A/B SAR datasets.
Essentially, PS InSAR technology looks for point-like targets that are not affected by temporal and spatial de-correlation and atmospheric disturbance from multi-temporal SAR data. These targets may be artificial buildings, exposed rocks, corner reflectors, and other objects. The echo signal of these targets is strong, and their geometric size is far smaller than the image spatial resolution unit. They maintain stable scattering characteristics even after a long interval and are only slightly affected by speckle noise. Atmospheric phase screen (APS) contribution can be accurately estimated and eliminated, allowing the extraction of precise DEM and deformation data.
The main steps of PS processing are as follows, and are illustrated in Figure 3. Multi-temporal Sentinel-1 SAR data were collected in the study area. One common master image was selected from these images. It was usually selected as the central one of the whole images considering both of the spatial and temporal baseline. The others are all slave images. After that, data focusing and registration were completed and the reflectivity map was generated by averaging all the coregistrated images. The baseline can be constructed by different image graph and here we choose the singe master processing approach. We selected the imagery that were obtained on 13 October 2016 as our reference image and designated the remaining 56 images as slave images. The image graph was star-shaped, as shown in Figure 4. In the following, DEM simulation and differential interferogram generation that were based on the above image graph were finished. Amplitude stability analysis and phase consistent index are two major methods to realize selection of Permanent Scatterer Candidates (PSC). The PSC selection method using the amplitude stability index is to look for these pixels when their backscattering maintain good consistency through the time series images and then, in our case, PSC were selected by setting a reliable threshold (0.75 of amplitude stability index depending on processing experience) all over the images. The most difficult step is multi-image spatial-temporal phase unwrapping and the linear deformation model that was applied in our case. The model is introduced in the following Section 3.2 and more details can be referred to [46]. Section 3.2 introduces the principle of PSINSAR analysis. One of the key steps is multi-image spatial-temporal phase unwrapping. In order to realize it, there is a basic assumption that the deformation rate on the time series is linear. With the model that is described in Section 3.2, we could accurately estimate and remove the APS contribution, and thus time series analysis of PS targets can be carried out. And then PS point displacement history analysis and average deformation will be finally extracted [22,46].
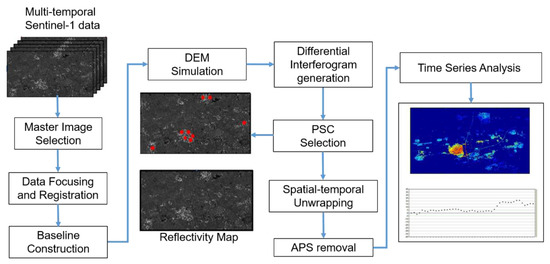
Figure 3.
The framework of Sentinel-1 MT-InSAR analysis.
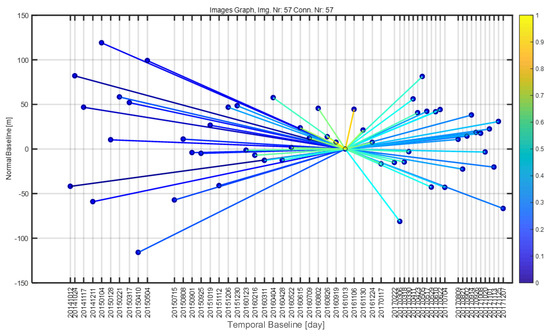
Figure 4.
Image graph of Sentinel-1 A/B PSI analysis. x-axis: temporal baseline of the acquisitions. y-axis: normal baseline of the acquisitions. The centers of the connected lines are the reference images of the Sentinel-1 A/B dataset. The color bar represents the average coherence ranging from 0 to 1.
Most on-orbit SAR satellites use a strip model as the default data collection mode. The difference is that Sentinel-1 satellites adopt TOPS as its usual imaging model. The TOPS model has special characteristics compared with the strip model. The high precision of coregistration should be achieved at 1/1000 pixels for ignoring the azimuth phase ramp that is introduced by a quadratic term due to steering of the antenna. The sub-pixel coregistration is complemented to achieve the mentioned precision coregistration by the spectral diversity method [47]. The drawback of our applied approach is that the distributed PS targets were not detected. With a view to remove the topographic phase, a coarse DEM should be applied. Since the accurate height correction is an auxiliary product of PS InSAR analysis, there is only a very slight difference for final deformation estimation whether a higher resolution DEM is applied or not [46]. In our case, we applied a 90 m resolution DEM from the shuttle radar topography mission (SRTM). The resolution of the DEM has little influence on the final PSINSAR results, and it is determined by the PSINSAR principle [45,46]. SRTM is often used as the DEM source for general PSINSAR processing. Interested readers can realize the PSINSAR analysis steps of the paper for further investigation with the high-resolution DEM with 8 m from open access (https://tanahair.indonesia.go.id/demnas/#/ (accessed on 1 January 2018)).
3.2. The Principle of MT-InSAR Analysis
The principle of MT-InSAR analysis was only briefly introduced here. For more details about principles and algorithms that were used in the PS InSAR technique, see the literature [45,46].
Suppose the number of whole complex SAR images is (57 in our case) and the common master acquisition (image acquired on 13 October 2016 in our case) is selected. The interferogram can be generated [48] between image (each slave image) and (master image or reference image). The reference point is set as , and then the interferometric phase of target can be calculated by . The displacement of target , geometrical location, atmospheric disturbance, and noise contribute to this interferometric phase together.
When the temporal coherence is maximum, the height and deformation of the target can be calculated as [45,46]:
The temporal coherence can be calculated by:
Here, the number of interferograms is . The differential interferometric phase is . is the topography-related phase that depends on the target height difference and is the deformation-related phase that depends on linear deformation difference . The last two terms are expressed respectively as [46]:
where is the interferometric normal baseline, is the temporal baseline, is the radar wavelength, is the sensor-target distance of target , and is the viewing angle of the SAR sensor.
The dispersions of the PS-estimated height and deformation velocity and can be expressed approximately as functions of the phase dispersion and baseline distribution [49]:
where , are interferometric normal and temporal baselines, respectively. is phase dispersion and it can be derived from the temporal coherence estimate by .
The accuracies of the height and deformation velocity estimates are dependent on the temporal coherence and baseline distribution but independent of the interferometric combination, and thus the expressions are useful for all time-series InSAR analysis techniques.
3.3. The Results of MT-InSAR Analysis
We derived the average subsidence velocity and displacement history information from PS InSAR analysis [45,46]. The estimated average subsidence velocity was geocoded and displayed using Google Earth imagery. The color scale showed an average subsidence velocity ranging from −100 to 20 mm/yr to a reference point that was assumed to be stable (the red point near Bandung mark in Figure 5). We set the temporal coherence threshold to 0.7 and identified more than 170,520 identified PS points. The temporal coherence that was selected as 0.7 is depending on the experience and the actual requirements. The selection of the temporal coherence has the influence on the deviation of the PSINSAR results. The description of the relationship between the temporal coherence and dispersion of displacement is given in Section 4. More details can be referred to [44,45,46]. The latter Equation (8) illustrates the relationship between the temporal coherence and dispersion of displacement. If the temporal coherence is set as 0.7, then the dispersion of displacement is 3.73 mm. The suitable temporal coherence can be selected by the experts and then the related dispersion of displacement that is extracted from PS can be determined.
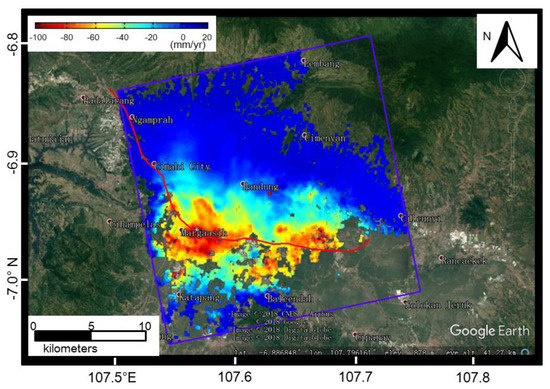
Figure 5.
Linear deformation trends of Sentinel-1 A/B along the line of sight (LOS) direction from 12 October 2014 to 7 December 2017. There are two major subsiding centers that are located in Margaarish Town. The color bar ranges from −100 to 20 mm/yr. The red point highlights the spatial reference points for PSI analysis.
The results showed an inhomogeneous distribution of PS candidates that were detected by Sentinel-1 A/B datasets with a short interval of 12 days—similar to previous TerraSAR-X data application [22]. For the same coverage area, fewer PS points were detected in the vegetated areas and more in the urban ones. The results showed that the two subsiding areas in Margaarish Town suffer from serious subsidence, consistent with previous research [40,50]. Notably, the path of the planned high-speed railway (depicted in Figure 5) will be affected by these two subsiding centers.
The planned railway line will be affected by considerable deformation from these two subsiding centers. The displacement map of the study area that was made through multi-temporal Sentinel-1 A/B InSAR data analysis along the line of sight (LOS) is shown in Figure 6. From the beginning acquisition date for SAR imagery, every three months sees the generation of a new displacement map. The displacement of the significantly subsiding area is more than 100 mm each year. Although the Sentinel-1 SAR data are affected by temporal de-correlation, most of Bandung City shows good coherence, with regional deformation over these areas that is able to be monitored using Sentinel-1 A/B data. The most serious subsiding area is affected by more than 120 mm displacement each year and the displacement value could be estimated by the difference from the displacement maps between 4 January 2015 and 23 January 2016, and between 23 January 2016 and 17 January 2017, respectively. The subsidence situation has increased over the time. Overall, the displacement of more than 280 mm was detected in these two seriously subsiding areas from 12 October 2014 to 7 December 2017. If the railway is constructed as expected, the high-speed railway will across these two most subsiding areas, and thus these areas should be monitored intensively in order to prevent the potential hazard due to land subsidence. The generated average deformation map in Figure 5 and geocoded displacement maps in Figure 6 reveal that Sentinel-1 data have great potential for use in monitoring of subsidence along the planned railway.
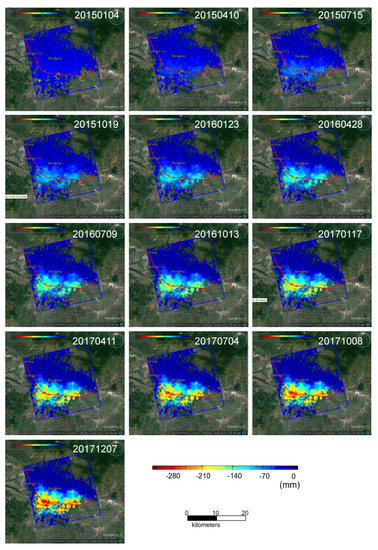
Figure 6.
Displacement history of Sentinel-1 A/B along the line of sight (LOS) direction. The displacement map is conducted between the date that is marked in the right upper corner and 12 October 2014 (the first acquisition date of SAR image). The selected displacement maps are presented. The time interval of each of the two maps is about two or three months. There are two major subsiding centers that are located in Margaarish Town. The color bar ranges from −300 to 0 mm.
The InSAR results that were derived from 2014 to 2017 show several major subsidence centers, with a maximum subsidence velocity of more than 120 mm/yr. The PS points are used to construct a Delaunay network. The subsidence velocity profile along the planned Jakarta–Bandung high-speed railway line in Bandung City can be extracted as illustrated in Figure 7. The subsidence velocity along the planned high-speed railway ranges from −100 to −20 mm/yr. The whole presented profile is 40 km long. The planned high-speed railway of the study areas ranges from 2 to 35.5 km (see it from 0.2 to 3.55 × 10⁻⁴ m in Figure 7). The planned high-speed railway will cross two major subsiding areas and they are located from 15 to 20 km, and from 25 to 3 km, respectively. We highlighted them with one black frame in Figure 7. These areas need more attention during the construction and operation of this high-speed railway.
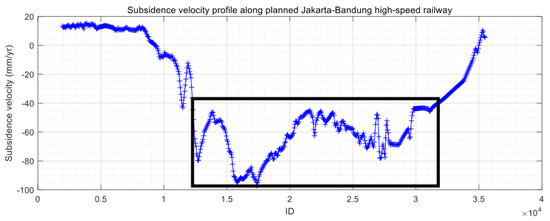
Figure 7.
The subsidence velocity profile along the planned Jakarta-Bandung high-speed railway. There are two subsiding areas that are located in Margaarish Town that suffer from the serious subsidence that us highlighted with a black rectangle. The subsidence velocity ranges from −100 to −20 mm/yr.
4. Validation with Leveling Data
In validation, we compared the average displacement rate between the PS results and leveling, assuming no horizontal deformation for the start points. Vertical stationary data are provided by leveling measurements, whereas regional deformation along light of sight (LOS) is detected by the InSAR results. To carry out the validation, multiplication of can project InSAR results vertically from LOS ( is the incidence angle-in this case, 43.78°). The process is equivalent to scaling the measured displacement along LOS by 0.722 (), decreasing the estimated root mean square error (RMSE) by a factor of 0.722.
The displacement of 11 months of leveling is calculated by the difference between observations that were acquired in May 2016 and April 2017, with an average velocity that was calculated based on 11 months’ deformation. Figure 1 indicates the locations of the 15 leveling points that were collected. We compared the average displacement rate of PS results and leveling data, with PS points selected using the nearest neighbor method. As no PS points were found around the leveling points 4, 13, and 14, these three points were discarded for comparison purposes. We then compared the InSAR results with the observations for the 12 remaining leveling points. Table 3 gives the validation results for the average displacement rate from InSAR results with leveling measurements, with precision that was evaluated by means of , calculated using the equation:
where is average displacement rate that was derived from interpolated PS results, leveling data, and the number of observation points.
Table 3.
Validation of an average displacement rate of PS results with leveling measurements (unit: mm/yr).
The dispersion of individual deformation measurements of PS point depends on the temporal coherence of PS targets and wavelength of SAR sensor (5.55 cm for Sentinel-1). It can be calculated as [38]:
In Table 3, the displacement rates between leveling and PS are calculated by two displacements with a one year interval. The dispersion of individual deformation measurements of PS point are calculated by Equation (2). The dispersion of the difference between two displacements is calculated as . In our case, the temporal coherence of PS targets is above 0.7. And then the dispersion of the difference between two displacements is given in Table 1, representing 2.5~4 mm dispersion of an average displacement rate of PS results.
Taking the leveling data to be the real value, the RMSE of Sentinel-1 PS results was 10.31 mm/yr. The minimum difference between these two distinct measurements was 0.49 mm/yr and the maximum error was 15.58 mm/yr. The range of the overall average displacement rate for Bandung City is wide, ranging from −126 to 0 mm/yr. Accordingly, the validation results are acceptable.
Moreover, the average subsidence velocity profile from MT-InSAR results can be plotted together with that from leveling along the planned Jakarta–Bandung high-speed railway. Figure 8 illustrates the two profiles along the planned railway line by point ID. The red cross indicates the results from the leveling data and the blue flower indicates those from the PS results. Both profiles’ results are in good agreement. The subsiding trends of these two measurements are similar, and two serious subsiding areas are detected. The validation experiments for Sentinel-1 PS results indicate a good potential for using Sentinel-1 multi-temporal InSAR data to monitor subsidence along the routes of planned high-speed railways owing to its high consistency with leveling measurements.
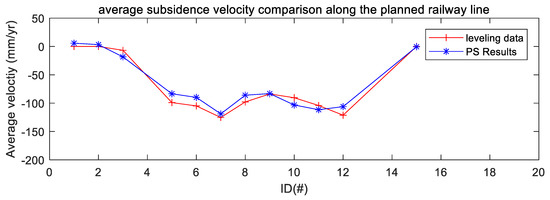
Figure 8.
The average subsidence velocity comparison along the planned railway line.
There were four points (3, 5, 7, and 11) along the planned high-speed railway that were selected; their displacement history from PS results is illustrated in Figure 9. Their displacement is plotted vertically. Figure 9a–d shows the displacement history of these four points. The average displacement velocity of these four points are −18.36 mm/yr, −83.46 mm/yr, −118.91 mm/yr, and −103.26 mm/yr, respectively. The time series of these points shows a strong linear displacement trend of these points from the MT-InSAR results.
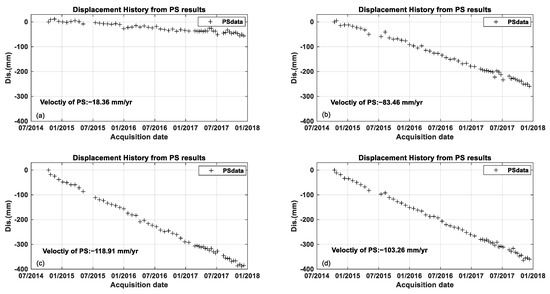
Figure 9.
The displacement history of four selected PS points along the vertical direction from PS results along a planned high-speed railway. The black crosses represent the displacements history from PS results. (a–d) shows the extracted displacement history at the points of ID3, ID5, ID7, and ID11, respectively.
5. Discussion
The results that were just presented demonstrate that subsidence situation and history along the planned Jakarta-Bandung high-speed railway in Bandung, Indonesia, could be investigated through Sentinel-1 A/B MT-InSAR analysis. A comparison of the results between MT-InSAR analysis and leveling measurements indicated that MT-InSAR results from Sentinel-1 can provide a precise history of subsidence information and achieve centimeter-level accuracy along the route of a planned high-speed railway. The advantages of continuity, low cost, and high precision offer more chances for applying MT-InSAR to ground stability conditions investigation during the design stage of high-speed railway lines. Moreover, the free, open nature and short time interval of Sentinel-1 A/B data will help promote similar research around the world, helping give rise to approaches for investigating the environment and assessing potential risks along the routes of planned/constructed high-speed railways.
The previous research [51,52] revealed that the weather influence could take effect on the S1 images and the atmospheric effect on SAR images has been evaluated. In our paper, we applied PSINSAR analysis to process the S1 time series INSAR images. The advantage of PSINSAR analysis is that it can estimate and remove the atmospheric effect and then the deformation signal can be estimated precisely. Millimeter deformation information can be extracted from PSINSAR analysis. For more details about the principle of PSINSAR, refer to Section 3.1 and the references [45,46].
The path of the planned railway will cross two subsiding centers in Margaarish Town, Bandung City, Indonesia. The regional subsidence along the path of the planned high-speed railway can be estimated precisely, and a number of PS targets were identified from multi-temporal Sentinel-1 A/B images. However, the subsiding trend over the planned railway region is a source of stress and may come to exceed the protection capability of the railway foundations. By conducting MT-InSAR analysis in advance of railway route design, railway lines can be settled in other places so as to avoid crossing subsiding centers. Even when a railway’s path cannot be changed during the design step, it remains necessary to highlight these subsiding centers and step up the monitoring of the railway under the associated geological conditions while taking necessary countermeasures.
In this case, the PS density along the route of the planned high-speed railway is high and shows acceptable precision. The limitation of our applied approach is that it only looks for PS targets and distributed targets cannot be extracted. If there are not enough PS targets that are located in the study areas, distributed targets can be extracted with SqueeSAR methods [13] or other similar methods [1]. Moreover, additional factors must be taken into consideration in real-world applications: target numbers for the same area, orientation of linear manmade features, and availability of data. Under conditions that lack PS targets because of the orientation of a railway, combining MT-InSAR results from ascending and descending data is a possible solution. When the number of identified targets is insufficient, corner reflectors that are designed for Sentinel-1 data can be settled to increase the density of PS targets and eventually improve the precision of the final PS results. Moreover, under different conditions, combining data of different wavelengths offers more chances to advance the understanding of investigating subsidence mechanisms.
The excessive use of underground water resources is a major reason for the serious degree of subsidence that is seen in Bandung City [40]. The previous research [49] revealed that the aquifer damage, especially deep aquifer damage, is most possibly due to excessive ground water extraction. Most subsiding areas are given to industrial land use, so groundwater extraction for industrial use is a possible primary cause for the rapid subsidence of these areas. Constant subsidence velocity of the subsiding areas is almost linear, without any obvious seasonal variability. There are two possible reasons for this: (1) Water withdrawal depends mainly on confined aquifers that have little impact on seasonal recharge and (2) greater demand for water withdrawal happens during the rainy season, not exceeding the recharge of the shallows in unconfined aquifers. In short, well depth is a key condition causing seasonal variations in subsidence. The lack of seasonal change represents water extraction from confined aquifers or water withdrawal did not exceed the recharge of the shallows in unconfined aquifers. If there are seasonal deformation, we can remove it by PSINSAR processing with the estimation of the seasonal deformation signal.
In addition to underground water withdrawal, there is still natural compaction of the Holocene sediments in the Bandung basin [50]. As illustrated in Figure 2, the Bandung basin is covered by different formations including Kosambi, Cibeureum, and Cikapundung formations. The central surface of Bandung, covered by Kosambi, has suffered serious subsidence and the components consist of clay, siltstone, and sandstones. As illustrated in Figure 2, the Cibeureum formation and Cikapundung formation are below the Kosambi formation. The Cibeureum formation is composed of alluvial fan deposits and clastic Volcano deposits. The Kosambi and Cibeureum formations are possibly still undergoing natural compaction. The subsiding areas are mainly covered by Kosambi and Cibeureum formation. Moreover, the subsidence rates ranging from 40 to 60 mm/yr result from sediment compaction that is caused by a combination of natural and anthropogenic processes, as revealed in [53]. The tectonic movement should have a possible influence on the deformation in Bandung areas. There are several faults crossing the Bandung basin. If the areas that are suffered by subsidence are passed by faults, further geological study is required to investigate the faults contribution on the land subsidence [50].
6. Conclusions
In the early stages of high-speed railway design, there is little opportunity to obtain precise mapping and geological data. High cost and low spatial sampling are two major limitations of classical leveling and GNSS measurements. High-resolution SAR data (e.g., TerraSAR and CosmoSkymed) has demonstrated its potential for monitoring subsidence over high-speed railways, but the cost of the data is high. Free access to Sentinel-1 offers more chances to carry forward the InSAR applications. Accordingly, this paper presented Sentinel-1 MT-InSAR analysis for monitoring subsidence along the planned Jakarta–Bandung high-speed railway in Bandung, Indonesia. The MT-InSAR results and leveling points (located along the planned Jakarta-Bandung high-speed railway) were validated. Classical MT-InSAR analysis was applied and the subsidence areas along the planned Jakarta–Bandung high-speed railway was extracted. Sentinel-1MT-InSAR analysis extracted a number of PS targets along the planned Jakarta-Bandung high-speed railway, demonstrating Sentinel-1 MT-InSAR analysis’s potential for monitoring subsidence when designing new high-speed railways (see Figure 5 and Figure 6). The subsidence velocity profile along the planned Jakarta–Bandung high-speed railway was extracted as illustrated in Figure 7. Validation experiments of Sentinel-1 MT-InSAR analysis were carried out. Using 12 check points, the dispersion between MT-InSAR results and leveling was 10.31 mm/yr based on a comparison with the average subsidence rate (see Table 1). The deformation velocity profile from the Sentinel-1 MT-InSAR results matched well with those that were derived from the leveling data along the planned Jakarta–Bandung high-speed railway. The time series of subsidence history from MT-InSAR results shows a high linear subsidence velocity without clear seasonal change. The planned Jakarta–Bandung high-speed railway is affected by considerable deformation from these two subsiding centers. Underground water withdrawal, mostly for local industrial use, is a significant cause of serious subsidence in Bandung City. This work will serve as a reference for further planning of monitoring of subsidence and evaluation of potential risks that are associated with planning of high-speed railway.
Author Contributions
Conceptualization, Q.L. and Y.Z.; methodology, Q.L.; software, J.L.; validation, Q.L., J.L. and Y.Z.; formal analysis, Q.L.; investigation, J.L.; resources, Q.L.; data curation, Q.L.; writing—original draft preparation, Q.L.; writing—review and editing, Y.Z.; visualization, Q.L., J.L.; supervision, Y.Z.; project administration, Q.L.; funding acquisition, Q.L. All authors have read and agreed to the published version of the manuscript.
Funding
This research was supported by partial support of the National Natural Science Foundation of China (grant No. 41601446 and U1901215), Key Project of Tianjin Natural Science Foundation (grant No. 21JCZDJC00670), National Engineering Laboratory for Digital Construction and Evaluation Technology of Urban Rail Transit (grant No. 2021ZH04), and Tianjin Transportation Science and Technology Development Project (grant No. 2020-02, 2022-40), and the Marine Special Program of Jiangsu Province in China (JSZRHYKJ202007).
Acknowledgments
Sentinel-1 A/B data are provided by European Space Agency (ESA) and the software SARProz for MT-InSAR analysis in this work that was developed by Daniele Perissin are highly appreciated.
Conflicts of Interest
The authors declare no conflict of interest.
References
- Luo, Q.; Perissin, D.; Zhang, Y.; Jia, Y. L- and X-Band Multi-Temporal InSAR Analysis of Tianjin Subsidence. Remote Sens. 2014, 6, 7933. [Google Scholar] [CrossRef]
- Ferretti, A.; Savio, G.; Barzaghi, R.; Borghi, A.; Musazzi, S.; Novali, F.; Prati, C.; Rocca, F. Submillimeter accuracy of InSAR time series: Experimental validation. IEEE Trans. Geosci. Remote Sens. 2007, 45, 1142–1153. [Google Scholar] [CrossRef]
- Chen, F.; Guo, H.; Ishwaran, N.; Liu, J.; Wang, X.; Zhou, W.; Tang, P. Understanding the relationship between the water crisis and sustainability of the Angkor World Heritage site. Remote Sens. Environ. 2019, 232, 111293. [Google Scholar] [CrossRef]
- Chen, F.; Guo, H.; Ma, P.; Lin, H.; Wang, C.; Ishwaran, N.; Hang, P. Radar interferometry offers new insights into threats to the Angkor site. Sci. Adv. 2017, 3, e1601284. [Google Scholar] [CrossRef] [PubMed]
- Duro, J.; Inglada, J.; Closa, J.; Adam, N.; Arnaud, A. High resolution differential interferometry using time series of ERS and ENVISAT SAR data. In Proceedings of the FRINGE 2003 Workshop, Frascati, Italy, 1–5 December 2003; p. 72. [Google Scholar]
- Van der Kooij, M. Coherent target analysis. In Proceedings of the 3rd International Workshop on ERS SAR Interferometry (FRINGE 2003), Frascati, Italy, 1–5 December 2003; pp. 2–5. [Google Scholar]
- Van Lijen, F.; Ketelaar, V.; Marinkovic, P.; Hanssen, R. Persistent scatterer interferometry: Precision, reliability and integration. In Proceedings of the ISPRS Workshop, High-Resolution Earth Imaging Geospatial Inf, Hannover, Germany, 17–20 May 2005; pp. 17–20. [Google Scholar]
- Werner, C.; Wegmuller, U.; Strozzi, T.; Wiesmann, A. Interferometric point target analysis for deformation mapping. In Proceedings of the 2003 IEEE Geoscience and Remote Sensing Symposium, Toulouse, France, 21–25 July 2003; pp. 4362–4364. [Google Scholar]
- Adam, N.; Kampes, B.; Eineder, M. Development of a Scientific Permanent Scatterer System: Modifications for Mixed ERS/ENVISAT Time Series. In Proceedings of the Envisat Symposium 2004, Salzburg, Austria, 6–10 September 2004. [Google Scholar]
- Berardino, P.; Fornaro, G.; Lanari, R.; Manunta, M.; Manzo, M.; Pepe, A.; Sansosti, E. A Two-Scale Differential SAR Interferometry Approach for Investigating Earth Surface Deformations. In Proceedings of the 2003 IEEE Geoscience and Remote Sensing Symposium, Toulouse, France, 21–25 July 2003; pp. 1184–1186. [Google Scholar]
- Berardino, P.; Fornaro, G.; Lanari, R.; Sansosti, E. A new algorithm for surface deformation monitoring based on small baseline differential SAR interferograms. IEEE Trans. Geosci. Remote Sens. 2002, 40, 2375–2383. [Google Scholar] [CrossRef]
- Lanari, R.; Mora, O.; Manunta, M.; Mallorquí, J.J.; Berardino, P.; Sansosti, E. A small-baseline approach for investigating deformations on full-resolution differential SAR interferograms. IEEE Trans. Geosci. Remote Sens. 2004, 42, 1377–1386. [Google Scholar] [CrossRef]
- Ferretti, A.; Fumagalli, A.; Novali, F.; Prati, C.; Rocca, F.; Rucci, A. A New Algorithm for Processing Interferometric Data-Stacks: SqueeSAR. IEEE Trans. Geosci. Remote Sens. 2011, 49, 3460–3470. [Google Scholar] [CrossRef]
- Hooper, A.; Zebker, H.; Segall, P.; Kampes, B. A new method for measuring deformation on volcanoes and other natural terrains using InSAR persistent scatterers. Geophys. Res. Lett. 2004, 31, L23611. [Google Scholar] [CrossRef]
- Bateson, L.; Novellino, A. 2019 Glasgow Geothermal Energy Research Field Site: Ground Motion Survey Report. Nottingham, UK, British Geological Survey, 35pp. (OR/18/054). Available online: https://nora.nerc.ac.uk/id/eprint/524555/ (accessed on 30 July 2019).
- Ferretti, A.; Bianchi, M.; Prati, C.; Rocca, F. Higher-order permanent scatterers analysis. Eurasip J. Appl. Signal Process. 2005, 20, 3231–3242. [Google Scholar] [CrossRef]
- Fornaro, G.; Serafino, F.; Reale, D. 4-D SAR Imaging: The Case Study of Rome. IEEE Geosci. Remote Sens. Lett. 2020, 7, 236–240. [Google Scholar] [CrossRef]
- Chen, F.; Wu, Y.; Zhang, Y.; Parcharidis, I.; Ma, P.; Xiao, R.; Xu, J.; Zhou, W.; Tang, P.; Foumelis, M. Surface motion and structural instability monitoring of ming dynasty city walls by two-step tomo-psinsar approach in Nanjing city, China. Remote Sens. 2010, 9, 371. [Google Scholar] [CrossRef]
- Wang, Y.; Zhu, X.X.; Zeisl, B.; Pollefeys, M. 2016. Fusing meter-resolution 4-D InSAR point clouds and optical images for semantic urban infrastructure monitoring. IEEE Trans. Geosci. Remote Sens. 2016, 55, 14–26. [Google Scholar] [CrossRef]
- Zhu, X.X.; Shahzad, M. Facade Reconstruction Using Multiview Spaceborne TomoSAR Point Clouds. IEEE Trans. Geosci. Remote Sens. 2014, 52, 3541–3552. [Google Scholar] [CrossRef]
- Baade, J.; Schmullius, C.C. Interferometric microrelief sensing with TerraSAR-X—First results. IEEE Trans. Geosci. Remote Sens. 2010, 48, 965–970. [Google Scholar] [CrossRef]
- Luo, Q.; Zhou, G.; Perissin, D. Monitoring of Subsidence along Jingjin Inter-City Railway with High-Resolution TerraSAR-X MT-InSAR Analysis. Remote Sens. 2017, 9, 717. [Google Scholar] [CrossRef]
- Liu, G.X.; Jia, H.G.; Zhang, R.; Zhang, H.X.; Jia, H.L.; Yu, B.; Sang, M.Z. Exploration of Subsidence Estimation by Persistent Scatterer InSAR on Time Series of High Resolution TerraSAR-X Images. IEEE J. Sel. Top. Appl. Earth Obs. Remote Sens. 2011, 4, 159–170. [Google Scholar] [CrossRef]
- Perissin, D.; Zhiying, W.; Hui, L. Shanghai subway tunnels and highways monitoring through Cosmo-SkyMed Persistent Scatterers. ISPRS J. Photogramm. Remote Sens. 2012, 73, 58–67. [Google Scholar] [CrossRef]
- Fornaro, G.; Reale, D.; Verde, S. Bridge Thermal Dilation Monitoring with Millimeter Sensitivity via Multidimensional SAR Imaging. IEEE Geosci. Remote Sens. Lett. 2013, 10, 677–681. [Google Scholar] [CrossRef]
- Qin, X.; Liao, M.; Zhang, L.; Yang, M. Structural health and stability assessment of high-speed railways via thermal dilation mapping with time-series InSAR analysis. IEEE J. Sel. Top. Appl. Earth Obs. Remote Sens. 2017, 10, 2999–3010. [Google Scholar] [CrossRef]
- Monserrat, O.; Crosetto, M.; Cuevas, M.; Crippa, B. The Thermal Expansion Component of Persistent Scatterer Interferometry Observations. IEEE Geosci. Remote Sens. Lett. 2011, 8, 864–868. [Google Scholar] [CrossRef]
- Crosetto, M.; Monserrat, O.; Cuevas-Gonzalez, M.; Devanthery, N.; Luzi, G.; Crippa, B. Measuring thermal expansion using X-band persistent scatterer interferometry. ISPRS J. Photogramm. Remote Sens. 2015, 100, 84–91. [Google Scholar] [CrossRef]
- Upadhyay, P.; Czerkawski, M.; Davison, C.; Cardona, J.; Macdonald, M.; Andonovic, I.; Michie, C.; Atkinson, R.; Papadopoulou, N.; Nikas, K.; et al. A Flexible Multi-Temporal and Multi-Modal Framework for Sentinel-1 and Sentinel-2 Analysis Ready Data. Remote Sens. 2022, 14, 1120. [Google Scholar] [CrossRef]
- Boni, R.; Bordoni, M.; Vivaldi, V.; Troisi, C.; Tararbra, M.; Lanteri, L.; Zucca, F.; Meisina, C. Assessment of the Sentinel-1 based ground motion data feasibility for large scale landslide monitoring. Landslides 2020, 17, 2287–2299. [Google Scholar] [CrossRef]
- Weiss, J.R.; Walters, R.J.; Morishita, Y.; Wright, T.J.; Lazecky, M.; Wang, H.; Hussain, E.; Hooper, A.J.; Elliott, J.R.; Rollins, C. High-resolution surface velocities and strain for Anatolia from Sentinel-1 InSAR and GNSS data. Geophys. Res. Lett. 2020, 47, e2020GL087376. [Google Scholar] [CrossRef]
- Grandin, R.; Vallée, M.; Lacassin, R. Rupture process of the Mw 5.8 Pawnee, Oklahoma, earthquake from Sentinel-1 InSAR and seismological data. Seismol. Res. Lett. 2017, 88, 994–1004. [Google Scholar] [CrossRef]
- Solari, L.; Barra, A.; Herrera, G.; Bianchini, S.; Monserrat, O.; Béjar-Pizarro, M.; Crosetto, M.; Sarro, R.; Moretti, S. Fast detection of ground motions on vulnerable elements using Sentinel-1 InSAR data. Geomat. Nat. Hazards Risk 2018, 9, 152–174. [Google Scholar] [CrossRef]
- Li, Y.S.; Jiang, W.L.; Zhang, J.F. A time series processing chain for geological disasters based on a GPU-assisted sentinel-1 InSAR processor. Nat. Hazards 2022, 111, 803–815. [Google Scholar] [CrossRef]
- Choe, B.H.; Blais-Stevens, A.; Samsonov, S.; Dudley, J. Sentinel-1 and RADARSAT Constellation Mission InSAR Assessment of Slope Movements in the Southern Interior of British Columbia, Canada. Remote Sens. 2021, 13, 3999. [Google Scholar] [CrossRef]
- Braun, A. Retrieval of digital elevation models from Sentinel-1 radar data-open applications, techniques, and limitations. Open Geosci. 2021, 13, 532–569. [Google Scholar] [CrossRef]
- Morishita, Y. Nationwide urban ground deformation monitoring in Japan using Sentinel-1 LiCSAR products and LiCSBAS. Prog. Earth Planet. Sci. 2021, 8, 6. [Google Scholar] [CrossRef]
- Julzarika, A. Detection of vertical deformation in Jakarta-Bandung high-speed train route using Xsar and sentinel. Geod. Cartography. 2019, 45, 169–176. [Google Scholar] [CrossRef]
- Ardha, M.; Suhadha, A.G.; Julzarika, A.; Yulianto, F.; Yudhatama, D.; Darwista, R.Z. Utilization of Sentinel-1 Satellite Imagery Data to Support Land Subsidence Analysis in DKI Jakarta, Indonesia. J. Degrad. Min. Lands Manag. 2020, 8, 2587–2593. [Google Scholar] [CrossRef]
- Chaussard, E.; Amelung, F.; Abidin, H.; Hong, S.-H. Sinking cities in Indonesia: ALOS PALSAR detects rapid subsidence due to groundwater and gas extraction. Remote Sens. Environ. 2013, 128, 150–161. [Google Scholar] [CrossRef]
- Ge, L.; Ng, A.H.-M.; Li, X.; Abidin, H.Z.; Gumilar, I. Land subsidence characteristics of Bandung Basin as revealed by ENVISAT ASAR and ALOS PALSAR interferometry. Remote Sens. Environ. 2014, 154, 46–60. [Google Scholar] [CrossRef]
- Perissin, D.; Wang, Z.; Wang, T. The SARPROZ InSAR tool for urban subsidence/manmade structure stability monitoring in China. In Proceedings of the ISRSE, Sydney, Australia, 10–15 April 2011. [Google Scholar]
- Abidin, H.Z.; Andreas, H.; Gamal, M.; Darmawan, D. Land subsidence characteristics of Bandung Basin (Indonesia) between 2000 and 2005 as estimated from GPS surveys. In Proceedings of the XXIII International FIG Congress, Munich, Germany, 8–13 October 2006; pp. 8–13. [Google Scholar]
- Luo, Q.; Perissin, D.; Lin, H.; Zhang, Y.; Wang, W. Subsidence monitoring of Tianjin suburbs by TerraSAR-X persistent scatterers interferometry. IEEE J. Sel. Top. Appl. Earth Obs. Remote Sens. 2014, 7, 1642–1650. [Google Scholar] [CrossRef]
- Ferretti, A.; Prati, C.; Rocca, F. Nonlinear subsidence rate estimation using permanent scatterers in differential SAR interferometry. IEEE Trans. Geosci. Remote Sens. 2000, 38, 2202–2212. [Google Scholar] [CrossRef]
- Ferretti, A.; Prati, C.; Rocca, F. Permanent scatterers in SAR interferometry. IEEE Trans. Geosci. Remote Sens. 2001, 39, 8–20. [Google Scholar] [CrossRef]
- Rucci, A.; Ferretti, A.; Guarnieri, A.M.; Rocca, F. Sentinel 1 SAR interferometry applications: The outlook for sub millimeter measurements. Remote Sens. Environ. 2012, 120, 156–163. [Google Scholar] [CrossRef]
- Rosen, P.A.; Hensley, S.; Joughin, I.R.; Li, F.K.; Madsen, S.N.; Rodriguez, E.; Goldstein, R.M. Synthetic aperture radar interferometry. Proc. IEEE 2000, 88, 333–382. [Google Scholar] [CrossRef]
- Colesanti, C.; Ferretti, A.; Prati, C.; Rocca, F. Monitoring landslides and tectonic motions with the Permanent Scatterers Technique. Eng. Geol. 2003, 68, 3–14. [Google Scholar] [CrossRef]
- Gumilar, I.; Abidin, H.Z.; Hutasoit, L.M.; Hakim, D.M.; Sidiq, T.P.; Andreas, H. Land Subsidence in Bandung Basin and its Possible Caused Factors. Procedia Earth Planet. Sci. 2015, 12, 47–62. [Google Scholar] [CrossRef]
- Danklmayer, A.; Doring, B.J.; Schwerdt, M.; Chandra, M. Assessment of Atmospheric Propagation Effects in SAR Images. IEEE Trans. Geosci. Remote Sens. 2009, 47, 3507–3518. [Google Scholar] [CrossRef]
- Albino, F.; Biggs, J.; Syahbana, D.K. Dyke intrusion between neighbouring arc volcanoes responsible for 2017 pre-eruptive seismic swarm at Agung. Nat. Commun. 2019, 10, 748. [Google Scholar] [CrossRef] [PubMed]
- Du, Z.; Ge, L.; Ng, A.H.-M.; Zhu, Q.; Yang, X.; Li, L. Correlating the subsidence pattern and land use in Bandung, Indonesia with both Sentinel-1/2 and ALOS-2 satellite images. Int. J. Appl. Earth Obs. Geoinf. 2018, 67, 54–68. [Google Scholar] [CrossRef]
Publisher’s Note: MDPI stays neutral with regard to jurisdictional claims in published maps and institutional affiliations. |
© 2022 by the authors. Licensee MDPI, Basel, Switzerland. This article is an open access article distributed under the terms and conditions of the Creative Commons Attribution (CC BY) license (https://creativecommons.org/licenses/by/4.0/).