
A Short-Term Forecasting Method of Inter-Frequency Clock Bias for GPS Block IIF Satellites


Abstract
:
1. Introduction
2. Methods
2.1. Trible-Frequency Uncombined PPP
2.2. Method of IFCB Estimation
3. Results
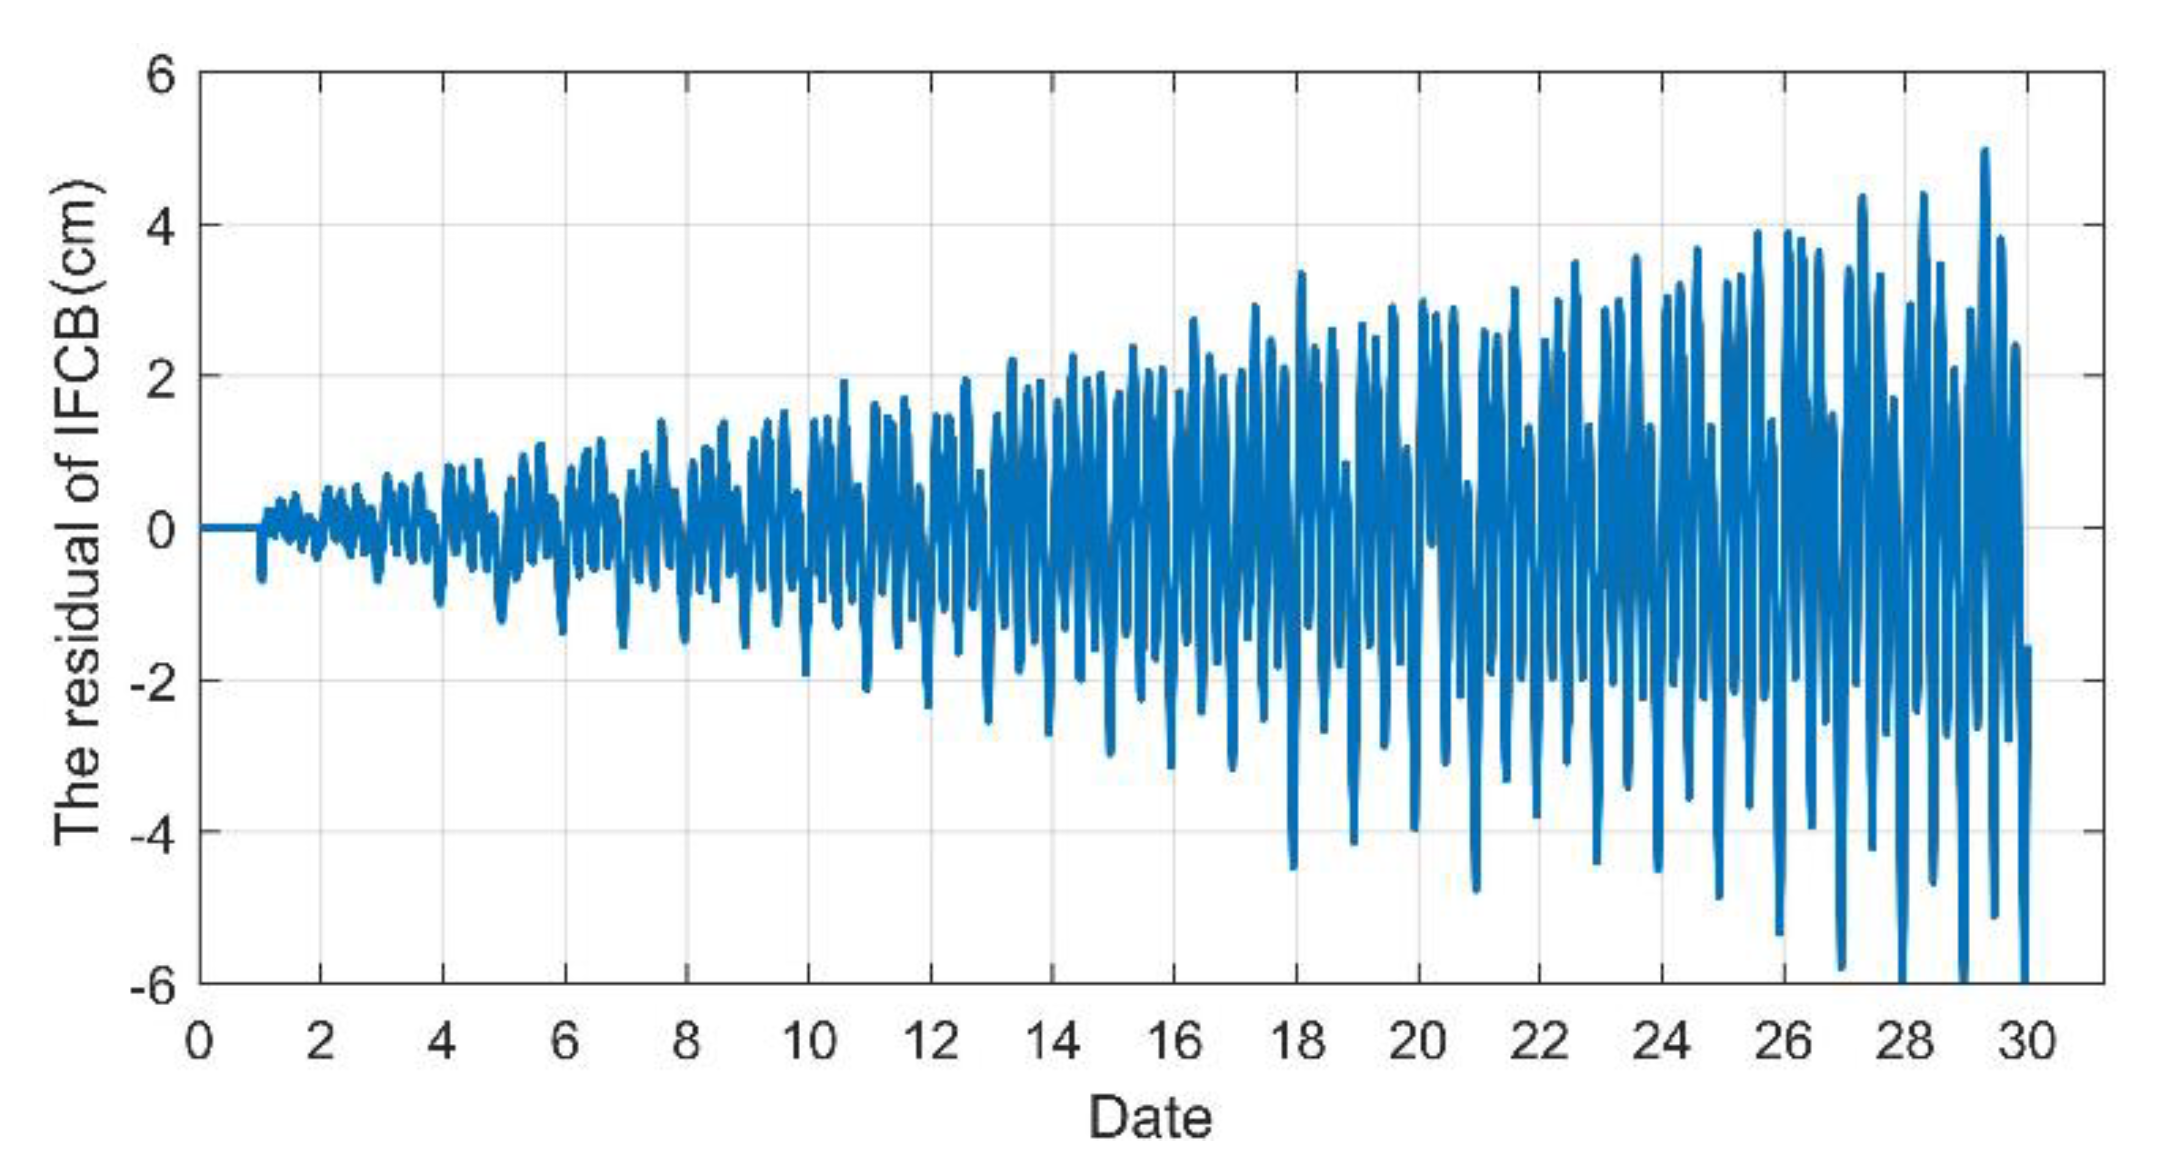
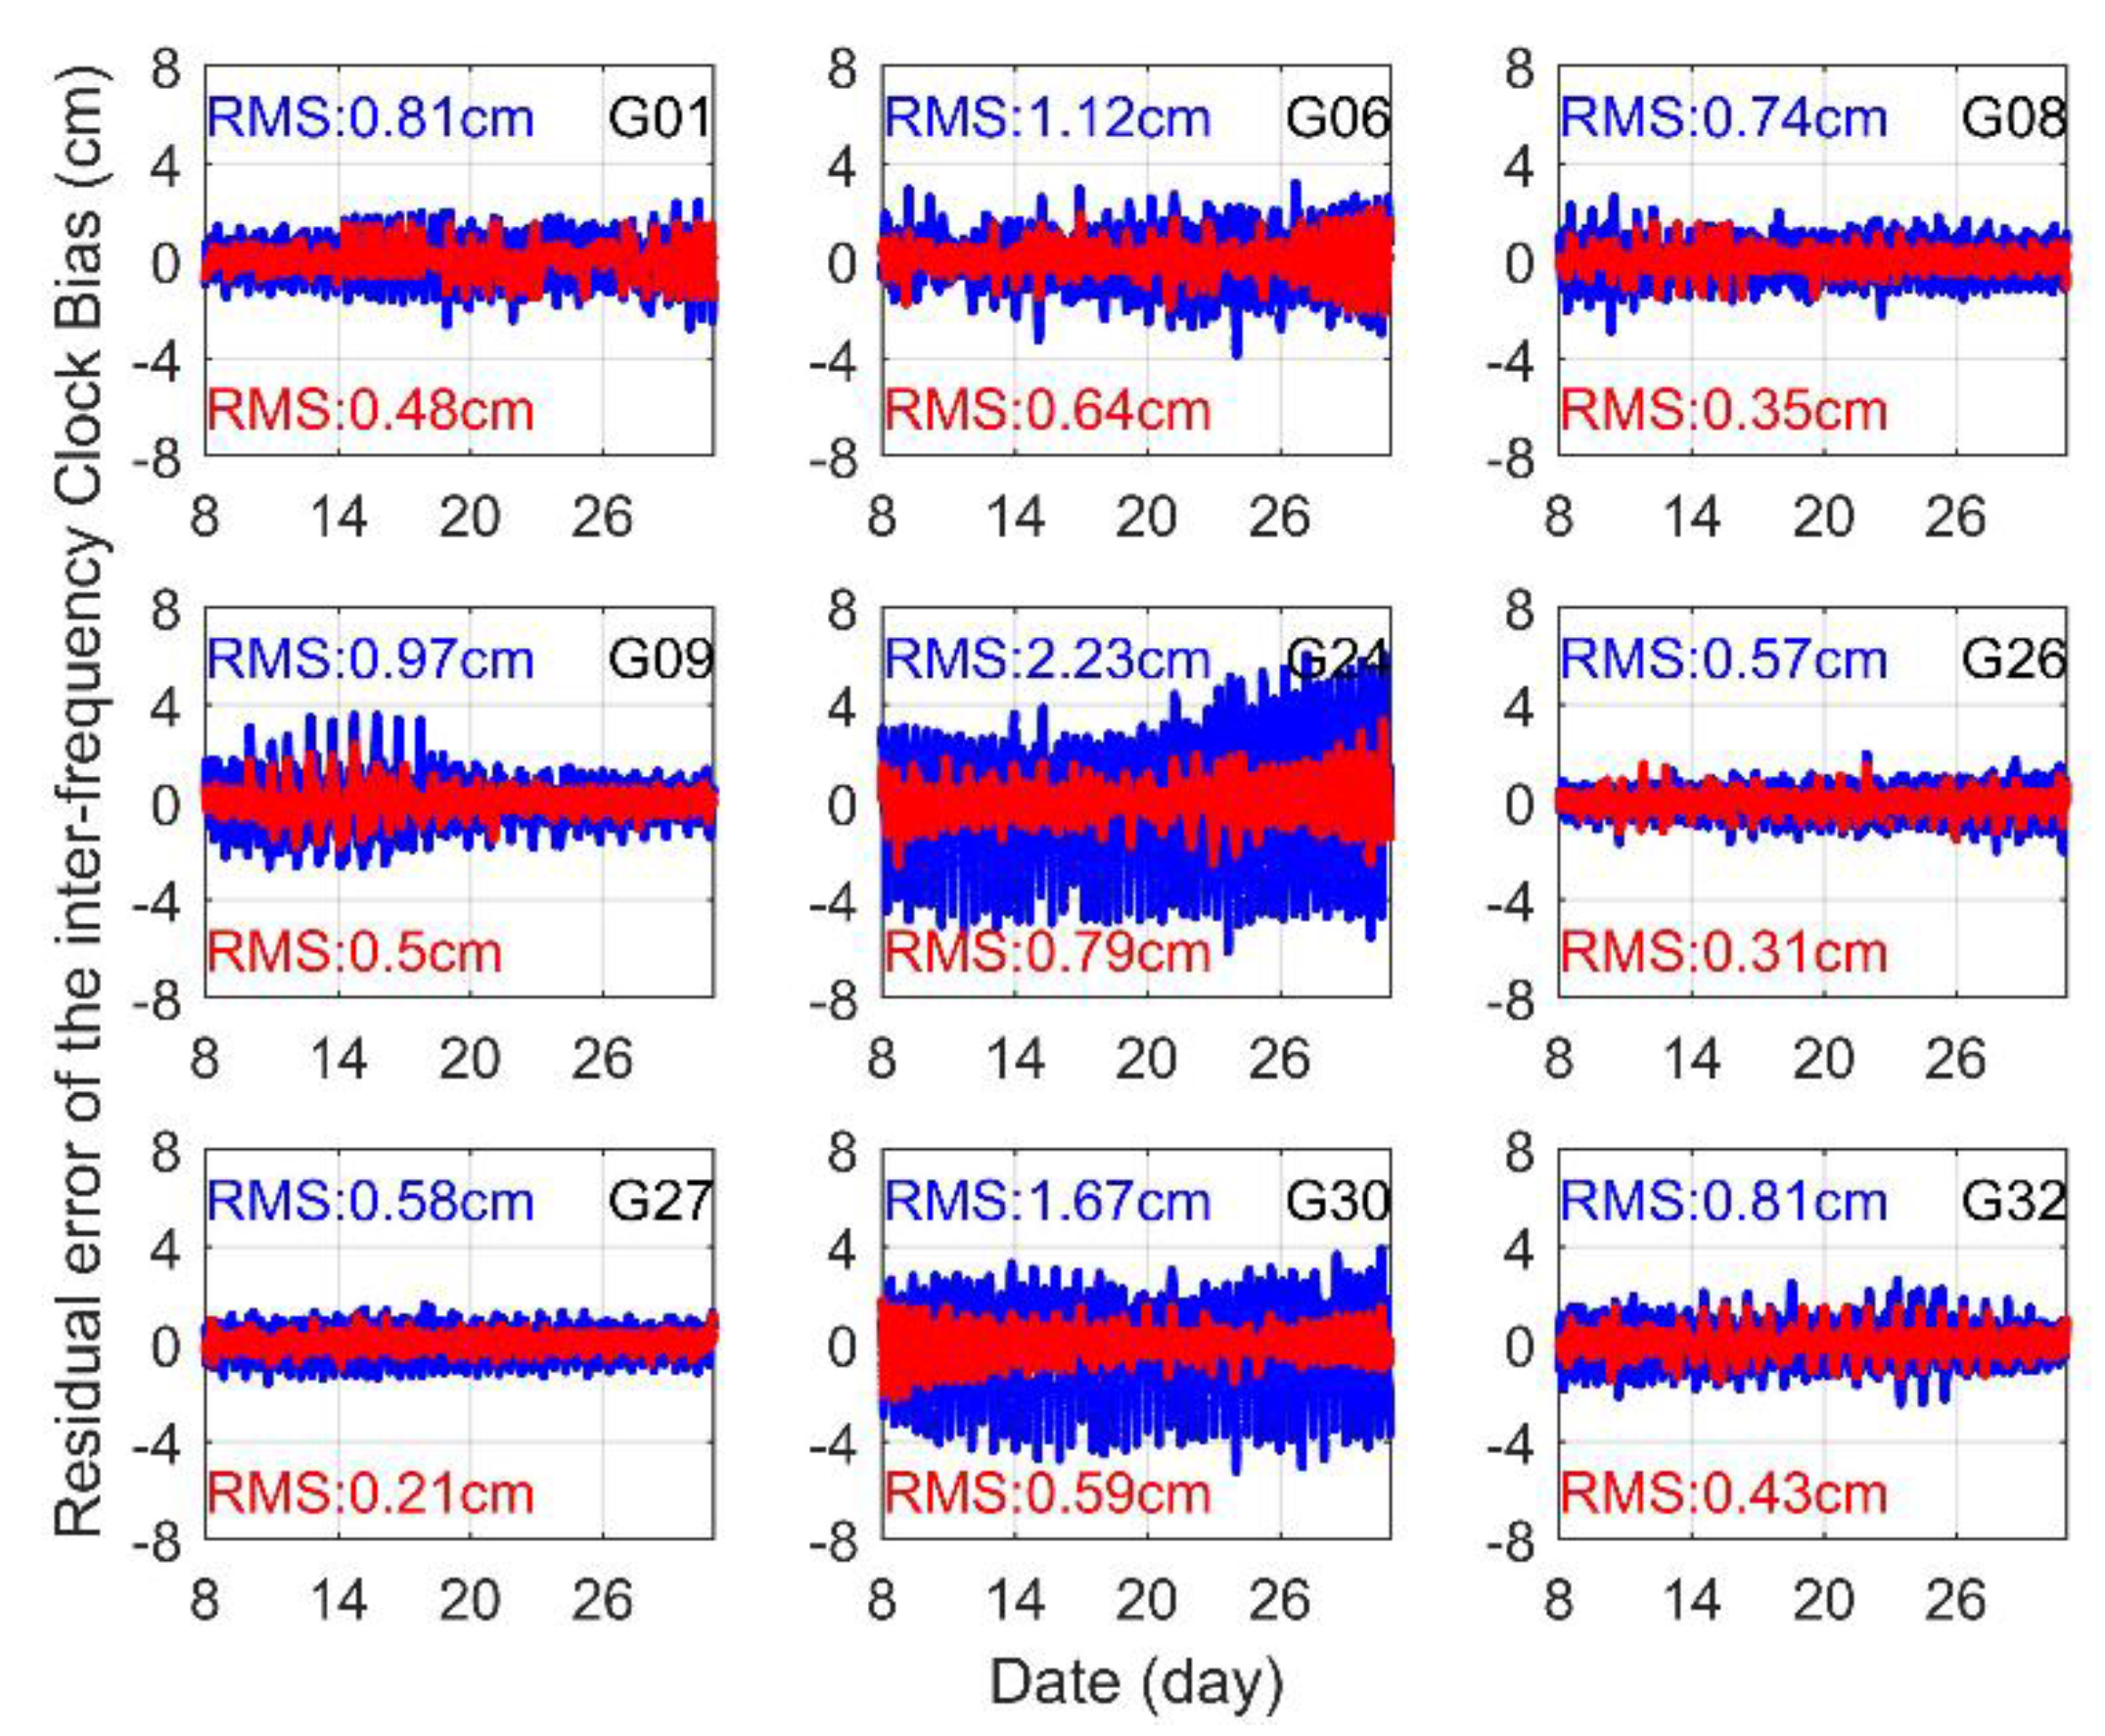
3.1. Extraction of GPS IFCB
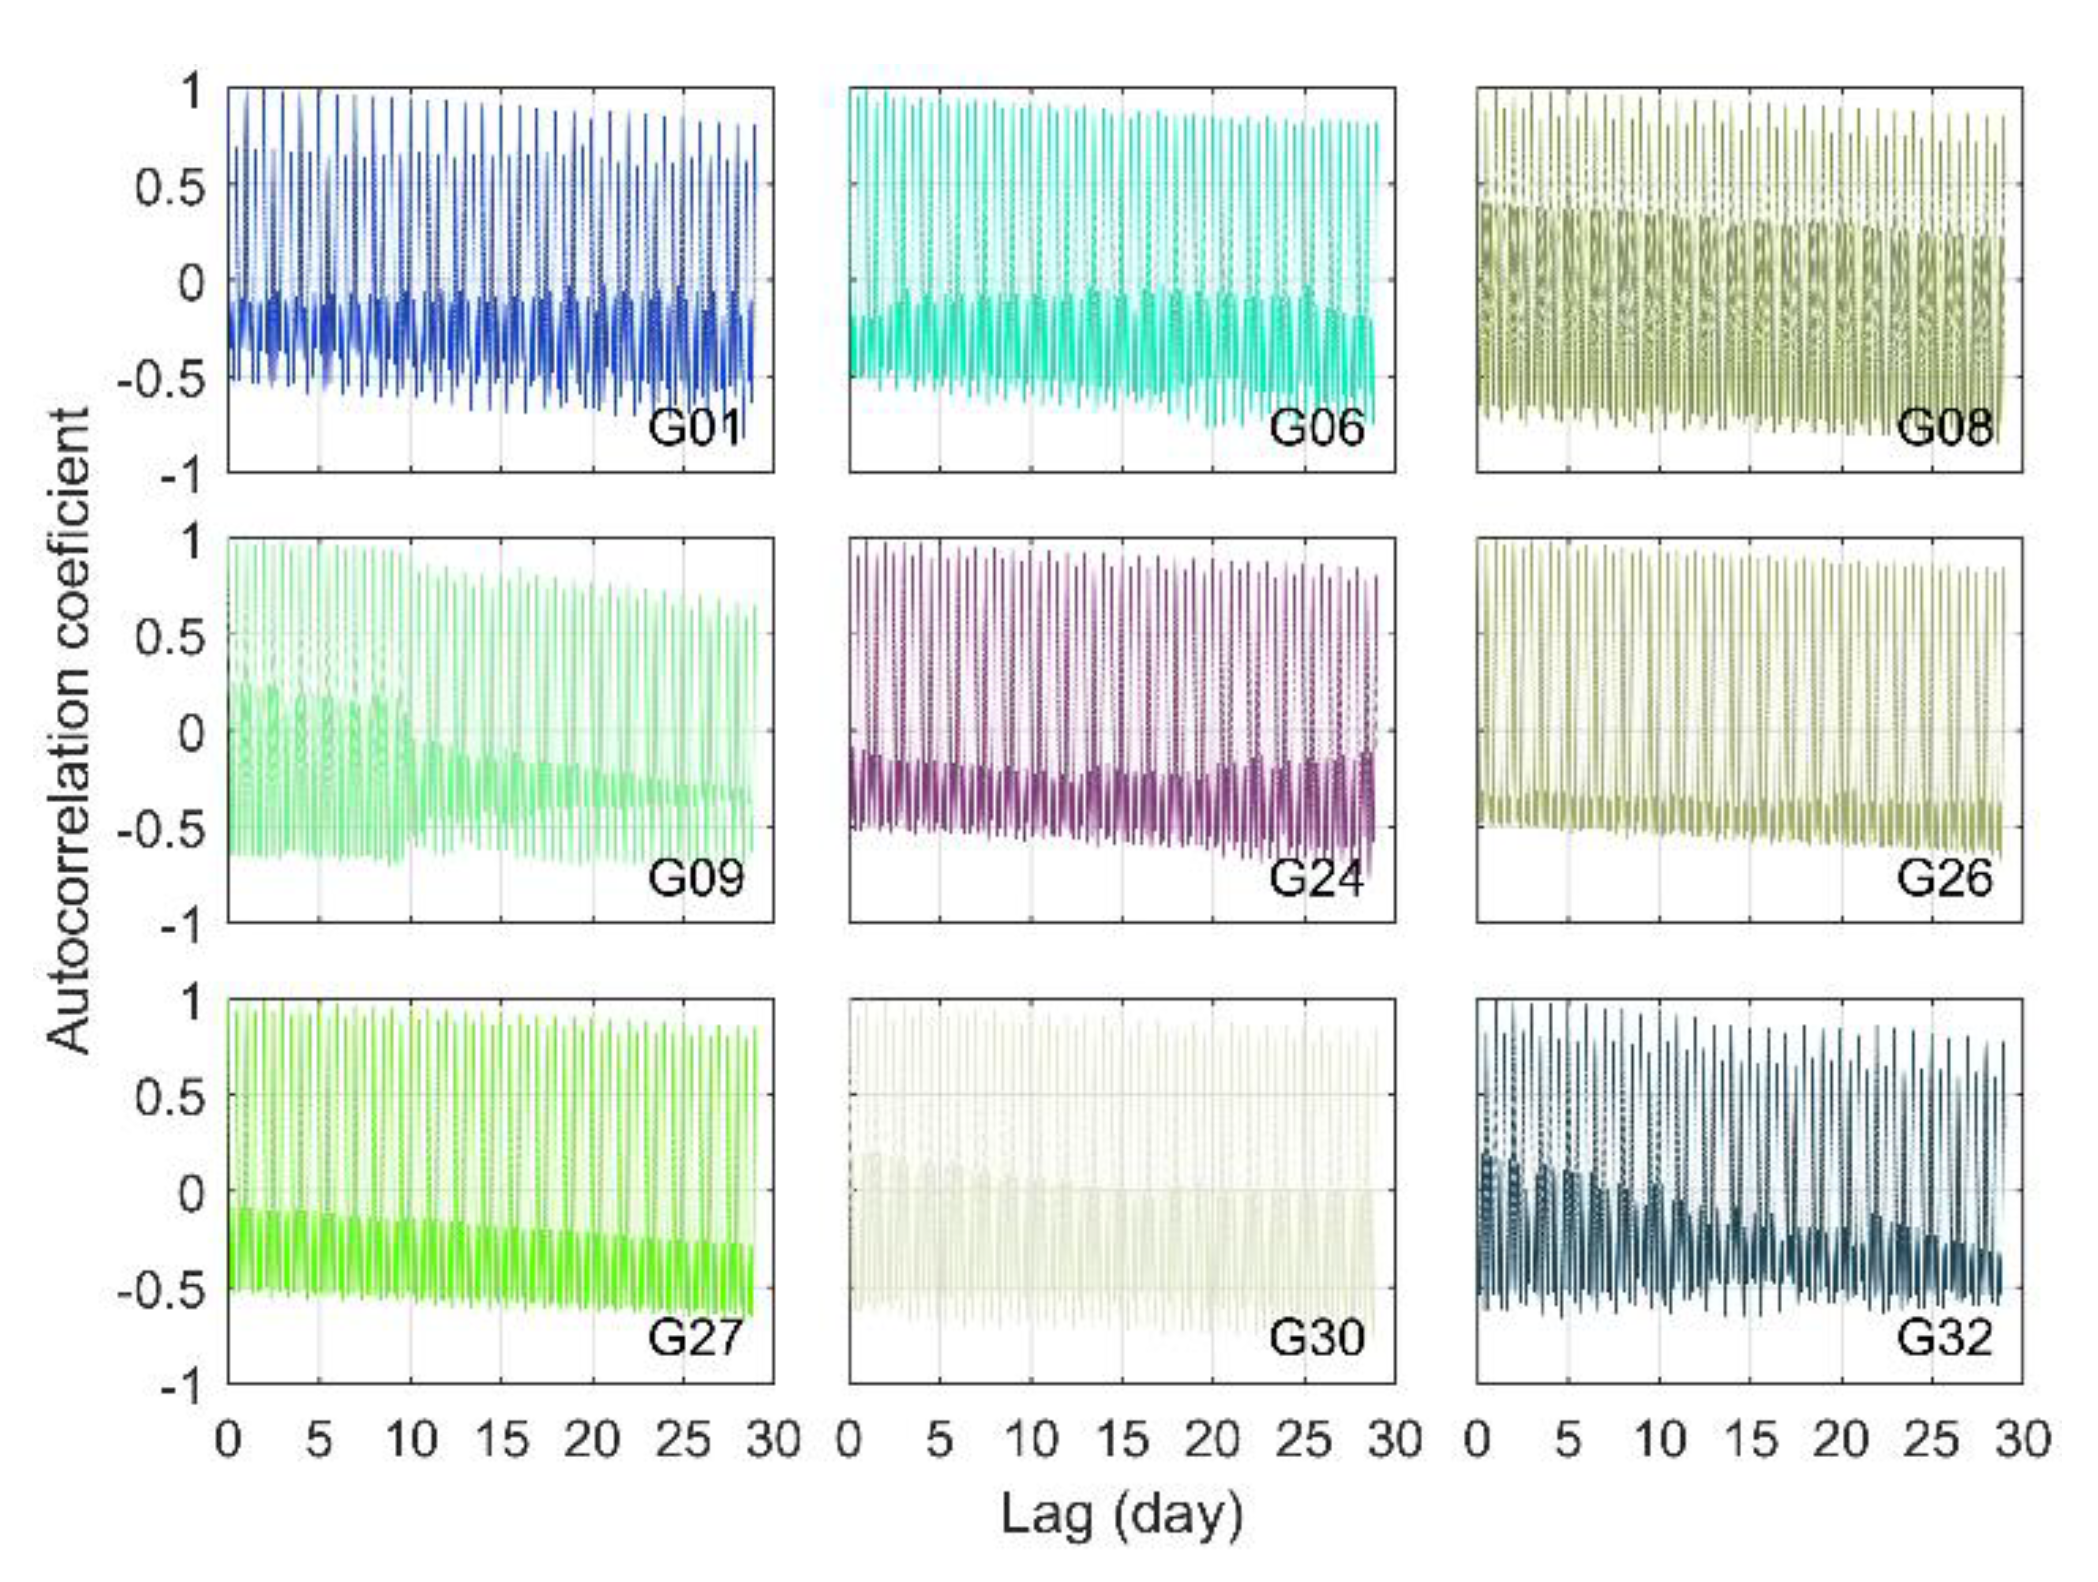
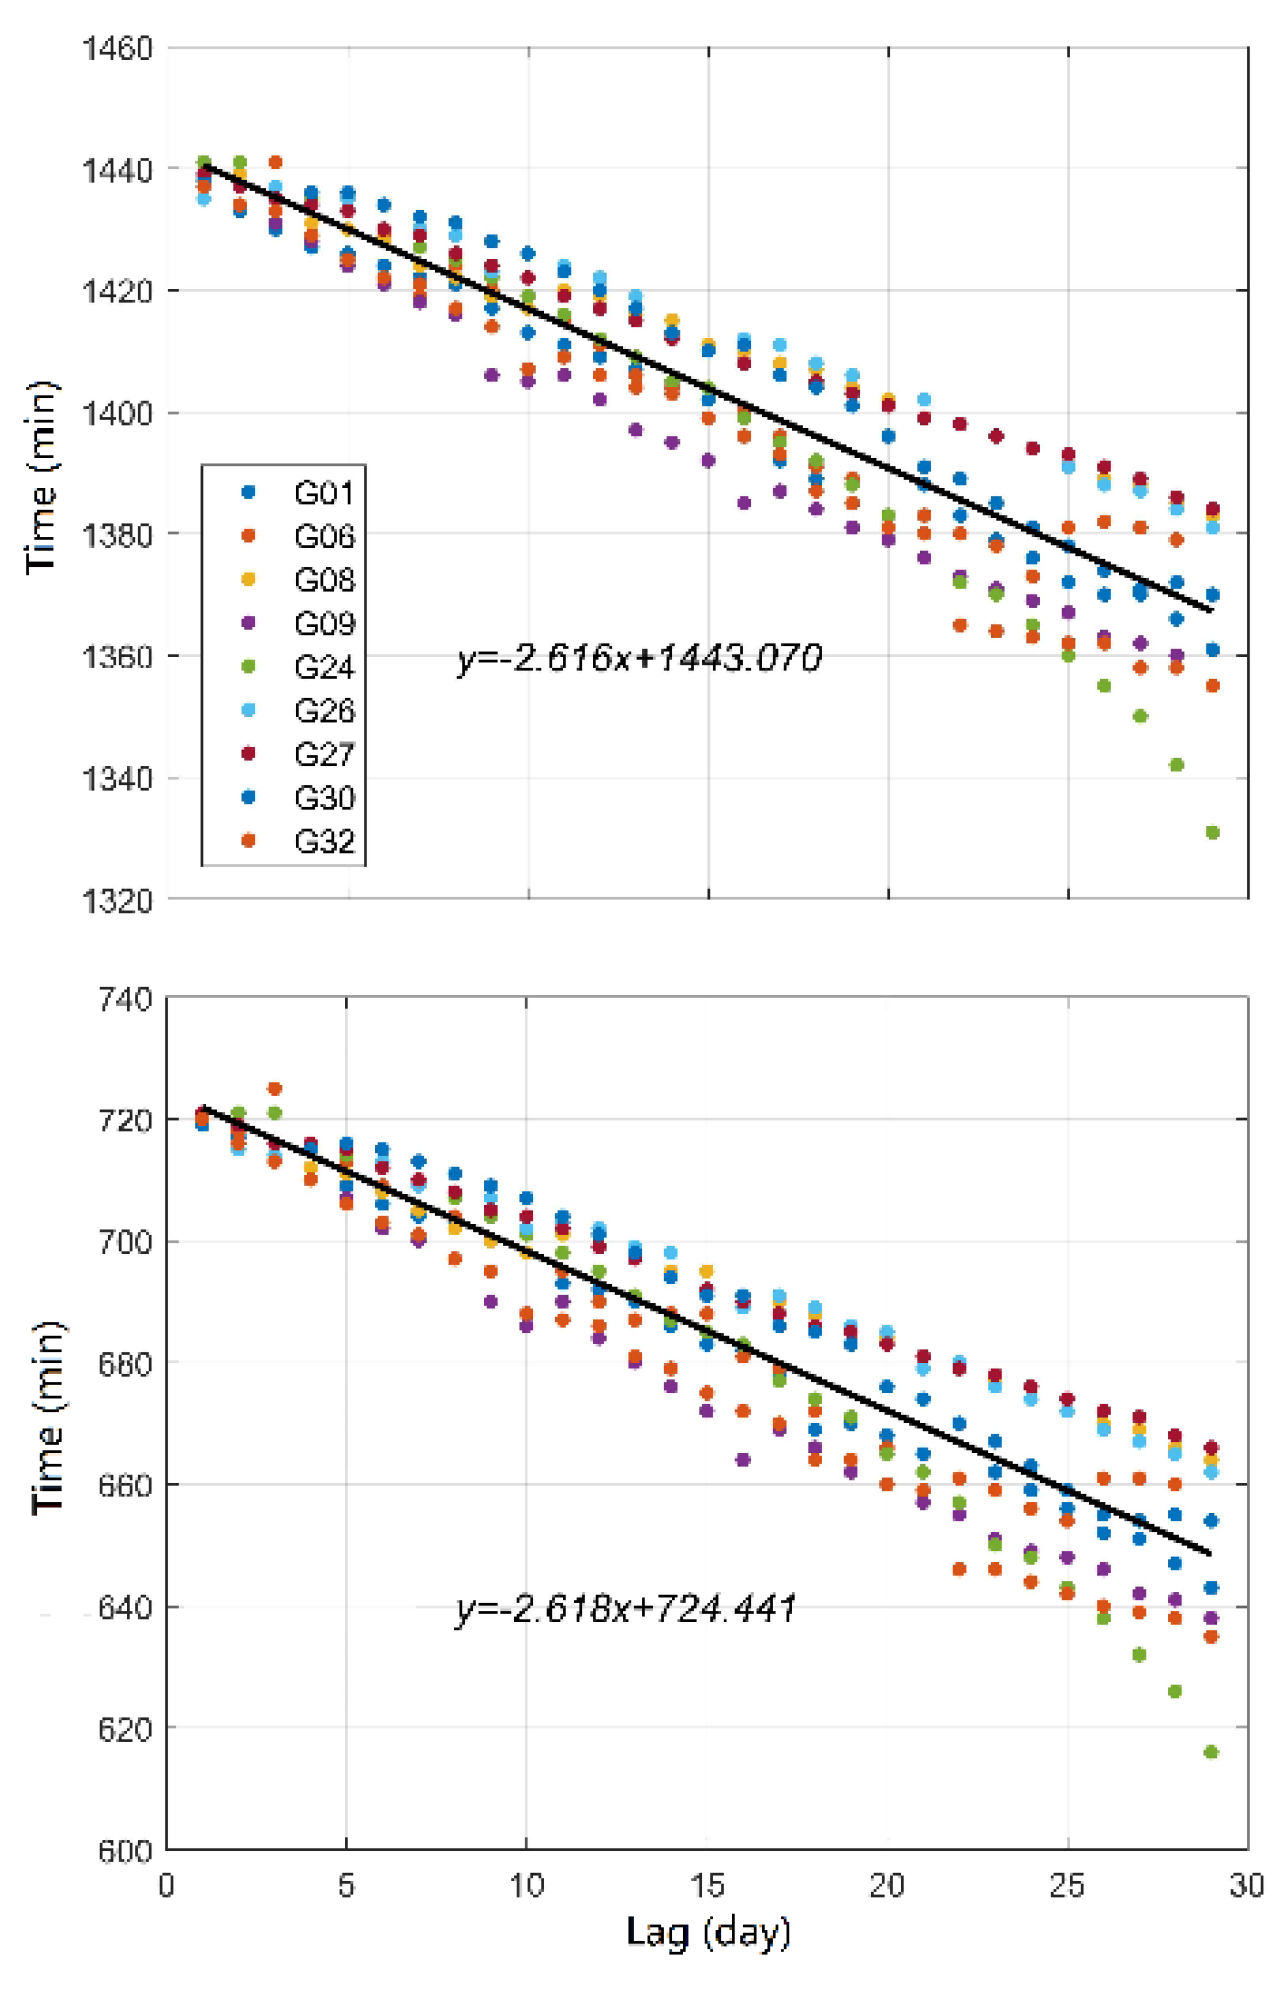
3.2. Time-Varying Characteristics of the IFCB
4. Discussion
5. Conclusions
Author Contributions
Funding
Data Availability Statement
Acknowledgments
Conflicts of Interest
References
- Li, W.; Kacmarik, M. Assessment of multi-GNSS precise orbit and clock products from different analysis centers based on precise point positioning. Acta Geodyn. Geomater. 2021, 18, 387–397. [Google Scholar]
- Lyu, D.; Zeng, F.; Ouyang, X.; Zhang, H. Real-time clock comparison and monitoring with multi-GNSS precise point positioning: GPS, GLONASS and Galileo. Adv. Space Res. 2020, 65, 560–571. [Google Scholar]
- Ai, Q.; Maciuk, K.; Lewinska, P.; Borowski, L. Characteristics of Onefold Clocks of GPS, Galileo, BeiDou and GLONASS Systems. Sensors 2021, 21, 2396. [Google Scholar] [CrossRef]
- Zhou, W.; Cai, H.; Chen, G.; Jiao, W.; He, Q. Multi-GNSS Combined Orbit and Clock Solutions at iGMAS. Sensors 2022, 22, 457. [Google Scholar] [CrossRef]
- Elsobeiey, M. Precise point positioning using triple-frequency GPS measurements. J. Navig. 2015, 68, 480–492. [Google Scholar]
- Chernogor, L.; Garmash, K.; Guo, Q.; Lou, Y.; Zheng, Y. Ionospheric Storm Effects over the People’s Republic of China on 14 May 2019, Results from Multipath Multi-Frequency Oblique Radio Sounding. Adv. Space Res. 2020, 66, 226–242. [Google Scholar]
- Shi, J.; Gao, Y. A comparison of three PPP integer ambiguity resolution methods. GPS Solut. 2014, 18, 519–528. [Google Scholar]
- Cao, Y.; Hu, X.; Chen, J.; Bian, L.; Wang, W.; Li, R.; Wang, X.; Rao, Y.; Meng, X.; Wu, B. Initial analysis of the BDS satellite autonomous integrity monitoring capability. GPS Solut. 2019, 23. [Google Scholar] [CrossRef]
- Li, T.; Melachroinos, S. An enhanced cycle slip repair algorithm for real-time multi-GNSS, multi-frequency data processing. GPS Solut. 2019, 23. [Google Scholar] [CrossRef]
- Odijk, D.; Arora, B.; Teunissen, P. Predicting the Success Rate of Long-baseline GPS+Galileo (Partial) Ambiguity Resolution. J. Navig. 2014, 67, 385–401. [Google Scholar]
- Li, X.; Ge, M.; Zhang, H.; Wickert, J. A method for improving uncalibrated phase delay estimation and ambiguity-fixing in real-time precise point positioning. J. Geod. 2013, 87, 405–416. [Google Scholar]
- Schaer, S.; Villiger, A.; Arnold, D.; Dach, R.; Prange, L.; Jäggi, A. The CODE ambiguity-fixed clock and phase bias analysis products: Generation, properties, and performance. J. Geod. 2021, 95, 81. [Google Scholar]
- Montenbruck, O.; Hugentobler, U.; Dach, R.; Steigenberger, P.; Hauschild, A. Apparent clock variations of the Block IIF-1 (SVN62) GPS satellite. GPS Solut. 2012, 16, 303–313. [Google Scholar]
- Pan, L.; Zhang, X.; Li, X.; Liu, J.; Xin, L. Characteristics of inter-frequency clock bias for Block IIF satellites and its effect on triple-frequency GPS precise point positioning. GPS Solut. 2016, 21, 1–12. [Google Scholar]
- Montenbruck, O.; Hauschild, A.; Steigenberger, P.; Langley, R. Three’s the challenge: A close look at GPS SVN62 triplefrequency signal combinations finds carrier-phase variations on the new L5. GPS World 2010, 21, 8–19. [Google Scholar]
- Montenbruck, O.; Hauschild, A.; Steigenberger, P.; Hugentobler, U.; Teunissen, P.; Nakamura, S. Initial assessment of the COMPASS/BeiDou-2 regional navigation satellite system. GPS Solut. 2013, 17, 211–222. [Google Scholar]
- Li, H.; Zhu, W. Inter-frequency clock bias for BeiDou. Acta Geod. Cartogr. Sin. 2014, 43, 1127–1131. [Google Scholar]
- Zhao, Q.; Wang, G.; Liu, Z.; Hu, Z.; Dai, Z.; Liu, J. Analysis of BeiDou satellite measurements with code multipath and geometry-free ionospheric-free combinations. Sensors 2016, 16, 123. [Google Scholar] [CrossRef] [Green Version]
- Pan, L.; Li, X.; Zhang, X.; Xin, L.; Lu, C.; Zhao, Q.; Liu, J. Considering Inter-Frequency Clock Bias for BDS Triple-Frequency Precise Point Positioning. Remote Sens. 2017, 9, 734. [Google Scholar] [CrossRef] [Green Version]
- Li, H.; Zhou, X.; Wu, B. Fast estimation and analysis of the interfrequency clock bias for Block IIF satellites. GPS Solut. 2013, 17, 347–355. [Google Scholar]
- Li, H.; Li, B.; Xiao, G.; Wang, J.; Xu, T. Improved method for estimating the inter-frequency satellite clock bias of triple-frequency GPS. GPS Solut. 2016, 20, 751–760. [Google Scholar] [CrossRef]
- Guo, J.; Geng, J. GPS satellite clock determination in case of inter-frequency clock biases for triple-frequency precise point positioning. J. Geod. 2018, 92, 1133–1142. [Google Scholar]
- Li, P.; Zhang, X.; Ge, M.; Schuh, H. Three-frequency BDS precise point positioning ambiguity resolution based on raw observables. J. Geod. 2018, 92, 1357–1369. [Google Scholar]
- Li, H.; Li, B.; Wang, J.; Xu, T. A method for estimating BeiDou Inter-frequency satellite clock bias. Acta Geod. Cartogr. Sin. 2016, 45, 140–146. [Google Scholar]
- Gong, X.; Gu, S.; Lou, Y.; Zheng, F.; Yang, X.; Wang, Z.; Liu, J. Research on empirical correction models of GPS Block IIF and BDS satellite inter-frequency clock bias. J. Geod. 2020, 94, 36. [Google Scholar]
- Zhang, Z.; Pan, L. Modeling and predicting inter-frequency clock bias of BDS-2 GEO, IGSO and MEO satellites for triple-frequency precise point positioning. GPS Solut. 2022, 26, 89. [Google Scholar] [CrossRef]
- Zhou, F.; Dong, D.; Li, W.; Jiang, X.; Wickert, J. GAMP: An open-source software of multi-GNSS precise point positioning using undifferenced and uncombined observations. GPS Solut. 2018, 22, 33. [Google Scholar] [CrossRef]
- Petit, G.; Luzum, B. IERS Technical Note No. 36, IERS Conventions; International Earth Rotation and Reference Systems Service: Frankfurt, Germany, 2010. [Google Scholar]
- Wu, J.; Wu, S.; Hajj, G.; Bertiger, W.; Lichten, S. Effects of antenna orientation on GPS carrier phase. Manuscr. Geod. 1993, 18, 91–98. [Google Scholar]
- Pan, L.; Zhang, X.; Guo, F.; Liu, J. GPS inter-frequency clock bias estimation for both uncombined and ionospheric-free combined triple-frequency precise point positioning. J. Geod. 2019, 93, 473–487. [Google Scholar]
- Coppola, A.; Comegna, A.; Dragonetti, G.; Lamaddalena, N.; Kader, A.; Comegna, V. Average moisture saturation effects on temporal stability of soil water spatial distribution at field scale. Soil Till Res. 2011, 114, 155–164. [Google Scholar]
- Liu, W.; Li, J.; Zeng, Q.; Guo, F.; Wu, R.; Zhang, X. An Improved Robust Kalman Filtering Strategy for GNSS Kinematic Positioning Considering Small Cycle Slips. Adv. Space Res. 2019, 63, 2724–2734. [Google Scholar]
- Chen, W.; Braitenberg, C.; Serpelloni, E. Interference of tectonic signals in subsurface hydrologic monitoring through gravity and GPS due to mountain building. Glob. Planet. Chang. 2018, 167, 148–159. [Google Scholar]
- Yue, C.; Dang, Y.; Dai, H.; Yang, Q.; Wang, X. Crustal deformation characteristics of Sichuan-Yunnan region in China on the constraint of multi-periods of GPS velocity fields. Adv. Space Res. 2018, 61, 180–2189. [Google Scholar]
- Pan, Y.; Chen, R.; Yi, S.; Wang, W.; Ding, H.; Shen, W.; Chen, L. Contemporary Mountain-Building of the Tianshan and its Relevance to Geodynamics Constrained by Integrating GPS and GRACE Measurements. J. Geophys. Res. Solid Earth 2019, 124, 12171–12188. [Google Scholar]
- Guo, F.; Zhang, X.; Wang, J.; Ren, X. Modeling and assessment of triple-frequency BDS precise point positioning. J. Geod. 2016, 90, 1223–1235. [Google Scholar]


| Mode | Strategy and Value |
|---|---|
| Observations/frequencies | L1 + L2 + L5 |
| Orbits and clocks | Wuhan University |
| Ionosphere | Estimated-slant ionospheric delays (L1) |
| Zenith tropospheric delay | Estimated as random walker and the global mapping function was used |
| Cut-off | 15° for IFCB estimation and 10° for evaluation of triple-frequency PPP |
| Observation interval | 30 s |
| Satellite/receiver phase bias Ambiguity | Constant Constant/float |
| Estimation process | Kalman filter-forward |
| Satellites | Primary Period | Secondary Period | ||||
|---|---|---|---|---|---|---|
| a | b | RMS | a | b | RMS | |
| G01 | −3.04 | 1438.66 | 0.89 | −3.03 | 721.41 | 1.11 |
| G06 | −2.99 | 1442.88 | 1.49 | −3.02 | 723.86 | 1.91 |
| G08 | −2.42 | 1439.69 | 4.61 | −2.40 | 720.79 | 5.84 |
| G09 | −3.35 | 1436.87 | 2.37 | −3.43 | 719.51 | 2.09 |
| G24 | −4.21 | 1453.51 | 3.02 | −4.14 | 734.69 | 2.39 |
| G26 | −2.56 | 1443.26 | 3.44 | −2.55 | 723.80 | 2.80 |
| G27 | −2.48 | 1441.25 | 4.55 | −2.49 | 723.18 | 4.21 |
| G30 | −3.31 | 1449.70 | 0.80 | −3.25 | 729.94 | 0.99 |
| G32 | −3.59 | 1441.79 | 1.24 | −3.63 | 722.15 | 0.51 |
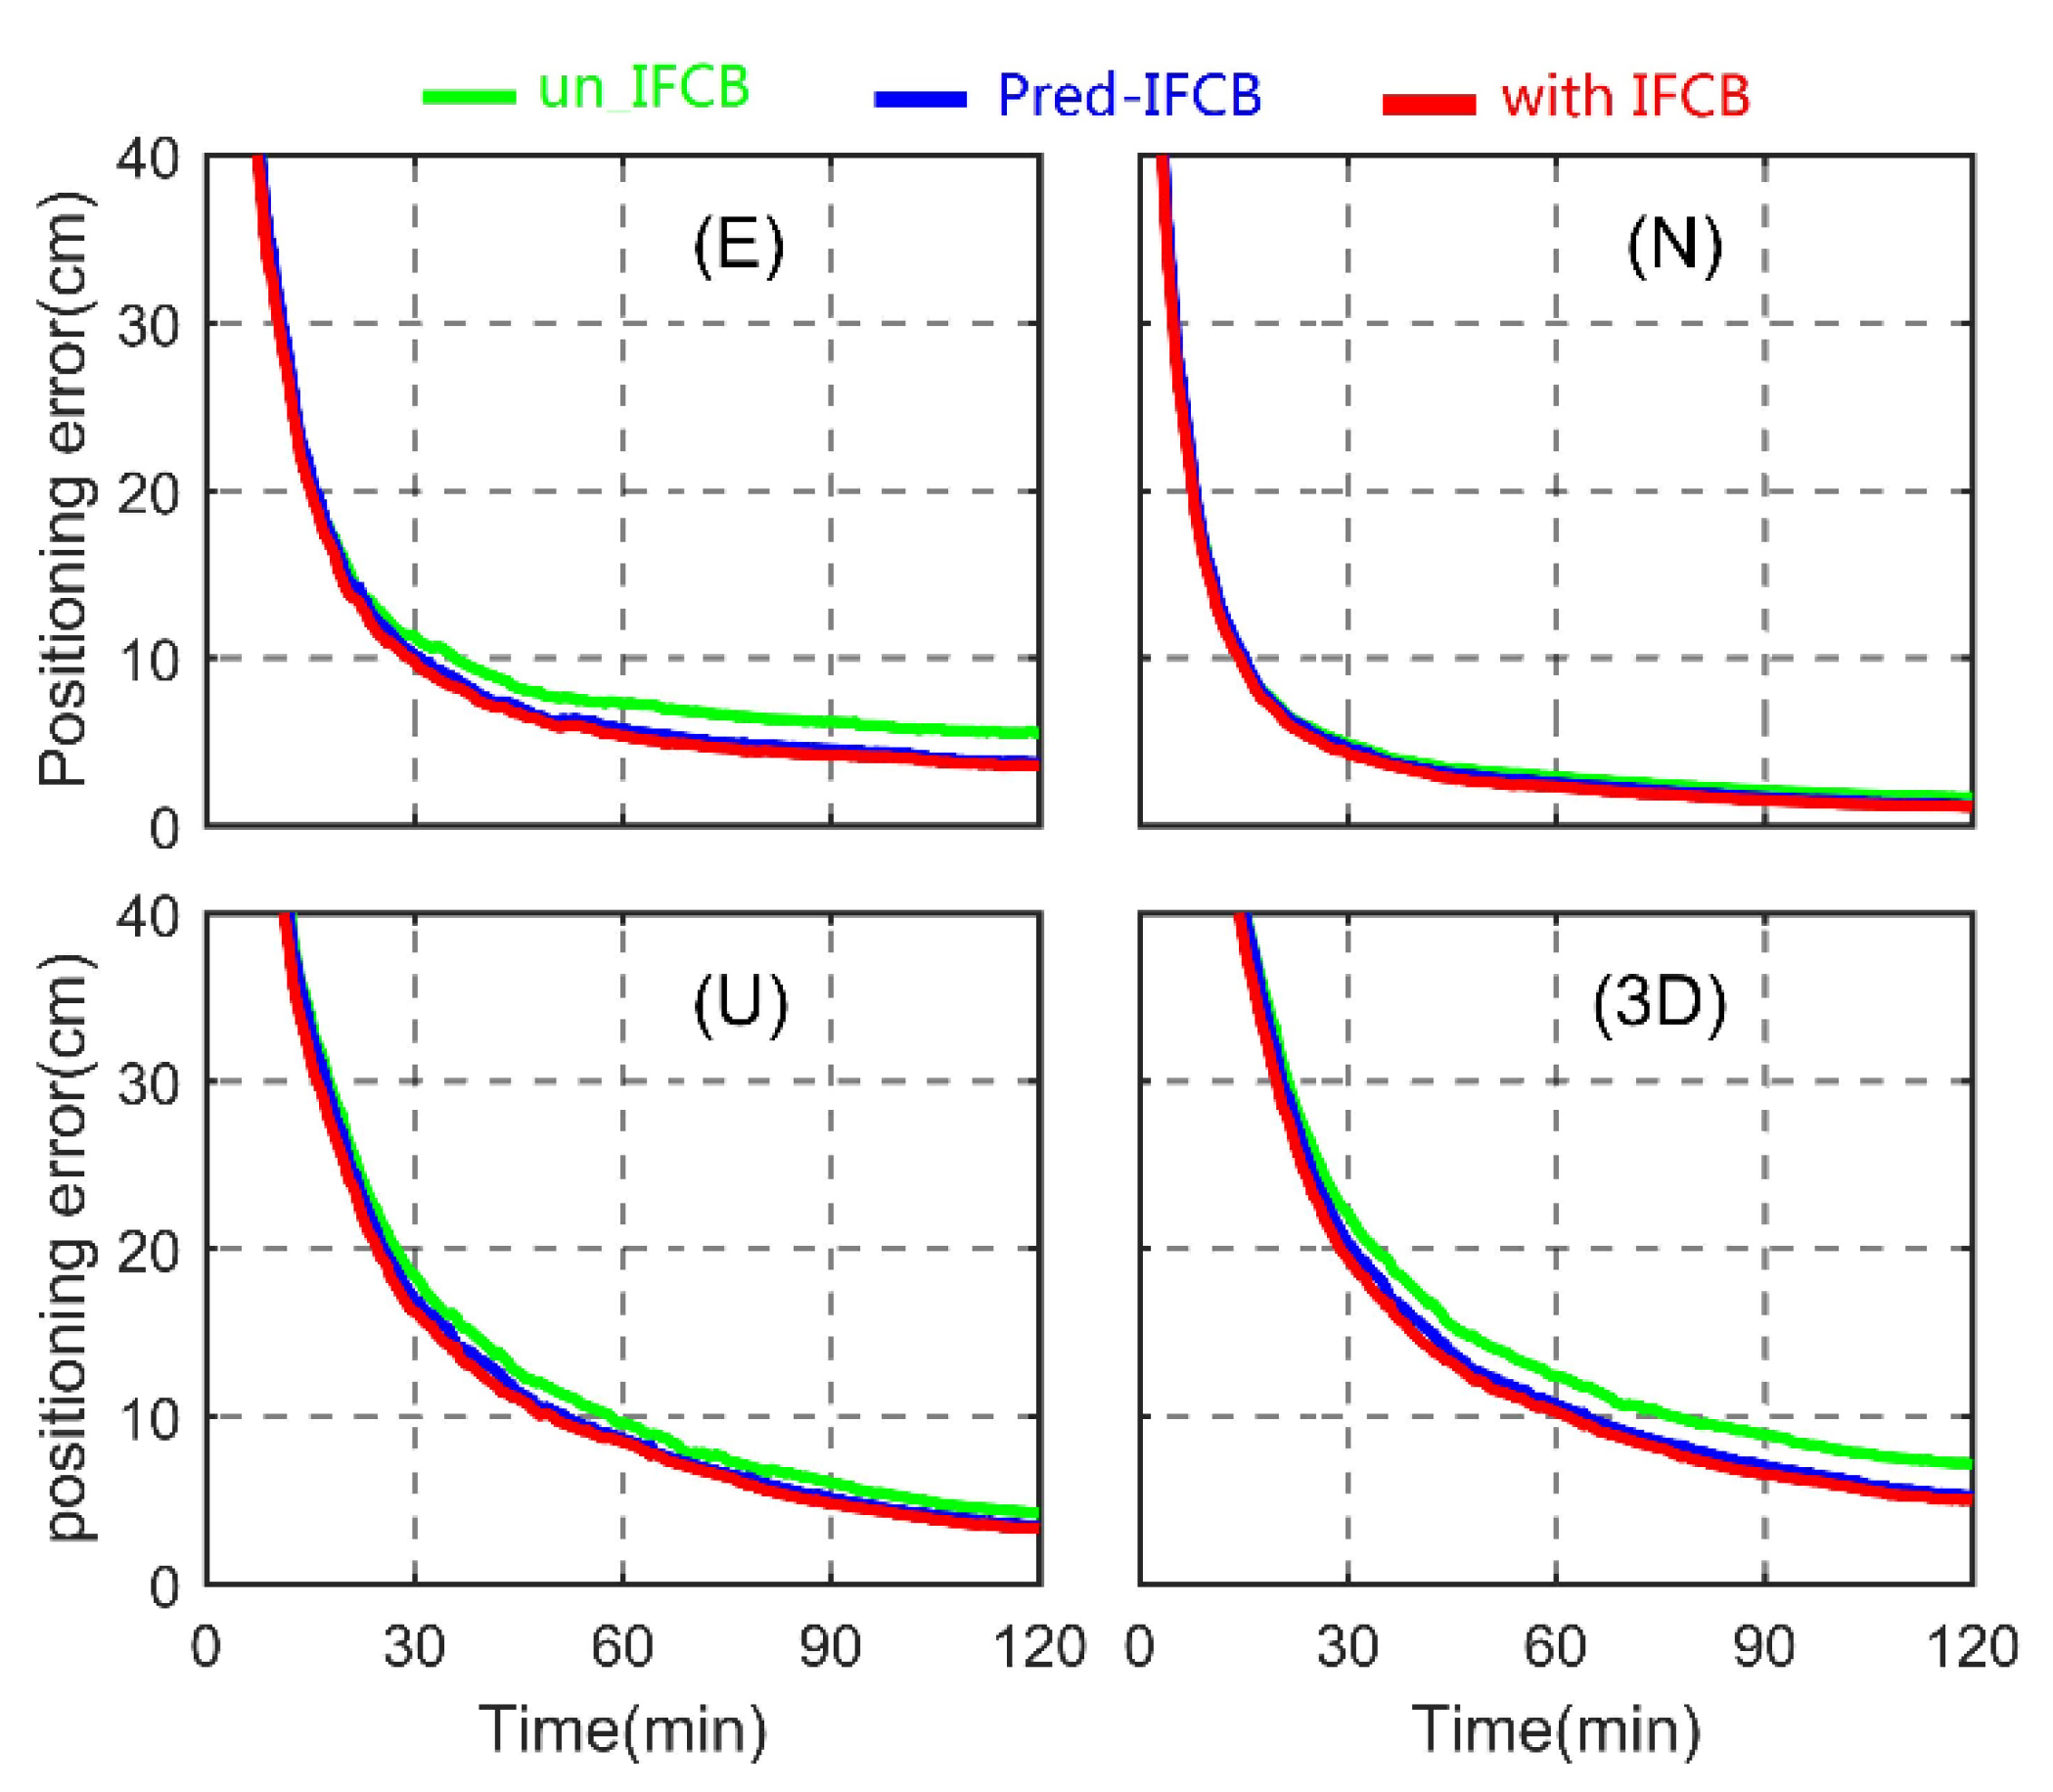
| Solution Strategy | E | N | U |
|---|---|---|---|
| Un-IFCB | 1.46 | 0.92 | 2.83 |
| Pred-IFCB | 0.98 | 0.79 | 2.34 |
| With-IFCB | 0.92 | 0.78 | 2.29 |
Publisher’s Note: MDPI stays neutral with regard to jurisdictional claims in published maps and institutional affiliations. |
© 2022 by the authors. Licensee MDPI, Basel, Switzerland. This article is an open access article distributed under the terms and conditions of the Creative Commons Attribution (CC BY) license (https://creativecommons.org/licenses/by/4.0/).
Share and Cite
Yue, C.; Dang, Y.; Xue, S.; Wang, H.; Gu, S.; Xu, C. A Short-Term Forecasting Method of Inter-Frequency Clock Bias for GPS Block IIF Satellites. Remote Sens. 2022, 14, 4130. https://doi.org/10.3390/rs14174130
Yue C, Dang Y, Xue S, Wang H, Gu S, Xu C. A Short-Term Forecasting Method of Inter-Frequency Clock Bias for GPS Block IIF Satellites. Remote Sensing. 2022; 14(17):4130. https://doi.org/10.3390/rs14174130
Chicago/Turabian StyleYue, Caiya, Yamin Dang, Shuqiang Xue, Hu Wang, Shouzhou Gu, and Changhui Xu. 2022. "A Short-Term Forecasting Method of Inter-Frequency Clock Bias for GPS Block IIF Satellites" Remote Sensing 14, no. 17: 4130. https://doi.org/10.3390/rs14174130
APA StyleYue, C., Dang, Y., Xue, S., Wang, H., Gu, S., & Xu, C. (2022). A Short-Term Forecasting Method of Inter-Frequency Clock Bias for GPS Block IIF Satellites. Remote Sensing, 14(17), 4130. https://doi.org/10.3390/rs14174130