Article

Forest Fire Effects on Landscape Snow Albedo Recovery and Decay

1
Water Resource Allocation Program, New Mexico Office of the State Engineer, Albuquerque, NM 87109, USA
2
Department of Environmental Science and Management, Portland State University, Portland, OR 97201, USA
*
Author to whom correspondence should be addressed.
Remote Sens. 2022, 14(16), 4079; https://doi.org/10.3390/rs14164079
Submission received: 15 July 2022 / Accepted: 12 August 2022 / Published: 20 August 2022
(This article belongs to the Special Issue Remote Sensing for Mountain Vegetation and Snow Cover)

Abstract

:
Surface snow albedo (SSA) darkens immediately following a forest fire, while landscape snow albedo (LSA) brightens as more of the snow-covered surface becomes visible under the charred canopy. The duration and variability of the post-fire snow albedo recovery process remain unknown beyond a few years following the fire. We evaluated the temporal variability of post-fire snow albedo recovery relative to burn severity across a chronosequence of eight burned forests burned from 2000 to 2019, using pre- and post-fire daily, seasonal, and annual landscape snow albedo data derived from the Moderate Resolution Imaging Spectroradiometer (MOD10A1). Post-fire annual LSA increased by 21% the first year following the fire and increased continually by 33% on average across all eight forest fires and burn severity classifications over the period of record (18 years following a fire). Post-fire LSA measurements increased by 63% and 53% in high and moderate burn severity areas over ten years following fire. While minimum and maximum snow albedo values increased relative to annual post-fire LSA recovery, daily snow albedo decay following fresh snowfall accelerated following forest fire during the snowmelt period. Snow albedo recovery over 10 years following fire did not resemble the antecedent pre-fire unburned forest but more resembled open meadows. The degradation of forest canopy structure is the key driver underlying the paradox of the post-fire snow albedo change (SSA vs. LSA).

1. Introduction

Seasonal snowpack is a critical water resource and contributes over half the total runoff and as much as 70% of streamflow in mountainous areas of the western US [1]. Snowpack acts as a seasonal high mountain water reservoir, recharging aquifers and nourishing the rivers, streams, and tributaries into the summer and fall following snowmelt [1,2,3], providing important moisture for soils and vegetation. A warming climate has reduced snowpack volume [4,5,6], advanced the timing of spring snowmelt [5,7,8], limited downstream water availability [1,7,9], and ultimately reduced summer soil moisture [10]. Moreover, due to climate warming, forest fires are increasing in intensity, extent, frequency, and duration across the western US, particularly during early snowmelt years [11,12,13].
In the western US, most forest fires occur in the seasonal snow zone [14]. Forest fires leave behind charred forests, which stand blackened for decades shedding black carbon (BC) and burned woody debris (BWD) into the snowpack below for many winters following fire. BC and BWD concentrate on the snowpack surface during the melt, visibly darkening the snowpack and lowering the surface snow albedo (SSA) [14,15]. Forest fires drive increases in net snowpack shortwave radiation as a result of the reduction in post-fire SSA in combination with the more open post-fire forest canopy, which allows more incoming solar radiation incidents on the snowpack surface [15,16]. Darkening of SSA due to light-absorbing particles (LAP) accelerates both direct and indirect snow albedo feedbacks during snowmelt [17], driving earlier snow disappearance in burned forests [14,15], especially on south-facing slopes [18], an effect that persists for over a decade following a forest fire occurrence [19].
Fresh snow is known to have some of the highest albedos of any natural substance on Earth, up to 0.9–0.95 [20]. Snow albedo is highly reflective in the visible wavelengths and is an important factor in controlling net snowpack shortwave radiation, a primary component in snowpack energy balance. A small decrease in snow albedo can profoundly increase the net snowpack energy balance [14,21]. Snow albedo is controlled primarily by grain size and LAP concentrations but also by the grain shape and grain size of snow particles, the solar zenith angle, surface roughness, and the thickness of the overall snow layer [22,23]. As snow grain growth occurs following fresh snowfall, surface snow albedo decreases profoundly within 2 weeks [24,25] due to temperature-dependent snowpack evolution processes [20,26]. Concentrations of LAP in the snow, such as BC, brown carbon, and dust, drastically decrease snow albedo, increasing the radiative heat forcing on the snowpack and leading to accelerated snowmelt [19,27,28].
Winter snow cover is essential for climate cooling because it seasonally blankets most of the northern hemisphere [29,30,31]. The high reflectivity of snow-covered areas produces a 1.5 °C to 4.5 °C cooling effect compared to snow-free surfaces [32]. Snow cover extent in the Northern Hemisphere has decreased due to climate warming, especially in spring. As a result of the temperature albedo feedback, it will further contribute to warming atmospheric temperatures [33].
Post-fire changes in snow albedo present a paradox: as surface snow albedo (SSA) below the burned forest canopy decreases following a fire, the winter-time landscape snow albedo (LSA) increases following the fire as more of the snow-covered surface is visible under the more open post-fire forest canopy (Figure 1). Some evaluations indicate that LSA changes following a forest fire (due to increased snow exposure) may be enough to neutralize the initial carbon release caused by the fire and thus may not necessarily accelerate climate warming [31,34]. Forest tree canopies shield highly reflective snow surfaces, lowering overall LSA when snow is present, resulting in positive climate forcing relative to non-forested snow-covered areas [32,35,36]. Forest fires reduce forest density and increase snow surface exposure in the winter and spring months, increasing winter and springtime LSA. After a forest fire, the exposed snow surfaces are more susceptible to direct shortwave radiation, potentially making surface snow albedo even more crucial in its effect on snowpack energy balance and overall climate cooling. Even at broad scales, snow disappearance date often advances following fire [19], so even though winter LSA may increase following fire, the annual average LSA may actually decrease following fire. Spatio-temporal patterns of snow accumulation and ablation on a landscape scale and associated LSA are crucial in understanding forest fire effects on broad-scale climate and water cycle processes.
A positive feedback loop circulates climate change and snow albedo, including accelerated snowmelt, increasing seasonal drought, rising air temperatures, and increasing forest fires. LSA and SSA are critical pieces to this feedback loop, both influencing the increase of snow grain size and affecting the overall rate of snowmelt [37]. This feedback process amplifies land surface-atmosphere radiative response, resulting in measurable hydrological changes [15,38]. Even though albedo is a key parameter used in climate predictions, it is still one of the main uncertainties of the radiation budget in climate models, particularly due to its complex spatio-temporal variability. The broad spatio-temporal patterns of post-fire snow albedo recovery also likely alter the daily snow albedo decay driving snowpack energy balance, particularly during the snowmelt period.
Spatial variability of post-fire LSA immediately following fire and post-fire LSA recovery over time (Figure 1), depends on antecedent (pre-fire) forest composition and structure, as well as burn severity and related canopy mortality over time directly, due to the proportion of visible snow-covered surface, and indirectly, through canopy shadowing and darkening snow surfaces [39]. As forest fires increase in extent, severity, duration, and frequency, understanding these forest fire effects on snow albedo will be even more crucial to understanding its impact on overall climate cooling.
Temporal variability of post-fire LSA depends on the intra-annual seasonality of LSA, the delayed mortality of burned forests, and forest regeneration over the years following the fire. Disturbance history, drought stress, pathogens such as bark beetle, competition, season, and soil type all interact and influence post-fire tree mortality [40,41,42], making delayed tree mortality particularly challenging to predict [43]. Patterns of fire-induced tree mortality and post-fire vegetation re-development affect the chance of forest regeneration and growth [44]. Recovery of post-fire landscape snow albedo to pre-fire conditions depends primarily on the complex interactions driving forest regeneration to pre-fire antecedent conditions [45], and the long-term effects of fire on radiative forcing and climate continue to be heavily studied. In many high-severity fires, forested areas cannot recover to their pre-fire conditions, remaining a heterogeneous mix of shrubland [46]. This alters the fire risk of the areas in that high severity burns are more likely in the less fire tolerant conditions. This pattern of high severity fires leading to future high severity re-burns has been seen in multiple areas across the Western US [47]. Fire-induced tree mortality and delayed tree mortality are complex issues caused by direct and indirect factors that require further investigation [48].
It is essential to characterize forest fire effects on LSA recovery and decay to understand the variability and magnitude of long-term implications of forest fires on climate, hydrology, and water resource availability. No previous study has evaluated the temporal variability of forest fire effects on landscape snow albedo relative to year-since-fire or burn severity. Remote sensing imagery provides the only spatially distributed long-term data available to investigate the spatial and temporal variability of forest fire effects on LSA. Using daily global snow albedo data from the Moderate Resolution Imaging Spectroradiometer (MODIS) instrument from 2000 to 2018, we evaluated the temporal variability of pre- and post-fire landscape snow albedo recovery and decay relative to burn severity, tree mortality, and years-since-fire. Quantifying the temporal variability of forest fire effects on snow albedo will assist in understanding the hydrologic and climatic implications of this feedback loop and how the future water vulnerability and availability will be impacted by increasing forest fires and decreasing snow-water storage under future warming climate conditions [49,50,51].

2. Materials and Methods
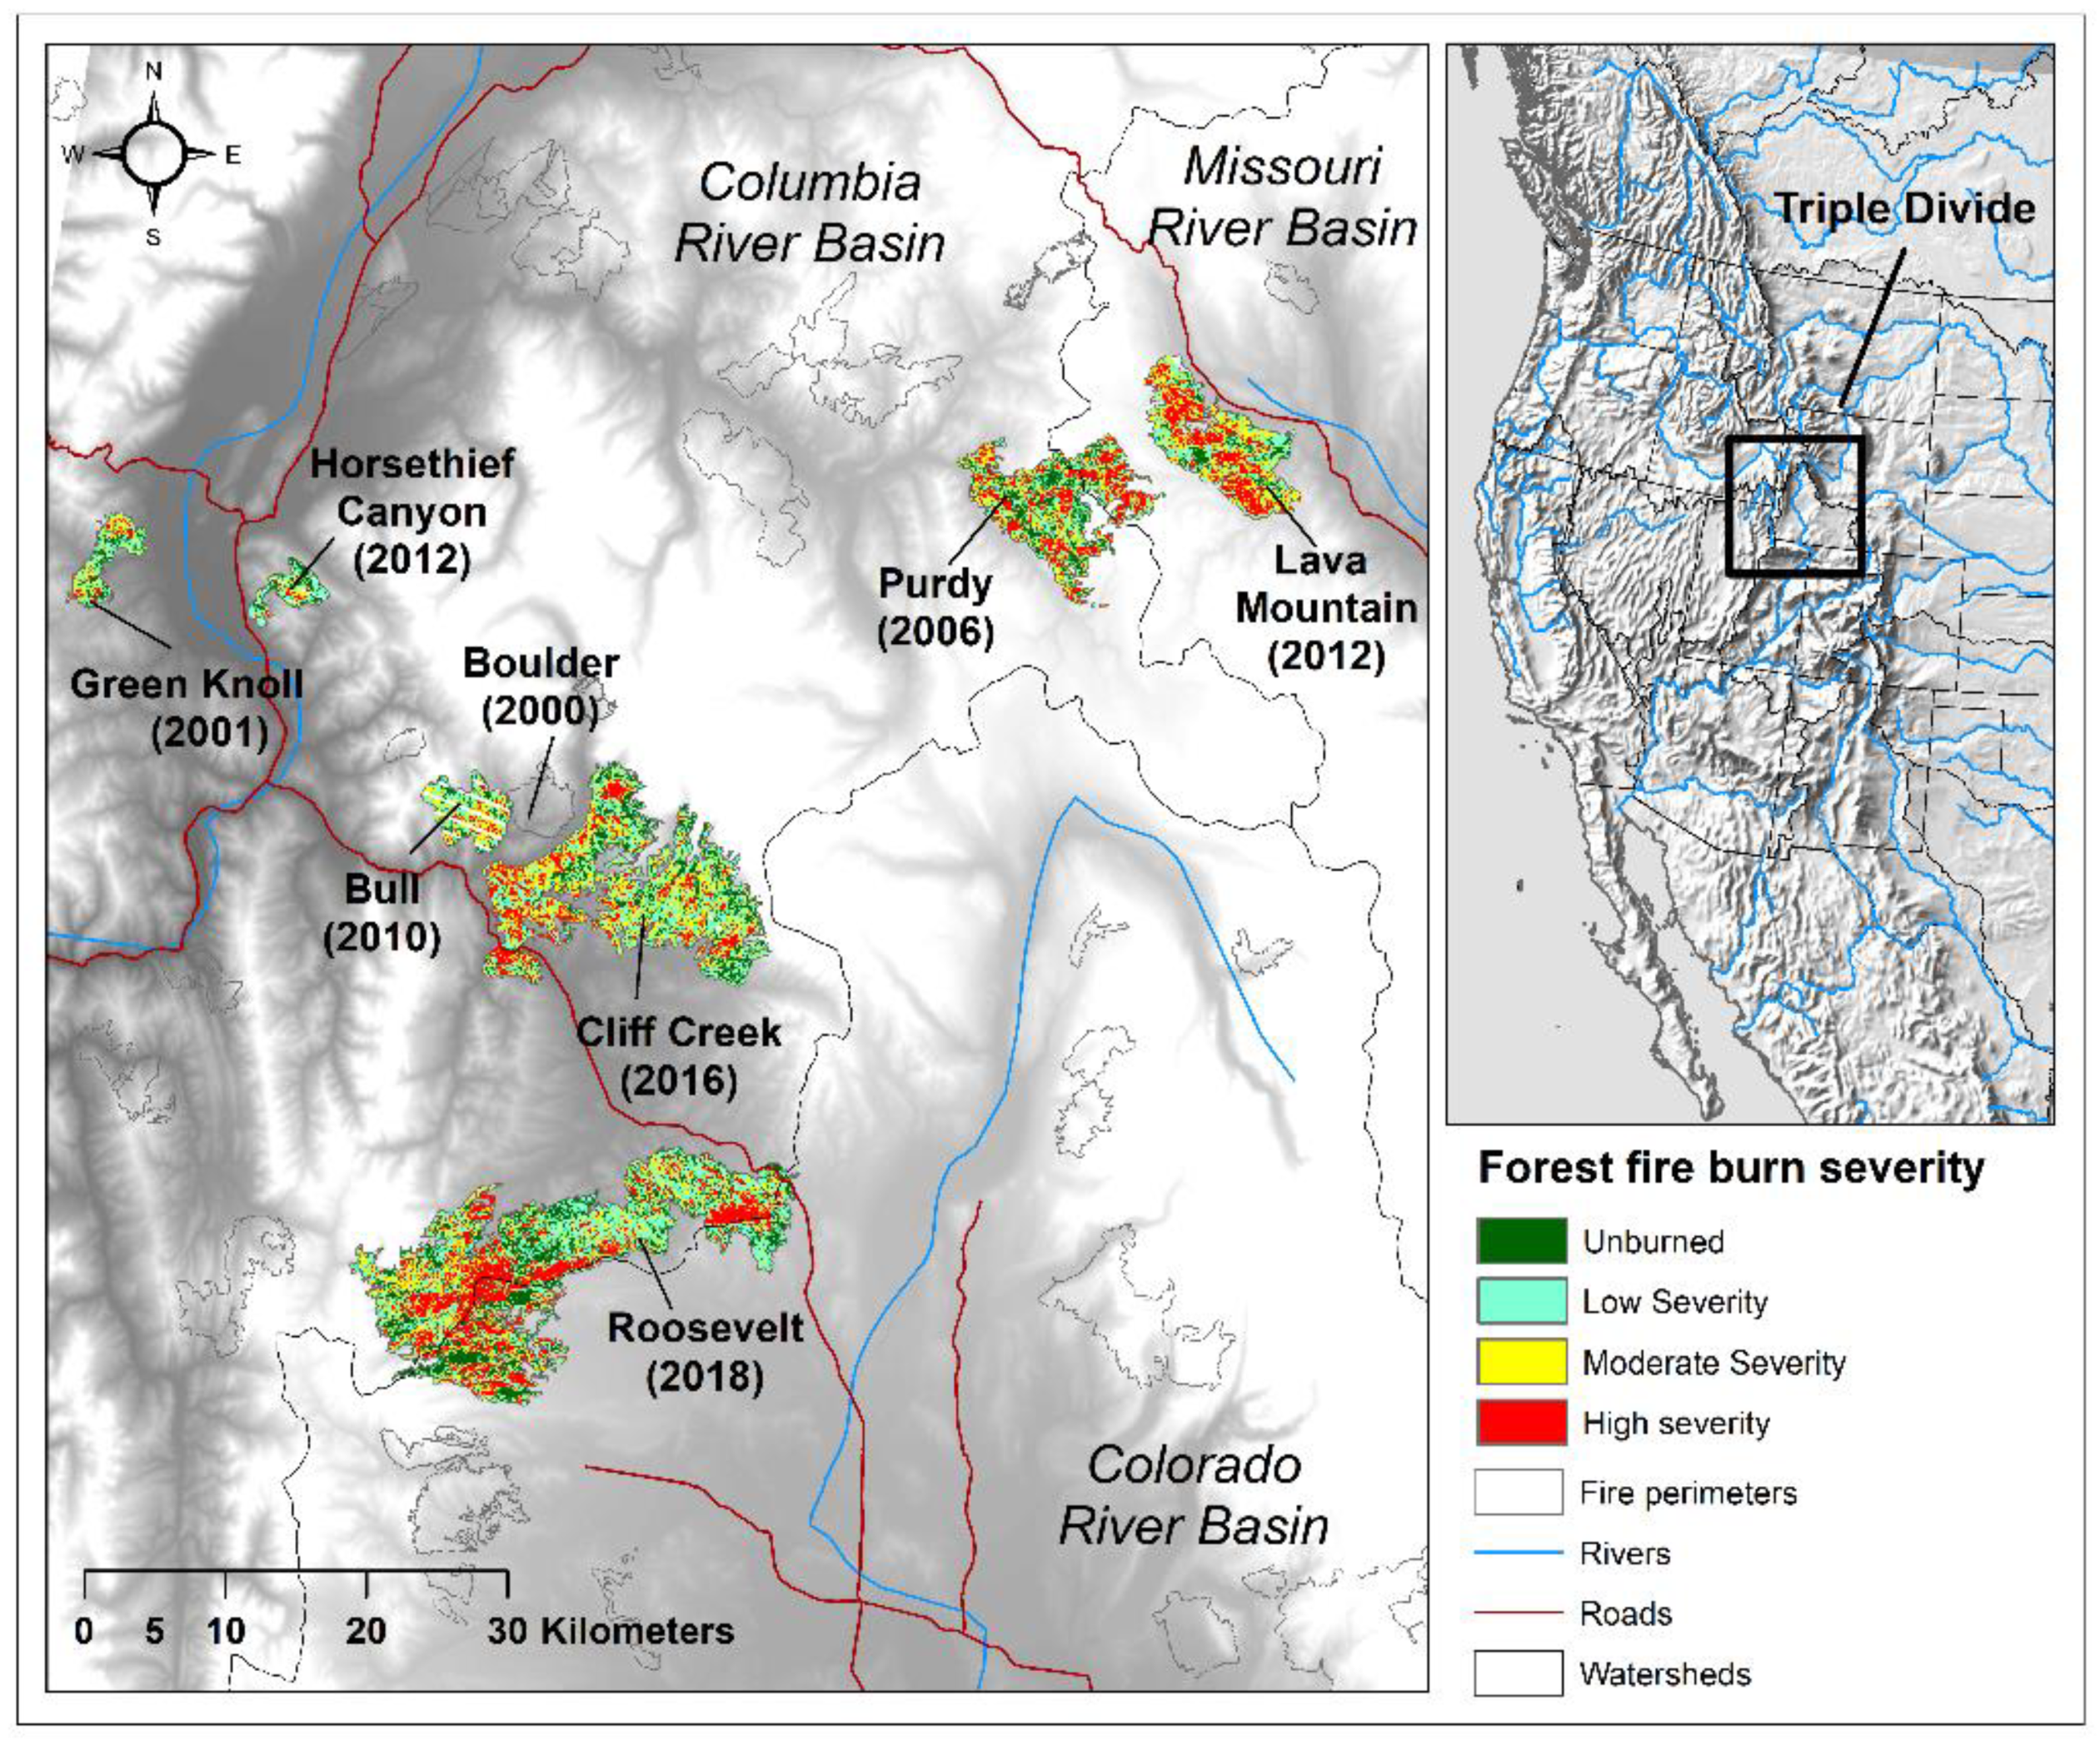
Our approach combined remote sensing, downscaling, and statistical analysis to evaluate pre- vs. post-fire variability in LSA across a chronosequence of eight mixed severity burned forests in western Wyoming. We evaluated MODIS-derived winter and spring LSA relative to burn severity for years following the fire. To isolate forest fire effects on landscape snow albedo and omit interannual variability of snow accumulation and melt patterns, we normalized snow albedo data from within the burn perimeter with data from the 5-km buffered area outside the burn perimeter. Buffer areas outside the burn perimeter accounted for interannual variability and adjusted for normal year-to-year fluctuations in snow accumulation and melt patterns.

2.1. Study Area

We examined post-fire snow albedo change in a chronosequence of eight burned forests in the seasonal snow zone of western Wyoming, which burned from 2000 to 2018 with mixed burn severity (Figure 2). The study area extends around Jackson, Wyoming, and across the Triple Divide, the headwaters of three major river systems, the Colorado, Columbia, and Missouri Rivers. The elevation of Jackson Hole Airport is 1966 m. The climate in Jackson, Wyoming, is cold and temperate, with an average annual temperature of 3.6 °C and annual precipitation of 851 mm. The cold season lasts approximately December through March each year, where December is the coldest with an average temperature of −8.8 °C and experiences the most precipitation with an average of 95 mm (climate-data.org, accessed on 10 November 2020).
This area is vital because it supplies much of the western US with snow-water resource storage. While as little as 37% of the entire precipitation in the western US falls as snow [1], across this mountainous region, approximately 60–80% of precipitation falls as snow [52]. The headwaters of these river systems begin high in the Rocky Mountains, where snow accounts for a large portion of the overall water accumulation that flows downstream into the Pacific Ocean, Gulf of California, and the Gulf of Mexico. The area comprises pine-dominated forests, predominately lodgepole pine (Pinus contorta) and whitebark pine (Pinus albicaulis), with a history of regular and frequent forest fires across the season snow zone.
The chronosequence of burned forests of progressing ages provides a study area with varying temporal features of post-fire impacts on LSA while reducing the spatial variability between sites due to a relatively similar forest structure and composition and topographic complexity across the study area. The eight fires evaluated in this study occurred between 2000 and 2018 in and near the Hoback River Basin. They contained continuous and mixed patches of unburned, low, moderate, and high burn severity areas (Table 1).

2.2. Remote Sensing Data

Daily LSA was derived from MODIS MOD10A1 dataset at 500-m spatial resolution; the MODIS/Terra Snow Cover Daily L3 Global 500 m SIN Grid, Version 6 [53]. Winter (January and February) and spring (March and April) snow albedo data were obtained from the two spatial tiles that included the chronosequence of eight burned forests from 2000 to 2019. We restricted data acquisition to these dates to evaluate the winter period of snow accumulation and the spring period of spring snow ablation. The seasonal snow albedo is typically brighter during winter and darker during spring due to grain growth and LAP concentration on the surface during snowmelt, ultimately driving seasonal variability in the radiative heat forcing on snow [54,55]. LSA values in the MOD10A1 dataset were calculated as the surface reflectance within snow-covered areas integrated from narrowband albedo to broadband albedo after atmospheric and forest reflectance properties [56]. Unlike SSA, measured or modeled at the snow surface, LSA is measured from a birds-eye-view on a satellite-based instrument that integrates variability across the surface into a broadscale landscape snow albedo value.
Yearly forest density was derived from the percent tree cover parameter in the MODIS MOD44B dataset at a 250-m spatial resolution; the MODIS/Terra Vegetation Continuous Fields (VCF) Yearly L3 Global 250 m SIN Grid, Version 6 [57]. Forest fire perimeters and gridded burn severity data at a 30-m spatial resolution were collected from the MTBS project [43]. Within the burn perimeters, burn severity was classified into high burn severity, moderate burn severity, and low/unburned forests from the differenced relativized differenced normalized burn ratio (RdNBR) in MTBS [43]. To distinguish open meadow from unburned forest within the burn perimeters and 5-km buffer areas, the National Landcover Database (NLCD) landcover classifications were used to differentiate unburned forest and open areas at a 30-m spatial resolution. The NLCD serves as the Landsat-based, 30-m resolution land cover database for the United States and provides spatial reference and data for land surface characteristics [58]. Excluding bodies of water, perennial ice, and snow cover, each landcover classification was categorized as either forest or open area. All areas classified as deciduous, mixed, and coniferous forests were categorized as forests. All areas classified as developed, barren, shrubland, herbaceous, planted/cultivated, and wetland were categorized as open areas.

2.3. MODIS Downscale

Broad-scale remote sensing data such as from MODIS, including snow albedo at a 500 m and forest density at a 250 m spatial resolution, was too coarse relative to the actual spatial variability to accurately evaluate the influence of burn severity on snow albedo following a forest fire. In order to reduce the large uncertainties persistent with MODIS snow albedo data primarily due to the coarse spatial resolution and mixed pixels, we downscaled the broad-scale snow albedo and forest density data using the 30 m burn severity data to ~150 m spatial resolution. We used a resampling method as the base procedure in performing an effective downscale of the MODIS data [59,60]. The MOD10A1 and MOD44B datasets were resampled via bilinear interpolation from the Landsat-derived burn severity classifications using the values of the four nearest cell centers to determine the value of the resampled MOD10A1 and MOD44B datasets. We performed this procedure on every daily snow albedo and annual forest density measurement within each forest fire area and burn severity classification. Particularly in areas of complex landcover patchiness, the discrepancies in the spatial scale of the processes influencing snow albedo to the scale of the measurements introduce uncertainty even after being transformed via downscaling methods [61].

2.4. SNOTEL Data and Days since Snowfall

Daily snow depth (cm) data were retrieved from snow telemetry (SNOTEL) stations using the Natural Resources Conservation Services (NRCS) Data Retrieval Tool from 1 January 2001–2 April 2021. The SNOTEL network is an automated system of snowpack and related micro-meteorological sensors operated by the NRCS of the United States Department of Agriculture. SNOTEL sites throughout the Western US and Alaska typically collect continuous snow water equivalent (SWE), total precipitation, snow depth, and air temperature data [52]. The meteorological data was first retrieved by performing a query using Google Earth Engine. The SNOTEL stations contained in or near the Hoback River Basin were used in this study, including Blind Bull Summit (353), Burroughs Creek (379), Castle Creek (1130), Cold Springs (405), East Rim Divide (460), Granite Creek (497), Gros Ventre Summit (506), Gunsight Pass (944), Kendall R.S. (555), Little Warm (585), Loomis Park (597), Phillips Bench (689), Snider Basin (765), Spring Creek Divide (779), Togwotee Pass (822), and Triple Peak (831). For the entire period of record from the MODIS data, days since snowfall was derived by calculating the number of days since a daily snow depth accumulation greater than 5 cm.

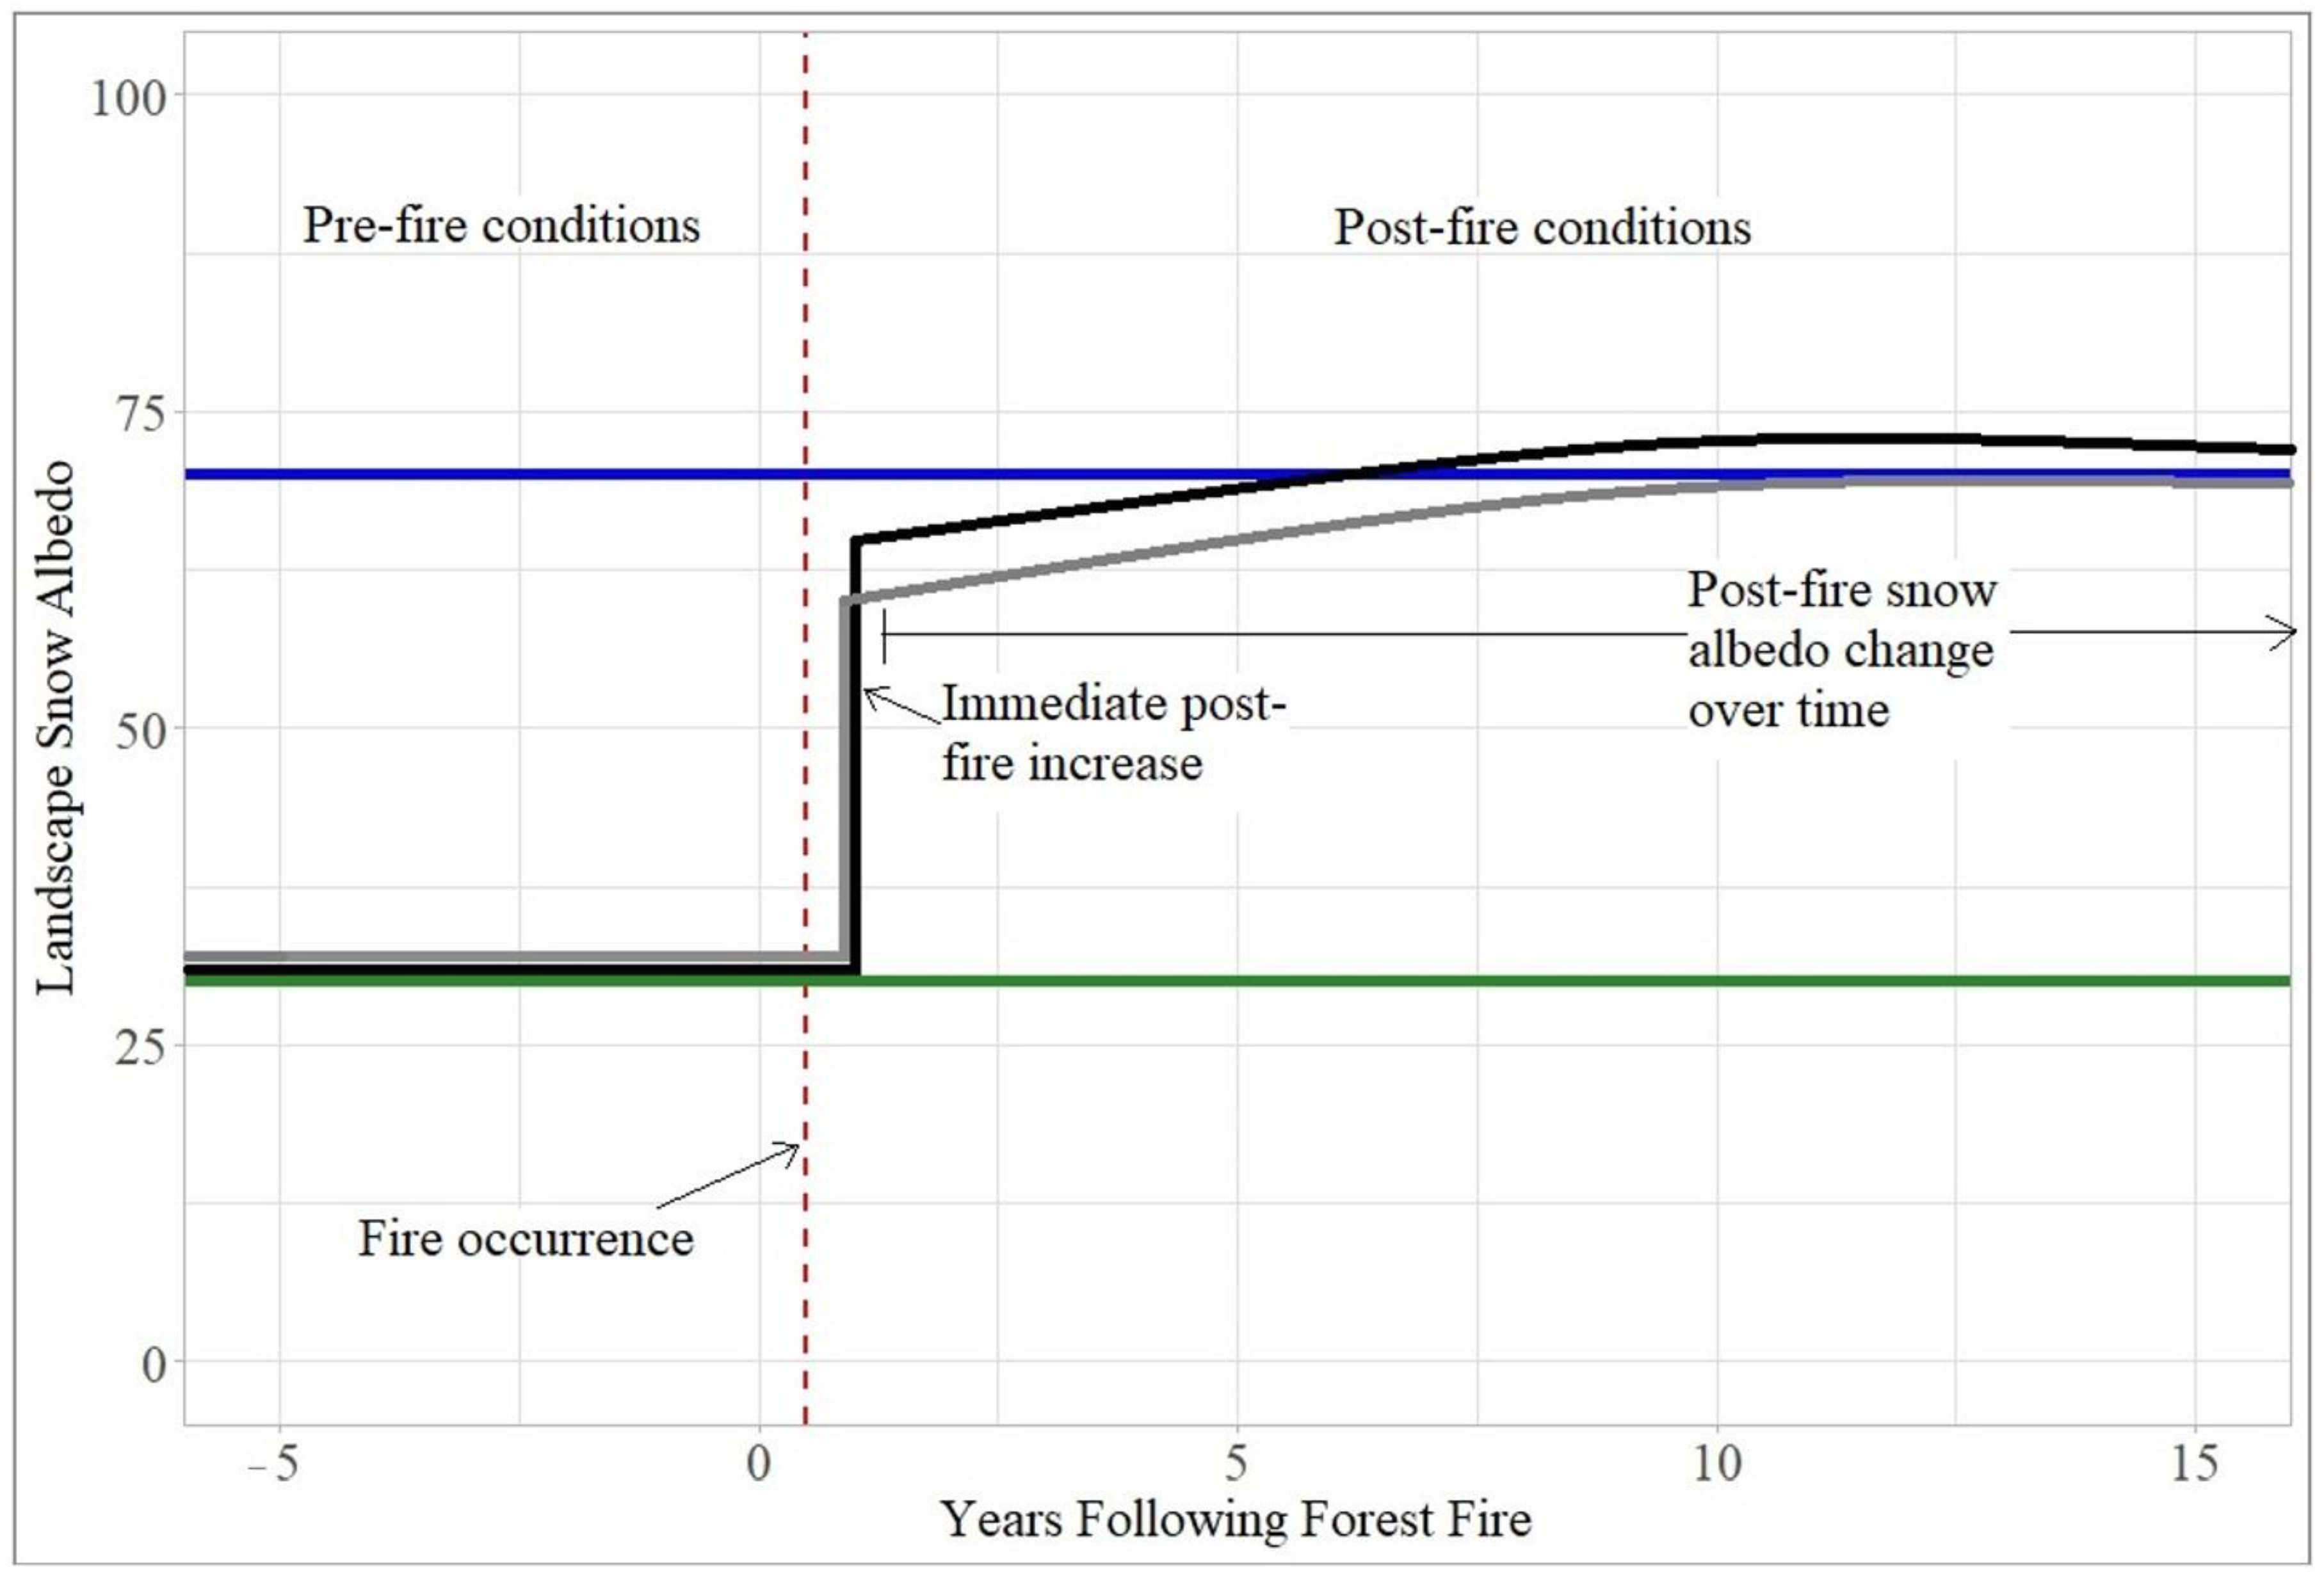
2.5. LSA Recovery and Decay Statistical Analysis

Average winter, spring, and annual snow albedo values and standard deviation were calculated for each burn severity classification for each fire. In total, we evaluated a total of 24,605 snow albedo values spread across eight fires and four burn severity classifications; 13,674 pre-fire values and 10,931 post-fire values, and an additional total of 11,744 daily snow albedo values spread across the unburned forest and open meadow in the 5-km buffered areas; 6502 pre-fire values and 5242 post-fire values. Average winter, spring, and annual snow albedo metrics within each fire were normalized by the average winter, spring, and annual snow albedo values from within the 5-km buffered area. The buffer forest area snow albedo metrics were used to normalize the high severity, moderate severity, and unburned forest areas in the burned forest, while the buffer open area was used to normalize the open area within the burn perimeter. Average annual forest density was calculated for each burn severity classification for each fire for the entire period of record from 2000–2019. Post-fire percent differences in snow albedo and forest density were calculated for all burn severity classifications and years since the fire. Normalized pre- vs. post-fire LSA comparisons were compared for winter, spring, and annual snow albedo values for each burned forest in the chronosequence using Welch’s two-sample t-test.
Multivariate linear regression models were used to characterize annual normalized LSA (nLSA) in the burn perimeter as a function of forest density and years-since-fire, relative to burn severity classification. Spline regression models were developed using the splines package in R to investigate key stages and potential thresholds in the post-fire snow albedo recovery. Each spline model function was partitioned with a 75–25 split, such that 75% of the data was used to train the models, and 25% of the data was used to test each model. Manual knots were identified to minimize the residual sum of squares on validation data and used in the spline regression model to represent the major stages in post-fire LSA recovery. To characterize post-fire snow albedo decay functions for snow accumulation and snow ablation periods, winter and spring daily snow albedo values were plotted over average days since snowfall for the study region. Exponential decay functions were used to model the post-fire snow albedo decay relative to the key post-fire snow albedo recovery stages. Exponential decay models were computed using a generalized linear model with a Gaussian log-link. ArcGIS Pro 2.7.0 and R Studio software version 1.2.5 [62,63] were used for all data analysis. Statistical relationships were tested with a significance level of 0.05.

3. Results

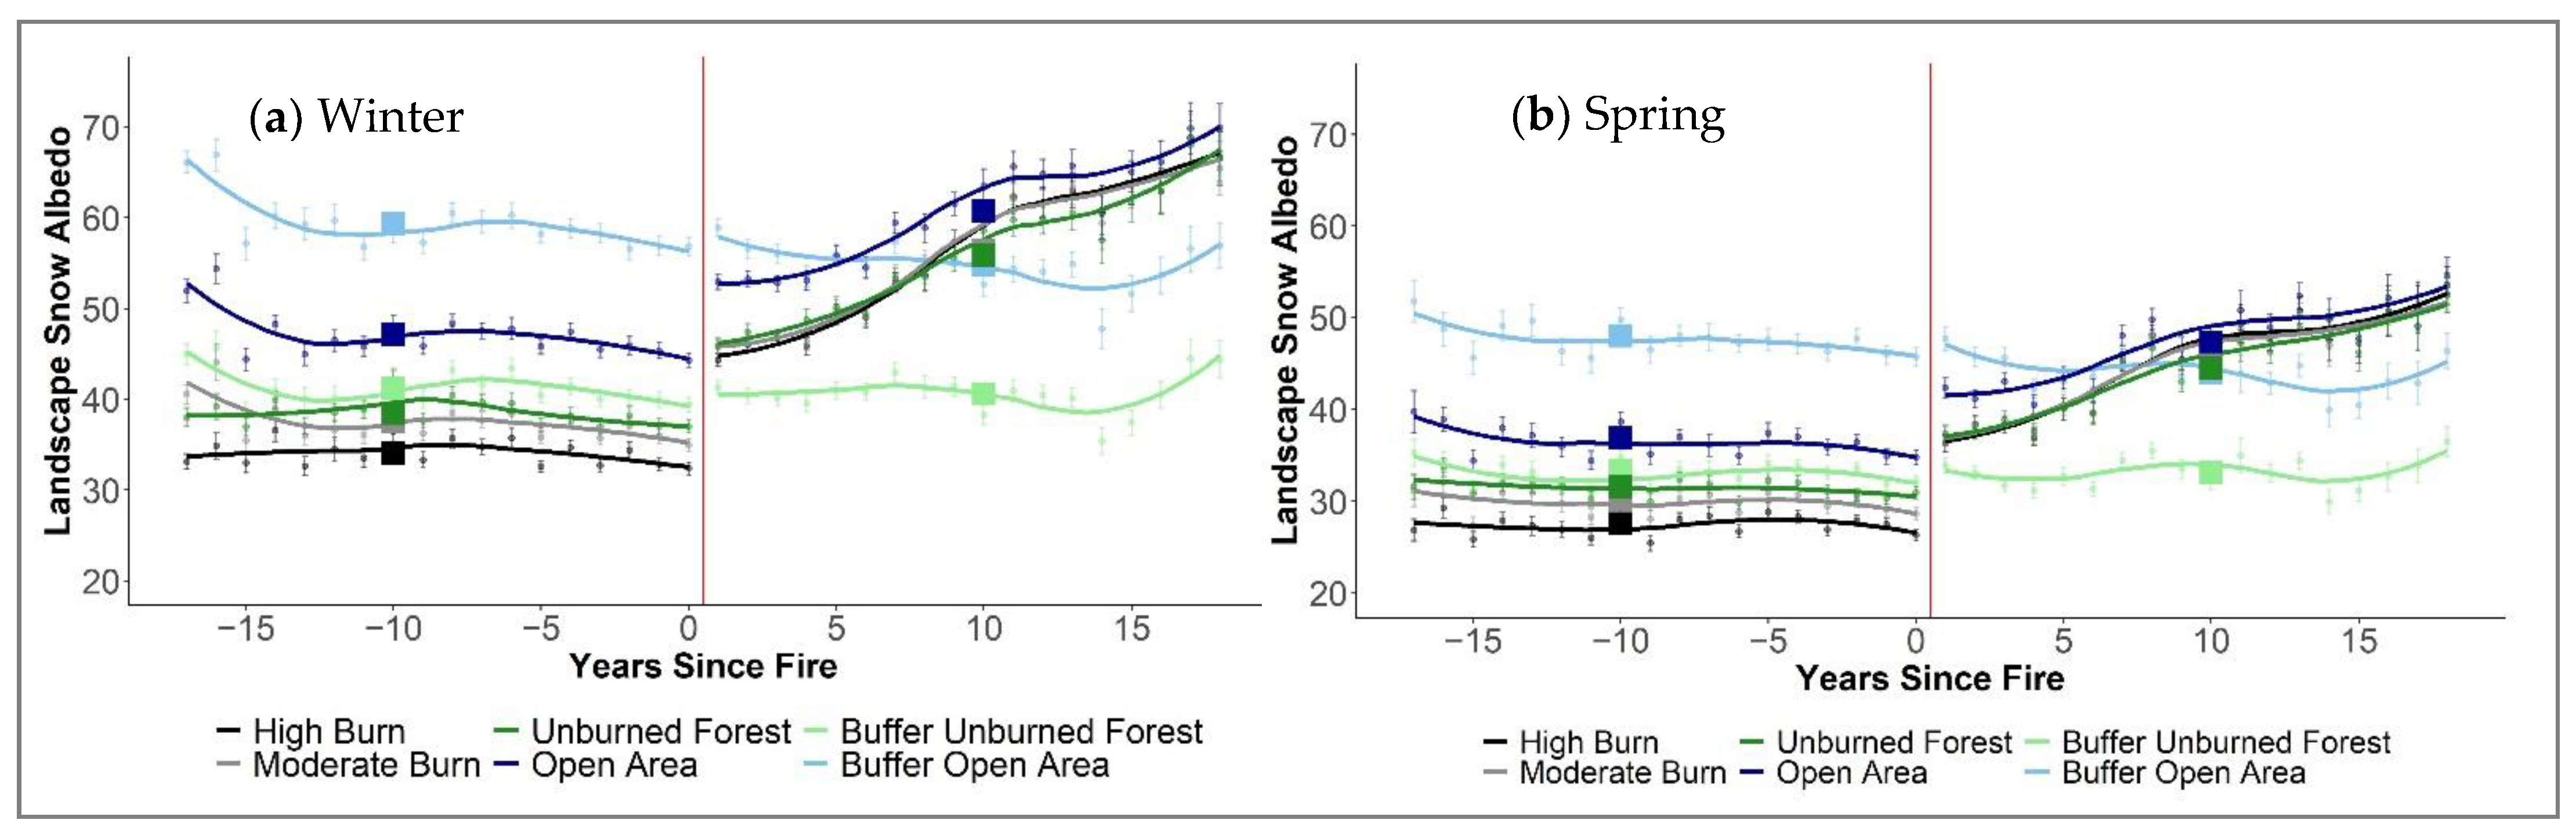
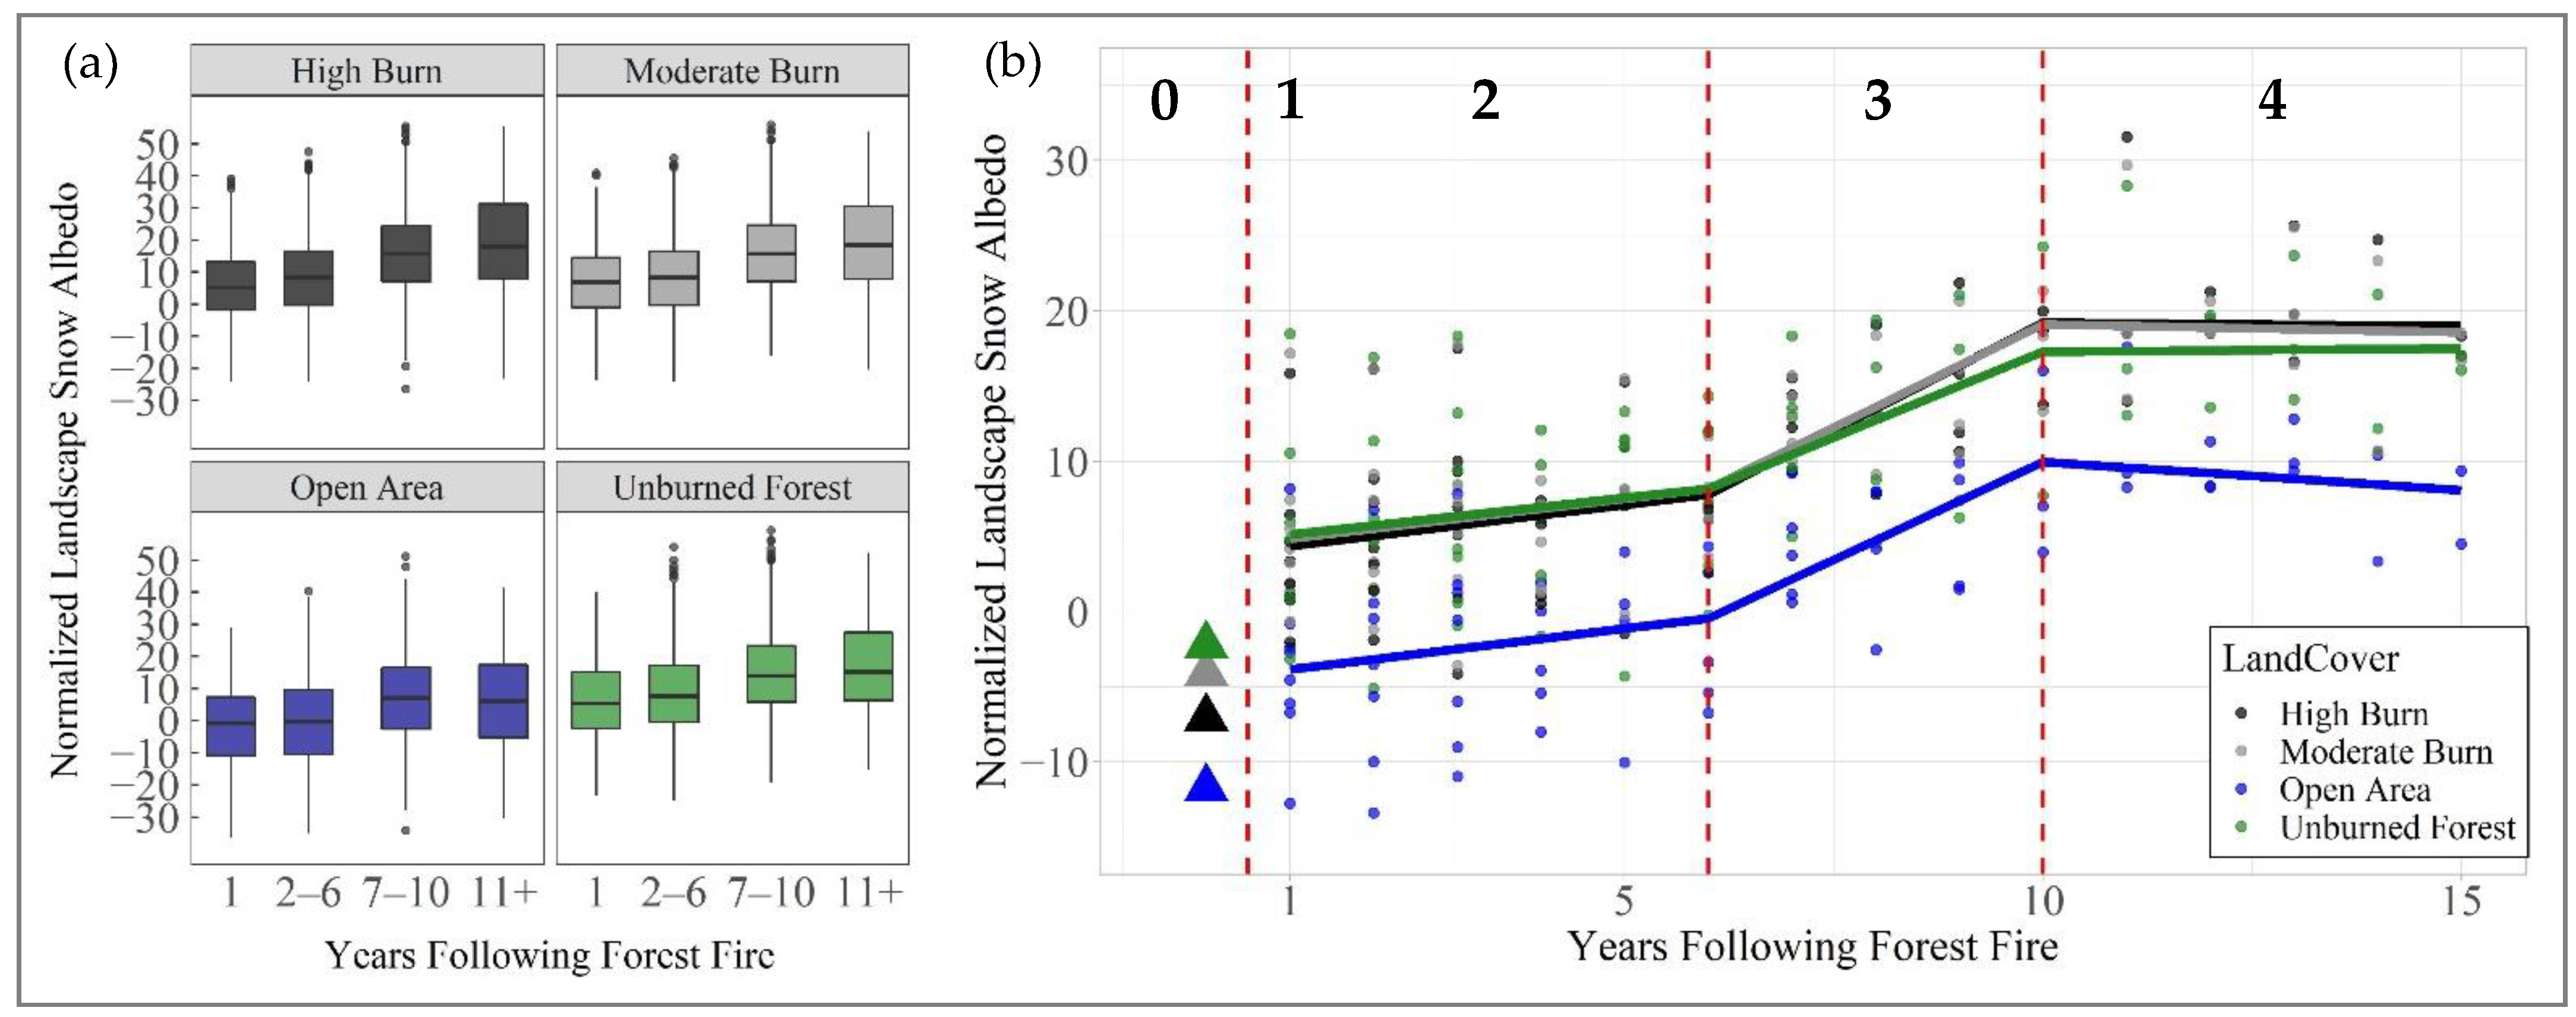
3.1. Annual Landscape Snow Albedo Recovery following Forest Fire

Annual post-fire LSA increased the first winter following forest fire by 21% on average (range of 15–28%, mean increase relative to pre-fire LSA = 6.6, sd = 12.8, p-value < 0.0001). Across all eight fires, LSA brightened by 33% on average (range of 8–39% increase) over the 18 years following the fire and the period of record in this study (Table 2, mean increase relative to pre-fire LSA = 10.1, sd = 11.9, p-value < 0.0001). Annual LSA recovery occurred over the 10 years following the fire, while annual LSA continued to brighten across all eight burned forests (Figure 3). After a decade following the fire, no significant change in annual post-fire LSA recovery was observed.
Post-fire LSA during winter was brighter by 19% overall than post-fire LSA during spring (Figure 4; winter mean = 54.4, sd = 9.0; spring mean = 44.0, sd = 7.5). The difference between winter and spring post-fire LSA increased with burn severity, demonstrating the dependence of LSA on forest density. Post-fire winter LSA persistently increased by 1.3 per year following a fire, while spring LSA measurements increased by 1.0 per year following a fire event, suggesting a potential influence of post-fire radiative forcing on surface snow albedo during the springtime snowmelt phase.
Areas with high and moderate burn severity experienced the greatest change in pre-fire vs. post-fire normalized LSA, undergoing a 44% and 36% increase, respectively, over the period of record (Table 3; p-value < 0.001). Within the burn perimeter, unburned forest and open meadow areas increased by 32% and 22%, respectively, over the period of record (Table 3; p-value < 0.001). Annual LSA values were not significantly different between the forested burn severity classes within the burned perimeter during the pre-fire or post-fire periods. Post-fire comparisons within the burn perimeter demonstrate that all burn severity classes brighten after the fire, and the forest classes, including “unburned”, “high severity”, and “moderate severity” classes, were similar. In contrast, the open meadow within the burn perimeter was consistently brighter following the fire. Overall, brightening occurred over a decade following the fire until LSA in all forest classes within the burn perimeter resembled the LSA in the open meadow (Figure S1).

3.2. Post-Fire Annual Landscape Snow Albedo Recovery

Post-fire landscape snow albedo increased persistently for more than ten years following a fire as a function of forest density, years-since-fire, and burn severity (p < 0.0001, R2 = 0.68; nLSA = 12.2 + 1 years-since-fire − 0.4 × forest density + 12.2 × high + 0.2 × moderate + 0.7 × unburned − 10.1 × open). Spline regression models demonstrated the rate of post-fire LSA recovery occurred in four main stages, including (1) an immediate post-fire increase in snow albedo (0–1 years), (2) an early post-fire period of slow snow albedo recovery (1–6 years), (3) an intermediate post-fire period of faster snow albedo recovery (6–10 years), and (4) a “final” post-fire period of snow albedo stabilization after 10 years following the fire. The models associated with these main recovery periods take the form of:
n L S A   { a + b 0 6 x         i f   x < 7 a + b 7 10 ( x 6 )         i f   7 x 10   a b 10 + ( x 10 )         i f   x > 10
where: x = years since fire, a & b = model coefficients.
The model coefficients are included here for the whole burned area (p < 0.0001, R2 = 0.4; a = 1.06, b0–6 = 0.66, b7–10 = 1.96, b10+ = 2.74), as well as each burn severity area within the burned area including, high burn severity (p < 0.0001, R2 = 0.57; a = 3.66, b0–6 = 0.69, b7–10 = 2.17, b10+ = 2.90), moderate burn severity (p < 0.0001, R2 = 0.57; a = 4.18, b0–6 = 0.66, b7–10 = 2.07, b10+ = 2.84), unburned forest (p < 0.0001, R2 = 0.37; a = 4.51, b0–6 = 0.61, b7–10 = 1.66, b10+ = 2.23), and open area (p < 0.0001, R2 = 0.5; a = 4.53, b0–6 = 0.68, b7–10 = 1.92, b10+ = 2.99) where x represents years following a fire event. The annual rate of post-fire snow albedo recovery across these four periods occurred as follows, (1) NA, (2) 0.55 ± 0.3, (3) 2.27 ± 0.5, and (4) 0.06 ± 0.4. The fourth stage of stabilization after 10 years following the fire in post-fire snow albedo recovery indicates the post-fire LSA in burned forests may be more similar to that of open meadows outside the burned perimeter than the antecedent pre-fire LSA values (Figure 5).

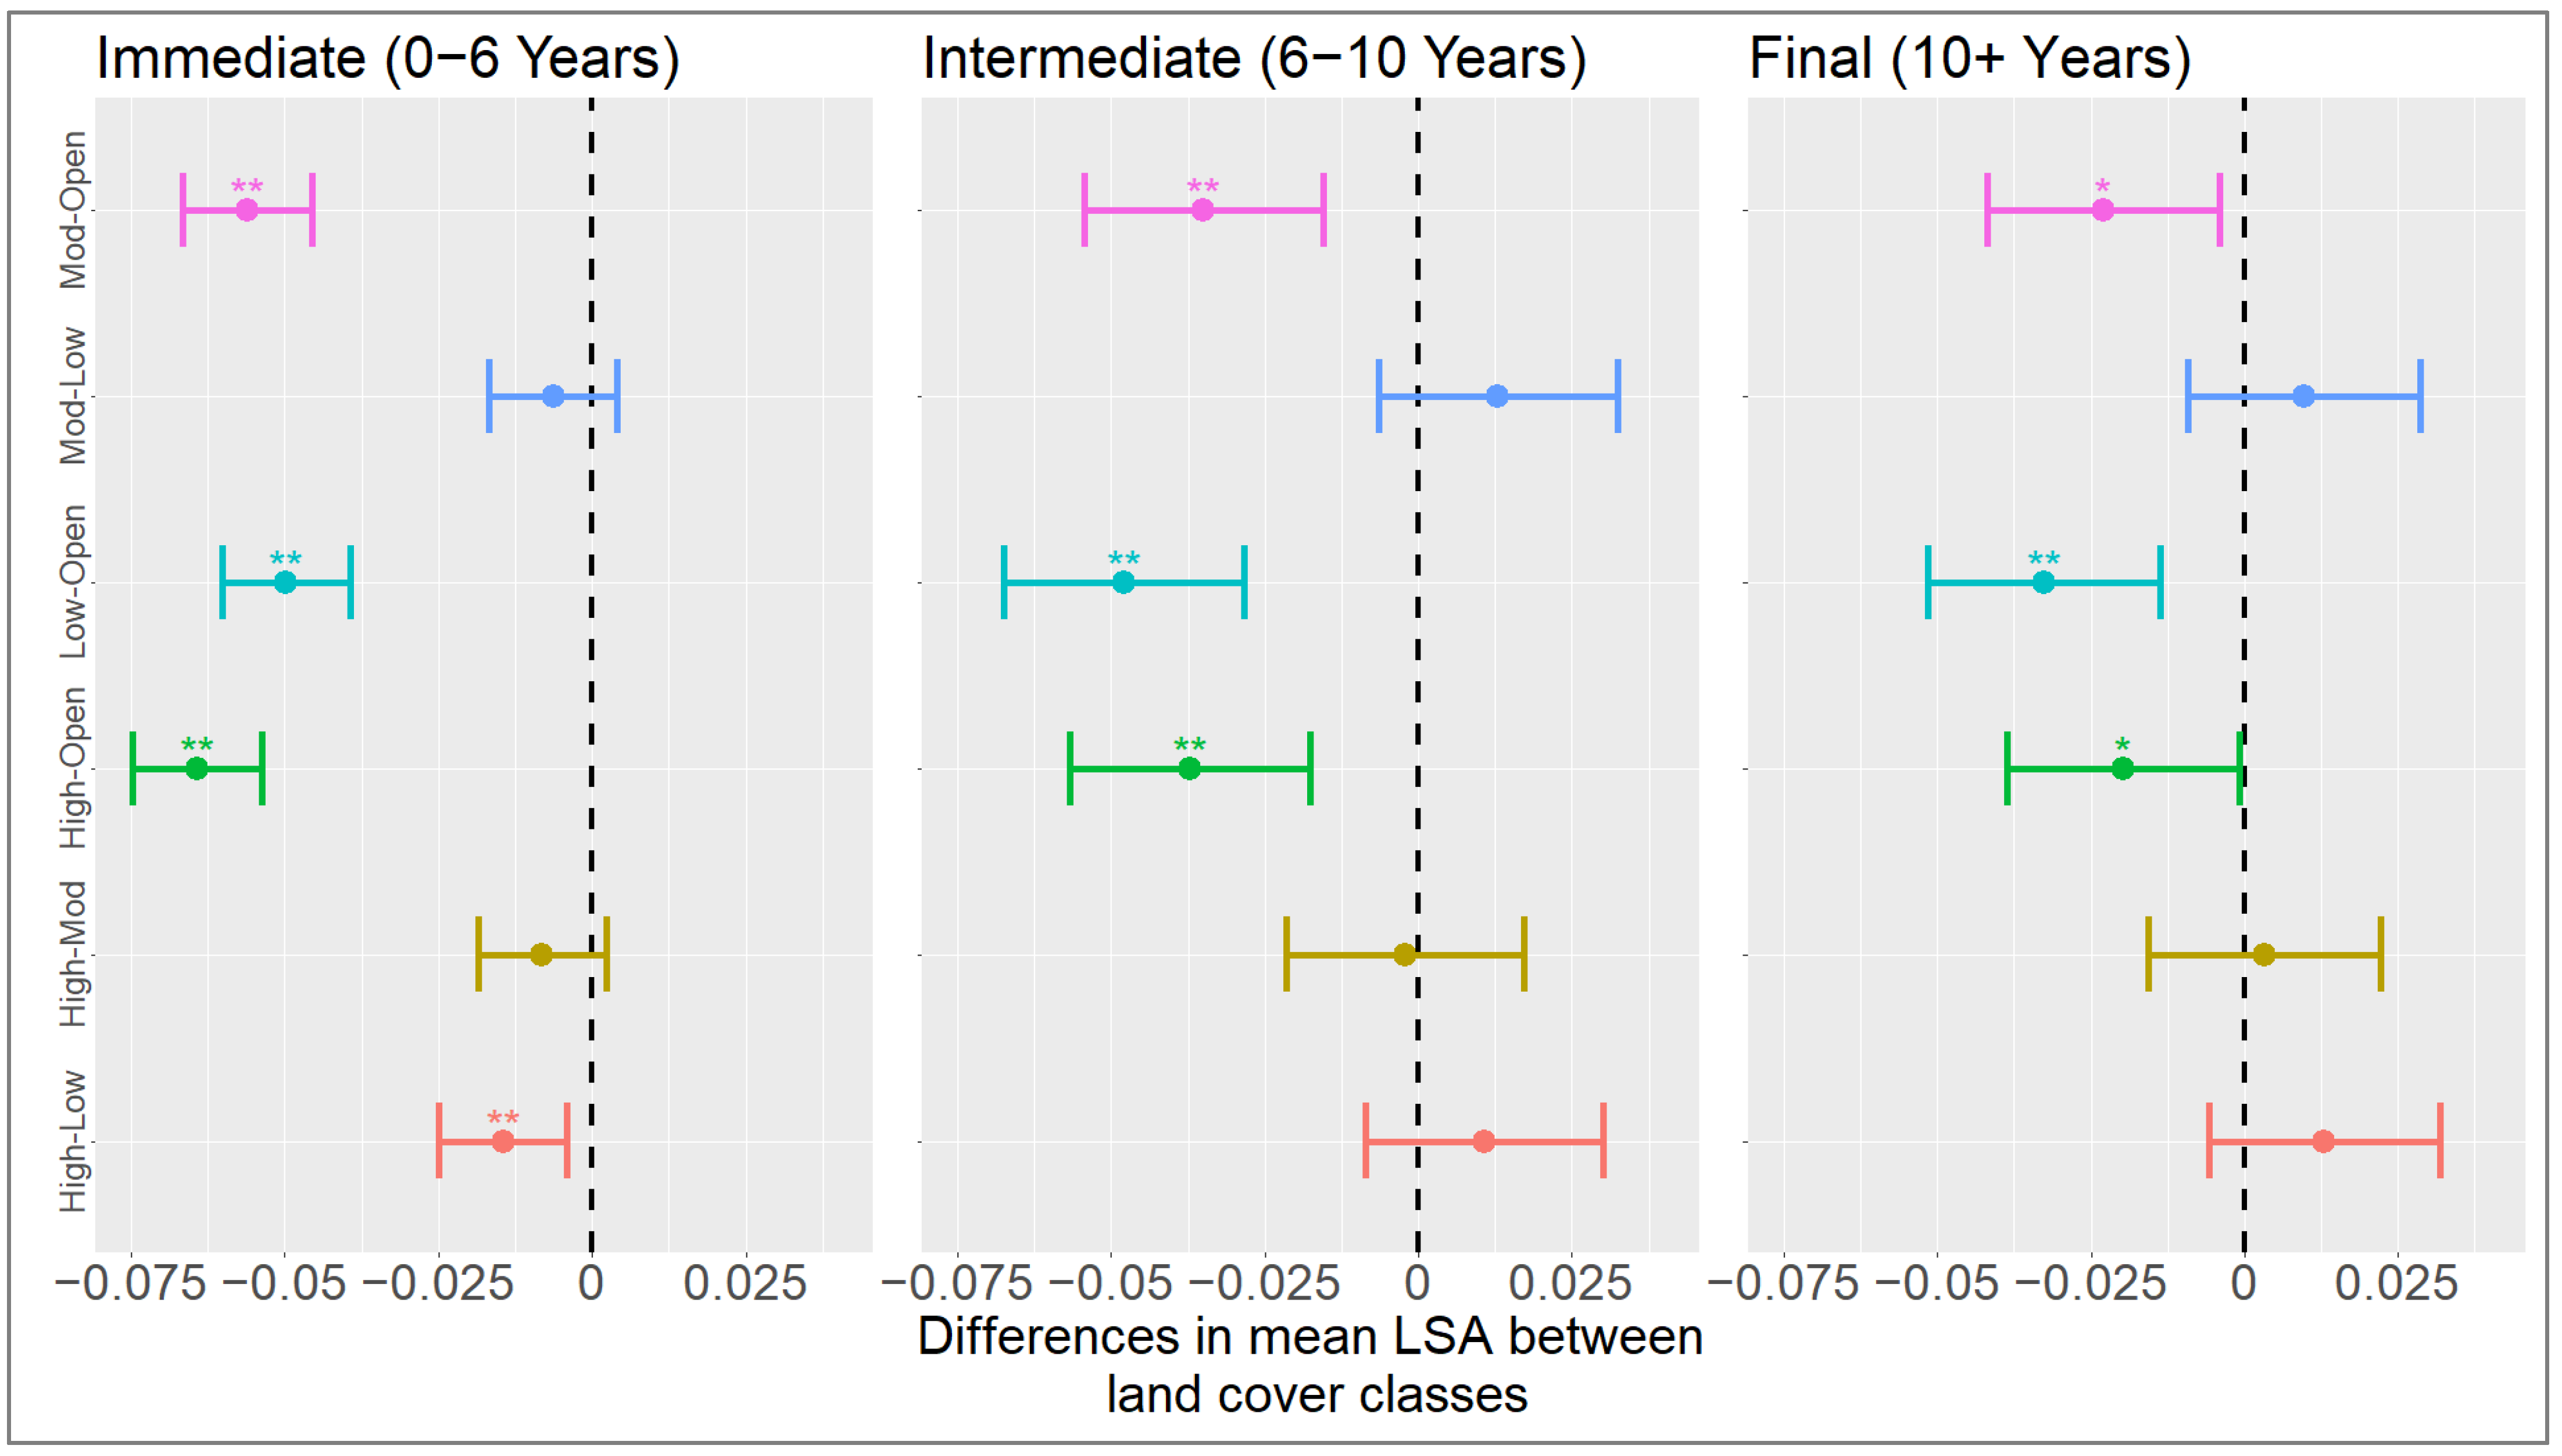
3.3. Post-Fire Burn Severity and Annual Landscape Snow Albedo Recovery

Landscape snow albedo across the burned forest area showed similar long-term albedo values and overall recovery patterns regardless of the burn severity classification (Figure 5). Specifically, LSA in high and medium severity burned forests showed no significant difference from one another for up to 15 years following the fire. Within the fire perimeters, LSA in low severity burned forests was lower than LSA in high severity burned forests only in the first 6 years following fire and showed no significant difference from moderate severity burned regions over the entire post-fire period. Open meadow areas within the fire perimeters were consistently brighter than forested areas in low, medium, and high severity burned areas over the entire post-fire period. Over the decade observed following the fire, LSA in high and moderate severity burned forests converged on LSA in the open meadow (Figure 5). High and moderate severity burned forests were much darker immediately following forest fire than open meadows outside the fire perimeter. In contrast, over the post-fire snow albedo recovery period 10 years following the fire, the LSA in the high and moderate severity burned forests transitioned to near zero difference with open meadows outside the burn perimeter (Figure S1).

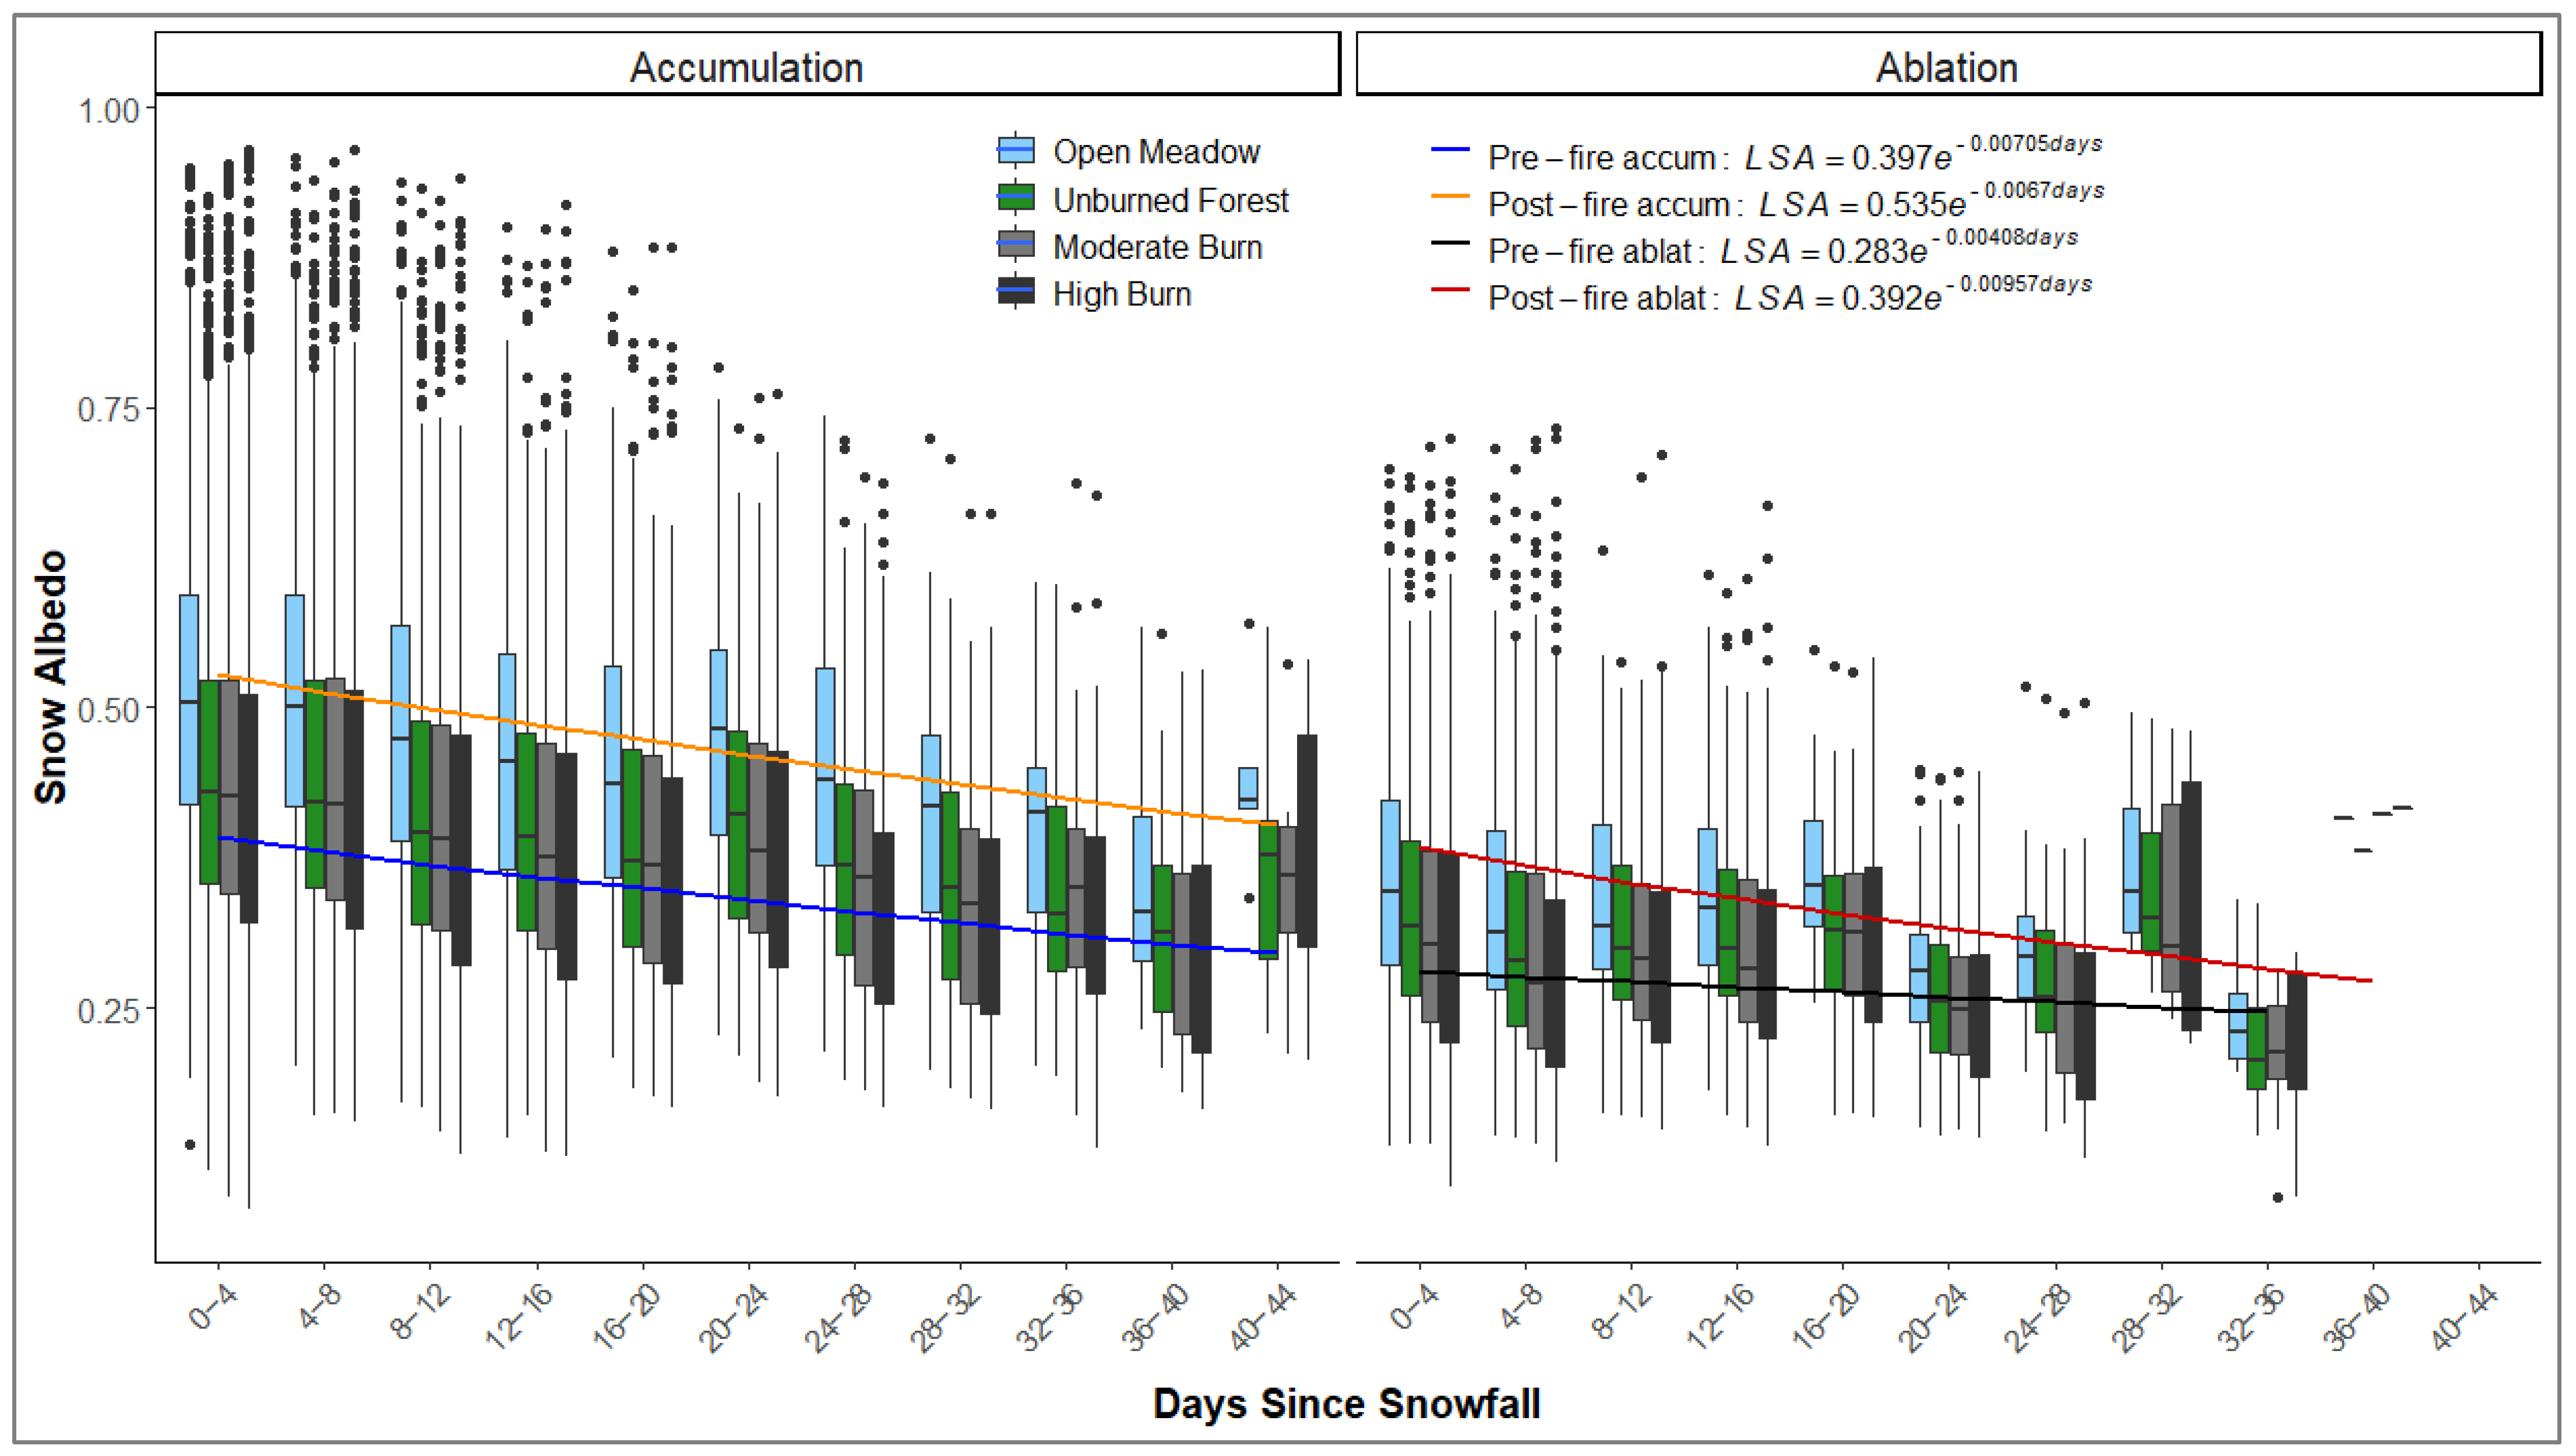
3.4. Post-Fire Daily Landscape Snow Albedo Decay

Post-fire daily landscape snow albedo decay (over days since snowfall) occurred more rapidly than in the pre-fire period during spring ablation (Figure 6, pre-fire vs. post-fire during accumulation, n = 12,537, Wald Z = 49.82, p-value ≤ 0.0001; pre-fire vs. post-fire during ablation, n = 12,066, Wald Z = 24.92, p-value ≤ 0.0001). Post-fire daily LSA decay demonstrated steeper exponential decay coefficients than pre-fire daily LSA decay during the snowmelt period (pre-fire accumulation ( LSA   = 0.397 e 0.00705   days ), post-fire accumulation ( LSA   = 0.535 e 0.0067   days ), pre-fire ablation ( LSA   = 0.283 e 0.00408   days ), post-fire ablation ( LSA   = 0.392 e 0.00957   days ). Post-fire daily LSA decay models were different during the initial and final snow albedo decay recovery periods but not during the intermediate recovery period. Therefore, they were aggregated into one primary decay model for the pre-fire and post-fire periods. Pre- and post-fire LSA maximum and minimum values, derived from LSA decay models, demonstrate how daily LSA decay relates to decadal scale post-fire LSA recovery. Post-fire LSA maximum values were brighter following fire across LSA decay during accumulation. However, post-fire LSA maximum values converge during ablation on the lower values of pre-fire LSA after weeks of post-fire LSA decay. Lower overall maximum and minimum daily LSA values relative to snow albedo decay were observed in the initial stage of post-fire LSA recovery than in the final stage (Figure 5 and Figure S1), reflective of the broader post-fire landscape snow albedo recovery over time.

4. Discussion

Across the chronosequence of eight burned forests in western Wyoming, LSA immediately brightened the first year following the fire and continued to increase for at least ten years following the fire. In the burn perimeters, a mosaic of post-fire forest structure was associated with heterogeneous antecedent conditions and post-fire burn severity. Within the burn perimeters, the forested areas, including high and moderate burn severities and unburned forests, experienced a more significant change in post-fire LSA than open areas. Over a decade post-fire, snow albedo changes do not demonstrate significant recovery to the pre-fire unburned forest but more resemble an open meadow.

4.1. Post-Fire Landscape Snow Albedo Recovery

Like surface snow albedo, landscape snow albedo recovery occurs over a decade following a forest fire, with the degradation of forest canopy structure as the key driver underlying the paradox of the post-fire snow albedo change. The immediate removal in canopy density caused an immediate increase in exposure of the snow surfaces and higher post-fire LSA values. Over the years following a forest fire, continuing forest mortality and shedding of the forest canopy reduced forest density [64], leading to the recovery in post-fire LSA over a decade following fire. The post-fire LSA recovery stabilized after ten years-since-fire as LSA flattened out, suggesting a decade-long post-fire LSA recovery period (Figure 4). Across all eight fires, forest density was at its lowest approximately fifteen years following a fire before showing indications of potential forest recovery.
Four main stages of post-fire LSA recovery occurred across the chronosequence of burned forests, including (1) an immediate post-fire increase in snow albedo (0–1 years), (2) an early post-fire period of slow snow albedo recovery (1–6 years), (3) an intermediate post-fire period of faster snow albedo recovery (6–10 years), and (4) a “final” post-fire period of stabilization after 10 years following fire (Figure 4b). Spline regression model results provide an understanding of the stages and duration of post-fire snow albedo recovery which should inform hydro-climatological modeling.
Over the decade of observed post-fire recovery, the difference in mean LSA between burned forests and open meadows shrinks in magnitude over years-since-fire indicating that the mean LSA of burned forests becomes more similar to the mean LSA of unburned open meadows as the post-fire forest recovers (Figure 5). Conversely, the difference in mean LSA between burned and unburned forests grow in magnitude over the years since the fire, indicating that the mean LSA of burned forests becomes less similar to the mean LSA of unburned forests over the years since the fire (Figure S1). Together, these results show that the LSA of snowpack in burned forests does not recover back to the LSA of unburned forests after 10 years following fire and instead recovers to the LSA of open meadows 10 years post-fire.

4.2. Uncertainties in Post-Fire Landscape Snow Albedo Recovery

We quantified the spatio-temporal relationship between post-fire LSA recovery and forest density. However, many complex measures influence recovery after ten years following a fire. In many areas throughout the seasonal snow zone, post-fire climate conditions are likely to become increasingly unfavorable to tree regeneration, even if seed sources are nearby [65,66]. High severity burned areas are less likely to see complete forest regeneration, with probable conversion to non-forest landscape [65,66]. Studies have suggested the increase in LSA following a forest fire may be significant enough to neutralize the initial carbon release caused by the fire and thus may not necessarily accelerate climate warming to a significant degree [31,34]. There are negative hydrologic implications of a forested area being converted to a non-forested area. Post-fire landscape heterogeneity continues to increase with delayed tree mortality and regeneration rates, and it is unclear when or if LSA in a burned forest returns to the levels of pre-fire conditions.
While signs of regeneration were visible in the MOD44B data approximately fifteen years following a fire, there may have been a delayed response of decreasing post-fire LSA back to pre-fire conditions due to MOD44B measuring on an annual temporal scale. Vegetation regeneration and regrowth were most likely prevalent and visible in the late spring- and summertime. Past studies with MODIS products suggest that the difference between pre-fire and post-fire spring- and summertime surface albedo increases with time during the first five to eight years following a fire [31,45]. In snow-dominated, mountainous areas, late-spring snow cover may influence the appearance of vegetation recovery.
To remove the interannual variability of snow conditions from the post-fire snow albedo recovery patterns, we normalized LSA within the burned areas by the LSA within the 5 km buffer area surrounding the burned areas. Open areas in the buffer zones were brighter even before the fire occurred than those in the burned perimeter, possibly due to developed areas or high shrublands in the buffer zones that are different. For this reason, and also due to the mixed pixels inherent in coarse resolution MODIS data, we observed negative nLSA values in the burned forest prior to forest fire occurrence (Figure 4).
There was an observed period approximately from seven- to ten years following the fire where the LSA in the high burn, moderate burn, and unburned forest areas became brighter than the LSA in the buffer open area. This was unexpected, as the buffer open area was predicted to represent the brightest areas of measured LSA. However, when the buffer areas were constructed from the NLCD dataset, multiple landcover identifications classified as an open area might have made it significantly darker than an open meadow in the wilderness. For example, developed areas, which are typically impervious and dark surfaces, and shrublands, which were described as areas of two classes, one of which being shrubs no higher than three meters tall. Both landcover types were classified as buffer open areas in the study, while they have a probability of darkening the LSA more than an open meadow. For this reason, it was possible for the LSA in the burned perimeter to appear brighter in the measured data than that of the buffer open area.

4.3. Post-Fire Landscape Snow Albedo Decay

Post-fire snow albedo was higher overall than pre-fire snow albedo following fresh snowfall during both the accumulation and ablation periods (Figure 6). During accumulation, pre- and post-fire snow albedo decay rates were similar, but during ablation, post-fire snow albedo decay was much faster than pre-fire snow albedo decay. In early winter, as snow accumulates, solar incidence angle is low, and temperature gradients within the snowpack are typically low, so snow albedo decay is slower. While in early spring, as the snow melts, the solar incidence angle is higher, and temperature gradients in the snowpack are greater. In contrast, the post-fire snowpack surface is darkened by black carbon and burned woody debris, lowering snow albedo overall and accelerating snow albedo decay rates. The spatio-temporal variability in post-fire LSA decay observed in this study using coarse resolution remote sensing data aligns with previous research which used in situ SSA measurements [15]. These post-fire LSA decay functions may be useful in parameterizing the spatio-temporal variability of snow albedo in hydrologic modeling.

4.4. Uncertainties in Post-Fire Landscape Snow Albedo Decay

The spatial heterogeneity caused by forest fires introduces new complexities influencing snow accumulation and ablation in burned forests. Throughout this study, we found the variability of daily post-fire LSA measurements increased compared to the daily pre-fire LSA. The spatial scale of MOD10A1 made it difficult to differentiate the burn severity classifications in this matter. Therefore, we could not statistically differentiate between the post-fire LSA of high burn, moderate burn, and unburned forest areas. A contributing factor in this may have been the incorporation of low-burned areas into our unburned classification, although low-burned areas likely produce little forest damage, mostly affecting the understory. However, MOD10A1 captured the increased effect forest fires have on springtime snowmelt vs. winter accumulation.
At the large spatial resolution presented by the MOD10A1 pixels, key snow-forest processes are occurring at the sub-pixel resolution that influenced the results of LSA that we most likely were not able to account for. This was the main purpose of downscaling the MODIS resolution. Pre-fire forest conditions are generally more homogenous, in that forested areas are dominated by vegetation and open areas are more dominated by shrubland or grassland. However, the landscape mosaic becomes much patchier and heterogenous following a forest fire, increasing the likelihood that landcover will be misclassified at the sub-pixel level. For instance, MODIS pixels assigned to a high burn severity designation most likely also contain patches of low or moderate burn severity. Therefore, the snow albedo calculated from coarse spatial resolution MODIS pixels over high burn severity area is underrepresented and lower than it typically would be when determined by the finer spatial resolution of an instrument like Landsat-8 [67].

5. Conclusions

Post-fire landscape snow albedo increases up to 10 years following a fire over four main stages of recovery due to decreasing forest density and increasing exposure of the snowpack. After the initial stage of immediate brightening, post-fire LSA continues to increase. Still, the brightening is greatest between five and ten years following a fire event, possibly due to the transition between initial and delayed tree mortality. After ten years post-fire, post-fire LSA recovery stabilized where the burned areas were more like an open area than the unburned forest before the fire occurrence.
As climate warming continues, seasonal snowpacks will continue to decline, resulting in earlier snowmelt and lower annual landscape albedo. Moreover, due to warming, forest fires will continue to increase in intensity, size, frequency, and duration, impacting the environment and human life [68,69]. Particularly in the western US, the increase in forest fires and rising temperatures will continue to deplete seasonal snowpack, making water availability an increasing issue. Post-fire snow albedo recovery is critical to improving models estimating snow albedo-climate feedbacks, snow-water storage, water resource availability, and vulnerability.

Supplementary Materials

The following supporting information can be downloaded at: https://www.mdpi.com/article/10.3390/rs14164079/s1, Figure S1: Tukey plot shows significance in pairwise differences in mean landscape snow albedo data between burned forest (high, moderate, low burn severity classifications) relative to open meadow in the burned regions and forest and open meadow in the buffer outside the burned regions.

Author Contributions

Conceptualization, K.E.G. and M.G.; methodology, K.E.G., M.G. and A.S.; formal analysis, M.G. and A.S.; investigation, XK.E.G.; resources, K.E.G.; data curation, M.G. and A.S..; writing—original draft preparation, M.G.; writing—review and editing, K.E.G.; visualization, K.E.G., M.G. and A.S.; supervision, K.E.G.; project administration, K.E.G.; funding acquisition, K.E.G. All authors have read and agreed to the published version of the manuscript.

Funding

This research was funded by the National Aeronautics and Space Administration, Terrestrial Hydrology Program, grant number 80NSSC19K0002.

Data Availability Statement

Data used in this analysis for SNOTEL sites can be obtained from the Natural Resources Conservation Service Report generator 2.0 at https://wcc.sc.egov.usda.gov/reportGenerator/ (accessed on 4 February 2020). Burn perimeters and burn severity data from the MTBS database can be obtained at https://www.mtbs.gov/ (accessed on 4 February 2020).. Land cover data from the NLCD database can be obtained at https://www.usgs.gov/centers/eros/science/national-land-cover-database (accessed on 4 February 2020). LSA data from the MOD10A1 product can be obtained at https://nsidc.org/data/mod10a1 (accessed on 4 February 2020)., and forest density from the MOD44B product can be obtained at https://lpdaac.usgs.gov/products/mod44bv006/ (accessed on 4 February 2020)..

Acknowledgments

We thank the generous support of the NASA Terrestrial Hydrology Program for the New Investigator Program, which provided funding for this research. We thank the College of Liberal Arts and Sciences at Portland State University (PSU) for the Graduate Teaching Assistantship support to the Department of Environmental Science and Management, which enabled this research. We are grateful to the graduate committee, including Max Nielsen-Pincus and Geoffrey Duh, who provided academic contributions to the thesis, which provided the foundation of this work. Additionally, we thank our family, the PSU snow lab, and childcare providers who supported us personally through this research experience.

Conflicts of Interest

The authors declare no conflict of interest.

References

  1. Li, D.; Wrzesien, M.L.; Durand, M.; Adam, J.; Lettenmaier, D.P. How Much Runoff Originates as Snow in the Western United States, and How Will That Change in the Future? Geophys. Res. Lett. 2017, 44, 6163–6172. [Google Scholar] [CrossRef] [Green Version]
  2. Tague, C.; Grant, G. Groundwater Dynamics Mediate Low-Flow Response to Global Warming in Snow-Dominated Alpine Regions. Water Resour. Res. 2009, 45, W07421. [Google Scholar] [CrossRef]
  3. Buytaert, W.; Cuesta-Camacho, F.; Tobon, C. Potential Impacts of Climate Change on the Environmental Services of Humid Tropical Alpine Regions. Glob. Ecol. Biogeogr. 2011, 20, 19–33. [Google Scholar] [CrossRef]
  4. Mote, P.W.; Li, S.; Lettenmaier, D.P.; Xiao, M.; Engel, R. Dramatic Declines in Snowpack in the Western US. Npj Clim. Atmos. Sci. 2018, 1, 2. [Google Scholar] [CrossRef] [Green Version]
  5. Clifton, C.F.; Day, K.T.; Luce, C.H.; Grant, G.E.; Safeeq, M.; Halofsky, J.E.; Staab, B.P. Effects of Climate Change on Hydrology and Water Resources in the Blue Mountains, Oregon, USA. Clim. Serv. 2018, 10, 9–19. [Google Scholar] [CrossRef]
  6. Mote, P.W.; Hamlet, A.F.; Clark, M.P.; Lettenmaier, D.P. Declining Mountain Snowpack in Western North America. Bull. Am. Meteorol. Soc. 2005, 86, 39–50. [Google Scholar] [CrossRef]
  7. Pederson, G.; Betancourt, J.; McCabe, G. Regional Patterns and Proximal Causes of the Recent Snowpack Decline in the Rocky Mountains, US. Geophys. Res. Lett. 2013, 40, 1811–1816. [Google Scholar] [CrossRef]
  8. Safeeq, M.; Grant, G.E.; Lewis, S.L.; Tague, C.L. Coupling Snowpack and Groundwater Dynamics to Interpret Historical Streamflow Trends in the Western United States. Hydrol. Process. 2013, 27, 655–668. [Google Scholar] [CrossRef]
  9. Barnett, T.P.; Adam, J.C.; Lettenmaier, D.P. Potential Impacts of a Warming Climate on Water Availability in Snow-Dominated Regions. Nature 2005, 438, 303. [Google Scholar] [CrossRef]
  10. Harpold, A.A. Diverging Sensitivity of Soil Water Stress to Changing Snowmelt Timing in the Western US. Adv. Water Resour. 2016, 92, 116–129. [Google Scholar] [CrossRef] [Green Version]
  11. Westerling, A.; Hidalgo, H.; Cayan, D.; Swetnam, T. Warming and Earlier Spring Increase Western US Forest Wildfire Activity. Science 2006, 313, 940–943. [Google Scholar] [CrossRef] [PubMed] [Green Version]
  12. Littell, J.; McKenzie, D.; Peterson, D.; Westerling, A. Climate and Wildfire Area Burned in Western U. S. Ecoprovinces, 1916–2003. Ecol. Appl. 2009, 19, 1003–1021. [Google Scholar] [CrossRef] [PubMed]
  13. Jolly, W.M.; Cochrane, M.A.; Freeborn, P.H.; Holden, Z.A.; Brown, T.J.; Williamson, G.J.; Bowman, D.M. Climate-Induced Variations in Global Wildfire Danger from 1979 to 2013. Nat. Commun. 2015, 6, 7537. [Google Scholar] [CrossRef]
  14. Gleason, K.; Nolin, A.; Roth, T. Charred Forests Increase Snowmelt: Effects of Burned Woody Debris and Incoming Solar Radiation on Snow Ablation. Geophys. Res. Lett. 2013, 40, 4654–4661. [Google Scholar] [CrossRef]
  15. Gleason, K.; Nolin, A. Charred Forests Accelerate Snow Albedo Decay: Parameterizing the Post-Fire Radiative Forcing on Snow for Three Years Following Fire. Hydrol. Process. 2016, 30, 3855–3870. [Google Scholar] [CrossRef]
  16. Burles, K.; Boon, S. Snowmelt Energy Balance in a Burned Forest Plot, Crowsnest Pass, Alberta, Canada. Hydrol. Process. 2011, 25, 3012–3029. [Google Scholar] [CrossRef]
  17. Warren, S.G.; Wiscombe, W.J. A Model for the Spectral Albedo of Snow. II: Snow Containing Atmospheric Aerosols. J. Atmos. Sci. 1980, 37, 2734–2745. [Google Scholar] [CrossRef]
  18. Maxwell, J.D.; Call, A.; Clair, S.B.S. Wildfire and Topography Impacts on Snow Accumulation and Retention in Montane Forests. For. Ecol. Manag. 2019, 432, 256–263. [Google Scholar] [CrossRef]
  19. Gleason, K.E.; McConnell, J.R.; Arienzo, M.M.; Chellman, N.; Calvin, W.M. Four-Fold Increase in Solar Forcing on Snow in Western US Burned Forests since 1999. Nat. Commun. 2019, 10, 2026. [Google Scholar] [CrossRef]
  20. Wiscombe, W.J.; Warren, S.G. A Model for the Spectral Albedo of Snow. I: Pure Snow. J. Atmos. Sci. 1980, 37, 2712–2733. [Google Scholar] [CrossRef] [Green Version]
  21. Dozier, J.; Green, R.O.; Nolin, A.W.; Painter, T.H. Interpretation of Snow Properties from Imaging Spectrometry. Remote Sens. Environ. 2009, 113, S25–S37. [Google Scholar] [CrossRef]
  22. Grenfell, T.C.; Warren, S.G.; Mullen, P.C. Reflection of Solar Radiation by the Antarctic Snow Surface at Ultraviolet, Visible, and near-Infrared Wavelengths. J. Geophys. Res. Atmos. 1994, 99, 18669–18684. [Google Scholar] [CrossRef]
  23. Wang, Z.; Zeng, X. Evaluation of Snow Albedo in Land Models for Weather and Climate Studies. J. Appl. Meteorol. Climatol. 2010, 49, 363–380. [Google Scholar] [CrossRef]
  24. Flanner, M.G.; Zender, C.S. Linking Snowpack Microphysics and Albedo Evolution. J. Geophys. Res. Atmos. 2006, 111. [Google Scholar] [CrossRef] [Green Version]
  25. O’Neill, A.D.J.; Gray, D.M. Spatial and Temporal Variations of the Albedo of Prairie Snowpack. In The Role of Snow and Ice in Hydrology, Proceedings of the International Symposia on the Role of Snow and Ice in Hydrology, Banff, AB, Canada, 6–20 September 1972; WHO: Geneva, Switzerland; International Association of the Hydrological Sciences: Budapest, Hungary; Unesco: Paris, France, 1973. [Google Scholar]
  26. Amaral, T.O.; Wake, C.P.; Dibb, J.E.; Burakowski, E.; Stampone, M.L. A Simple Model for Predicting Snow Albedo Decay Using Observations from the Community Collaborative Rain, Hail, and Snow-Albedo (CoCoRAHS-Albedo) Network. J. Glaciol. 2017. [Google Scholar] [CrossRef] [Green Version]
  27. Painter, T.H.; Skiles, S.M.; Deems, J.S.; Bryant, A.C.; Landry, C.C. Dust Radiative Forcing in Snow of the Upper Colorado River Basin: 1. A 6 Year Record of Energy Balance, Radiation, and Dust Concentrations. Water Resour. Res. 2012, 48, W07521. [Google Scholar] [CrossRef] [Green Version]
  28. Painter, T.H.; Barrett, A.P.; Landry, C.C.; Neff, J.C.; Cassidy, M.P.; Lawrence, C.R.; McBride, K.E.; Farmer, G.L. Impact of Disturbed Desert Soils on Duration of Mountain Snow Cover. Geophys. Res. Lett. 2007, 34, L12502. [Google Scholar] [CrossRef] [Green Version]
  29. Singh, S.; Kulkarni, A.; Chaudhary, B. Hyperspectral Analysis of Snow Reflectance to Understand the Effects of Contamination and Grain Size. Ann. Glaciol. 2010, 51, 83–88. [Google Scholar] [CrossRef] [Green Version]
  30. Lyons, E.A.; Jin, Y.; Randerson, J.T. Changes in Surface Albedo after Fire in Boreal Forest Ecosystems of Interior Alaska Assessed Using MODIS Satellite Observations. J. Geophys. Res. Biogeosci. 2008, 113, G02012. [Google Scholar] [CrossRef] [Green Version]
  31. Randerson, J.T.; Liu, H.; Flanner, M.G.; Chambers, S.D.; Jin, Y.; Hess, P.G.; Pfister, G.; Mack, M.C.; Treseder, K.K.; Welp, L.R.; et al. The Impact of Boreal Forest Fire on Climate Warming. Science 2006, 314, 1130–1132. [Google Scholar] [CrossRef] [Green Version]
  32. Burakowski, E.A.; Ollinger, S.V.; Lepine, L.; Schaaf, C.B.; Wang, Z.; Dibb, J.E.; Hollinger, D.Y.; Kim, J.; Erb, A.; Martin, M. Spatial Scaling of Reflectance and Surface Albedo over a Mixed-Use, Temperate Forest Landscape during Snow-Covered Periods. Remote Sens. Environ. 2015, 158, 465–477. [Google Scholar] [CrossRef]
  33. Brown, R.D.; Robinson, D.A. Northern Hemisphere Spring Snow Cover Variability and Change over 1922–2010 Including an Assessment of Uncertainty. Cryosphere 2011, 5, 219–229. [Google Scholar] [CrossRef] [Green Version]
  34. Bala, G.; Caldeira, K.; Wickett, M.; Phillips, T.; Lobell, D.; Delire, C.; Mirin, A. Combined Climate and Carbon-Cycle Effects of Large-Scale Deforestation. Proc. Natl. Acad. Sci. USA 2007, 104, 6550–6555. [Google Scholar] [CrossRef] [PubMed] [Green Version]
  35. Bonan, G.B. Forests and Climate Change: Forcings, Feedbacks, and the Climate Benefits of Forests. Science 2008, 320, 1444–1449. [Google Scholar] [CrossRef] [Green Version]
  36. Jin, Y.; Randerson, J.T.; Goulden, M.L.; Goetz, S.J. Post-Fire Changes in Net Shortwave Radiation along a Latitudinal Gradient in Boreal North America. Geophys. Res. Lett. 2012, 39, L13403. [Google Scholar] [CrossRef] [Green Version]
  37. Bair, E.H.; Rittger, K.; Skiles, S.M.; Dozier, J. An Examination of Snow Albedo Estimates from MODIS and Their Impact on Snow Water Equivalent Reconstruction. Water Resour. Res. 2019, 55, 7826–7842. [Google Scholar] [CrossRef]
  38. Ueyama, M.; Ichii, K.; Iwata, H.; Euskirchen, E.S.; Zona, D.; Rocha, A.V.; Harazono, Y.; Iwama, C.; Nakai, T.; Oechel, W.C. Change in Surface Energy Balance in Alaska Due to Fire and Spring Warming, Based on Upscaling Eddy Covariance Measurements. J. Geophys. Res. Biogeosci. 2014, 119, 1947–1969. [Google Scholar] [CrossRef]
  39. Webster, C.; Jonas, T. Influence of Canopy Shading and Snow Coverage on Effective Albedo in a Snow-Dominated Evergreen Needleleaf Forest. Remote Sens. Environ. 2018, 214, 48–58. [Google Scholar] [CrossRef]
  40. Youngblood, A.; Grace, J.B.; McIver, J.D. Delayed Conifer Mortality after Fuel Reduction Treatments: Interactive Effects of Fuel, Fire Intensity, and Bark Beetles. Ecol. Appl. 2009, 19, 321–337. [Google Scholar] [CrossRef] [Green Version]
  41. Fettig, C.J.; McKelvey, S.R.; Cluck, D.R.; Smith, S.L.; Otrosina, W.J. Effects of Prescribed Fire and Season of Burn on Direct and Indirect Levels of Tree Mortality in Ponderosa and Jeffrey Pine Forests in California, USA. For. Ecol. Manag. 2010, 260, 207–218. [Google Scholar] [CrossRef]
  42. Das, A.; Battles, J.; Stephenson, N.L.; van Mantgem, P.J. The Contribution of Competition to Tree Mortality in Old-Growth Coniferous Forests. For. Ecol. Manag. 2011, 261, 1203–1213. [Google Scholar] [CrossRef]
  43. Eidenshink, J.; Schwind, B.; Brewer, K.; Zhu, Z.; Quayle, B.; Howard, S. A Project for Monitoring Trends in Burn Severity. Fire Ecol. 2007, 3, 3–21. [Google Scholar] [CrossRef]
  44. Davis, K.T.; Dobrowski, S.Z.; Higuera, P.E.; Holden, Z.A.; Veblen, T.T.; Rother, M.T.; Parks, S.A.; Sala, A.; Maneta, M.P. Wildfires and Climate Change Push Low-Elevation Forests across a Critical Climate Threshold for Tree Regeneration. Proc. Natl. Acad. Sci. USA 2019, 116, 6193–6198. [Google Scholar] [CrossRef] [Green Version]
  45. Jin, Y.; Randerson, J.T.; Goetz, S.J.; Beck, P.S.; Loranty, M.M.; Goulden, M.L. The Influence of Burn Severity on Postfire Vegetation Recovery and Albedo Change during Early Succession in North American Boreal Forests. J. Geophys. Res. Biogeosci. 2012, 117, G01036. [Google Scholar] [CrossRef]
  46. Coppoletta, M.; Merriam, K.E.; Collins, B.M. Post-Fire Vegetation and Fuel Development Influences Fire Severity Patterns in Reburns. Ecol. Appl. 2016, 26, 686–699. [Google Scholar] [CrossRef]
  47. Smoot, E.E.; Gleason, K.E. Forest Fires Reduce Snow-Water Storage and Advance the Timing of Snowmelt across the Western US. Water 2021, 13, 3533. [Google Scholar] [CrossRef]
  48. Hood, S.M.; Varner, J.M.; Van Mantgem, P.; Cansler, C.A. Fire and Tree Death: Understanding and Improving Modeling of Fire-Induced Tree Mortality. Environ. Res. Lett. 2018, 13, 113004. [Google Scholar] [CrossRef]
  49. Nolin, A.; Daly, C. Mapping “at Risk” Snow in the Pacific Northwest. J. Hydrometeorol. 2006, 7, 1164–1171. [Google Scholar] [CrossRef]
  50. Barnett, T.P.; Pierce, D.W.; Hidalgo, H.G.; Bonfils, C.; Santer, B.D.; Das, T.; Bala, G.; Wood, A.W.; Nozawa, T.; Mirin, A.A. Human-Induced Changes in the Hydrology of the Western United States. Science 2008, 319, 1080–1083. [Google Scholar] [CrossRef] [Green Version]
  51. Westerling, A.; Bryant, B.; Preisler, H.; Holmes, T.; Hidalgo, H.; Das, T.; Shrestha, S. Climate Change and Growth Scenarios for California Wildfire. Clim. Chang. 2011, 109, 445–463. [Google Scholar] [CrossRef]
  52. Serreze, M.; Clark, M.; Armstrong, R.; McGinnis, D.; Pulwarty, R. Characteristics of the Western United States Snowpack from Snowpack Telemetry (SNOTEL) Data. Water Resour. Res. 1999, 35, 2145–2160. [Google Scholar] [CrossRef] [Green Version]
  53. Hall, D.; Riggs, G.; Salomonson, V. MODIS/Terra Snow Cover Daily L3 Global 500 m Grid, Version 6; NASA National Snow and Ice Data Center Distributed Active Archive Center: Boulder, CO, USA, 2016. [Google Scholar]
  54. Keevallik, S.; Tooming, H. Relationships between Surface Albedo and Spring Heat Accumulation. Tellus A 1996, 48, 727–732. [Google Scholar] [CrossRef] [Green Version]
  55. Wang, K.; Zhang, L.; Qiu, Y.; Ji, L.; Tian, F.; Wang, C.; Wang, Z. Snow Effects on Alpine Vegetation in the Qinghai-Tibetan Plateau. Int. J. Digit. Earth 2015, 8, 58–75. [Google Scholar] [CrossRef]
  56. Klein, A.G.; Stroeve, J. Development and Validation of a Snow Albedo Algorithm for the MODIS Instrument. Ann. Glaciol. 2002, 34, 45–52. [Google Scholar] [CrossRef] [Green Version]
  57. DiMiceli, C.; Townshend, J.; Carroll, M.; Sohlberg, R. Evolution of the Representation of Global Vegetation by Vegetation Continuous Fields. Remote Sens. Environ. 2021, 254, 112271. [Google Scholar] [CrossRef]
  58. Homer, C.; Dewitz, J.; Yang, L.; Jin, S.; Danielson, P.; Xian, G.; Coulston, J.; Herold, N.; Wickham, J.; Megown, K. Completion of the 2011 National Land Cover Database for the Conterminous United States–Representing a Decade of Land Cover Change Information. Photogramm. Eng. Remote Sens. 2015, 81, 345–354. [Google Scholar]
  59. Klein, A.G.; Barnett, A.C. Validation of Daily MODIS Snow Cover Maps of the Upper Rio Grande River Basin for the 2000–2001 Snow Year. Remote Sens. Environ. 2003, 86, 162–176. [Google Scholar] [CrossRef]
  60. Liang, X.-Z.; Kunkel, K.E.; Meehl, G.A.; Jones, R.G.; Wang, J.X. Regional Climate Models Downscaling Analysis of General Circulation Models Present Climate Biases Propagation into Future Change Projections. Geophys. Res. Lett. 2008, 35, L08709. [Google Scholar] [CrossRef] [Green Version]
  61. Chen, J.; Brissette, F.P.; Zhang, X.J.; Chen, H.; Guo, S.; Zhao, Y. Bias Correcting Climate Model Multi-Member Ensembles to Assess Climate Change Impacts on Hydrology. Clim. Chang. 2019, 153, 361–377. [Google Scholar] [CrossRef]
  62. R Development Core Team. R: A Language and Environment for Statistical Computing; R Foundation for Statistical Computing: Vienna, Austria, 2016. [Google Scholar]
  63. ESRI ArcGIS Desktop: Release 10.4. 2015.
  64. Bond-Lamberty, B.; Gower, S.T. Decomposition and Fragmentation of Coarse Woody Debris: Re-Visiting a Boreal Black Spruce Chronosequence. Ecosystems 2008, 11, 831–840. [Google Scholar] [CrossRef]
  65. Kemp, K.B.; Higuera, P.E.; Morgan, P.; Abatzoglou, J.T. Climate Will Increasingly Determine Post-Fire Tree Regeneration Success in Low-Elevation Forests, Northern Rockies, USA. Ecosphere 2019, 10, e02568. [Google Scholar] [CrossRef]
  66. Coops, N.C.; Shang, C.; Wulder, M.A.; White, J.C.; Hermosilla, T. Change in Forest Condition: Characterizing Non-Stand Replacing Disturbances Using Time Series Satellite Imagery. For. Ecol. Manag. 2020, 474, 118370. [Google Scholar] [CrossRef]
  67. Wang, Z.; Erb, A.M.; Schaaf, C.B.; Sun, Q.; Liu, Y.; Yang, Y.; Shuai, Y.; Casey, K.A.; Román, M.O. Early Spring Post-Fire Snow Albedo Dynamics in High Latitude Boreal Forests Using Landsat-8 OLI Data. Remote Sens. Environ. 2016, 185, 71–83. [Google Scholar] [CrossRef] [Green Version]
  68. Kitzberger, T.; Falk, D.A.; Westerling, A.L.; Swetnam, T.W. Direct and Indirect Climate Controls Predict Heterogeneous Early-Mid 21st Century Wildfire Burned Area across Western and Boreal North America. PLoS ONE 2017, 12, e0188486. [Google Scholar]
  69. Abatzoglou, J.T.; Williams, A.P.; Barbero, R. Global Emergence of Anthropogenic Climate Change in Fire Weather Indices. Geophys. Res. Lett. 2019, 46, 326–336. [Google Scholar] [CrossRef] [Green Version]
Figure 1. Conceptual model of pre- and post-fire landscape snow albedo relative to burn severity. Conceptual results of forest fire effects on snow albedo for each burn severity classification, including pre-fire conditions, immediate post-fire increase, and overall post-fire snow albedo change over time (recovery).
Remotesensing 14 04079 g001
Figure 2. Post-fire landscape snow albedo recovery was evaluated across a chronosequence of eight burned forests in the Triple Divide region of western Wyoming, the headwaters of the Columbia, Colorado, and Missouri River Basins.
Remotesensing 14 04079 g002
Figure 3. Pre- vs. post-fire winter and spring landscape snow albedo. (a) Winter and (b) spring pre-fire and post-fire non-normalized landscape snow albedo separated by high burn (black), moderate burn (gray), unburned forest (green), open area (blue), buffer unburned forest (light green) and buffer open area (light blue). The large squares and circles represent the pre-fire and post-fire winter and spring mean landscape snow albedo, respectively.
Remotesensing 14 04079 g003
Figure 4. (a) Post-fire snow albedo change normalized to the buffer area. Normalized landscape snow albedo results in post-fire snow albedo change in the four stages of recovery. High burn (black), moderate burn (gray), and unburned forest (green) were normalized according to the buffer forest area. The open area (blue) was normalized according to the buffer open area. (b) Spline regression relative to burn severity. Linear spline regression representation with (0) pre-fire averages (triangles), (1) immediate brightening (0–1 years post-fire), (2) initial stage of tree mortality (1–6 years post-fire), (3) intermediate recovery (6–10 years), (4) long term recovery (10+ years) relative to high burn (black), moderate burn (gray), unburned forest (green), open area (blue) land classifications.
Remotesensing 14 04079 g004
Figure 5. Tukey plot of post-fire LSA decay over post-fire recovery stages (0–6 years, 6–10 years, 11+ years-since-fire) shows significance in pairwise differences between burn severity classifications in the burned regions. A vertical dashed line in each plot indicates the area in which differences overlapping it are not significant, and those differences not overlapping the line are significant (p-value < 0.05).
Remotesensing 14 04079 g005
Figure 6. Pre- and post-fire landscape snow albedo decay during accumulation and ablation derived from MODIS data over days since snowfall > 5 cm derived from the average snowfall of all SNOTEL sites within the study domain. Box plots show the distribution of snow albedo pixels within burned forests for each 4-day period following a fresh snowfall.
Remotesensing 14 04079 g006
Table 1. Characteristics of eight forest fire sites used in this study.
Fire NameIgnition DateBurned Area (km2)Elevation (m)Major River SystemAverage Burn Severity
Boulder31 July 200015.22240ColumbiaModerate
Green Knoll22 July 200115.32144ColumbiaModerate
Purdy4 August 200672.22804Columbia /MissouriModerate
Bull23 July 201022.22164ColumbiaModerate
Horsethief Canyon8 September 201211.32286ColumbiaLow
Lava Mountain11 July 201659.32432MissouriModerate
Cliff Creek17 July 2016146.22225ColumbiaModerate
Roosevelt15 September 2018248.92438Columbia/ColoradoModerate
Table 2. Pre-fire and post-fire LSA statistics for all eight separate fires, including Pre-fire count (n) of MODIS cells used in the analysis, pre-fire mean LSA, pre-fire standard deviation (sd) of LSA, post-fire count (n) of MODIS cells used in the analysis, post-fire mean LSA, post-fire standard deviation (sd) of LSA, the mean difference, and post-fire total percent increase for each fire. The sample size was determined by the number of cloudless (50% or less) MODIS scenes available since 2000 relative to the year the fire occurred. The significance reported with the mean difference was calculated using Welch’s two-sample t-test, *** = p-value < 0.001.
Forest Fire Name
(Year Burned)
Pre-Fire Count
(n)
Pre-Fire MeanPre-Fire
sd
Post-Fire Count
(n)
Post-Fire MeanPost-Fire
sd
Mean
Difference
Percent
Increase
Boulder (2000)9936.839.21459454.516.1417.67 ***39%
Green Knoll (2001)34130.949.39374244.2813.1813.34 ***35%
Purdy (2006)162933.249.72298643.9610.8510.72 ***28%
Bull (2010)249837.6411.99188145.7112.528.07 ***19%
Horsethief Canyon (2012)277941.8212.67140545.4912.953.67 ***8.40%
Lava Mountain (2016)394931.859.6969845.1610.0613.31 ***35%
Cliff Creek (2016)414140.8412.8361047.9212.397.08 ***16%
Roosevelt (2018)474043.1613.8625750.3312.747.17 ***15%
Table 3. Post-fire comparisons of percent LSA increase relative to burn severity classification, and pre- vs. post-fire comparisons of percent LSA increase relative to burn severity. Results from the daily normalized LSA Tukey Honestly Significant Difference test based on the piecewise comparisons of burn severity classification in post-fire comparisons and pre- vs. post-fire comparisons. *** = p-value < 0.001.
Pre- vs. Post-Fire ComparisonsPercent
Increase
Post-Fire Comparisons within Burn Perimeter Percent
Increase
high44% ***open-unburned8.7% ***
moderate36% ***open-high8.4% ***
unburned32% ***open-moderate8.1% ***
open22% ***unburned-high0.3%
moderate-high0.4%
unburned-moderate0.7%
Publisher’s Note: MDPI stays neutral with regard to jurisdictional claims in published maps and institutional affiliations.

