
Projection of Future Extreme Precipitation in China Based on the CMIP6 from a Machine Learning Perspective

 ,
,  ,
,  ,
,  ,
,
Abstract
:1. Introduction
2. Datasets and Methodology
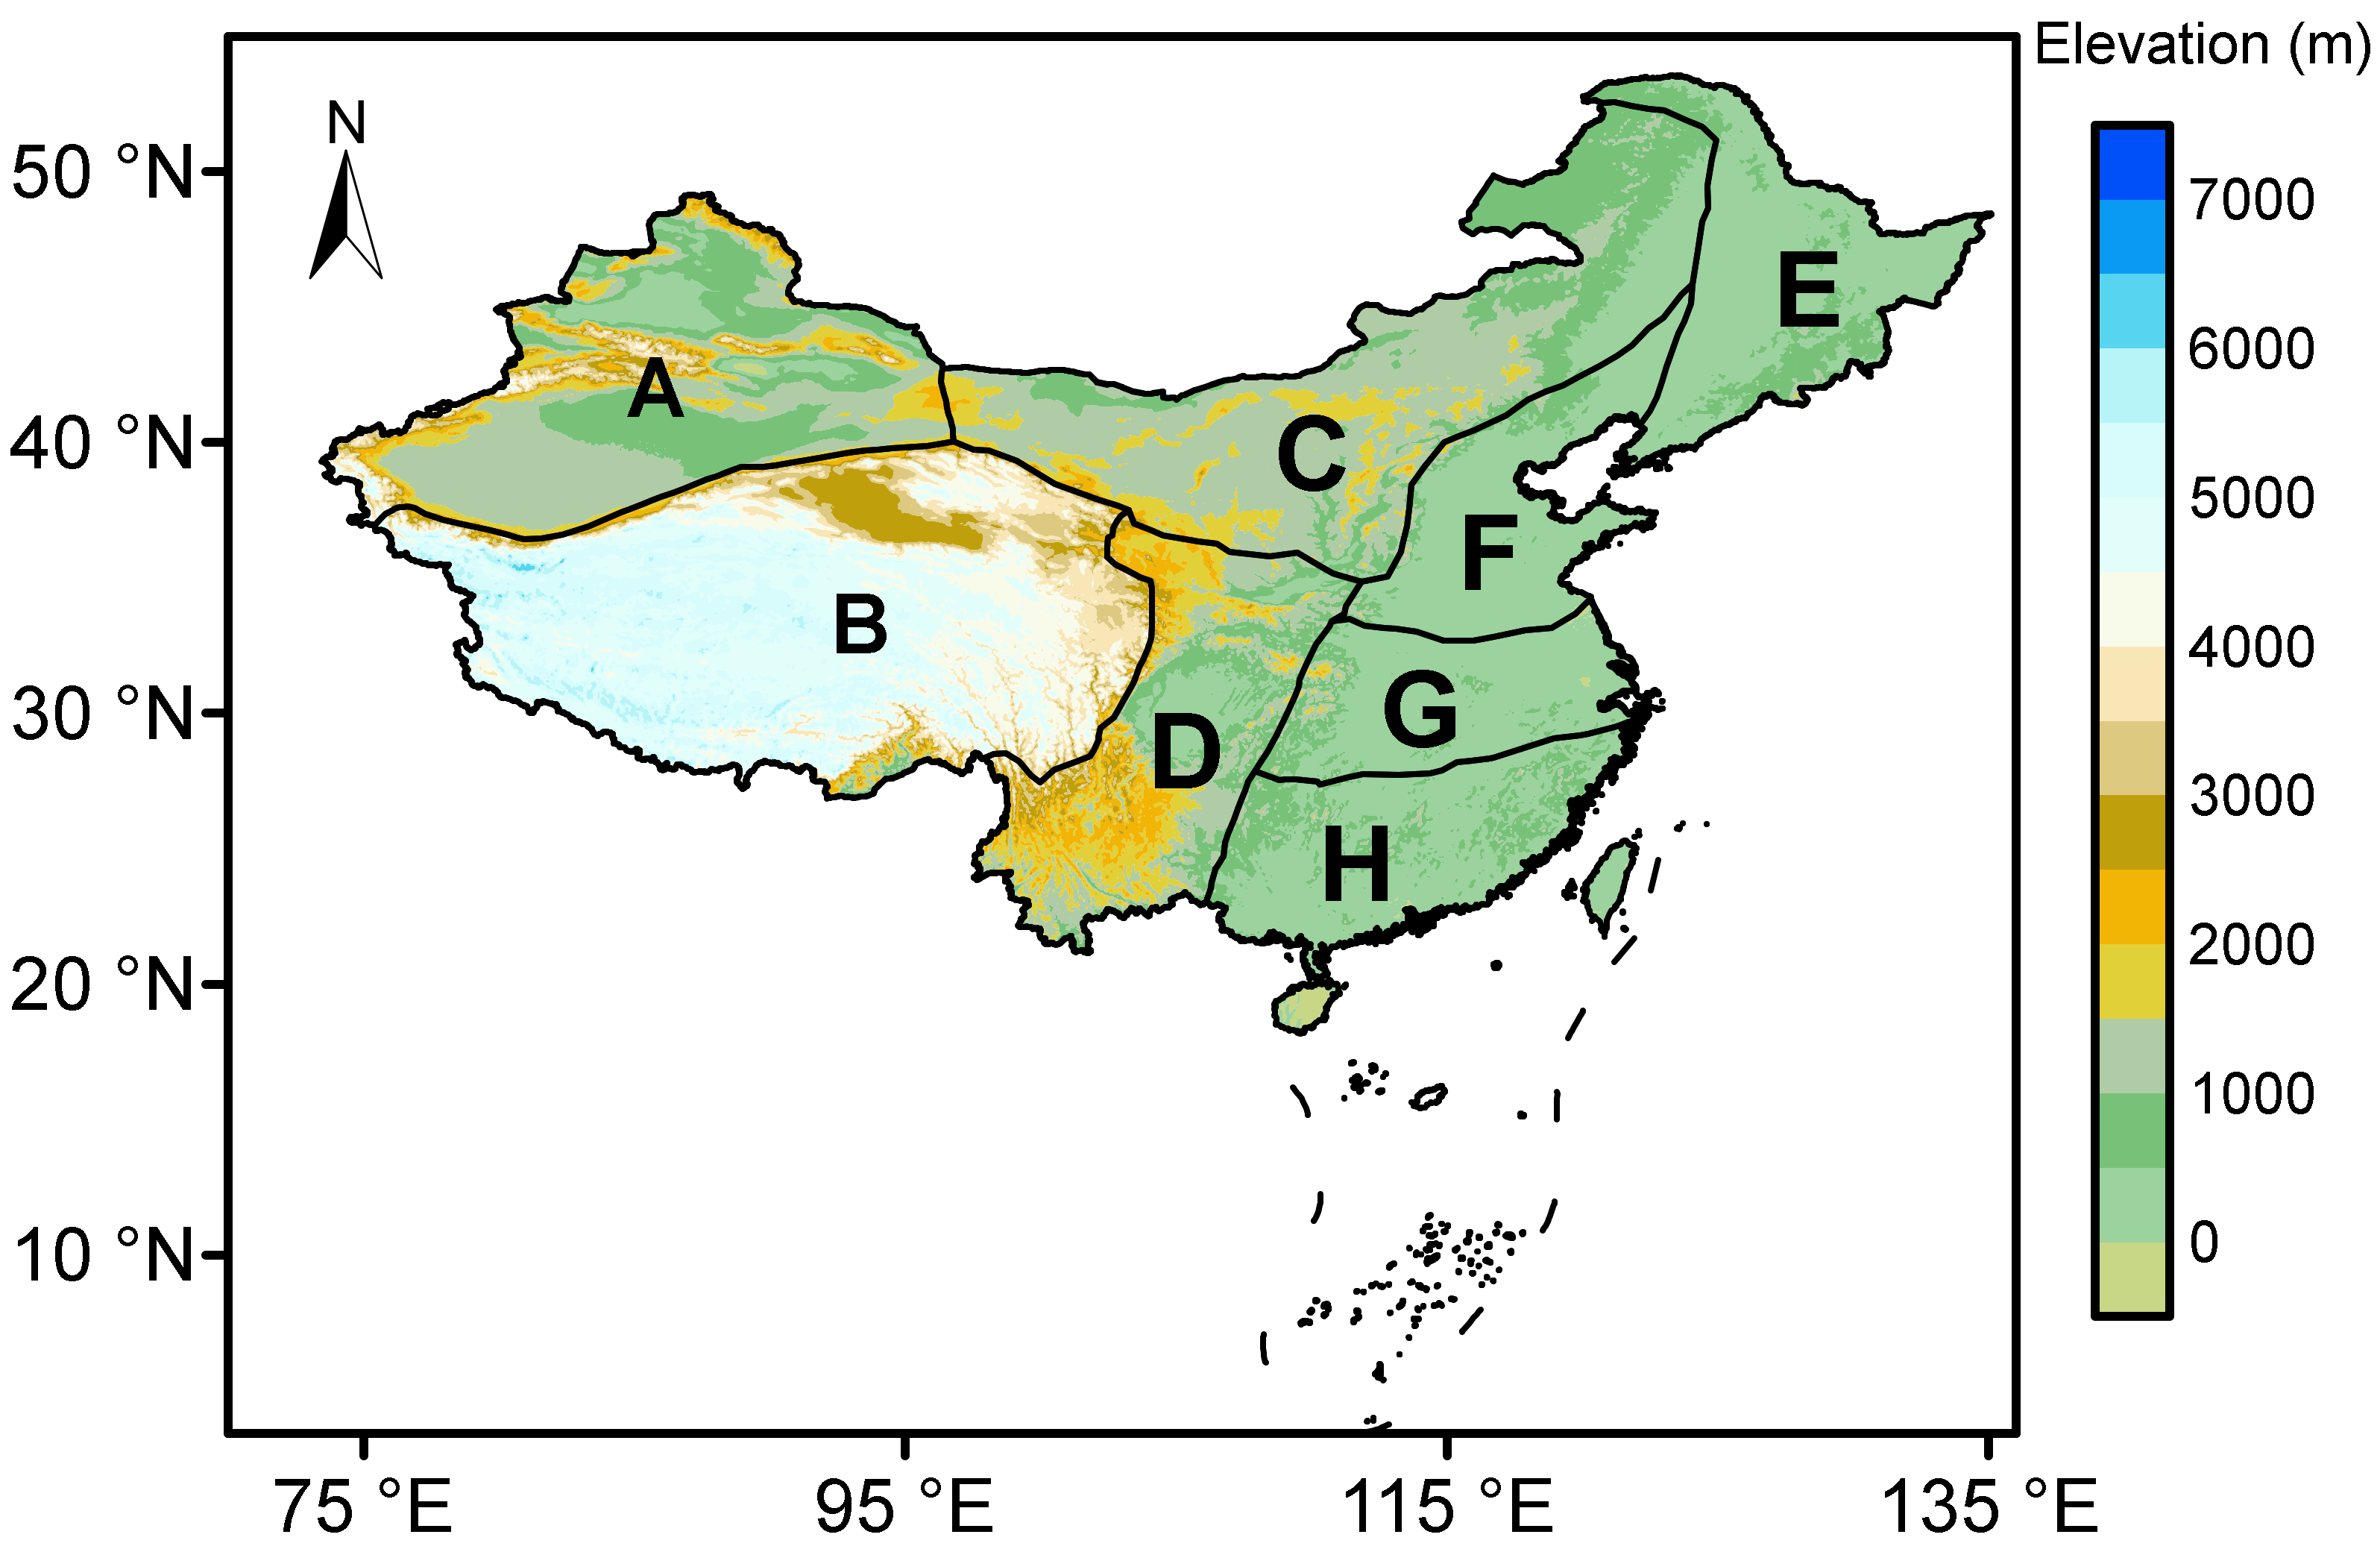
2.1. Study Area
2.2. Data
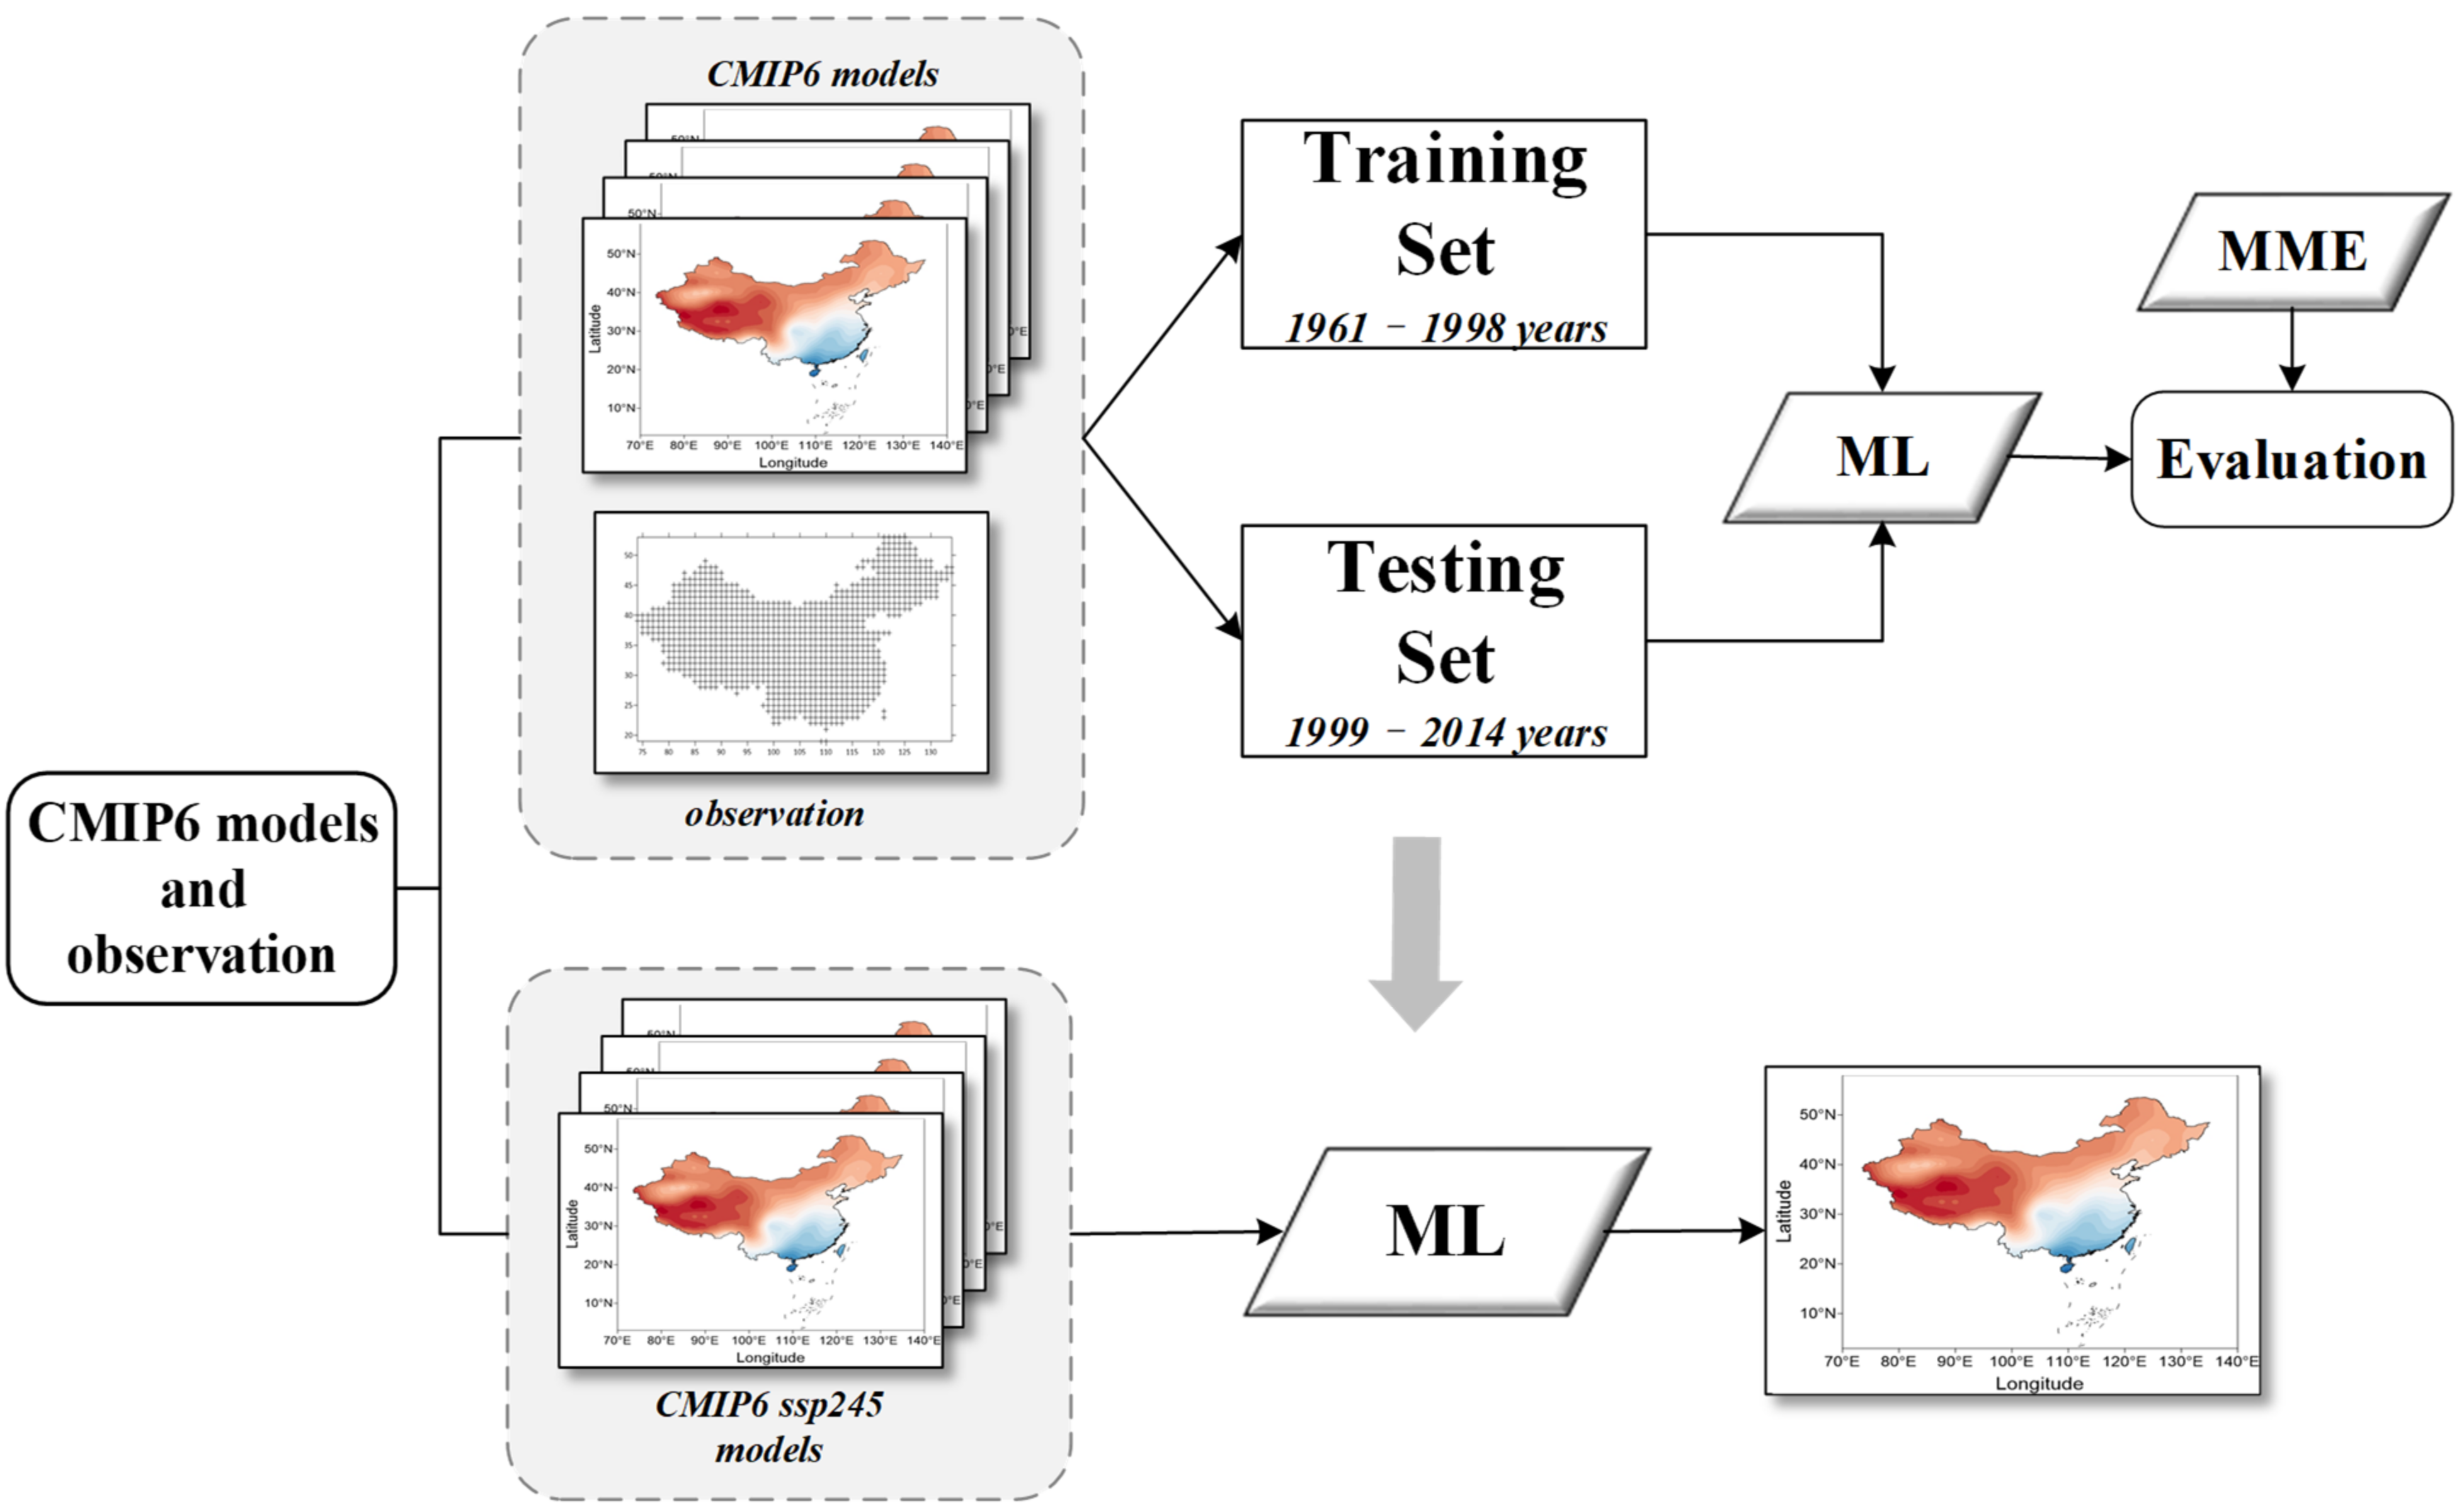
2.3. Methods
2.3.1. Climate Indices
2.3.2. Artificial Neural Networks
2.3.3. Multi-Model Integrated
2.3.4. Evaluation Method
3. Results and Discussion
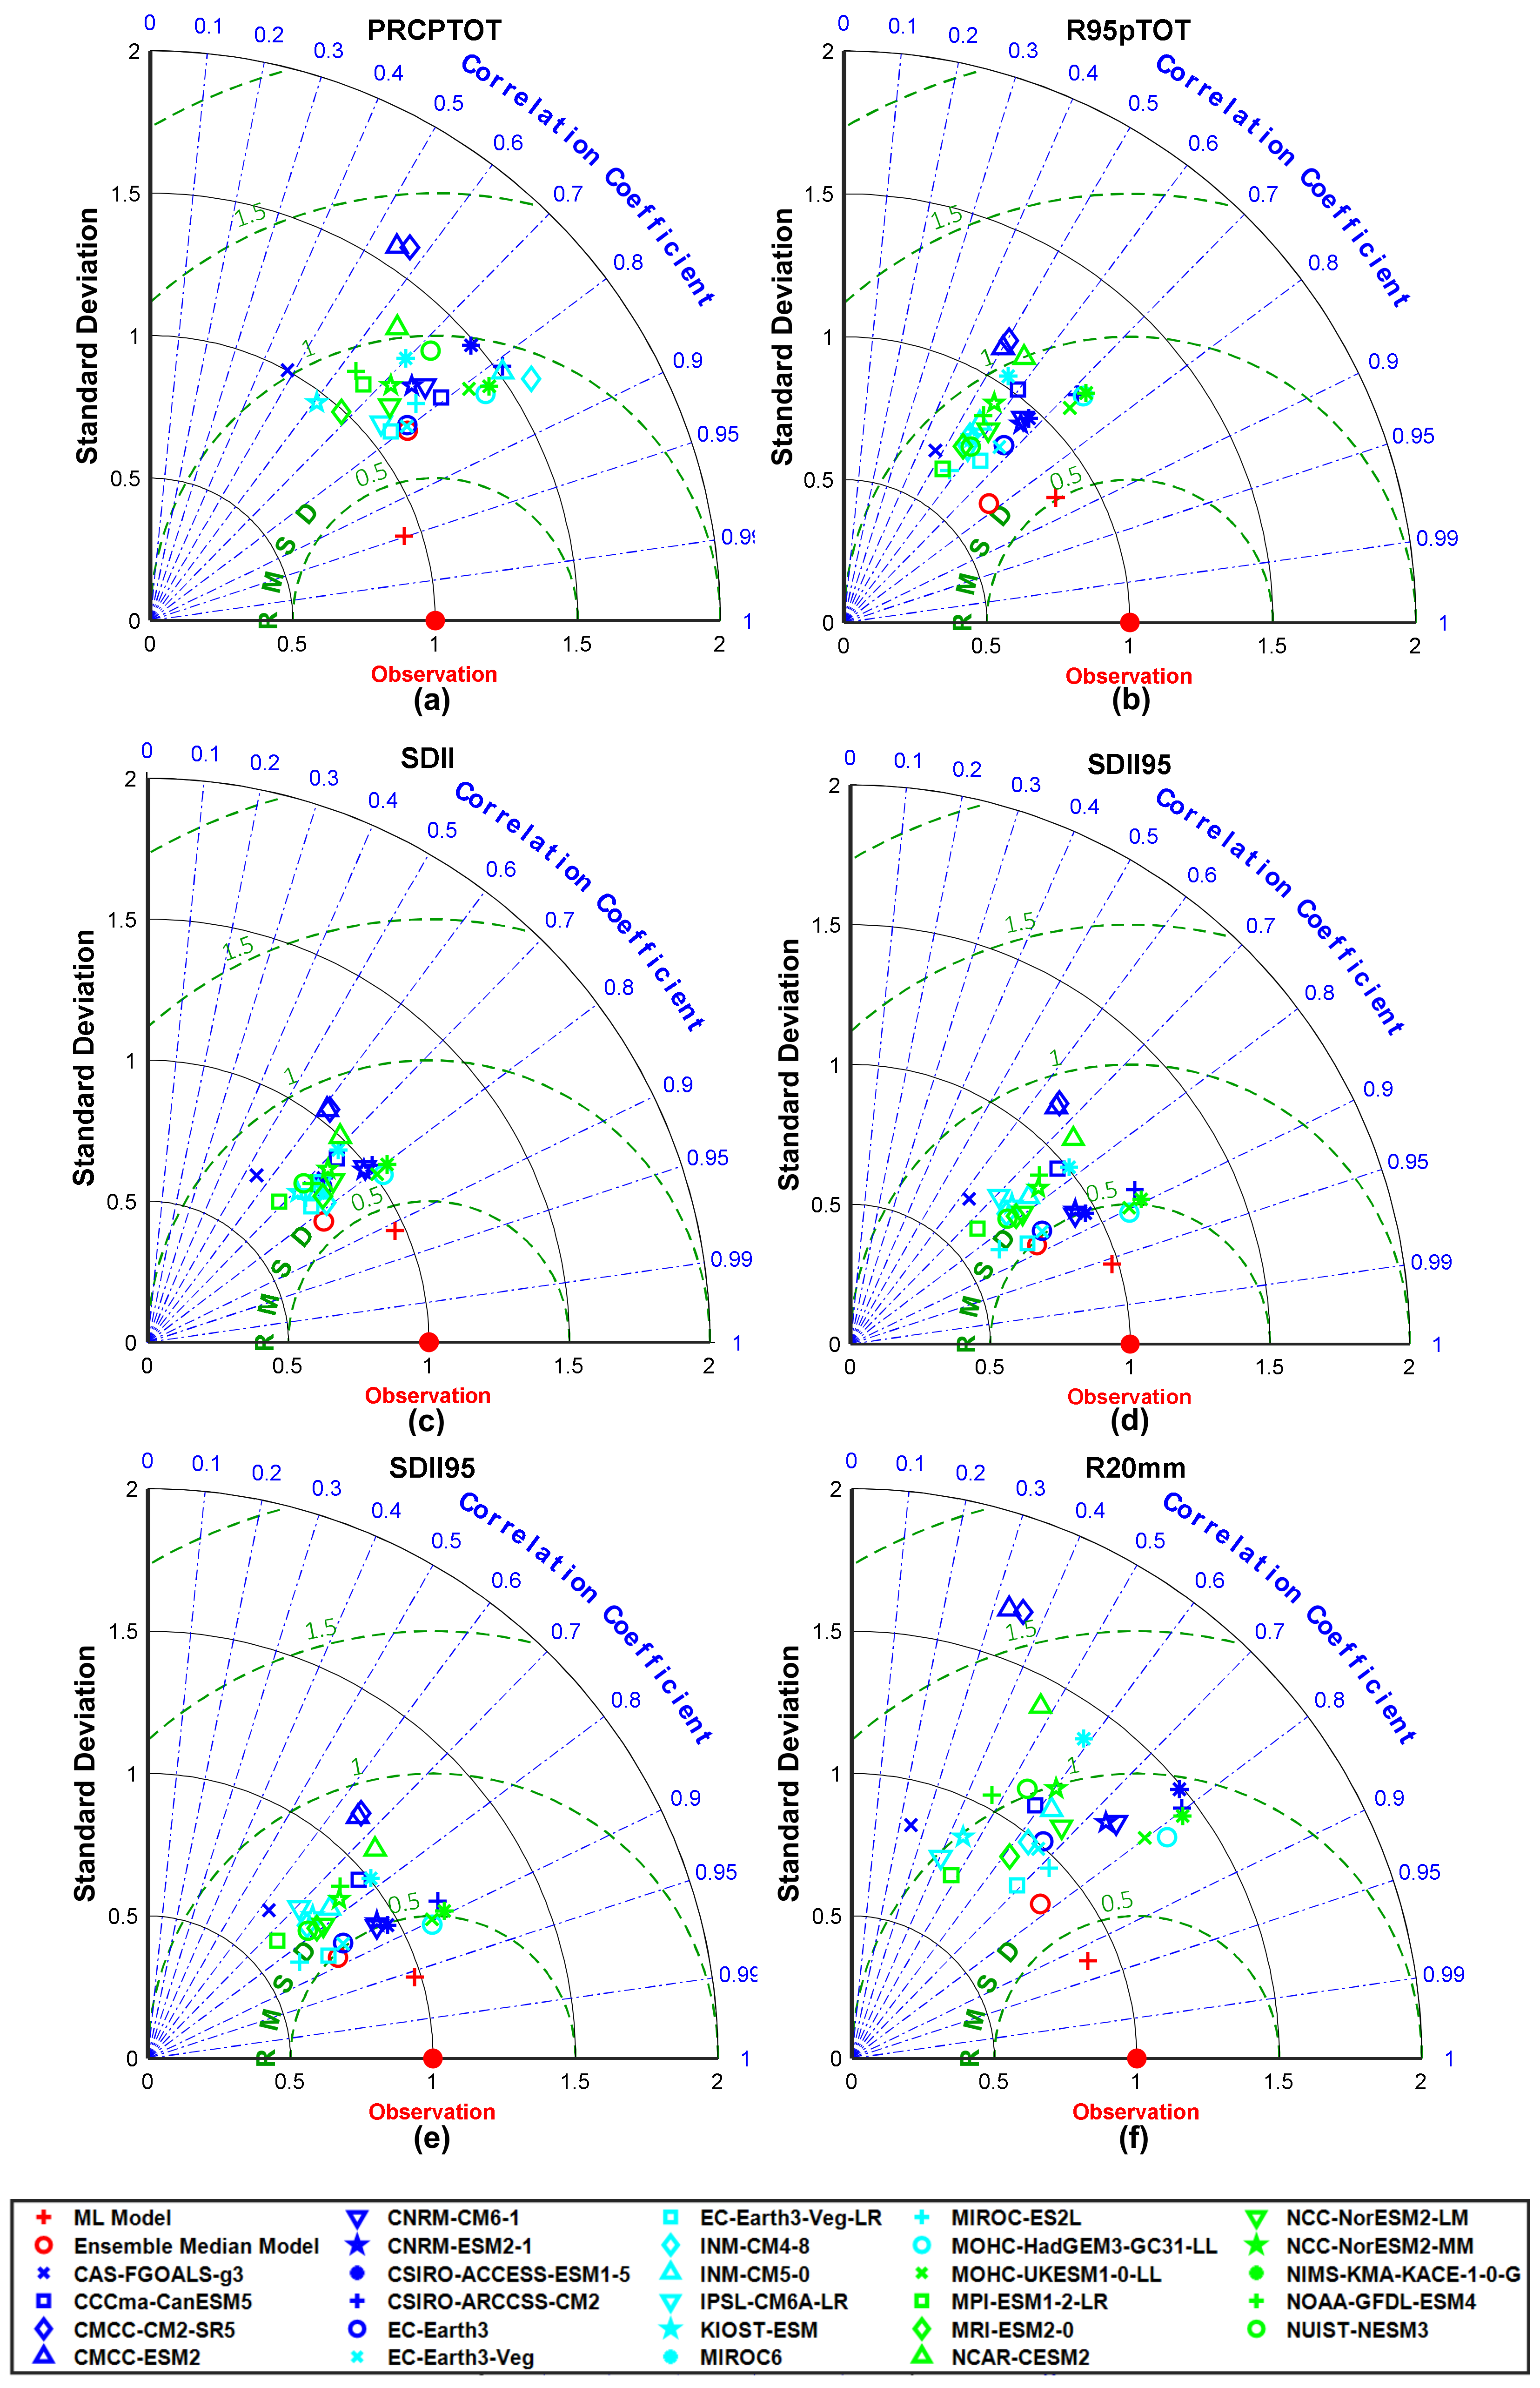
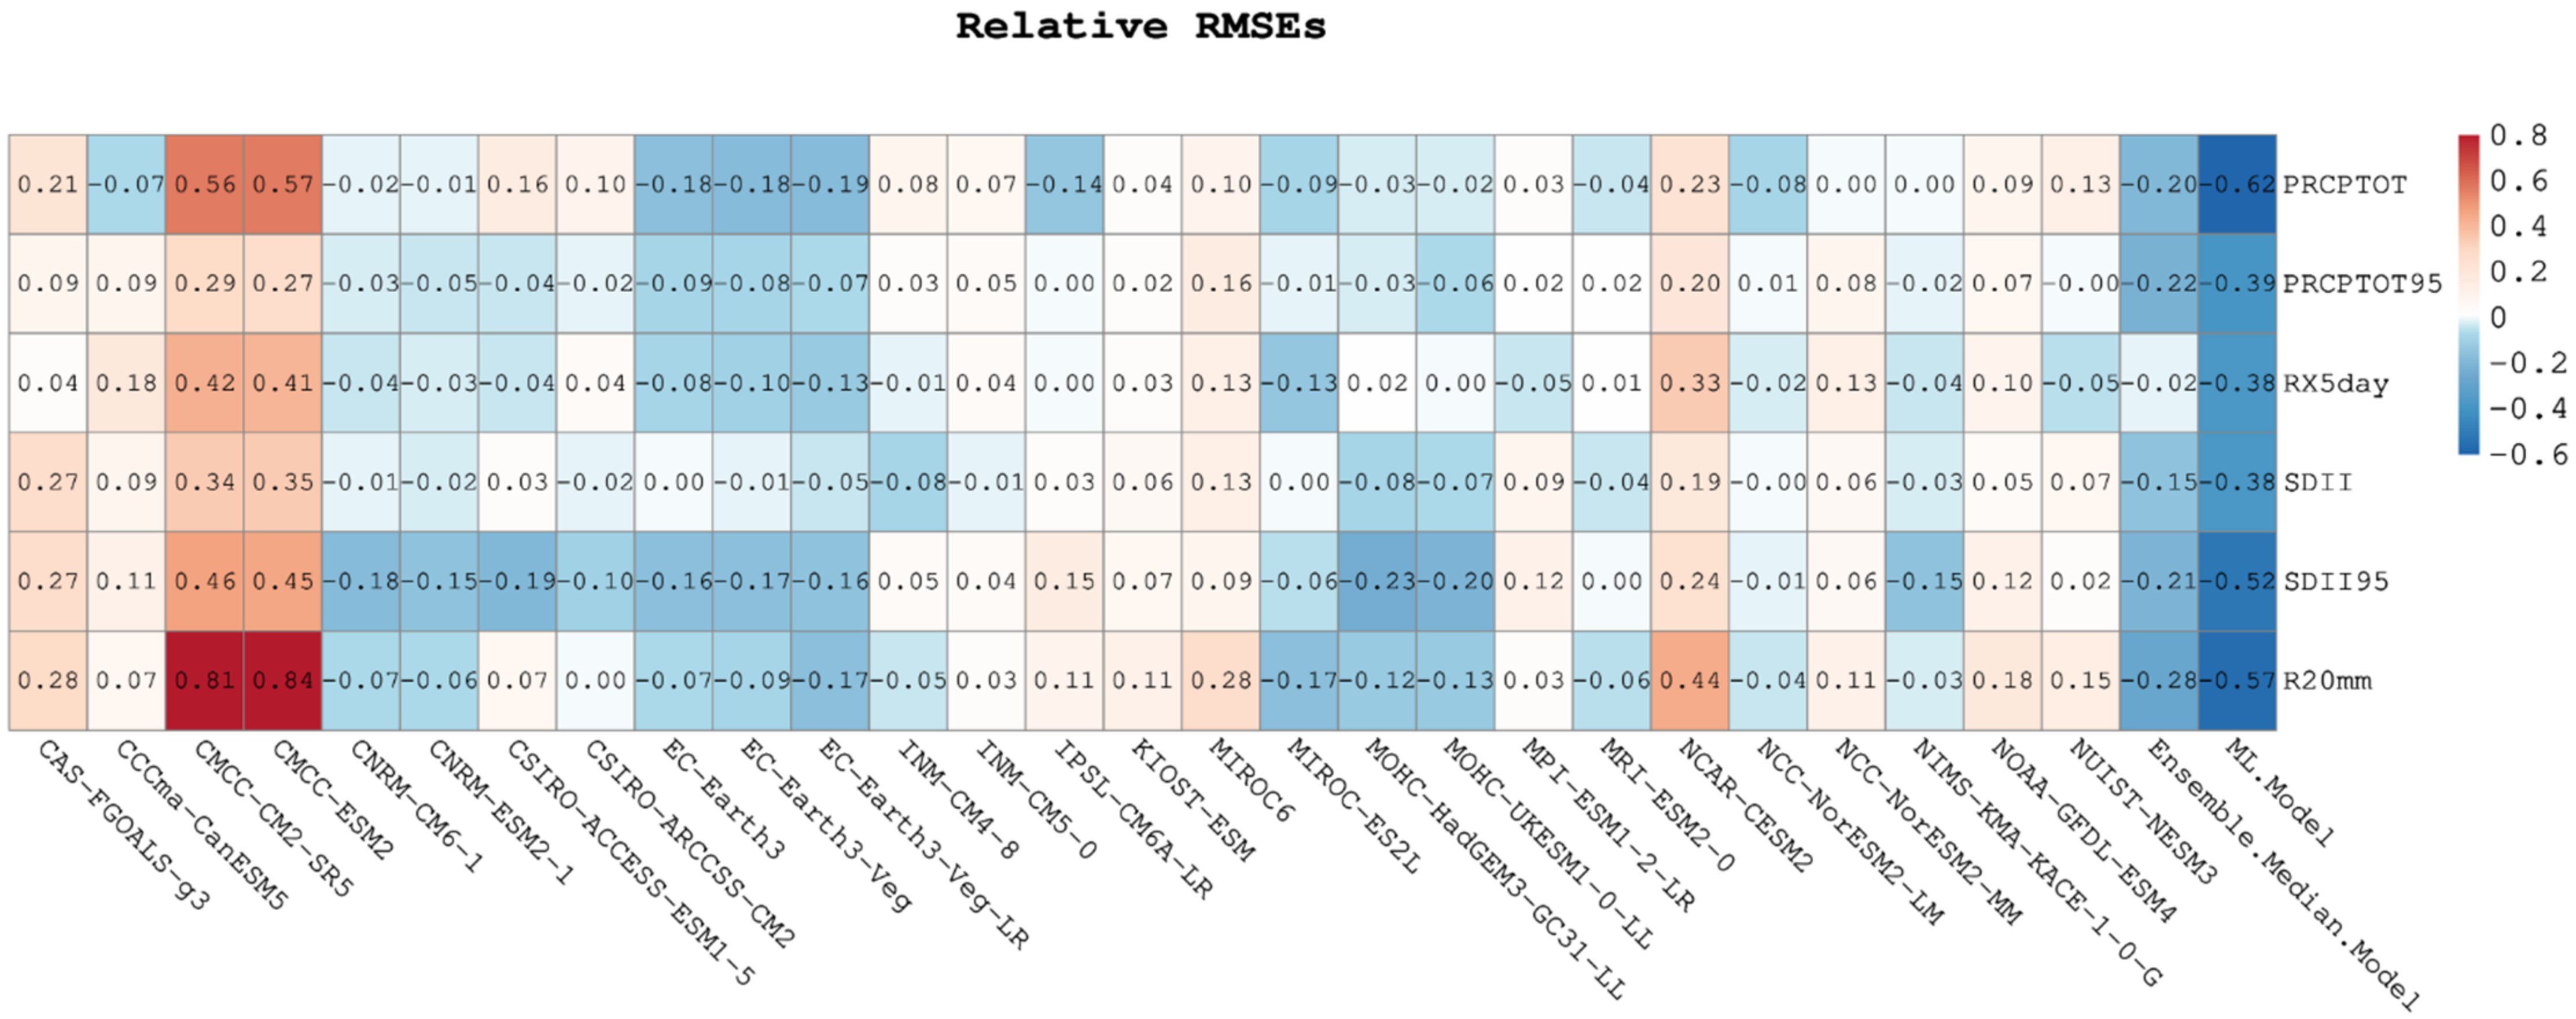
3.1. Evaluations
3.2. Projected Changes
3.2.1. Future Changes in Spatial Distribution and Boxplot
3.2.2. Future Trend Distribution
3.2.3. Future Interannual Variation
4. Discussion
5. Conclusions
- (a)
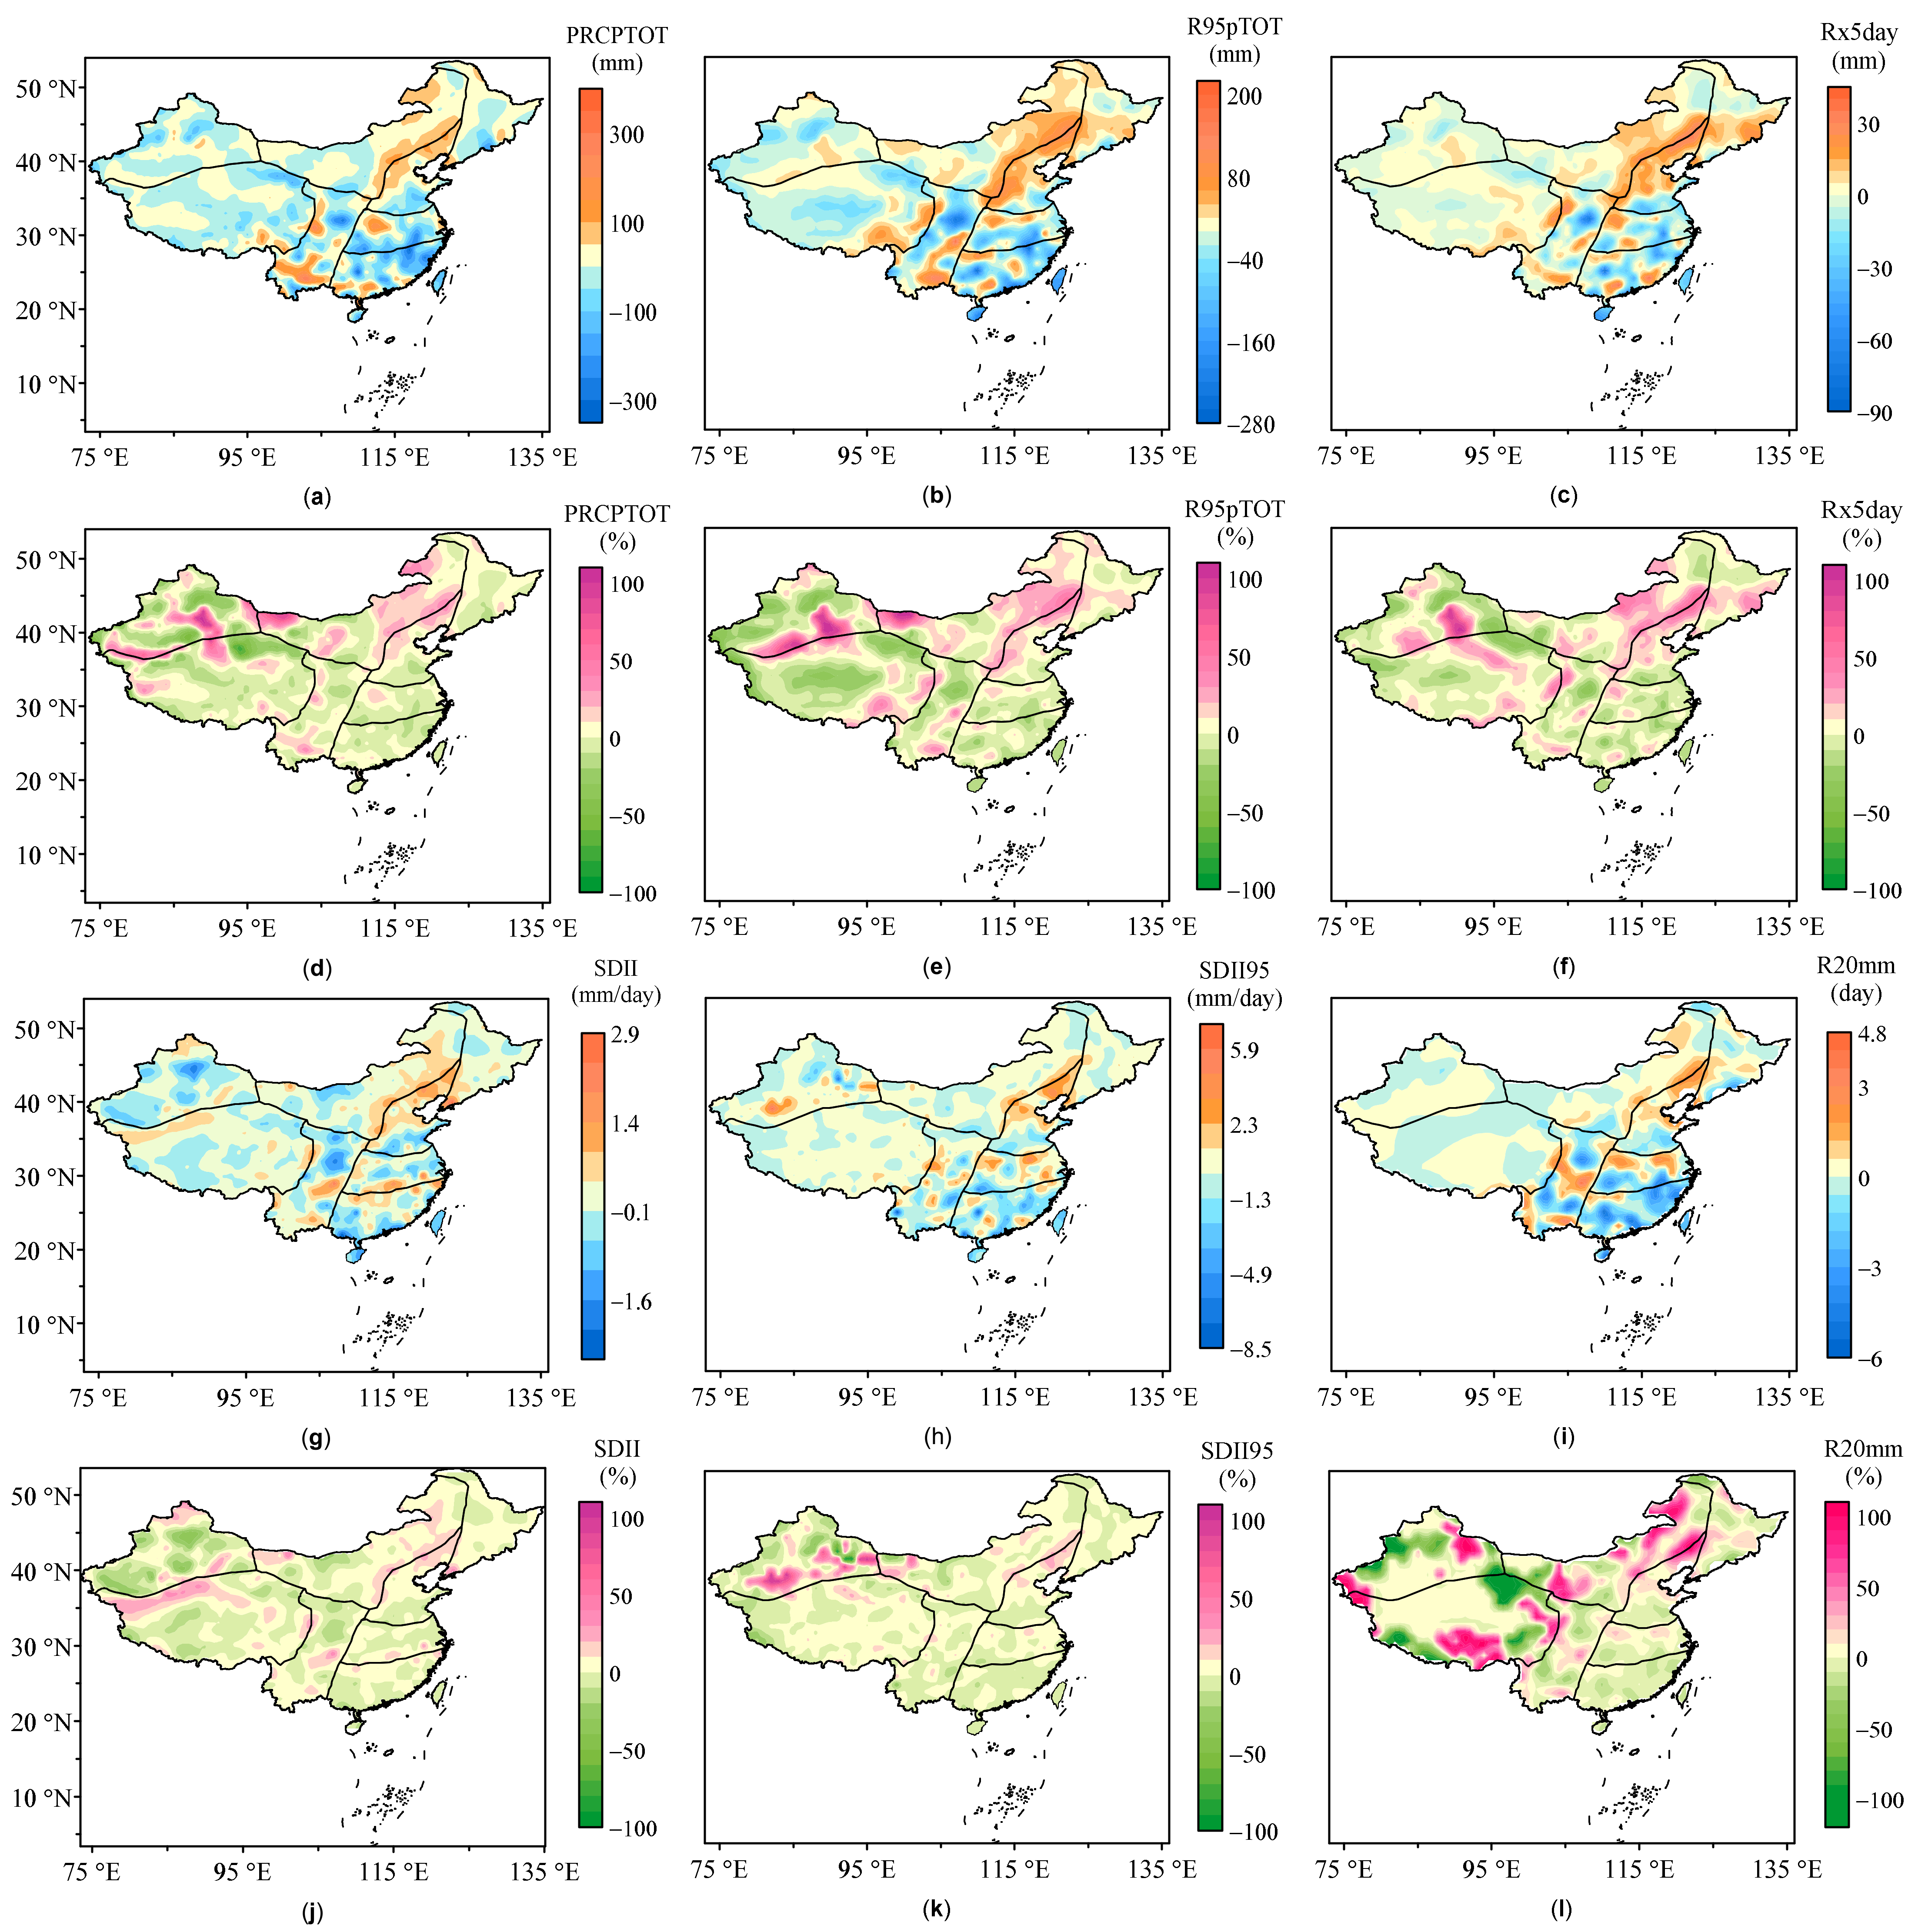
- In the validation assessment period (1999–2014), the ML integration treatment performed well, and the correlation coefficients of all the indices improved from the multi-model ensemble median to above 0.9 in general, with some reaching 0.95. In general, all the ML-treated indices improved the accuracy of the spatial pattern of precipitation in most regions of China. The improvement was more significant in areas with complex topography, such as around the Qinghai–Tibet Plateau. Due to the uncertainty of the climate model, there were still some errors in some areas, including the western arid zone and eastern arid zone, which were overestimated, while the negative deviations were mainly concentrated in some regions in southern China. The prediction performance of ML for the precipitation intensity index was better than that of the precipitation index, especially for SDII95.
- (b)
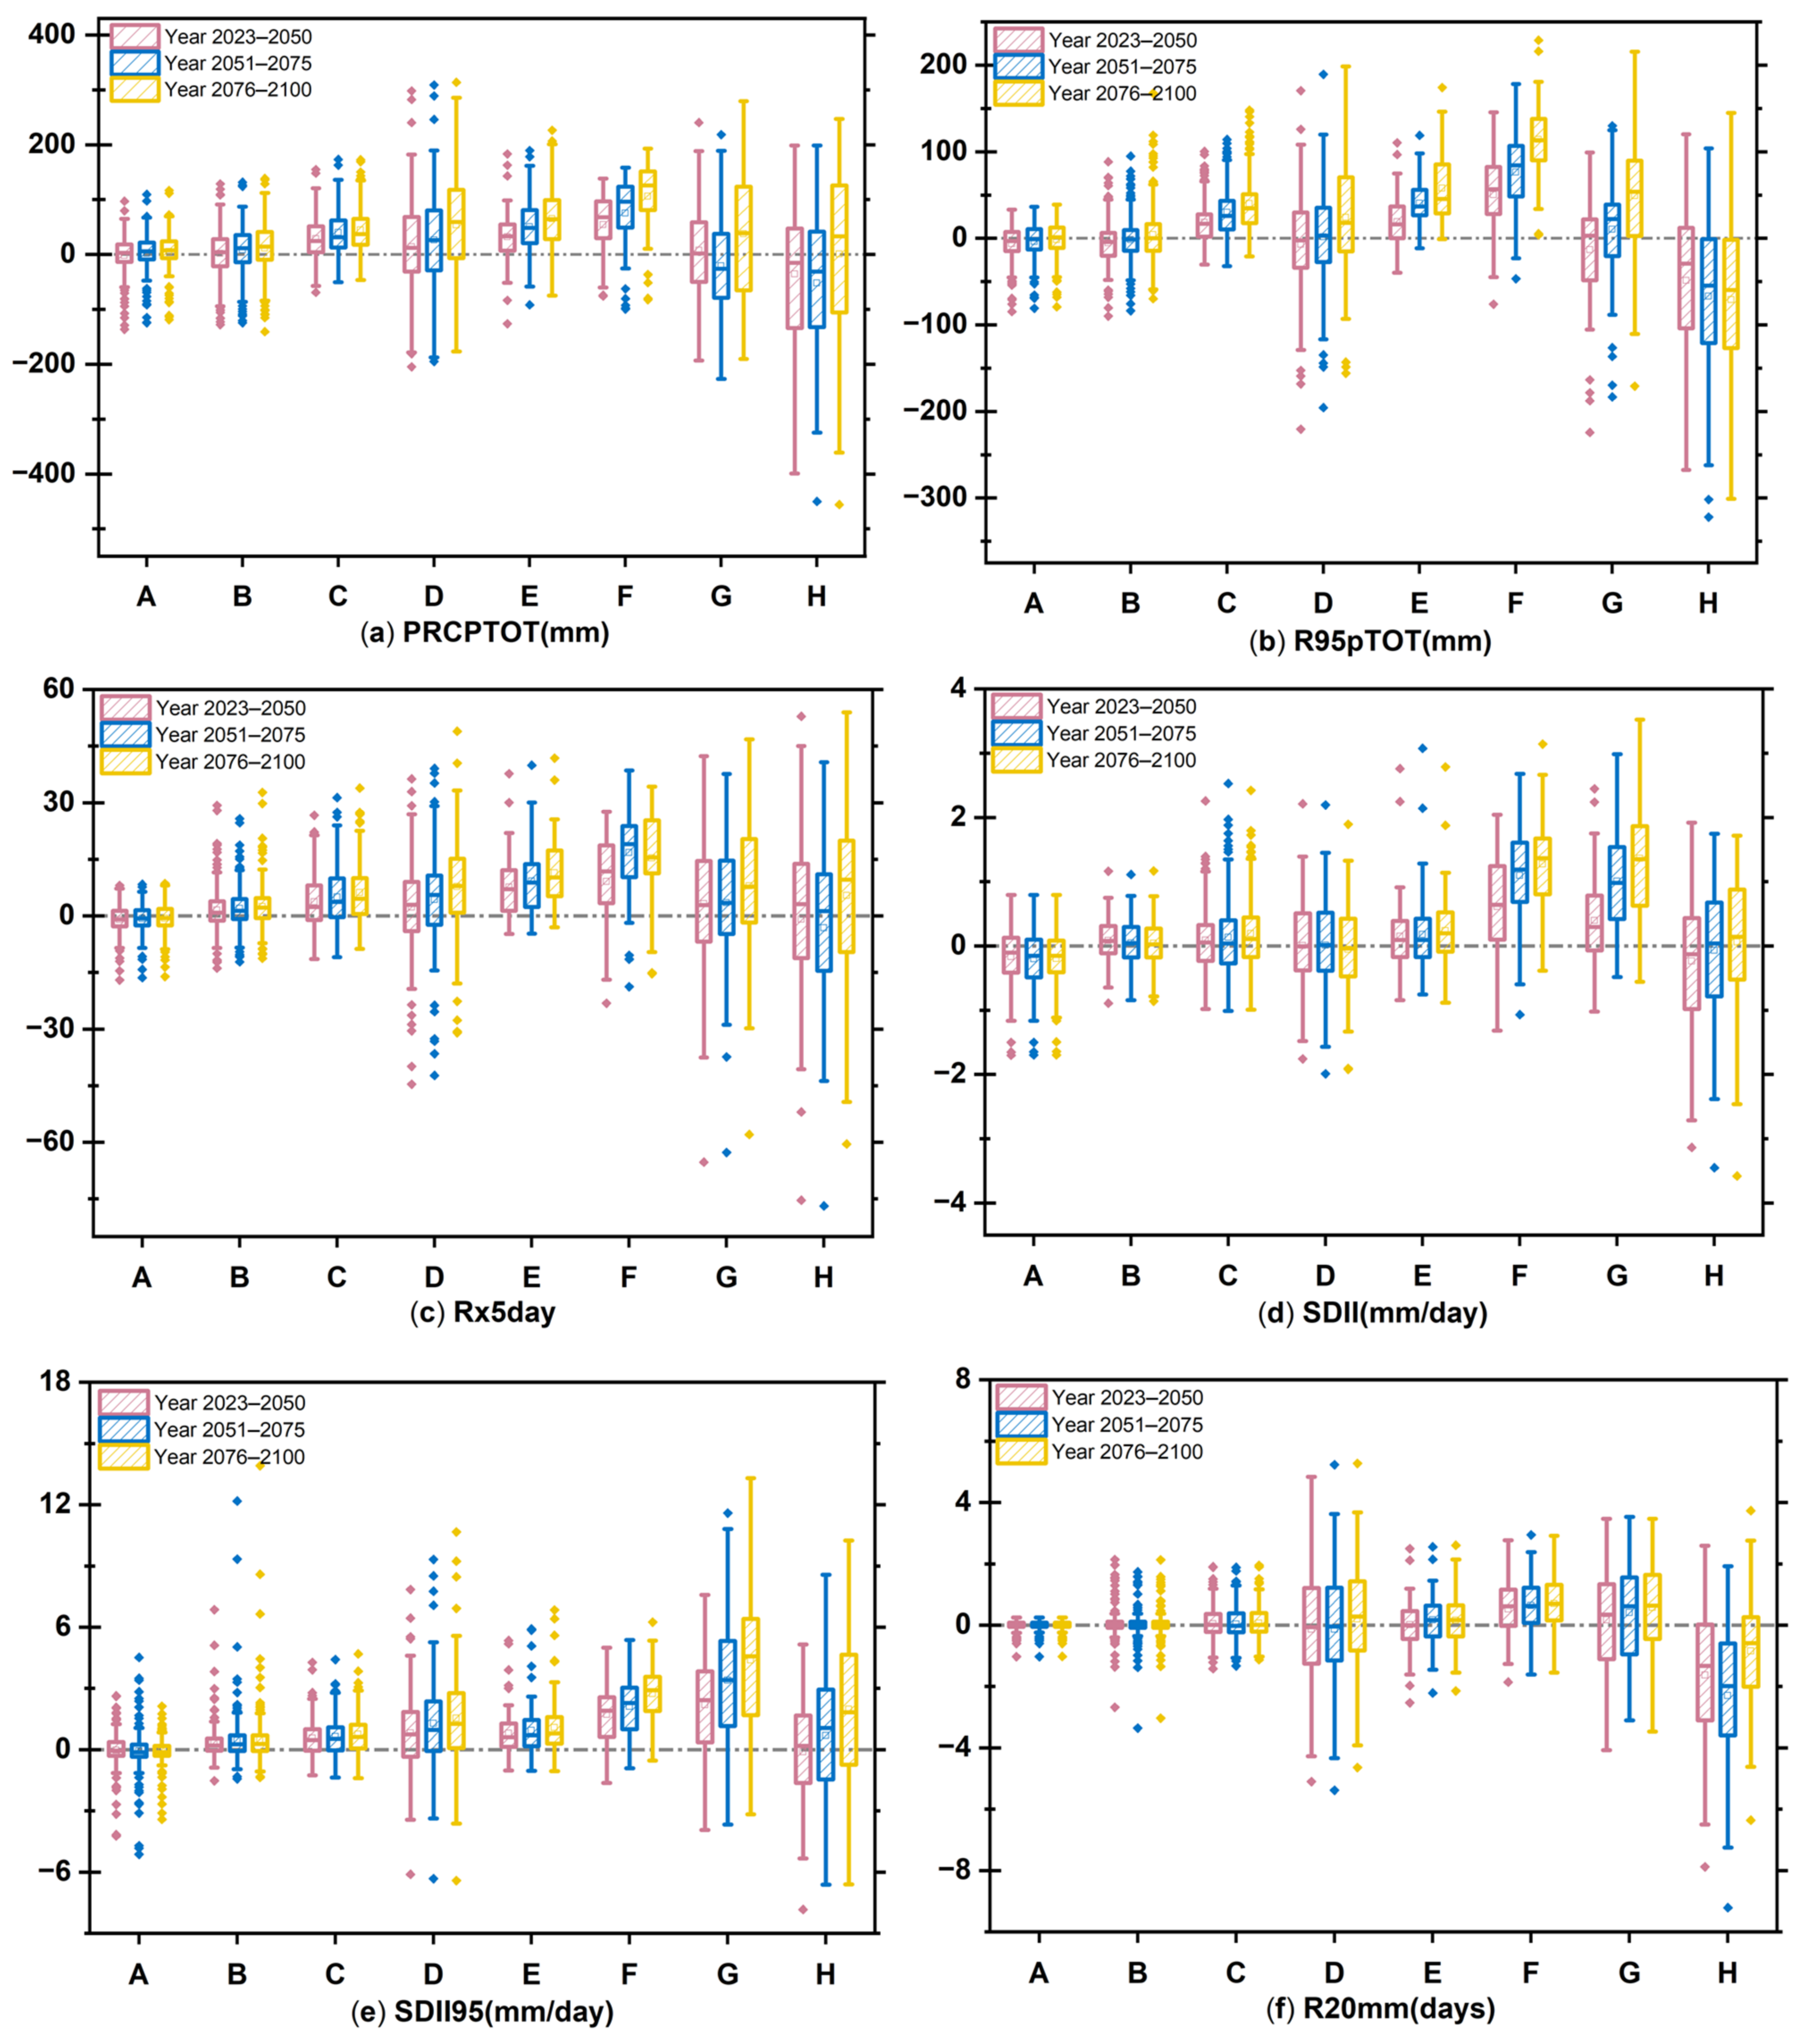
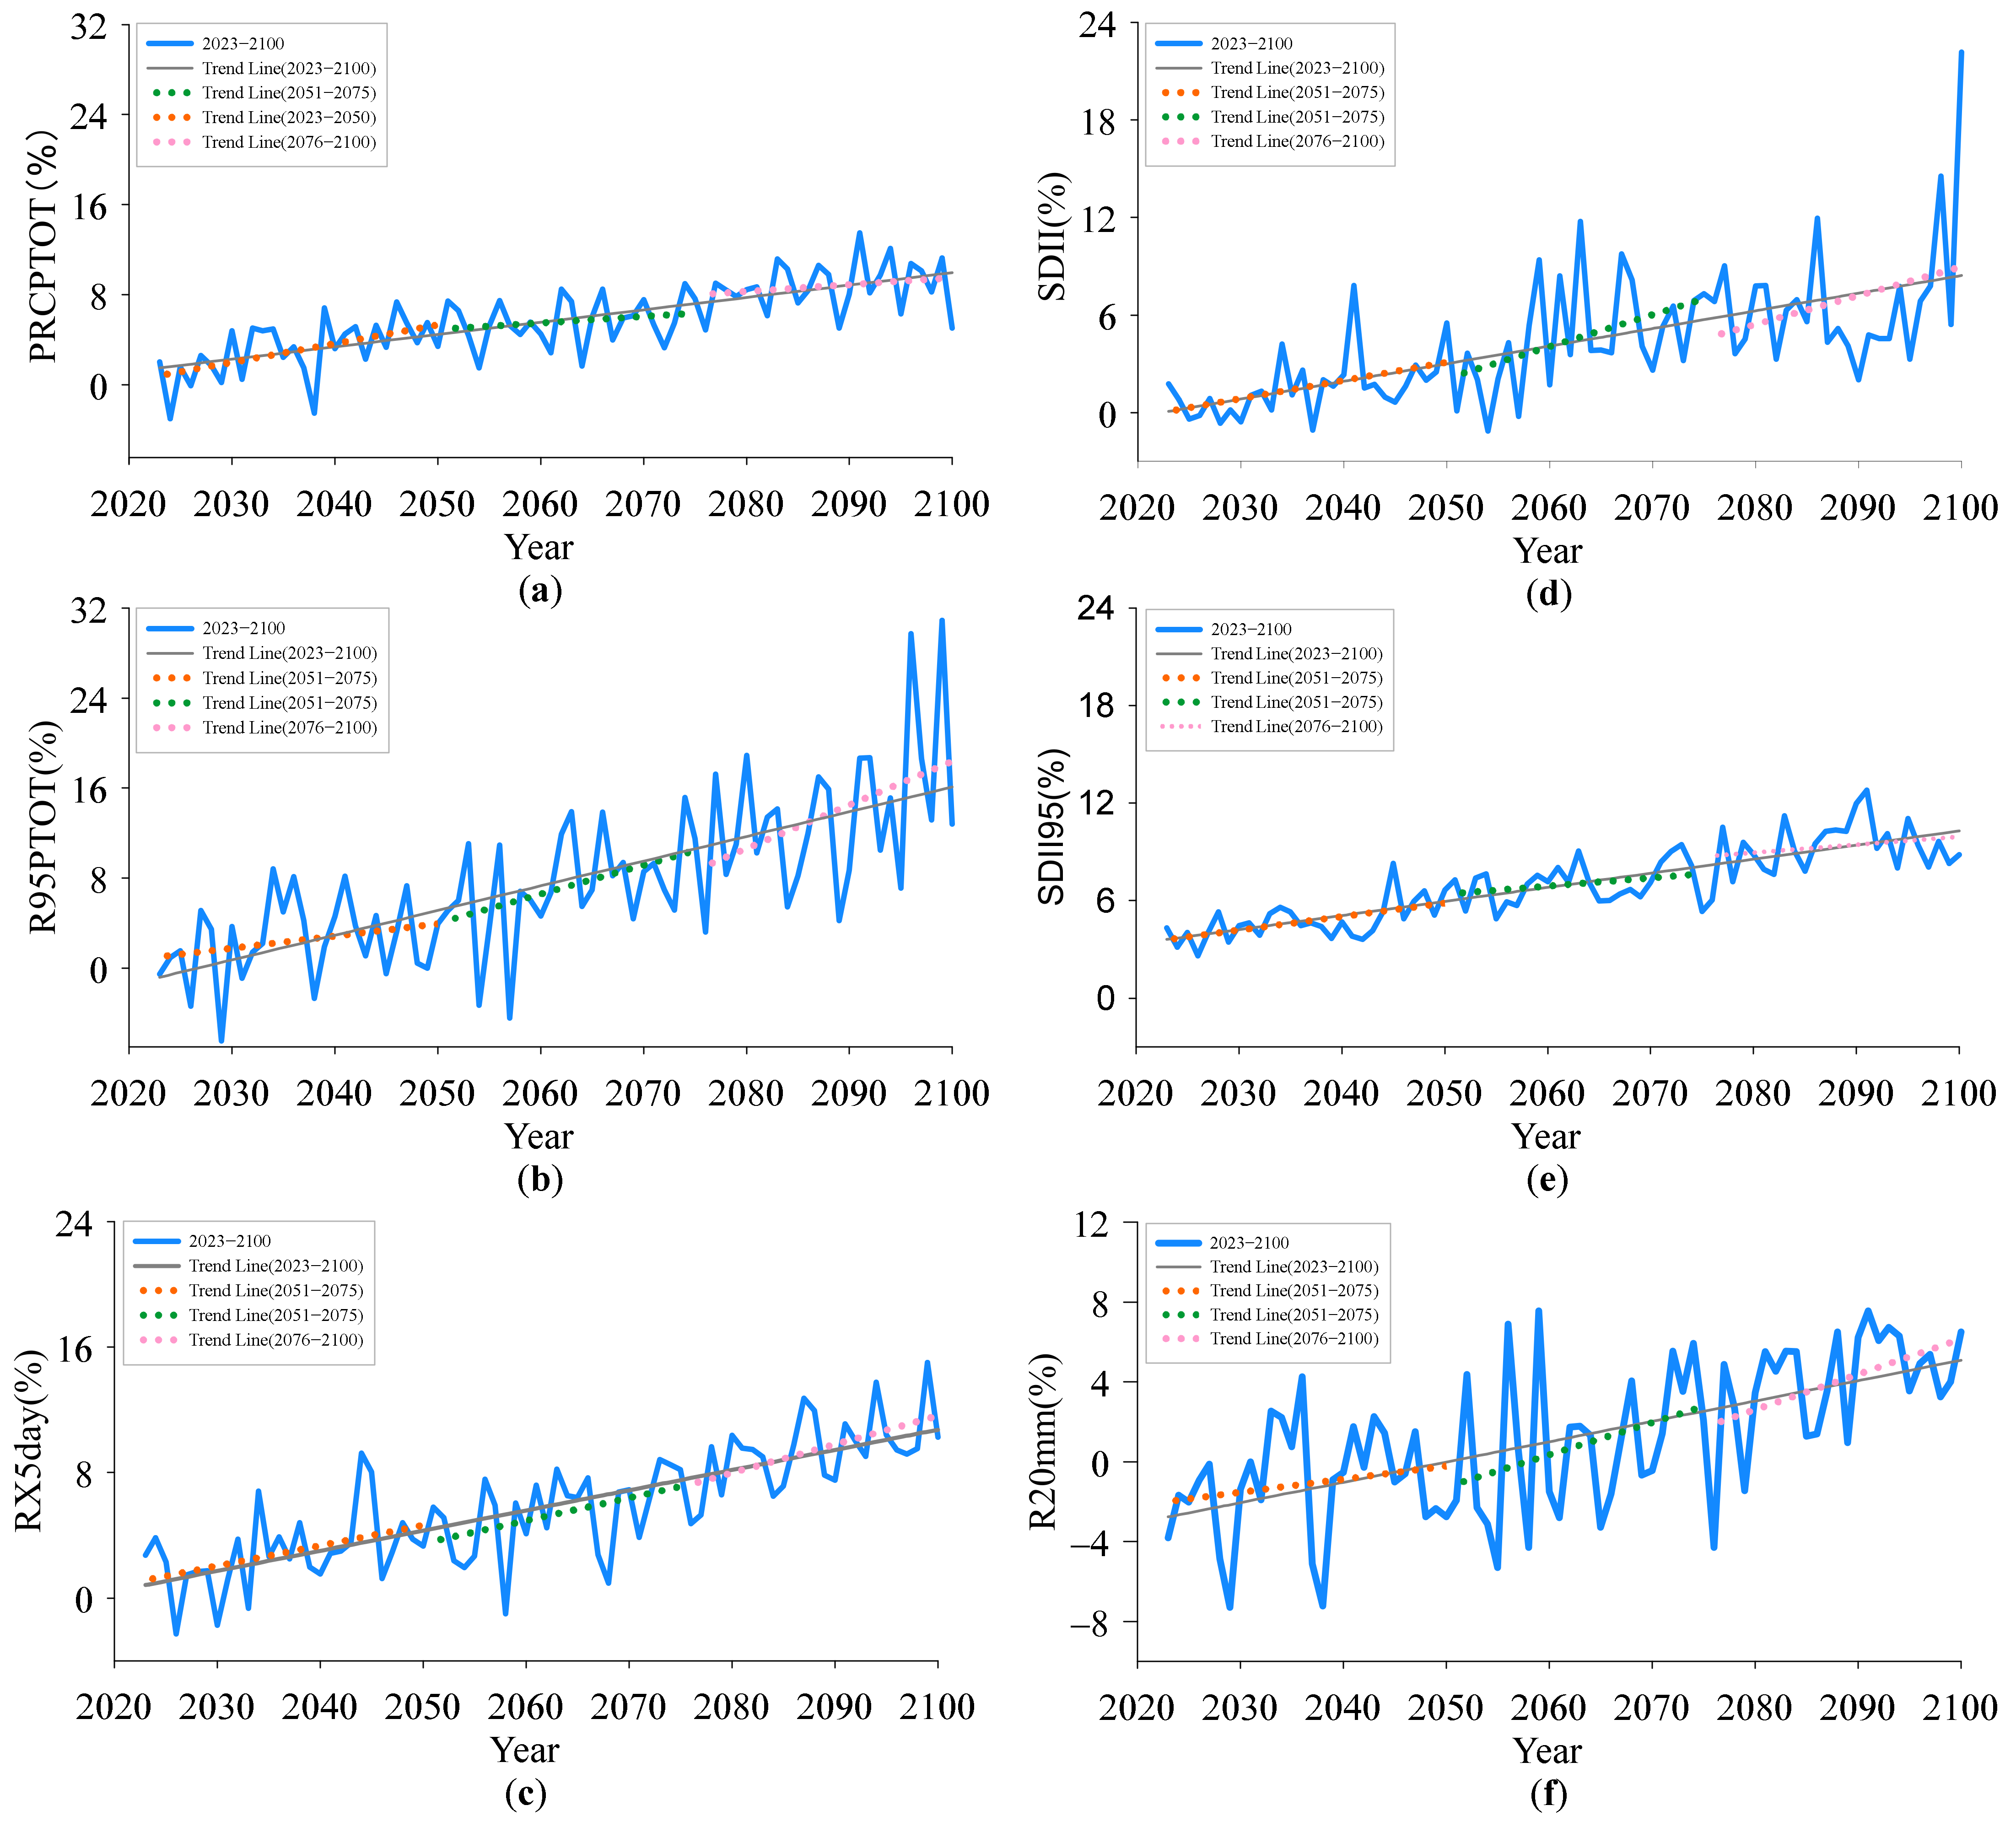
- In the SSP2-4.5 scenario, the PRCPTOT, R95pTOT, Rx5day, SDII, SDII95, and R20mm precipitation indices continued to increase in mainland China, and by the end of the 21st century, will increase 8.77%, 13.73%, 9.43%, 6.84%, 9.34%, and 4.02%, respectively. Changes in extreme precipitation indices were the most prominent, with extreme precipitation reaching more than half of the total precipitation at the end of the period. China may experience more frequent and intense extreme precipitation events in the future, and the risk of future flooding throughout China will be greater.
- (c)
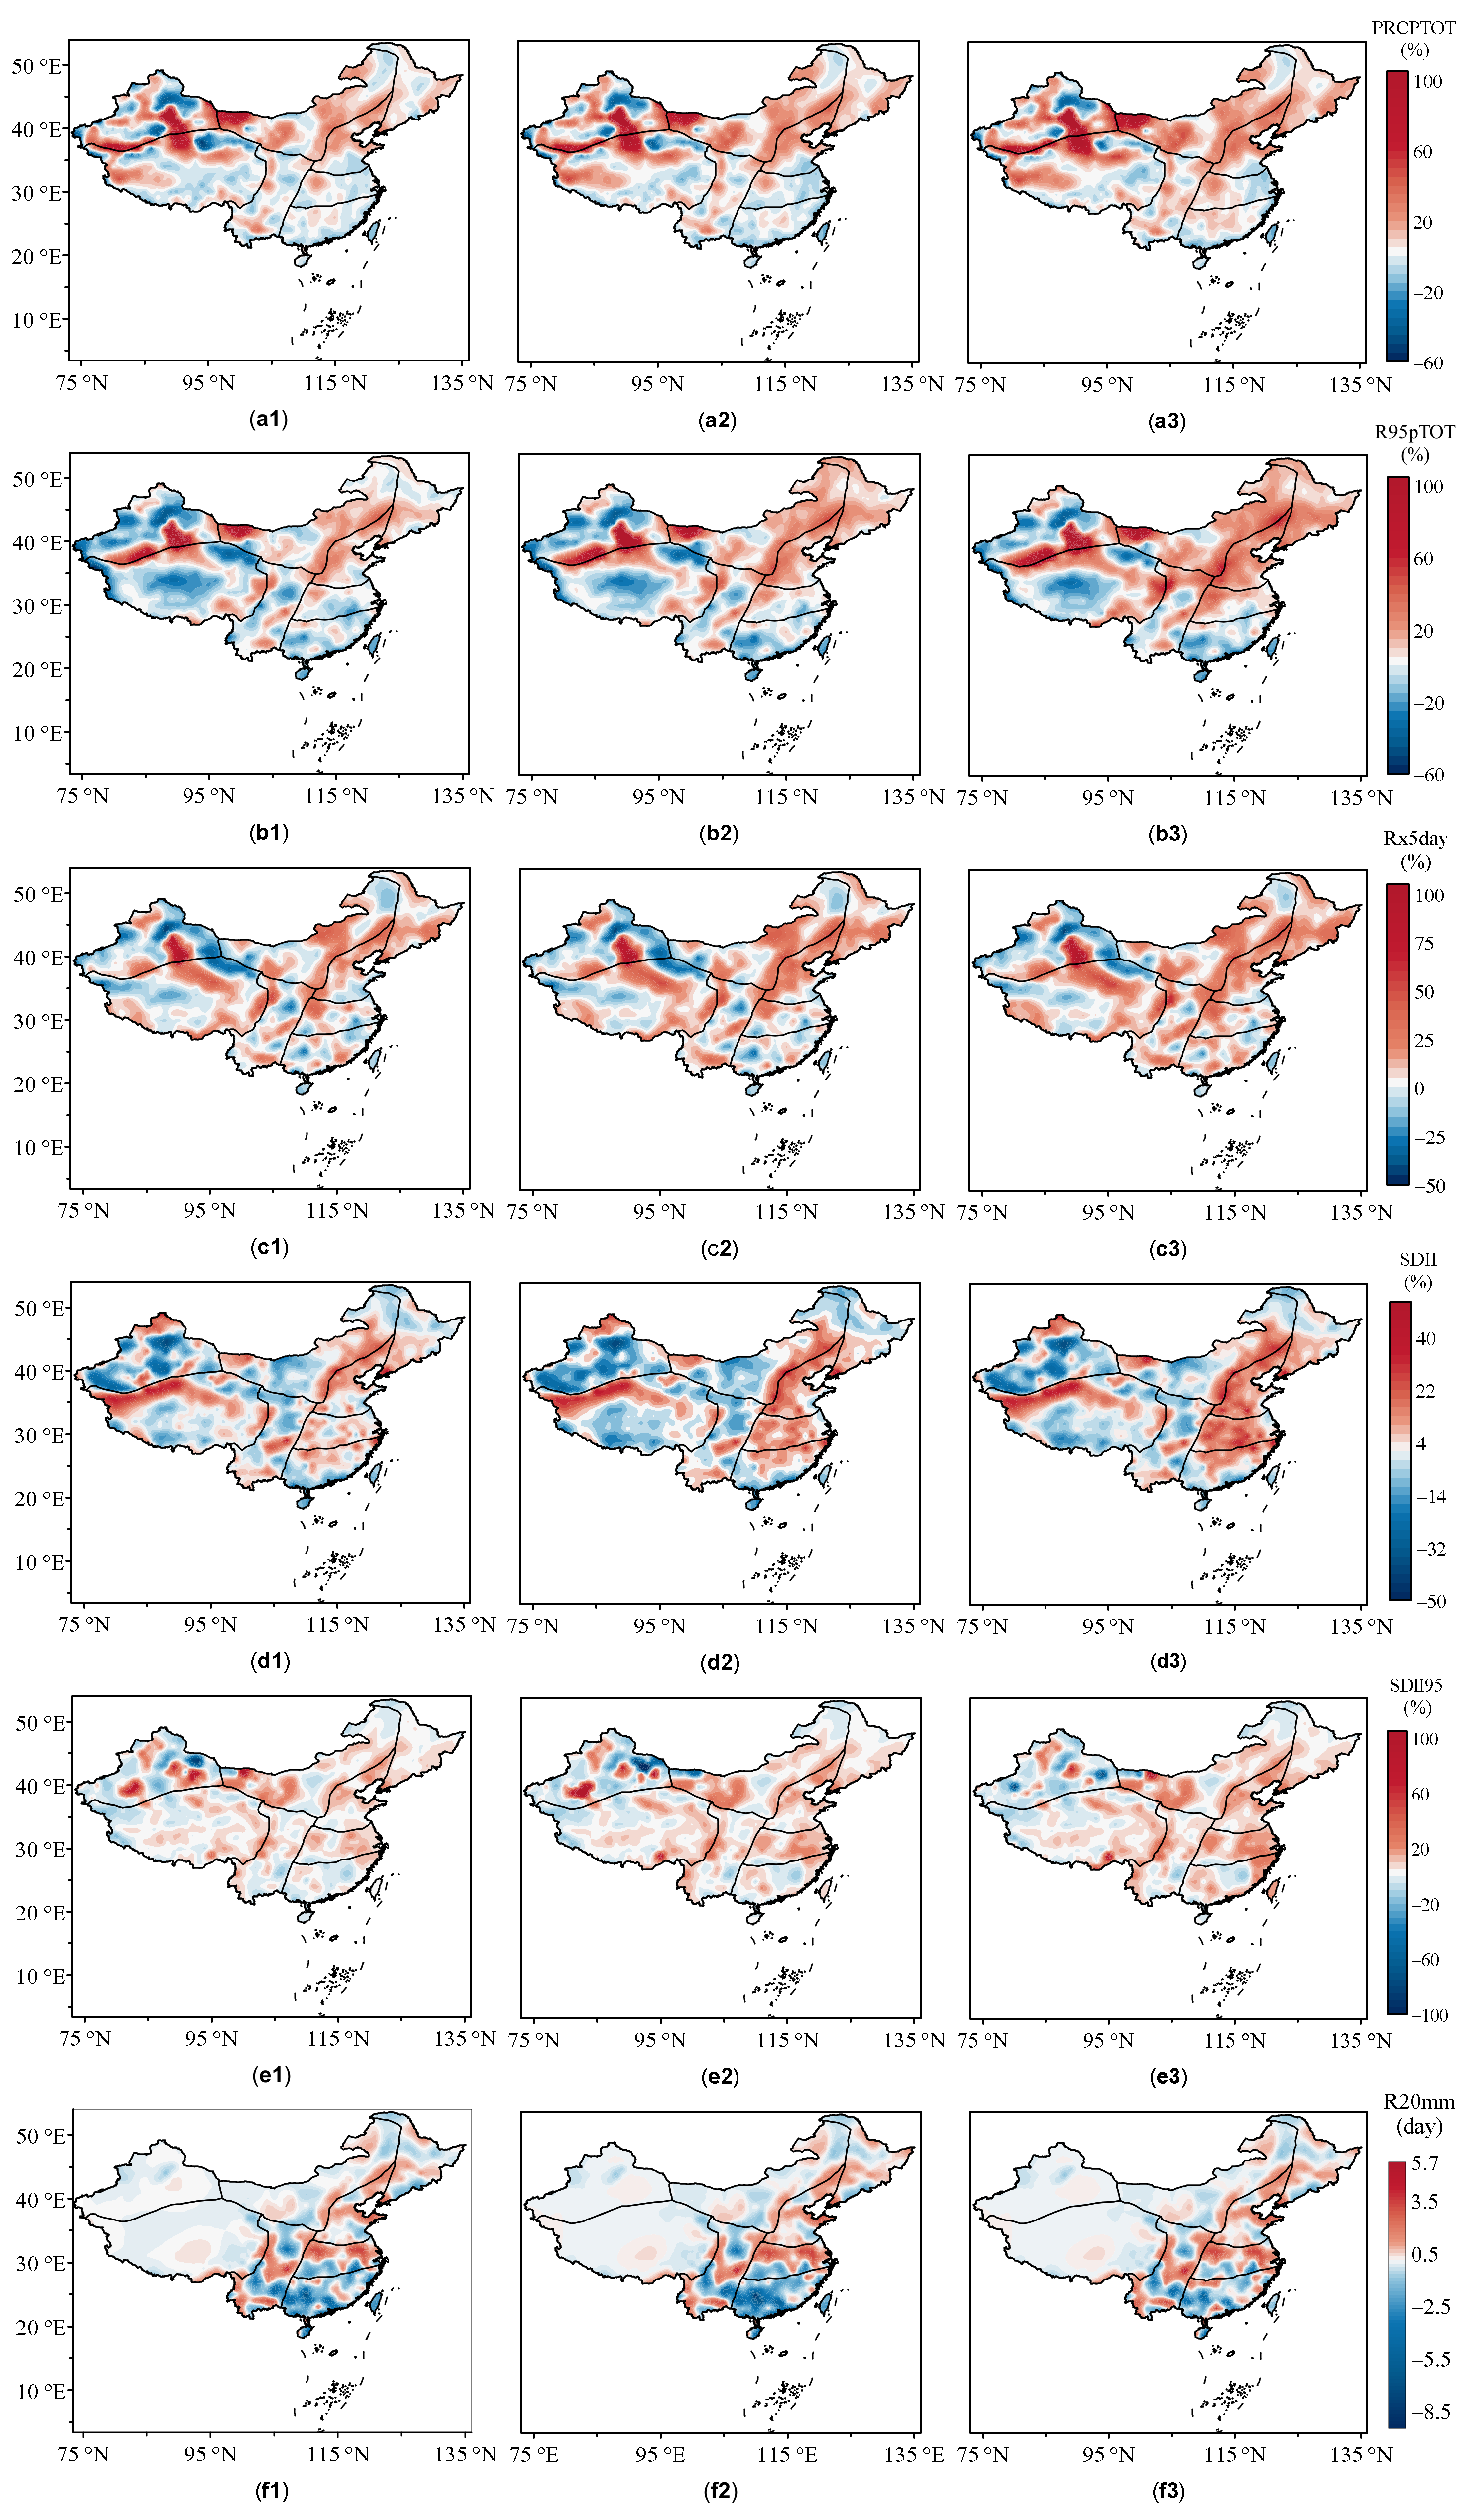
- The increase in precipitation in southern China is not apparent. Even in the middle of the 21st century, precipitation in central and south China has decreased. In contrast, there are certain differences in the spatial distribution, especially precipitation likely to increase more in northern China, with the most significant precipitation change occurring at the end of the 21st century when PRCPTOT, R95pTOT, and Rx5day increase significantly in northern China. Additionally, the frequency and intensity of precipitation are expected to increase more sharply mainly in north China and central China, and slightly in western and southern China. The increase in precipitation intensity is expected to be greater in north China than in south China. This change may alleviate droughts and water shortages in some parts of northern China to some extent, but this pattern will not change for more rainfall in the south and less rainfall in the north [19].
- (d)
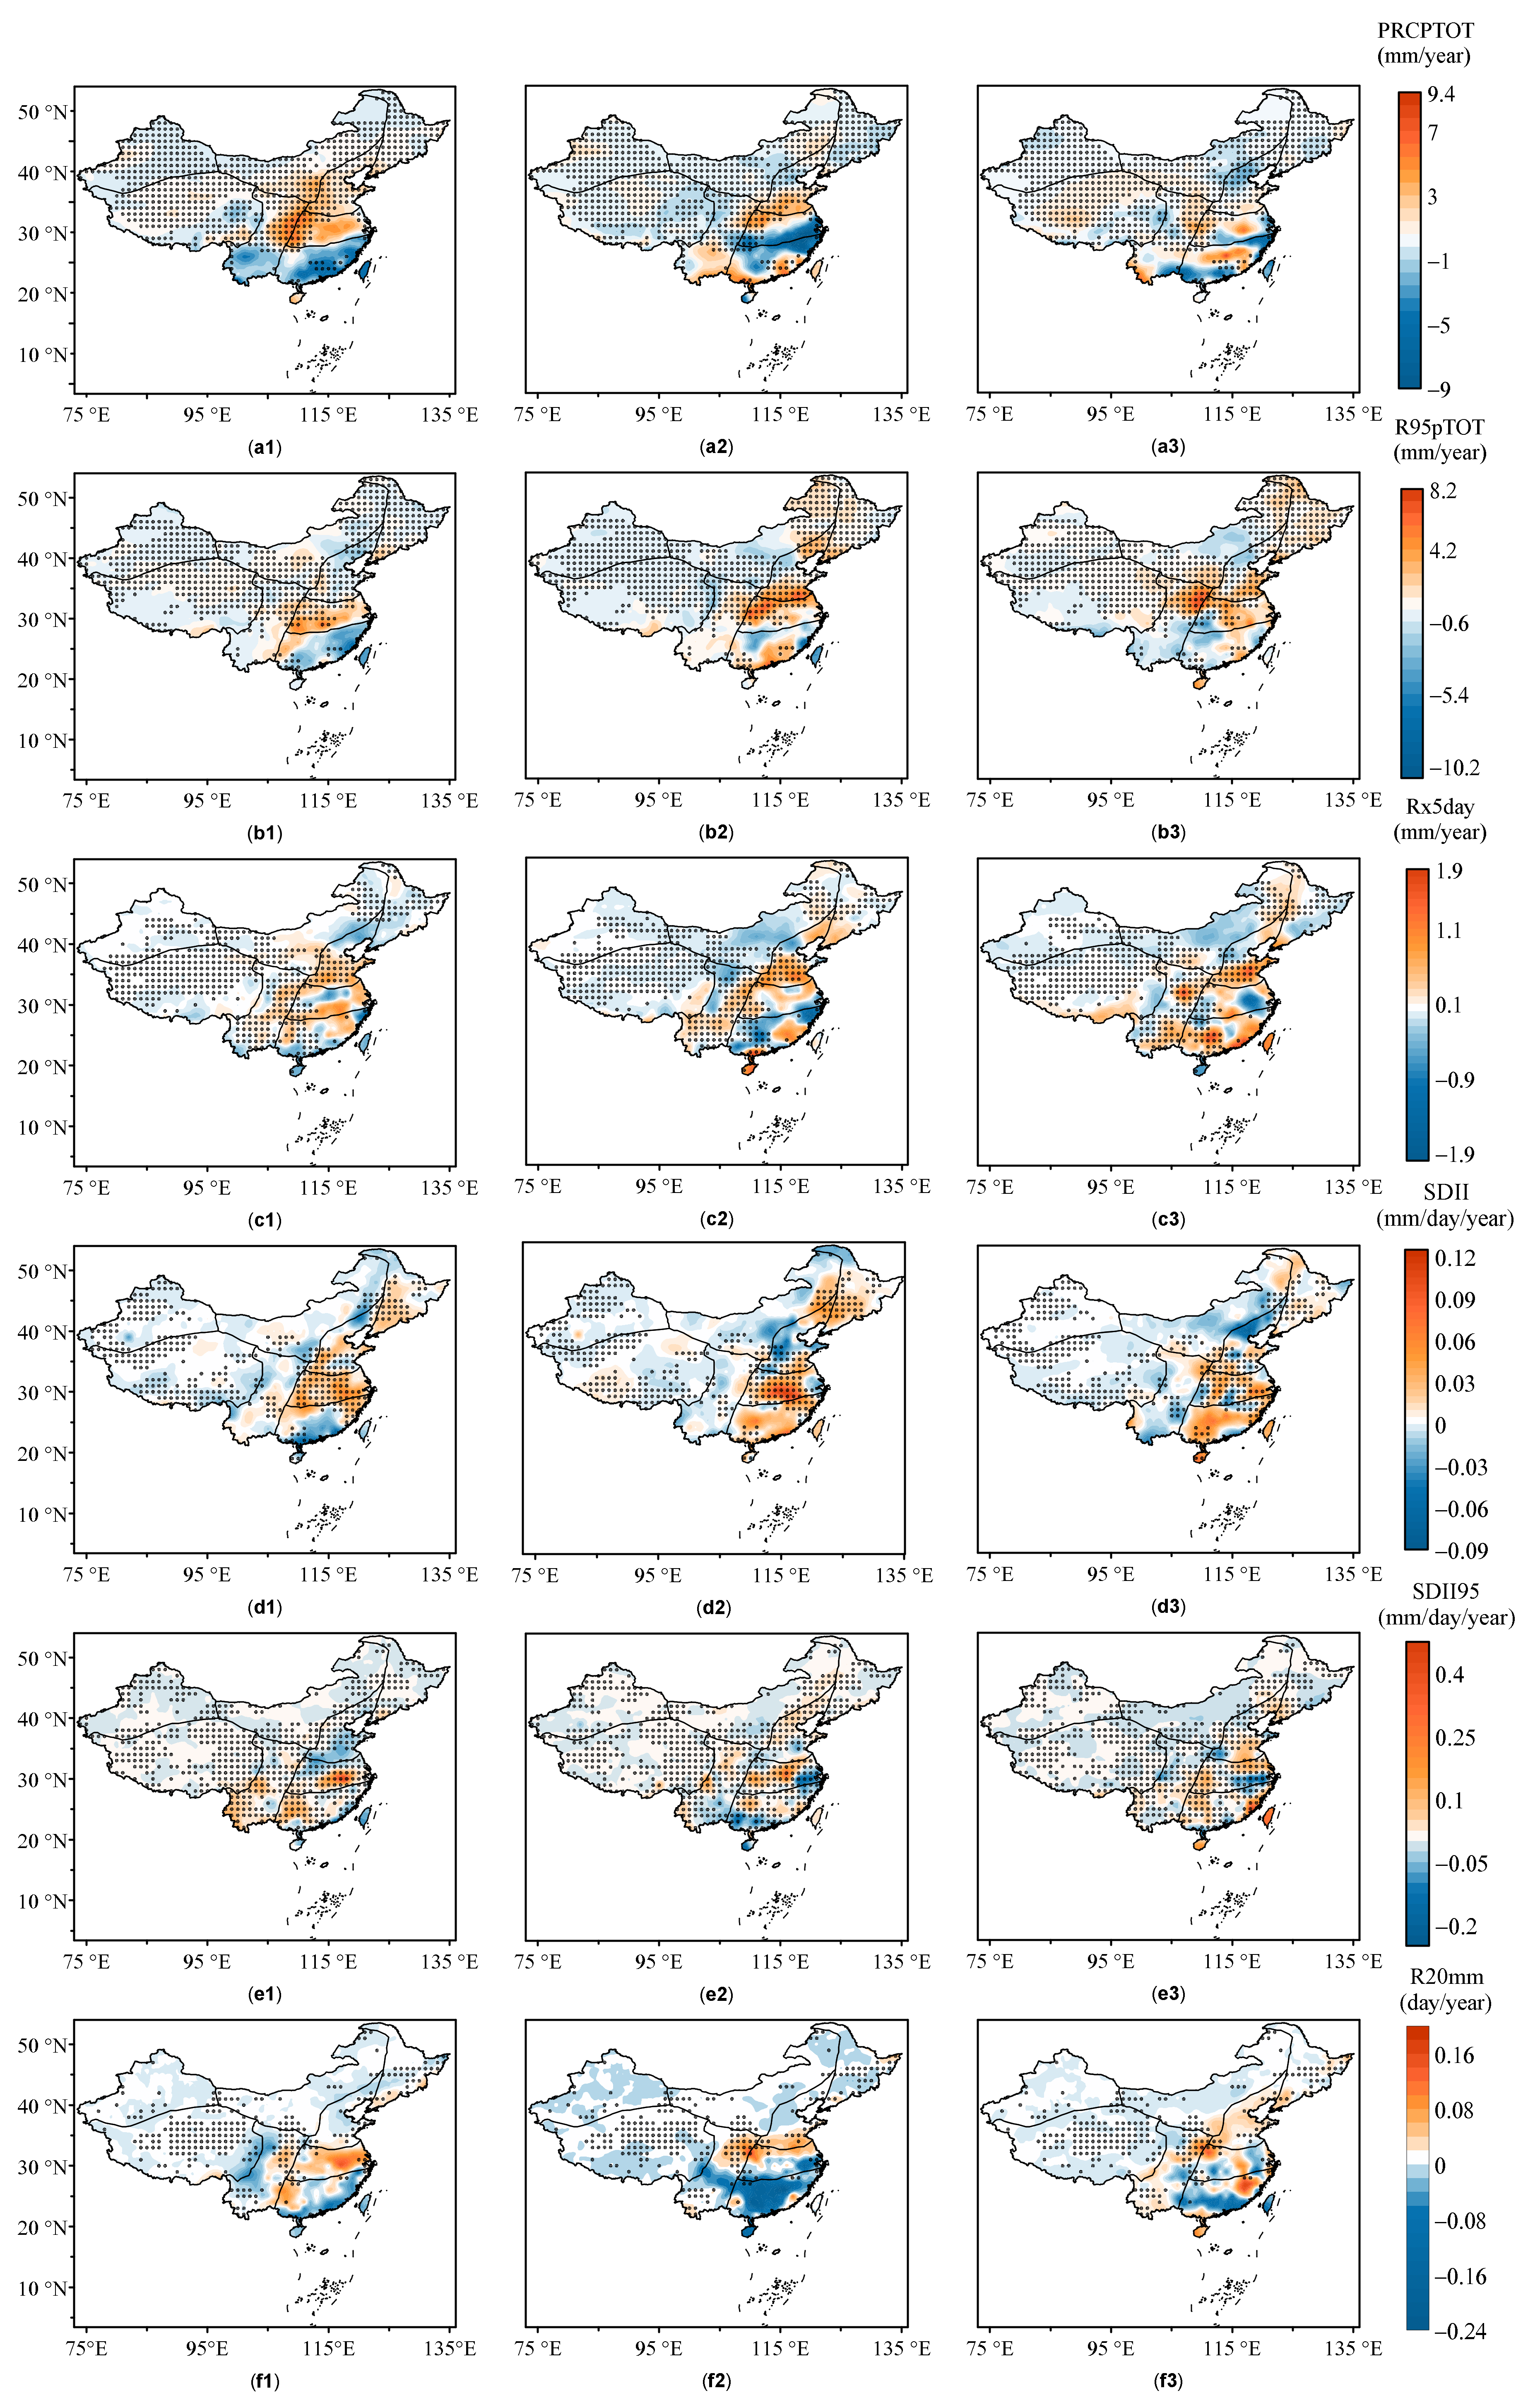
- The temporal evolution of all the indices showed an increasing trend, with precipitation increasing more rapidly at the end of this century and SDII having a greater rate of increase in the first and middle of the century. The contribution of R95pTOT to PRCPTOT also increased with time, reaching 0.387%/year at the end of the century, while Rx5day also increased at a rate of 0.182%/year.
Author Contributions
Funding
Data Availability Statement
Acknowledgments
Conflicts of Interest
References
- Meehl, G.A.; Tebaldi, C.; Walton, G.; Easterling, D.; McDaniel, L. Relative increase of record high maximum temperatures compared to record low minimum temperatures in the US. Geophys. Res. Lett. 2009, 36, L23701. [Google Scholar] [CrossRef]
- Trenberth, K.E.; Fasullo, J.T. Climate extremes and climate change: The Russian heat wave and other climate extremes of 2010. J. Geophys. Res. Atmos. 2012, 117, D17103. [Google Scholar] [CrossRef]
- Lu, X.X.; Ran, L. China flood havoc highlights poor urban planning. Nat. Hazards 2011, 56, 575. [Google Scholar] [CrossRef]
- Root, T.L.; Price, J.T.; Hall, K.R.; Schneider, S.H.; Rosenzweig, C.; Pounds, J.A. Fingerprints of global warming on wild animals and plants. Nature 2003, 421, 57–60. [Google Scholar] [CrossRef] [PubMed]
- Changnon, S.A.; Pielke, R.A., Jr.; Changnon, D.; Sylves, R.T.; Pulwarty, R. Human factors explain the increased losses from weather and climate extremes. Bull. Am. Meteorol. Soc. 2000, 81, 437–442. [Google Scholar] [CrossRef]
- Peterson, T.C.; Zhang, X.; Brunet-India, M.; Vázquez-Aguirre, J.L. Changes in North American extremes derived from daily weather data. J. Geophys. Res. Atmos. 2008, 113, D07113. [Google Scholar] [CrossRef]
- Westra, S.; Fowler, H.J.; Evans, J.P.; Alexander, L.V.; Berg, P.; Johnson, F.; Kendon, E.J.; Lenderink, G.; Roberts, N. Future changes to the intensity and frequency of short-duration extreme rainfall. Rev. Geophys. 2014, 52, 522–555. [Google Scholar] [CrossRef]
- Donat, M.G.; Lowry, A.L.; Alexander, L.V.; O’Gorman, P.A.; Maher, N. More extreme precipitation in the world’s dry and wet regions. Nat. Clim. Change 2016, 6, 508–513. [Google Scholar] [CrossRef]
- Croitoru, A.-E.; Chiotoroiu, B.-C.; Todorova, V.I.; Torică, V.; Change, P. Changes in precipitation extremes on the Black Sea Western Coast. Glob. Planet. Change 2013, 102, 10–19. [Google Scholar] [CrossRef]
- Kunkel, K.E.; Easterling, D.R.; Redmond, K.; Hubbard, K. Temporal variations of extreme precipitation events in the United States: 1895–2000. Geophys. Res. Lett. 2003, 30, 1326–1350. [Google Scholar] [CrossRef]
- Zhang, Q.; Gemmer, M.; Chen, J. Climate changes and flood/drought risk in the Yangtze Delta, China, during the past millennium. Quat. Int. 2008, 176, 62–69. [Google Scholar] [CrossRef]
- Zhang, Q.; Sun, P.; Singh, V.P.; Chen, X.; Change, P. Spatial-temporal precipitation changes (1956–2000) and their implications for agriculture in China. Glob. Planet. Change 2012, 82, 86–95. [Google Scholar] [CrossRef]
- Min, S.-K.; Zhang, X.; Zwiers, F.W.; Hegerl, G.C. Human contribution to more-intense precipitation extremes. Nature 2011, 470, 378–381. [Google Scholar] [CrossRef] [PubMed]
- Yu, F.; Chen, Z.; Ren, X.; Yang, G. Analysis of historical floods on the Yangtze River, China: Characteristics and explanations. Geomorphology 2009, 113, 210–216. [Google Scholar] [CrossRef]
- Wang, Q.-X.; Fan, X.-H.; Qin, Z.-D.; Wang, M.-B.; Change, P. Change trends of temperature and precipitation in the Loess Plateau Region of China, 1961–2010. Glob. Planet. Change 2012, 92, 138–147. [Google Scholar] [CrossRef]
- Yuan, Z.; Yang, Z.; Yan, D.; Yin, J. Historical changes and future projection of extreme precipitation in China. Theor. Appl. Climatol. 2017, 127, 393–407. [Google Scholar] [CrossRef]
- Wu, S.; Hu, Z.; Wang, Z.; Cao, S.; Yang, Y.; Qu, X.; Zhao, W.J. Spatiotemporal variations in extreme precipitation on the middle and lower reaches of the Yangtze River Basin (1970–2018). Quat. Int. 2021, 592, 80–96. [Google Scholar] [CrossRef]
- Jia, W.; Bo-Tao, Z.; Ying, X. Response of precipitation and its extremes over China to warming: CMIP5 simulation and projection. Chin. J. Geophys. 2015, 58, 461–473. [Google Scholar] [CrossRef]
- Jiang, Z.; Li, W.; Xu, J.; Li, L. Extreme precipitation indices over China in CMIP5 models. Part I: Model evaluation. J. Clim. 2015, 28, 8603–8619. [Google Scholar] [CrossRef]
- Sillmann, J.; Kharin, V.V.; Zwiers, F.; Zhang, X.; Bronaugh, D. Climate extremes indices in the CMIP5 multimodel ensemble: Part 2. Future climate projections. J. Geophys. Res. Atmos. 2013, 118, 2473–2493. [Google Scholar] [CrossRef]
- Peng, Y.; Zhao, X.; Wu, D.; Tang, B.; Xu, P.; Du, X.; Wang, H. Spatiotemporal variability in extreme precipitation in China from observations and projections. Water 2018, 10, 1089. [Google Scholar] [CrossRef]
- Simpkins, G. Progress in climate modelling. Nat. Clim. Change 2017, 7, 684–685. [Google Scholar] [CrossRef]
- Eyring, V.; Bony, S.; Meehl, G.A.; Senior, C.A.; Stevens, B.; Stouffer, R.J.; Taylor, K.E. Overview of the Coupled Model Intercomparison Project Phase 6 (CMIP6) experimental design and organization. Geosci. Model Dev. 2016, 9, 1937–1958. [Google Scholar] [CrossRef]
- Gusain, A.; Ghosh, S.; Karmakar, S. Added value of CMIP6 over CMIP5 models in simulating Indian summer monsoon rainfall. Atmos. Res. 2020, 232, 104680. [Google Scholar] [CrossRef]
- Nie, S.; Fu, S.; Cao, W.; Jia, X.J.T.; Climatology, A. Comparison of monthly air and land surface temperature extremes simulated using CMIP5 and CMIP6 versions of the Beijing Climate Center climate model. Theor. Appl. Climatol. 2020, 140, 487–502. [Google Scholar] [CrossRef]
- Xu, H.; Chen, H.; Wang, H. Future changes in precipitation extremes across China based on CMIP6 models. Int. J. Climatol. 2022, 42, 635–651. [Google Scholar] [CrossRef]
- Chen, H.; Sun, J.; Lin, W.; Xu, H. Comparison of CMIP6 and CMIP5 models in simulating climate extremes. Sci. Bull. 2020, 65, 1415–1418. [Google Scholar] [CrossRef]
- Reichstein, M.; Camps-Valls, G.; Stevens, B.; Jung, M.; Denzler, J.; Carvalhais, N. Deep learning and process understanding for data-driven Earth system science. Nature 2019, 566, 195–204. [Google Scholar] [CrossRef]
- Wang, T.; Miao, J.-P.; Sun, J.-Q.; Fu, Y.-H. Intensified East Asian summer monsoon and associated precipitation mode shift under the 1.5 C global warming target. Adv. Clim. Change Res. 2018, 9, 102–111. [Google Scholar] [CrossRef]
- Wang, H.; Wang, L.; He, J.; Ge, F.; Chen, Q.; Tang, S.; Yao, S.J.E.; Science, S. Can the GPM IMERG hourly products replicate the variation in precipitation during the wet season over the Sichuan Basin, China? Earth Space Sci. 2020, 7, e2020EA001090. [Google Scholar] [CrossRef]
- Wang, H.; Yan, Y.; Keji, L.; Chen, Q.; Fan, X.; Zhang, F.; Tan, L. Relationships between Rapid Urbanization and Extreme Summer Precipitation over the Sichuan–Chongqing Area of China. Front. Earth Sci. 2022, 10, 909547. [Google Scholar] [CrossRef]
- Miao, J.; Lin, Z.-S. Study on the characteristics of the precipitation of nine regions in China and their physical causes II—The relation between the precipitation and physical causes. J. Trop. Meteorol. 2004, 20, 64–72. [Google Scholar]
- Zhang, X.; Alexander, L.; Hegerl, G.C.; Jones, P.; Tank, A.K.; Peterson, T.C.; Trewin, B.; Zwiers, F.W. Indices for monitoring changes in extremes based on daily temperature and precipitation data. Wiley Interdiscip. Rev. Clim. Change 2011, 2, 851–870. [Google Scholar] [CrossRef]
- Zhang, Q.; Kong, D.; Singh, V.P.; Shi, P.J.G.; Change, P. Response of vegetation to different time-scales drought across China: Spatiotemporal patterns, causes and implications. Glob. Planet. Change 2017, 152, 1–11. [Google Scholar] [CrossRef]
- Wu, J.; Gao, X.-J. A gridded daily observation dataset over China region and comparison with the other datasets. Chin. J. Geophys. 2013, 56, 1102–1111. [Google Scholar]
- Ji, Z.; Kang, S. Evaluation of extreme climate events using a regional climate model for China. Int. J. Climatol. 2015, 35, 888–902. [Google Scholar] [CrossRef]
- Wu, J.; Gao, X.; Giorgi, F.; Chen, D. Changes of effective temperature and cold/hot days in late decades over China based on a high resolution gridded observation dataset. Int. J. Climatol. 2017, 37, 788–800. [Google Scholar] [CrossRef]
- O’Neill, B.C.; Tebaldi, C.; Van Vuuren, D.P.; Eyring, V.; Friedlingstein, P.; Hurtt, G.; Knutti, R.; Kriegler, E.; Lamarque, J.-F.; Lowe, J.; et al. The scenario model intercomparison project (ScenarioMIP) for CMIP6. Geosci. Model Dev. 2016, 9, 3461–3482. [Google Scholar] [CrossRef]
- Riahi, K.; Van Vuuren, D.P.; Kriegler, E.; Edmonds, J.; O’neill, B.C.; Fujimori, S.; Bauer, N.; Calvin, K.; Dellink, R.; Fricko, O.; et al. The shared socioeconomic pathways and their energy, land use, and greenhouse gas emissions implications: An overview. Glob. Environ. Change 2017, 42, 153–168. [Google Scholar] [CrossRef]
- Zhao, Y.; Zou, X.; Cao, L.; Xu, X. Changes in precipitation extremes over the Pearl River Basin, southern China, during 1960–2012. Quat. Int. 2014, 333, 26–39. [Google Scholar] [CrossRef]
- Karl, T.R.; Nicholls, N.; Ghazi, A. Clivar/GCOS/WMO workshop on indices and indicators for climate extremes workshop summary. In Weather and Climate Extremes; Springer: Berlin/Heidelberg, Germany, 1999; pp. 3–7. [Google Scholar]
- Zhu, H.; Jiang, Z.; Li, J.; Li, W.; Sun, C.; Li, L. Does CMIP6 inspire more confidence in simulating climate extremes over China? Adv. Atmos. Sci. 2020, 37, 1119–1132. [Google Scholar] [CrossRef]
- Jiao, L.-C.; Yang, S.-Y.; Liu, F.; Wang, S.-G.; Feng, Z.-X. Seventy years beyond neural networks: Retrospect and prospect. Chin. J. Comput. 2016, 39, 1697–1716. [Google Scholar]
- Lin, W.; Chen, H.J.A.; Letters, O.S. Assessment of model performance of precipitation extremes over the mid-high latitude areas of Northern Hemisphere: From CMIP5 to CMIP6. Atmos. Ocean. Sci. Lett. 2020, 13, 598–603. [Google Scholar] [CrossRef]
- Taylor, K.E. Summarizing multiple aspects of model performance in a single diagram. J. Geophys. Res. Atmos. 2001, 106, 7183–7192. [Google Scholar] [CrossRef]
- Ge, F.; Zhu, S.; Luo, H.; Zhi, X.; Wang, H. Future changes in precipitation extremes over Southeast Asia: Insights from CMIP6 multi-model ensemble. Environ. Res. Lett. 2021, 16, 024013. [Google Scholar] [CrossRef]
- Han, T.; Chen, H.; Hao, X.; Wang, H. Projected changes in temperature and precipitation extremes over the Silk Road Economic Belt regions by the Coupled Model Intercomparison Project Phase 5 multi-model ensembles. Int. J. Climatol. 2018, 38, 4077–4091. [Google Scholar] [CrossRef]
- Dong, S.; Xu, Y.; Zhou, B.; Shi, Y. Assessment of indices of temperature extremes simulated by multiple CMIP5 models over China. Adv. Atmos. Sci. 2015, 32, 1077–1091. [Google Scholar] [CrossRef]
- Dong, T.; Dong, W. Evaluation of extreme precipitation over Asia in CMIP6 models. Clim. Dyn. 2021, 57, 1751–1769. [Google Scholar] [CrossRef]
- Jiang, D.; Wang, H.; Lang, X. Evaluation of East Asian climatology as simulated by seven coupled models. Adv. Atmos. Sci. 2005, 22, 479–495. [Google Scholar]
- Chen, L.; Frauenfeld, O.W. A comprehensive evaluation of precipitation simulations over China based on CMIP5 multimodel ensemble projections. J. Geophys. Res. Atmos. 2014, 119, 5767–5786. [Google Scholar] [CrossRef]
- Torma, C.; Giorgi, F.; Coppola, E. Added value of regional climate modeling over areas characterized by complex terrain—Precipitation over the Alps. J. Geophys. Res. Atmos. 2015, 120, 3957–3972. [Google Scholar] [CrossRef]
- Sun, Q.; Miao, C.; Duan, Q. Projected changes in temperature and precipitation in ten river basins over China in 21st century. Int. J. Climatol. 2015, 35, 1125–1141. [Google Scholar] [CrossRef]
- Ou, T.; Chen, D.; Linderholm, H.W.; Jeong, J.-H. Evaluation of global climate models in simulating extreme precipitation in China. Tellus A Dyn. Meteorol. Oceanogr. 2013, 65, 19799. [Google Scholar] [CrossRef]
- Su, F.; Duan, X.; Chen, D.; Hao, Z.; Cuo, L. Evaluation of the global climate models in the CMIP5 over the Tibetan Plateau. J. Clim. 2013, 26, 3187–3208. [Google Scholar] [CrossRef]
- Guo, J.; Huang, G.; Wang, X.; Li, Y.; Yang, L. Future changes in precipitation extremes over China projected by a regional climate model ensemble. Atmos. Environ. 2018, 188, 142–156. [Google Scholar] [CrossRef]
- Tian, J.; Zhang, Z.; Ahmed, Z.; Zhang, L.; Su, B.; Tao, H.; Jiang, T. Projections of precipitation over China based on CMIP6 models. Stoch. Environ. Res. Risk Assess. 2021, 35, 831–848. [Google Scholar] [CrossRef]
- Zhou, B.; Wen, Q.H.; Xu, Y.; Song, L.; Zhang, X. Projected changes in temperature and precipitation extremes in China by the CMIP5 multimodel ensembles. J. Clim. 2014, 27, 6591–6611. [Google Scholar] [CrossRef]
- Gu, X.; Zhang, Q.; Singh, V.P.; Shi, P. Changes in magnitude and frequency of heavy precipitation across China and its potential links to summer temperature. J. Hydrol. 2017, 547, 718–731. [Google Scholar] [CrossRef]
- Fasullo, J. A mechanism for land–ocean contrasts in global monsoon trends in a warming climate. Clim. Dyn. 2012, 39, 1137–1147. [Google Scholar] [CrossRef]
- Loo, Y.Y.; Billa, L.; Singh, A. Effect of climate change on seasonal monsoon in Asia and its impact on the variability of monsoon rainfall in Southeast Asia. Geosci. Front. 2015, 6, 817–823. [Google Scholar] [CrossRef]
- Xin, X.; Zhang, L.; Zhang, J.; Wu, T.; Fang, Y. Climate change projections over East Asia with BCC_CSM1. 1 climate model under RCP scenarios. J. Meteorol. Soc. Jpn. Ser. II 2013, 91, 413–429. [Google Scholar] [CrossRef]
- An, Z.; Wu, G.; Li, J.; Sun, Y.; Liu, Y.; Zhou, W.; Cai, Y.; Duan, Y.; Li, L.; Mao, J.; et al. Global monsoon dynamics and climate change. Annu. Rev. Earth Planet. Sci. 2015, 43, 29–77. [Google Scholar]
- Sun, Y.; Ding, Y. A projection of future changes in summer precipitation and monsoon in East Asia. Sci. China Earth Sci. 2010, 53, 284–300. [Google Scholar] [CrossRef]
- Ham, S.; Lee, J.-W.; Yoshimura, K. Assessing future climate changes in the East Asian summer and winter monsoon using regional spectral model. J. Meteorol. Soc. Jpn. Ser. II 2016, 94, 69–87. [Google Scholar] [CrossRef]


| Index | Description | Definition | Unit |
|---|---|---|---|
| PRCPTOT | Precipitation amount | Annual total precipitation of daily precipitation >1 mm | mm |
| R95pTOT | Extreme precipitation amount | Annual total precipitation with daily precipitation >95% threshold | mm |
| Rx5day | Maximum consecutive 5-day precipitation | Annual maximum consecutive 5-day precipitation | mm |
| SDII | Precipitation intensity | Precipitation intensity of days with daily precipitation >1 mm | mm/day |
| SDII95 | Extreme precipitation intensity | Precipitation intensity of days with daily precipitation >95% threshold of the entire time series for the grid point | mm/day |
| R20mm | Very heavy precipitation days | Days of annual daily precipitation >20 mm | day |
| Year | PRCPTOT (%/Year) | R95pTOT (%/Year) | Rx5day (%/Year) | SDII (%/Year) | SDII95 (%/Year) | R20mm (%/Year) |
|---|---|---|---|---|---|---|
| 2023–2100 | 0.110 | 0.219 | 0.129 | 0.108 | 0.087 | 0.102 |
| 2023–2050 | 0.1666 | 0.083 | 0.130 | 0.112 | 0.084 | 0.066 |
| 2051–2075 | 0.0577 | 0.259 | 0.145 | 0.196 | 0.050 | 0.161 |
| 2076–2100 | 0.0610 | 0.387 | 0.182 | 0.177 | 0.049 | 0.177 |
Publisher’s Note: MDPI stays neutral with regard to jurisdictional claims in published maps and institutional affiliations. |
© 2022 by the authors. Licensee MDPI, Basel, Switzerland. This article is an open access article distributed under the terms and conditions of the Creative Commons Attribution (CC BY) license (https://creativecommons.org/licenses/by/4.0/).
Share and Cite
Yan, Y.; Wang, H.; Li, G.; Xia, J.; Ge, F.; Zeng, Q.; Ren, X.; Tan, L. Projection of Future Extreme Precipitation in China Based on the CMIP6 from a Machine Learning Perspective. Remote Sens. 2022, 14, 4033. https://doi.org/10.3390/rs14164033
Yan Y, Wang H, Li G, Xia J, Ge F, Zeng Q, Ren X, Tan L. Projection of Future Extreme Precipitation in China Based on the CMIP6 from a Machine Learning Perspective. Remote Sensing. 2022; 14(16):4033. https://doi.org/10.3390/rs14164033
Chicago/Turabian StyleYan, Yilin, Hao Wang, Guoping Li, Jin Xia, Fei Ge, Qiangyu Zeng, Xinyue Ren, and Linyin Tan. 2022. "Projection of Future Extreme Precipitation in China Based on the CMIP6 from a Machine Learning Perspective" Remote Sensing 14, no. 16: 4033. https://doi.org/10.3390/rs14164033
APA StyleYan, Y., Wang, H., Li, G., Xia, J., Ge, F., Zeng, Q., Ren, X., & Tan, L. (2022). Projection of Future Extreme Precipitation in China Based on the CMIP6 from a Machine Learning Perspective. Remote Sensing, 14(16), 4033. https://doi.org/10.3390/rs14164033