Abstract
As an important part of the Earth’s environmental system, sandy soils are particularly sensitive to changes in the climatic environment. As one of the four major desert regions in China, the MuUs desert has transformed from a desert to an oasis after more than half a century of ecological management. In this paper, we analyzed the spatial and temporal patterns of surface albedo, evapotranspiration, and fraction vegetation cover in the MuUs desert based on the Global Land Surface Satellite (GLASS) product with high spatial and temporal resolution and assessed the relationships between their variability and snow cover, air temperature, and precipitation. It is of great significance to understand the effect of desertification control and climate change after the conversion of land surface types in the MuUs region. The results show that the desertification control in the MuUs area has achieved remarkable results since 1982. The fraction vegetation coverage of the MuUs desert showed a significant increasing trend, with an interannual change rate of 1.32% each decade−1. The surface albedo of MuUs desert decreased significantly. Affected by vegetation and snow cover, it was lower in summer and higher in winter. The evapotranspiration showed a significant upward trend, higher in summer and lower in winter, which is significantly correlated with the changes in surface albedo, air temperature, and vegetation. In addition, the local-scale biophysical effects caused by vegetation change have influenced the climate of the MuUs region, manifested as the increase in precipitation and air temperature. In general, with the support of relevant policies and human construction projects, the overall ecological environment in the MuUs desert is developing in a good way.
1. Introduction
As an important component of terrestrial ecosystems, changes in vegetation affect the exchange of energy, mass, and momentum between the land surface and the atmosphere [1,2,3,4,5] and play a key role in regulating surface energy balance and global climate change. Surface albedo and evapotranspiration are important parameters affecting the interaction between the surface and the atmosphere and monitoring the surface energy budget [6,7], as well as key quantities for studying local or global climate change. Surface albedo is defined as the ratio of reflected solar radiation to incident solar radiation [8], which is a capricious factor of the earth–atmosphere system. Evapotranspiration is a key variable coupled with water, energy availability, and vegetation coverage [7], and also an important part of the surface energy budget and hydrological cycle [7,9]. Studies over the past 40 years have shown that surface albedo and evapotranspiration have significant annual, monthly, and seasonal variability due to the influence of surface structure, meteorological conditions, and atmospheric factors [8,10,11]. For example, since 1982, increased global vegetation has elevated evapotranspiration and reduced surface albedo, resulting in a net cooling impact on the Earth [12]. From 1966 to 2005, the annual variation trend of evapotranspiration in the western part of Iran showed a significant positive trend. The increasing trend of evapotranspiration in winter and summer was stronger than that in spring and autumn, and the change in evapotranspiration in February was the most significant [13]. From 1982 to 2015, the annual mean surface albedo of the Tibetan Plateau showed a slight downward trend [14], and its seasonal pattern varied with the changes in altitude, land surface heterogeneity, and land cover, generally showing a larger surface albedo in winter and a smaller surface albedo in summer [15]. Therefore, it is necessary to analyze the changes in surface albedo and evapotranspiration according to the changes in surface structure.
Biophysical effects at the local scale are important for climate change after land use conversion in semi-arid regions [16]. As one of the four major desert regions in China, the MuUs desert has also been a typical fragile ecological zone in northwest China since the early Quaternary [17]. The desert is located between Yulin District, Shaanxi Province, and Ordos City, Inner Mongolia Autonomous Region (Figure 1). Its geographical coordinates range from 37°27.5′ N to 39°22.5′ N and 107°20′ E to 111°30′ E, with a total area of 42,200 square kilometers. The average annual air temperature is approximately 6 °C to 8 °C, and the annual precipitation is approximately 250mm to 400mm, mainly affected by an arid and semi-arid climate and sensitive to climate change [18]. The MuUs region was once fertile agricultural land in the pre-Qin and Qin and Han dynasties. However, due to unreasonable reclamation and destruction by humans, drifting sands gradually emerged and expanded. Over time, the MuUs area had developed a desert under the combined effect of man and nature. As the desertification in the MuUs region intensified during the 20th century, the Chinese government began to implement a series of ecological projects to counteract the desertification in 1959, such as restoring farmland to forests or grassland, and planting trees. By 2020, it was reported that 93.24% of the sandy area in the MuUs region had been re-vegetated, which means that MuUs will be completely transformed from a desert to an oasis. Most of the previous studies on the MuUs desert have focused on its environmental evolution [19,20,21] and environmental change [22,23,24], and fewer studies have analyzed the spatial and temporal changes in land surface characteristic parameters based on remote sensing. Under the background of the accelerating global climate change, it is of great significance to study the spatio-temporal variation characteristics of the surface albedo and evapotranspiration of the MuUs desert in recent decades in correlation with climate change, as well as the significant land surface type conversion.
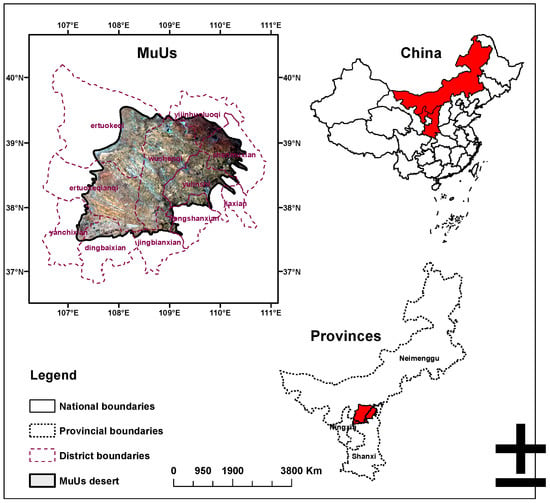
Figure 1.
Location of the study area.
Currently, satellite remote sensing is the most effective means to acquire a large amount of data to investigate environmental changes on a global scale and understand the impacts on local ecosystems. However, with the increase in extreme climate on the global scale in recent years, there is more demand for remote sensing products in the research of climate systems. For example, surface albedo products with an absolute accuracy of 0.02–0.03 are usually required in the study of global or regional climate change [25,26]. Though several international space agencies produce high-level land products from different satellite observations, a major limitation of these products is their short temporal coverage, due to the fact that they are usually generated from observations made by a specific satellite sensor that has a limited life span [27]. To this end, many researchers and teams actively use a series of different algorithms to develop and produce long-term sequences and high-spatial-resolution remote sensing products that can meet research needs. Production of the Global Land Surface Satellite (GLASS) product suite began in 2009 with five initial products, and continued development has led to more than a dozen products with improved accuracies and qualities over previous versions of the same products, as well as other comparable products [27]. In view of the problem that the original satellite remote sensing data are not covered globally, the production team of GLASS products developed a suite of algorithms using multi-source remote sensing data and exploiting the temporal pattern of surface parameters to overcome the limitation in the time range and cloud contamination in promoting the spatio-temporal complete and continuous products. In addition, an integrated algorithm combining deep learning with a physical model was used to overcome the uncertainty of the single model for evapotranspiration. Therefore, GLASS has an advantage in the trend analysis of surface parameters such as surface albedo, evapotranspiration, and fraction vegetation coverage over a long time series.
The main purpose of this paper is to introduce the annual, monthly, and seasonal variation characteristics of fraction vegetation coverage, surface albedo, and evapotranspiration of the MuUs desert based on GLASS products in the 1982–2020 time range, and analyze the relationship between the changes in surface albedo, evapotranspiration, fraction vegetation coverage, snow cover, air temperature, and precipitation, so as to understand the effectiveness of desertification control and the changes in surface status in the MuUs area. In addition, we attempted to analyze the surface parameters of the MuUs desert in different seasons to explore the main driving factor for changes in surface parameters. The paper is organized as follows. First, the dataset, as well as the statistical methods used in this paper, is introduced. Then, the results of the statistics of surface parameters are presented, and a discussion section follows to elaborate on the findings of our analysis. Finally, we summarized the conclusions of this paper.
2. Data and Method
2.1. Datasets
GLASS remote sensing data products and meteorological data were used in this study, with the details presented in Table 1.

Table 1.
The datasets used in this study.
2.1.1. GLASS Products
Production of the Global Land Surface Satellite (GLASS) product suite began in 2009 and is still in continuous development. These products are generated from the Advanced Very-High-Resolution Radiometer (AVHRR) and Moderate-Resolution Imaging Spectroradiometer (MODIS) satellite data and have unique features including long-term temporal coverage (many from 1981 to the present), high spatial resolutions of the surface radiation products, and spatial continuities without missing pixels.
The GLASS surface albedo, evapotranspiration, and fraction vegetation coverage snow cover products used in this study can be obtained from http://www.geodata.cn (accessed on 2 December 2021) and also from http://www.glass.umd.edu (accessed on 6 March 2022). They have various spatial resolutions such as 0.05°, 1 km, and 500 m, and their time span is as long as 40 years as other GLASS remote sensing products. According to relevant studies and verifications, they have the characteristics of good time sequence consistency, high spatial resolution, long time series, and gapless spatio-temporal distribution [27,28,29]. GLASS products have been evaluated in previous studies using either direct validation or product cross-comparisons. Among them, the GLASS shortwave albedo products were validated by tower-based observations from 53 spatially homogeneous global sites. The result shows that the RMSE was 0.052 for all matched samples and was reduced to 0.037 after screening out all the cloudy pixels [27]. The cross-comparison with the MODIS surface albedo product (C6 MCD43A3) shows that the deviation between them is less than 0.01 [30]. In addition, many other validation efforts have demonstrated that the quality of GLASS surface albedo data is adequate for scientific applications [25,28,31,32]. Direct testing of the GLASS evapotranspiration product was performed using ground measurements from 240 eddy covariance flux tower sites (RMSE = 35.3 W/m2, R2 = 0.75), indicating the better accuracy of GLASS evapotranspiration products [27]. In addition, the cross-comparison results of five major satellite evapotranspiration products in the Heihe River Basin of China also show the accuracy of GLASS evapotranspiration products [33]. The GLASS fraction vegetation cover product has also been evaluated by direct validation and product cross-comparisons. Direct verification results showed that the performance of the GLASS fraction vegetation cover product (RMSE = 0.145, R2 = 0.834) was slightly superior to that of the popular long-term GEOV1-FVC product (RMSE = 0.174, R2 = 0.799) [29]. In addition, other validation experiments using high-resolution satellite data and ground measurement estimates also show that the GLASS fraction vegetation cover data have good quality and can fully meet the precision requirements of scientific research [34,35].
2.1.2. Meteorological Datasets
Meteorological data such as air pressure, air temperature, sunshine, humidity, precipitation, and near-surface wind speed came from three meteorological observation stations in MuUs region, downloaded from the China Meteorological Data Service Center (http://data.cma.cn (accessed on 10 May 2022)). The air temperature and precipitation data, which are in the form of the hourly average and range from 1982 to 2020, were adopted in this study to indicate the long-term trends and anomalous changes in the local climate. The units of air temperature and precipitation are °C and mm, respectively.
2.2. Analysis Methods
2.2.1. Preprocess
The preprocessing of these products in this study includes the calculation of the true value of the surface albedo and spatial resampling. The true value of the surface albedo is the surface albedo in the blue-sky condition, but the GLASS albedo product provides the black-sky albedo and the white-sky albedo, which represent the albedo under fully direct and fully diffuse solar radiation conditions, respectively. The blue-sky surface albedo is obtained by combining the black-sky albedo and the white-sky albedo, weighted by the proportion of scattered light in the total downward solar shortwave light, and is expressed as follows:
where is the proportion of scattered light; is the solar zenith angle at the local midday hour; is the blue-sky albedo (i.e., the true surface albedo); is the black-sky albedo; and is the white-sky albedo.
In order to align the spatial resolution of evapotranspiration with fraction vegetation coverage for 2001–2020 to analyze their correlation, this paper resamples the evapotranspiration data with a spatial resolution of 1 km to a spatial resolution of 500 m using the nearest-neighbor resampling method. In addition, the spatial means and standard deviations of the long time series were calculated for the study area, and temporal means in the monthly and annual resolution were calculated for every 500 m or 0.05 DEG pixel, for all GLASS products.
2.2.2. Long-Term Change Trend
When there are unknown disturbances in the time series, the Theil–Sen Median estimator can produce more stable results than ordinary linear regression. So, in this study, the Theil-Sen Median method was adopted to calculate the trend of surface albedo, evapotranspiration, and fraction vegetation coverage in the MuUs desert, and the Mann–Kendall test was used to test the time series trend of the three surface parameters, and finally, the time variation patterns of surface albedo, evapotranspiration, and fraction vegetation coverage in the MuUs area were obtained. The formulas were as follows:
where and are the annual mean values of the surface parameters in year j and year i, respectively, S is the test statistic, n is the length of the time series, and Z is the test significance for the trend test. A β greater than 0 indicates an increasing trend for the surface parameters, and vice versa for a decreasing trend. This paper uses a bilateral trend test, where the trend is insignificant when at a given significance level (α= 0.05); otherwise, the trend is significant.
2.2.3. De-Seasonalized Anomalies
In this study, we calculated the anomaly values of the surface albedo, evapotranspiration, and fraction vegetation coverage in the MuUs area, and obtained the interannual variation trend of them after removing the seasonal cycle. For example, the anomaly of the monthly mean surface albedo is defined as:
where ∆α(yy,mm) is the de-seasonal anomaly of the surface parameter in month mm of year yy, α(yy,mm) is the data value of the surface parameter in month mm of year yy, and (mm) is the multi-year average of the surface parameter in month mm.
2.2.4. Correlation Analysis
This study analyzed the temporal and spatial correlation between the surface albedo, fraction vegetation coverage, and evapotranspiration, and calculated the correlation coefficient as follows:
For the correlation in the temporal dimension, i represents the year index, and and are the observations in year i. For the correlation in the spatial dimension, i represents the image pixel, and and are the observations in pixel i.
2.2.5. Multi-Variant Linear Regression Analysis
Multi-variant linear regression is an analytical method to describe the dependence of one dependent variable and several independent variables. In this paper, the multi-variant linear regression method was used to calculate the standardized partial regression coefficient, and the degree of importance for each influencing factor (fraction vegetation coverage, snow cover, precipitation, and air temperature) on the surface albedo and evapotranspiration was obtained.
where is the standardized independent variable, is the independent variable, and y is the dependent variable. is the constant term, is the standardized partial regression coefficient, and is the random error.
3. Results
3.1. Temporal Variation Trend of Surface Parameters in Recent 40 Years
Desertification control in the MuUs area is one sub-project in the Three-North Shelter Forestation Project. Its capital investment consists of national investment and local investment in two parts. Since 1978, the investment for the treatment of the MuUs desert has increased year by year (Figure 2a), reaching the highest value in the period from 2011 to 2020, with government investment reaching 14.26 billion yuan and local investment reaching 9.46 billion yuan. From the annual change in fraction vegetation coverage in the MuUs desert, it can be found that the annual mean fraction vegetation coverage of the MuUs desert has generally shown a significant upward trend over the past 39 years, reaching a peak (0.07) in 2018, with a multi-year average of approximately 0.03 and an interannual change rate of 1.32% per decade−1 (p < 0.01). It can be seen that the desertification control in the MuUs area has achieved remarkable results, and the great success achieved is inseparable from the support of relevant policies and the implementation of human construction projects.

Figure 2.
Changes in environmental management funding (a) and fraction vegetation coverage (b) of the MuUs desert over time from 1982 to 2020.
Figure 3 shows the annual change in the surface albedo and evapotranspiration in the MuUs desert. It can be found from Figure 3a that the annual mean surface albedo of the MuUs desert has shown a significant decreasing trend over the past 39 years, with an average of 0.23 and an interannual change rate of −1.64% decade−1 (p < 0.01), which is mainly related to the change in surface cover in the region. The trend of surface albedo changes in the MuUs desert shows a different pattern in different periods. In general, the change in surface albedo ranges from 0.19 to 0.26, with a peak value (approximately 0.26) in 1983 and a trough value (approximately 0.19) in 2019. Before 2002, the surface albedo level was higher than the mean of the population. After 2002, the surface albedo level was lower than the mean of the population except in 2005, 2006, and 2008. Among them, the abnormal changes in 2020 were the most significant, which may be affected by snow cover (Figure 4f). Figure 3b shows the annual change in evapotranspiration in the MuUs desert. It can be found that the annual mean evapotranspiration of the MuUs desert shows a significant upward trend overall, with an average of 28.60 mm. From 1982 to 2001, the evapotranspiration of the MuUs desert was low and below the total mean, and from 2002 to 2018, the evapotranspiration of the MuUs desert was higher than the total average and showed a gradual upward trend, reaching a peak in 2017 (39.99 mm).

Figure 3.
Annual change in surface albedo (a) and evapotranspiration (b) in MuUs.
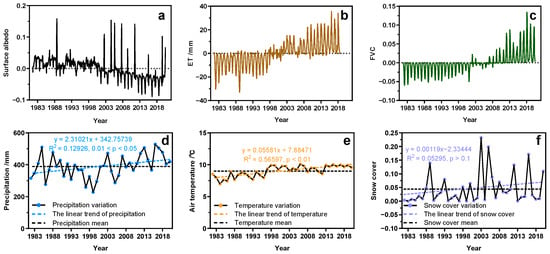
Figure 4.
De-seasonal variation of surface parameters: (a) Surface albedo; (b) evapotranspiration; (c) fraction vegetation cover and changes in meteorological factors; (d) precipitation; (e) air temperature; (f) snow cover in the MuUs desert.
There are seasonal cycles in the long time series of surface parameters, and the de-seasonal anomaly analysis of surface parameters can provide a clearer picture of their trends over time. Figure 4a–c show the de-seasonal anomaly of surface albedo, evapotranspiration, and fraction vegetation coverage in the MuUs desert over the past 39 years. It can be found that the overall change characteristics of surface parameters in the MuUs desert are more apparent after removing seasonal influences. After 2001, the trend of surface albedo, evapotranspiration, and fraction vegetation coverage was significant, which is mainly due to the increase in investment and policy support for the treatment of the MuUs desert (Figure 2a). It can be seen that GLASS products have the characteristics of high temporal resolution and no missing data, which can aptly capture the changes in surface parameters with the changes in relevant policies. To further explain the changes in the three parameters of surface albedo, evapotranspiration, and fraction vegetation coverage in the MuUs desert over time, the annual mean values of precipitation, air temperature, and snow cover in the MuUs desert from 1982 to 2020 are presented in Figure 4e–g. It can be found that the precipitation and air temperature in the MuUs desert generally showed an increasing trend in the last 39 years, with an average of 388.96 mm and 9.00 °C, respectively, and reached a peak in 2016 (528.66 mm) and 2006 (10.09 °C). This is favorable to the growth of vegetation, resulting in higher evapotranspiration and lower surface albedo. The change in snow cover also shows an upward trend in general, with significant stage characteristics and large fluctuations. The increase in snow caused the increase in albedo, imposing an effect opposite to the effect of increasing vegetation, which explains the unstable change pattern in the surface albedo series, e.g., the abnormal fluctuation in 2020. It can be seen that the local-scale biophysical effects brought about by the vegetation changes have influenced the local climate in the MuUs region, as evidenced by the increase in precipitation and air temperature.
Further analysis of the monthly variation of surface parameters in the MuUs desert reveals that the monthly variation of surface albedo in the entire MuUs desert shows a decreasing trend followed by an increasing trend, showing a U-shaped characteristic. From January to August, the surface albedo was influenced by the seasonality of surface snow cover and vegetation cover (Figure 5c,f) and showed a decreasing trend, with the trough value located in August (approximately 0.20). From September to December, the surface albedo showed an upward trend due to solar radiation, changes in surface vegetation cover, and autumn and winter climate, and reached its peak in January (approximately 0.29). The standard deviation of the surface albedo represents the abnormal changes. It can be found that the abnormal changes from April to August are small, while the abnormal changes from September to March are large, which are mainly affected by the snow and melting process (Figure 5f). Figure 5b shows the monthly variation of evapotranspiration in the MuUs desert. It can be seen that the variation of evapotranspiration in the whole MuUs desert shows a trend of rising and then falling, which shows an “inverted U” shape, and the variation trend is opposite to the surface albedo. From January to July, the evapotranspiration of the MuUs desert showed a significant increasing trend and reached a peak (63.16 mm) in July. From August to December, the evapotranspiration of the MuUs desert showed a significant decreasing trend and reached a trough (5.13 mm) in January. Figure 5c shows the monthly variation of fraction vegetation coverage in the MuUs desert, which is consistent with the variation of evapotranspiration, both of which are “inverted U” shapes. The lowest value (0.00) was recorded in February. From January to August, the fraction vegetation coverage of the MuUs desert showed a significant upward trend and peaked in August (0.10), while it showed a significant downward trend from September to December, which was mainly related to the air temperature, precipitation, and the vegetation’s own growth cycle (Figure 5d,e). In addition, by further observing the monthly variation of precipitation, air temperature, and snow cover in the MuUs region, we can find that the monthly variation characteristics of precipitation and air temperature are similar to evapotranspiration and fraction vegetation coverage, and the monthly variation characteristics of snow cover are similar to surface albedo. The precipitation and air temperature reached the highest values in August and July, respectively, which were 94.54 mm and 23.08 °C. The snow cover reached the highest value in February (0.24).
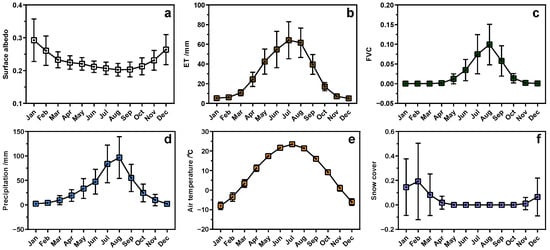
Figure 5.
Monthly variation of surface parameters: (a) Surface albedo; (b) evapotranspiration; (c) fraction vegetation coverage and meteorological factors; (d) precipitation; (e) air temperature; (f) snow cover in MuUs desert (vertical line as standard deviation).
3.2. Spatial Distribution Characteristics of Annual and Seasonal Surface Parameters
Surface parameter products with high spatial resolution were produced after 2000. The advantage of gapless and continuous GLASS products provided convenience and support for exploring the spatial distribution characteristics of surface parameters in the MuUs desert in the last 20 years. Pixel-wise statistical analysis of the average albedo of the MuUs desert in the past 20 years reveals the obvious difference in the spatial distribution of the surface albedo of the MuUs desert, with a higher average albedo of more than 0.20 in the southwest and a lower average albedo of less than 0.17 in the northeast and marginal areas, and the annual average albedo is approximately 0.21 (Figure 6a). Further analysis of the spatial distribution of the multi-year average surface albedo in the MuUs desert in different seasons reveals that the spatial distribution characteristics of the surface albedo in different seasons are consistent with the annual average surface albedo, which is low on the northeastern edge and gradually increases from the northeast to the central southwest. Among the four seasons, surface albedo is high in winter, ranging from 0.28–0.30 in most areas, and low in summer, ranging from 0.11–0.22 overall (Figure 6b–e).
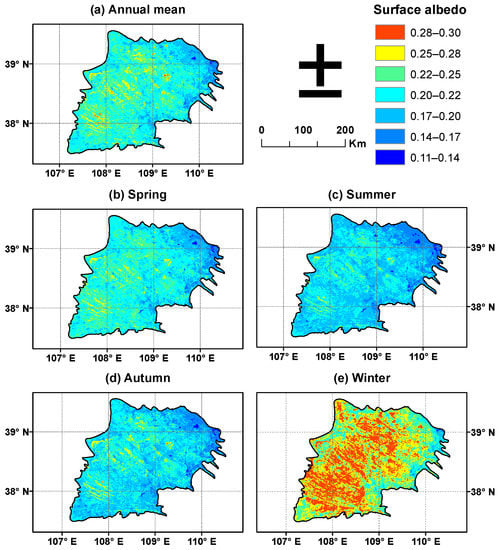
Figure 6.
Annual average and seasonal spatial distribution of surface albedo in the MuUs desert from 2001 to 2020.
Figure 7 shows the spatial variation of mean evapotranspiration in the MuUs desert in the last 20 years. The results show that the spatial distribution of the multi-year average of evapotranspiration in the MuUs desert shows an increasing trend from northwest to southeast (Figure 7a). From south to north, the evapotranspiration of the MuUs desert decreased with the increase in latitude. From east to west, the evapotranspiration of the MuUs desert increases with the decrease in longitude. Further analysis reveals that the spatial variation of evapotranspiration in the MuUs desert is generally consistent in seasons, with the characteristics increasing from northwest to southeast in spring, summer, and autumn, and characteristics are consistent with the distribution of multi-year average values. The magnitude of evapotranspiration shows the obvious difference in different seasons. In general, it is high in summer, with a magnitude between 30 and 70 mm, and low in winter, with an overall magnitude between 0 and 10 mm. Compared with spring, the distribution range of low values of evapotranspiration in autumn is larger in the northwest direction, and the area of high values in the south is also larger (Figure 7b–e).
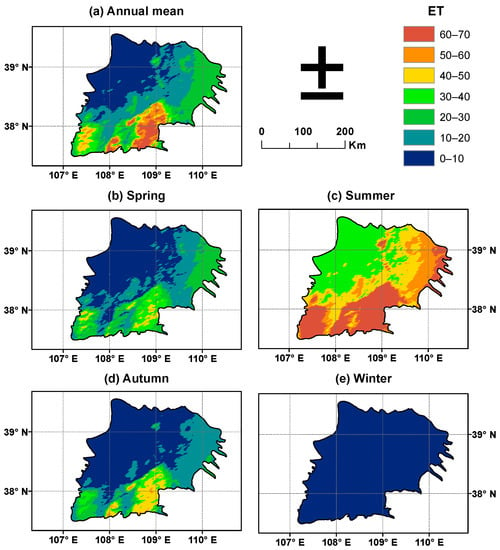
Figure 7.
As in Figure 6, except for evapotranspiration.
From 2001 to 2020, the spatial distribution of fraction vegetation coverage in the MuUs desert showed the characteristics of high in the southwest and low in the northeast (Figure 8a). The fraction vegetation coverage in the southwest ranged from 0.13 to 0.19, and in the northeast ranged from 0.00 to 0.06. The fraction vegetation coverage area of the whole MuUs desert reached 95.70%. In terms of seasons, fraction vegetation coverage in the MuUs desert is higher in summer and autumn, lower in winter and spring, and reaches the highest in summer and the lowest in winter, which is caused by climatic conditions and the seasonal growth of plants themselves.
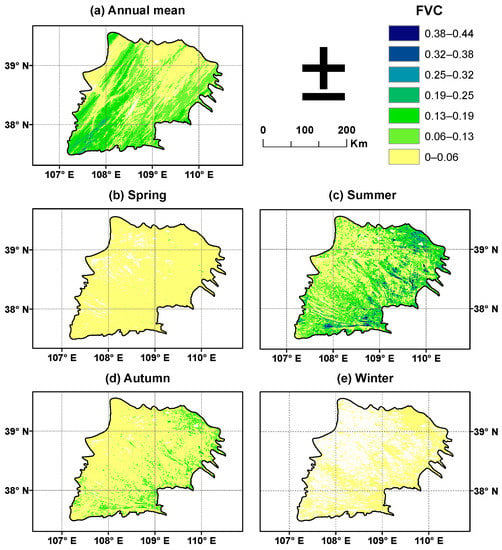
Figure 8.
As in Figure 6, except for fraction vegetation coverage.
Analyzing the spatial distribution of three surface parameters, namely surface albedo, evapotranspiration, and fraction vegetation coverage, in different seasons from 2001 to 2020, we found that the surface albedo was lower and evapotranspiration was higher in areas with more vegetation cover in summer, while the surface albedo was higher and evapotranspiration was lower in areas with less vegetation cover in winter. This suggests that there may be a correlation between fraction vegetation coverage, surface albedo, and evapotranspiration. In order to further analyze the correlation between the three surface parameters of surface albedo, evapotranspiration, and fraction vegetation coverage in the MuUs desert, the rate of change and significance of the three parameters were calculated separately from 2001 to 2020. Figure 9 shows the spatial distribution of the rate of change (Figure 9a surface albedo, Figure 9b evapotranspiration, and Figure 9c fraction vegetation coverage) and the degree of significance (Figure 9d surface albedo, Figure 9e evapotranspiration, and Figure 9f fraction vegetation coverage) of the surface parameters in the MuUs desert. It can be seen that the significance of the surface albedo, evapotranspiration, and fraction vegetation coverage change in line with each other, with significant increases in evapotranspiration and decreases in surface albedo in areas with significantly increased vegetation cover. Specifically, areas with large decreases in surface albedo have rapid increases in evapotranspiration and rapid growth in vegetation cover, and vice versa.
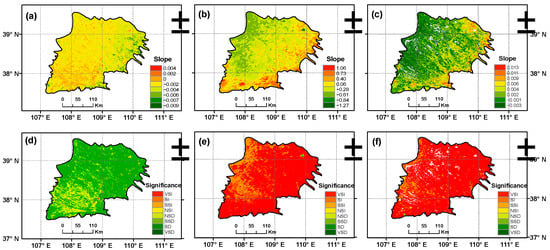
Figure 9.
Spatial distribution of the rate of change in surface parameters: (a) Surface albedo, (b) evapotranspiration, (c) fraction vegetation coverage and the degree of significance, (d) surface albedo, (e) evapotranspiration, (f) fraction vegetation coverage in the MuUs desert from 2001 to 2020; the VSI stands for very significant increase; SI stands for significant increase; SSI stands for micro significant increase; NSI stands for no increase; NSD stands for no decrease; SSDs represent a slightly significant decrease; SD stands for significant decrease; VSD stands for very significant decrease.
3.3. Correlation Analysis between Surface Parameters and Influencing Factors
Figure 10 shows the spatial distribution of the correlation coefficients between two parameters, surface albedo and evapotranspiration, and fraction vegetation coverage in the time dimension. It can be found that surface albedo and fraction vegetation coverage are significantly negatively correlated in most areas of the MuUs desert (Figure 10a), and positive correlations are found between surface albedo and fraction vegetation coverage in the northwestern fringe area, and southeastern and southwestern small areas. There was a non-significant negative correlation between evapotranspiration and fraction vegetation coverage in the southeastern region and a small part of the southwestern region of the MuUs desert, and a significant positive correlation between evapotranspiration and fraction vegetation coverage in most of the region (Figure 10b). Figure 11 shows the correlation between two parameters, surface albedo and evapotranspiration, and fraction vegetation coverage over time. It can be found that the significant negative correlation presented between surface albedo and fraction vegetation coverage decreases with time, and the positive correlation between evapotranspiration and fraction vegetation coverage increases with time.
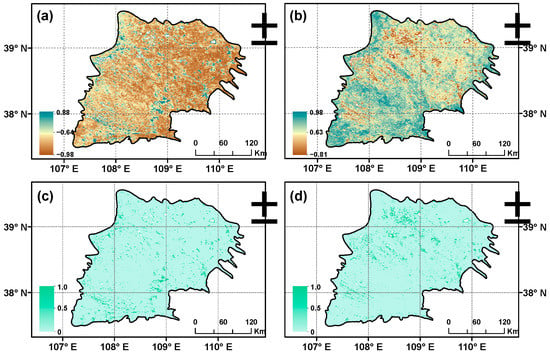
Figure 10.
Temporal correlation coefficient (a,b) and significance level (c,d) between surface albedo, evapotranspiration, and fraction vegetation coverage.
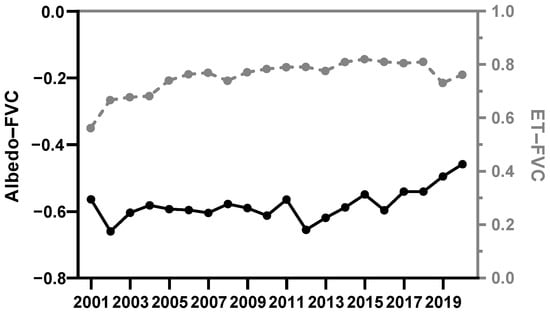
Figure 11.
Spatial correlation coefficient between surface albedo, evapotranspiration, and fraction vegetation coverage (p < 0.01).
The correlations among surface albedo, evapotranspiration, fraction vegetation coverage, snow cover, precipitation, and air temperature were analyzed by multi-variant linear regression in different seasons to obtain the magnitude of each influencing factor on evapotranspiration and surface albedo (Figure 12). The results showed that evapotranspiration was significantly and positively correlated with vegetation, precipitation, and air temperature in spring, summer, and autumn, and negatively correlated with surface albedo; in winter, it was significantly and positively correlated with surface albedo, snow cover, vegetation, precipitation, and air temperature. In spring, summer, and autumn, the surface albedo decreased significantly with the increase in fraction vegetation coverage, while the evapotranspiration increased with the increase in fraction vegetation coverage, likely because the increase in evapotranspiration caused by the increase in fraction vegetation coverage overwhelmed the decrease in evapotranspiration caused by the decrease in surface albedo, so the evapotranspiration was negatively correlated with surface albedo. In winter, the snow cover increased, the fraction vegetation coverage decreased, and the surface albedo increased, likely because the increase in evapotranspiration caused by the snow cover overwhelmed the decrease in evapotranspiration caused by the decrease in fraction vegetation coverage, so the evapotranspiration was positively correlated with surface albedo in winter. Surface albedo was significantly negatively correlated with vegetation, precipitation, and air temperature, and significantly positively correlated with snow cover. Fraction vegetation coverage was significantly and positively correlated with precipitation and air temperature.

Figure 12.
The degree of importance of each influence factor (A stands for surface albedo; F stands for fraction vegetation coverage; S stands for snow cover; P stands for precipitation; T stands for Air temperature) on evapotranspiration and surface albedo in different seasons.
In spring, the evapotranspiration of the MuUs desert is mainly influenced by air temperature and vegetation; in summer, it is mainly influenced by surface albedo; in autumn, it is mainly influenced by air temperature, precipitation, and vegetation, in descending order of importance: air temperature > vegetation > precipitation; in winter, it is mainly influenced by vegetation, snow cover and air temperature, in descending order of importance: snow cover > vegetation > air temperature. In spring, summer, and autumn, it is mainly vegetation that affects the surface albedo change. In winter, the fraction vegetation coverage decreases sharply, and the surface albedo is mainly affected by snow cover, air temperature, and precipitation, in descending order of importance: snow cover > air temperature > precipitation. The vegetation cover of the MuUs desert is mainly influenced by air temperature in spring, autumn, and winter, and precipitation has more influence on vegetation than the air temperature in summer.
4. Discussion
4.1. Data Uncertainty
Uncertainty assessment of remote sensing products is very important for climate research. On the one hand, it is helpful for ensuring the accuracy, stability, and consistency of remote sensing products in climate change research. On the other hand, it can help characterize uncertainties and errors in climate simulations. However, in the process of remote sensing data acquisition affected by the sensor limitation, atmospheric radiation transmission characteristics, and other factors, it is inevitable that remote sensing products have uncertainties. For example, due to the solar elevation angle and the weather characteristics of the study area, the uncertainty of remote sensing data products in winter is greater than that in other seasons. The validation of GLASS products using field measurements remains challenging because of the lack of flux observation sites in the study area. In addition, surface parameter products with higher spatial resolution were produced only in 2000, and the input data used before 2000 were AVHRR data, which had low spatial resolution and poor accuracy. Land surface parameters and their correlations with influencing factors may be affected by uncertainties in data from different sources, such as meteorological observations used to estimate snow cover, and on-site observations of air temperature and precipitation. The impact of these uncertainties is hard to quantify. All these will affect the spatio-temporal analysis results of the study area.
4.2. Relationship between the Change in Surface Parameters and Influencing Factors
According to the monthly variation characteristics of surface parameters in the MuUs desert (Figure 5), it can be concluded that the surface albedo was affected by the phenology of surface snow cover and vegetation cover (Figure 5c,f) and showed a downward trend from January to August. Due to the influence of the solar elevation angle, vegetation growth cycle, and autumn and winter climate, it shows a rising trend from September to December. The evapotranspiration increased significantly from January to July due to the influence of surface albedo, vegetation, and air temperature. Affected by air temperature and snow cover, it showed a significant downward trend from August to December. Fraction vegetation coverage showed a significant upward trend from January to August, peaking in August (0.10), and a significant downward trend from September to December, which was mainly related to air temperature, precipitation, and the vegetation’s own physiology (Figure 5d,e). However, changes in surface albedo also affect evapotranspiration, vegetation, air temperature, precipitation, and snow cover. For example, lower surface albedo causes the earth’s surface to absorb more solar radiation, leading to higher air temperature and faster snow melt, which in turn leads to lower surface albedo. The vegetation turns green over temperature-limited areas, with prolonged growth periods, increasing evapotranspiration and decreasing surface albedo, etc. These feedback processes and results need to be quantified by building models.
5. Conclusions
In the context of the continuous increase in global climate change, the change in land surface substratum caused by human activities is one of the main reasons for the change in surface parameters in the MuUs desert. In this paper, we analyzed the spatio-temporal variation of evapotranspiration, surface albedo, and fraction vegetation coverage in the MuUs desert based on the GLASS remote sensing data products in the time range of 1982–2020. We found that the overall fraction vegetation coverage of the MuUs desert showed a significant upward trend since 1982, with an interannual variability of 1.32% per decade−1 (p < 0.01). The surface albedo of the MuUs desert showed a significant decreasing trend and the evapotranspiration showed a significant increasing trend. They all have obvious characteristics of annual, monthly, and seasonal changes. Along with the change i surface vegetation cover status, the air temperature and precipitation in the study area showed an upward trend. After removing seasonal effects, the GLASS product aptly captures the changes in surface parameters in response to relevant policy changes. It can be seen that the GLASS products can aptly reveal the changes in surface parameters in the MuUs desert, which clearly reflects the remarkable effectiveness of desertification control in the MuUs region.
Spatially, the differences between surface parameters in summer and winter were most obvious, with surface albedo low in summer and high in winter, and evapotranspiration and fraction vegetation coverage high in summer and low in winter. Since 2001, the most significant upward trend in evapotranspiration and fraction vegetation coverage and the most significant downward trend in surface albedo were observed in the northeastern part of the MuUs desert. In spring, the evapotranspiration of the MuUs desert is mainly influenced by air temperature and vegetation; in summer, it is mainly influenced by surface albedo; in autumn and winter, it is mainly influenced by air temperature, precipitation, and vegetation. In spring, summer, and autumn, it is mainly vegetation that affects the surface albedo change. In winter, the vegetation cover decreases sharply, and the surface albedo is mainly affected by snow, air temperature, and precipitation. The fraction vegetation coverage of the MuUs desert is mainly influenced by air temperature in spring and autumn, and precipitation has more influence on the vegetation than the air temperature in summer.
In general, the advantages of the high spatio-temporal resolution and continuity of GLASS products have facilitated and supported the investigation of the spatial and temporal variability of the surface parameters of the MuUs desert in the past 40 years. With the support of relevant policies and human construction projects, the overall ecological environment of the MuUs desert is developing for the better, and desertification control has achieved great success.
Author Contributions
Conceptualization, Q.L. and X.L.; methodology, M.L. and Q.L.; software, S.Z.; formal analysis, M.L., Q.L. and Y.L.; writing—original draft preparation, M.L. and Y.L.; writing—review and editing, S.Z. All authors have read and agreed to the published version of the manuscript.
Funding
This research was funded by the National Key Research and Development Program of China (NO. 2020YFA0608703) and the Key Program of the National Natural Science Foundation of China (No. 42130104).
Data Availability Statement
Not applicable.
Acknowledgments
The authors would like to thank anonymous reviewers for their valuable comments on the manuscript, which helped improve the quality of the paper.
Conflicts of Interest
The authors declare no conflict of interest.
References
- Dickinson, R.E.; Henderson-Sellers, A.; Rosenzweig, C.; Sellers, P.J. Evapotranspiration models with canopy resistance for use in climate models, a review. Agric. For. Meteorol. 1991, 54, 373–388. [Google Scholar] [CrossRef]
- Bonan, G.B. Comparison of Two Land Surface Process Models Using Prescribed Forcings. J. Geophys. Res. 1994, 99, 25803–25818. [Google Scholar] [CrossRef]
- Guillevic, P.; Koster, R.D.; Suarez, M.J.; Bounoua, L.; Collatz, G.J.; Los, S.O.; Mahanama, S.P.P. Influence of the Interannual Variability of Vegetation on the Surface Energy Balance—A Global Sensitivity Study. J. Hydrometeorol. 2002, 3, 617–629. [Google Scholar] [CrossRef]
- Kang, H.; Xue, Y.; Collatz, G.J. Impact Assessment of Satellite-Derived Leaf Area Index Datasets Using a General Circulation Model. J. Clim. 2007, 20, 993–1015. [Google Scholar] [CrossRef]
- Li, Q.; Xue, Y. Simulated impacts of land cover change on summer climate in the Tibetan Plateau. Environ. Res. Lett. 2010, 5, 15102. [Google Scholar] [CrossRef]
- Wang, Z.; Zhou, H.; Wan, H.; Wang, Q.; Fan, W.; Ma, W.; Wang, J. Identifying Spatial and Temporal Characteristics of Land Surface Albedo Using GF-1 WFV Data. Remote Sens.-Basel 2021, 13, 4070. [Google Scholar] [CrossRef]
- Jiang, F.; Xie, X.; Liang, S.; Wang, Y.; Zhu, B.; Zhang, X.; Chen, Y. Loess Plateau evapotranspiration intensified by land surface radiative forcing associated with ecological restoration. Agric. For. Meteorol. 2021, 311, 108669. [Google Scholar] [CrossRef]
- Dickinson, R.E. Land Surface Processes and Energy Balance. Adv. Geophys. 1983, 25, 305–353. [Google Scholar]
- Xu, T.; Liu, S.; Xu, L.; Chen, Y.; Jia, Z.; Xu, Z.; Nielson, J. Temporal Upscaling and Reconstruction of Thermal Remotely Sensed Instantaneous Evapotranspiration. Remote Sens.-Basel 2015, 7, 3400–3425. [Google Scholar] [CrossRef]
- Wang, L.; Good, S.P.; Caylor, K.K. Global synthesis of vegetation control on evapotranspiration partitioning. Geophys. Res. Lett. 2014, 41, 6753–6757. [Google Scholar] [CrossRef]
- Huo, Z.; Dai, X.; Feng, S.; Kang, S.; Huang, G. Effect of climate change on reference evapotranspiration and aridity index in arid region of China. J. Hydrol. 2013, 492, 24–34. [Google Scholar] [CrossRef]
- Zeng, Z.; Piao, S.; Li, L.Z.X.; Zhou, L.; Ciais, P.; Wang, T.; Li, Y.; Lian, X.; Wood, E.F.; Friedlingstein, P.; et al. Climate mitigation from vegetation biophysical feedbacks during the past three decades. Nat. Clim. Chang. 2017, 7, 432–436. [Google Scholar] [CrossRef]
- Tabari, H.; Marofi, S.; Aeini, A.; Talaee, P.H.; Mohammadi, K. Trend analysis of reference evapotranspiration in the western half of Iran. Agric. For. Meteorol. 2011, 151, 128–136. [Google Scholar] [CrossRef]
- Pang, G.; Chen, D.; Wang, X.; Lai, H. Spatiotemporal variations of land surface albedo and associated influencing factors on the Tibetan Plateau. Sci. Total Environ. 2022, 804, 150100. [Google Scholar] [CrossRef] [PubMed]
- Lin, X.; Wen, J.; Liu, Q.; You, D.; Wu, S.; Hao, D.; Xiao, Q.; Zhang, Z.; Zhang, Z. Spatiotemporal Variability of Land Surface Albedo over the Tibet Plateau from 2001 to 2019. Remote Sens.-Basel 2020, 12, 1188. [Google Scholar] [CrossRef]
- Zhao, W.; Hu, Z.; Li, S.; Guo, Q.; Liu, Z.; Zhang, L. Comparison of surface energy budgets and feedbacks to microclimate among different land use types in an agro-pastoral ecotone of northern China. Sci. Total Environ. 2017, 599, 891–898. [Google Scholar] [CrossRef]
- Zhang, D.; Deng, H. Historical human activities accelerated climate-driven desertification in China’s Mu Us Desert. Sci. Total Environ. 2020, 708, 134771. [Google Scholar] [CrossRef]
- Zhang, M.; Wang, K.; Liu, H.; Zhang, C.; Yue, Y.; Qi, X. Effect of ecological engineering projects on ecosystem services in a karst region: A case study of northwest Guangxi, China. J. Clean. Prod. 2018, 183, 831–842. [Google Scholar] [CrossRef]
- Liu, X.; Lu, R.; Du, J.; Lyu, Z.; Wang, L.; Gao, S.; Wu, Y. Evolution of Peatlands in the Mu Us Desert, Northern China, Since the Last Deglaciation. J. Geophys. Res. Earth Surf. 2018, 123, 252–261. [Google Scholar] [CrossRef]
- Wang, X.; Chen, F.H.; Dong, Z.; Xia, D. Evolution of the southern Mu US desert in north China over the past 50 years: An analysis using proxies of human activity and climate parameters. Land Degrad. Dev. 2005, 16, 351–366. [Google Scholar] [CrossRef]
- Ding, Z.; Sun, J.; Liu, D. Stepwise advance of the Mu Us Desert since late Pliocene; evidence from a red clay-loess record. Chin. Sci. Bull. 1999, 44, 1211–1214. [Google Scholar] [CrossRef]
- Li, J.; Wu, W.; Fu, X.; Jiang, J.; Liu, Y.; Zhang, M.; Zhou, X.; Ke, X.; He, Y.; Li, W.; et al. Assessment of the Effectiveness of Sand-Control and Desertification in the Mu Us Desert, China. Remote Sens.-Basel 2022, 14, 837. [Google Scholar] [CrossRef]
- Wen, P.; Wang, N.; Wang, Y.; Huang, Y.; Cheng, H.; He, T. Fluvial incision caused irreversible environmental degradation of an ancient city in the Mu Us Desert, China. Quat. Res. 2021, 99, 1–13. [Google Scholar] [CrossRef]
- Li, J.; Zhao, Y.; Liu, H.; Su, Z. Sandy desertification cycles in the southwestern Mu Us Desert in China over the past 80 years recorded based on nebkha sediments. Aeolian Res. 2016, 20, 100–107. [Google Scholar] [CrossRef]
- He, T.; Liang, S.; Song, D. Analysis of global land surface albedo climatology and spatial-temporal variation during 1981–2010 from multiple satellite products. J. Geophys. Res. Atmos. 2014, 119, 10281–10298. [Google Scholar] [CrossRef]
- Sellers, P.J.; Meeson, B.W.; Hall, F.G.; Asrar, G.; Murphy, R.E.; Schiffer, R.A.; Bretherton, F.P.; Dickinson, R.E.; Ellingson, R.G.; Field, C.B.; et al. Remote sensing of the land surface for studies of global change: Models—Algorithms—Experiments. Remote Sens. Environ. 1995, 51, 3–26. [Google Scholar] [CrossRef]
- Liang, S.; Cheng, J.; Jia, K.; Jiang, B.; Liu, Q.; Xiao, Z.; Yao, Y.; Yuan, W.; Zhang, X.; Zhao, X.; et al. The Global Land Surface Satellite (GLASS) Product Suite. Bull. Am. Meteorol. Soc. 2021, 102, E323–E337. [Google Scholar] [CrossRef]
- He, T.; Liang, S.; Wang, D.; Shi, Q.; Tao, X. Estimation of High-Resolution Land Surface Shortwave Albedo from AVIRIS Data. IEEE J. Sel. Top. Appl. Earth Obs. Remote Sens. 2014, 7, 4919–4928. [Google Scholar] [CrossRef]
- Jia, K.; Yang, L.; Liang, S.; Xiao, Z.; Zhao, X.; Yao, Y.; Zhang, X.; Jiang, B.; Liu, D. Long-Term Global Land Surface Satellite (GLASS) Fractional Vegetation cover Product Derived from MODIS and AVHRR Data. IEEE J. Sel. Top. Appl. Earth Obs. Remote Sens. 2019, 12, 508–518. [Google Scholar] [CrossRef]
- Liu, Q.; Wang, L.; Qu, Y.; Liu, N.; Liu, S.; Tang, H.; Liang, S. Preliminary evaluation of the long-term GLASS albedo product. Int. J. Digit. Earth 2013, 6, 69–95. [Google Scholar] [CrossRef]
- Feng, Y.; Liu, Q.; Qu, Y.; Liang, S. Estimation of the Ocean Water Albedo from Remote Sensing and Meteorological Reanalysis Data. IEEE Trans. Geosci. Remote Sens. 2016, 54, 850–868. [Google Scholar] [CrossRef]
- He, T.; Liang, S.; Yu, Y.; Wang, D.; Gao, F.; Liu, Q. Greenland surface albedo changes in July 1981–2012 from satellite observations. Environ. Res. Lett. 2013, 8, 44043–44049. [Google Scholar] [CrossRef]
- Song, L.; Liu, S.; Kustas, W.P.; Nieto, H.; Sun, L.; Xu, Z.; Skaggs, T.H.; Yang, Y.; Ma, M.; Xu, T.; et al. Monitoring and validating spatially and temporally continuous daily evaporation and transpiration at river basin scale. Remote Sens. Environ. 2018, 219, 72–88. [Google Scholar] [CrossRef]
- Jia, K.; Liang, S.; Gu, X.; Baret, F.; Wei, X.; Wang, X.; Yao, Y.; Yang, L.; Li, Y. Fractional vegetation cover estimation algorithm for Chinese GF-1 wide field view data. Remote Sens. Environ. 2016, 177, 184–191. [Google Scholar] [CrossRef]
- Jia, K.; Liang, S.; Wei, X.; Yao, Y.; Yang, L.; Zhang, X.; Liu, D. Validation of Global Land Surface Satellite (GLASS) fractional vegetation cover product from MODIS data in an agricultural region. Remote Sens. Lett. 2018, 9, 847–856. [Google Scholar] [CrossRef]
Publisher’s Note: MDPI stays neutral with regard to jurisdictional claims in published maps and institutional affiliations. |
© 2022 by the authors. Licensee MDPI, Basel, Switzerland. This article is an open access article distributed under the terms and conditions of the Creative Commons Attribution (CC BY) license (https://creativecommons.org/licenses/by/4.0/).