Article

The Efficiency of Foliar Kaolin Spray Assessed through UAV-Based Thermal Infrared Imagery

1
Centre for the Research and Technology of Agro-Environmental and Biological Sciences (CITAB), University of Trás-os-Montes e Alto Douro, 5001-801 Vila Real, Portugal
2
School of Science and Technology, University of Trás-os-Montes e Alto Douro, 5000-801 Vila Real, Portugal
3
Centre for Robotics in Industry and Intelligent Systems (CRIIS), INESC Technology and Science (INESC-TEC), 4200-465 Porto, Portugal
*
Author to whom correspondence should be addressed.
Remote Sens. 2022, 14(16), 4019; https://doi.org/10.3390/rs14164019
Submission received: 15 July 2022 / Revised: 12 August 2022 / Accepted: 16 August 2022 / Published: 18 August 2022

Abstract

:
The water content in an agricultural crop is of crucial importance and can either be estimated through proximal or remote sensing techniques, allowing better irrigation scheduling and avoiding extreme water stress periods. However, the current climate change context is increasing the use of eco-friendly practices to reconcile water management and thermal protection from sunburn. These approaches aim to mitigate summer stress factors (high temperature, high radiation, and water shortage) and improve the plants’ thermal efficiency. In this study, data from unmanned aerial vehicles (UAVs) were used to monitor the efficiency of foliar kaolin application (5%) in a commercial vineyard. Thermal infrared imagery (TIR) was used to compare the canopy temperature of grapevines with and without kaolin and to compute crop water stress and stomatal conductance indices. The gas exchange parameters of single leaves were also analysed to ascertain the physiological performance of vines and validate the UAV-based TIR data. Generally, plants sprayed with kaolin presented a lower temperature compared to untreated plants. Moreover, UAV-based data also showed a lower water stress index and higher stomatal conductance, which relate to eco-physiological measurements carried out in the field. Thus, the suitability of UAV-based TIR data proved to be a good approach to monitor entire vineyards in regions affected by periods of heatwaves, as is the case of the analysed study area.

1. Introduction

Canopy and cluster sunburn is an unfortunate consequence of climate change in European viticulture due to the rising incidence of extreme weather events (i.e., heatwaves) throughout the growing season [1,2]. In Mediterranean wine-growing regions, which were recently considered climate change hotspots, grapevine sunburn results from the exposure to excessive photosynthetically active radiation (PAR), high temperature, and ultraviolet (UV) radiation, hampering vines′ growth, yield, and grape quality potential [3,4]. The interaction of these environmental stress factors, together with canopy management practices which modulate light interception, script the damage of sunburn in grapevines throughout the summer season, characterised by leaf browning and shedding, decreased source and sink capacity, and berry shrivelling [1,5].
Adapting Mediterranean viticulture to climatic challenges has driven the need for the development and selection of eco-friendly strategies to bypass potential yield and quality losses [6]. In the last few decades, the foliar application of white clay minerals, such as kaolin (Al2Si2O5(OH)4), has been considered an efficient measure to avoid sunburn damage in several crops, improving the physiological performance of plants and their ability to withstand adverse summer stress conditions [7,8,9,10]. A recent body of literature has reported various consecutive effects driven by the reflective properties of the kaolin-particle film in grapevines, ranging from a significant reduction in leaf temperature, higher photosynthetic activity, and water use efficiency (WUE), to slight changes in yield, berry size, and acidity traits [11,12,13,14]. For example, Dinis et al. [15] and Bernardo et al. [16] demonstrated the leaf cooling effect promoted by the kaolin-particle film in Touriga Nacional grapevines through single leaf temperature measurements in the Douro Region (Portugal) in two consecutive growing seasons, along with improved WUE and physiological performance. The benefits of this treatment were also observed in several other crops, such as nuts [17,18], apple trees [19], coffee [20], wheat [21], and papaya [22] plants. However, most studies regarding kaolin spraying effects in vineyards showed increased efficiency of this protector under severe environmental conditions [11,23]. In Italy, other authors have also found that kaolin particle-film can increase the foliar reflection of PAR and UV radiation of Cabernet Sauvignon [24] and Pinot Noir [13] under adverse stress conditions. More recently, the association between kaolin treatment and the application of colourful shading nets has shown significant effects in Sauvignon Blanc grapevines during warm summers in preserving vine water status, delaying the technological maturity of grapes and preventing photo-inhibition [25]. Moreover, kaolin′s effects in avoiding photo damage by optimizing chlorophyll and xanthophyll cycles and improved heat dissipation mechanisms have also been observed in Mediterranean-type climate regions [26,27].
Despite the effectiveness of kaolin coating to reduce heat load in red and white grapevine varieties across several terroirs, the assessment of some parameters could be optimised by emerging precision technologies applied in viticulture [28].
The employment of precision viticulture (PV) allows for monitoring of the spatial vineyard variability [29]. This variability is reflected in the grapevine (Vitis vinifera L.) biophysical parameters [30]. Thus, through the analysis of these parameters, it is possible to identify the spatial variability and enable the implementation of the best management for each part of the vineyard [31]. In this context, remote sensing platforms are widely used in PV, providing data for decision support [32,33]. Among the different remote sensing platforms, unnamed aerial vehicles (UAVs) showed a rapid proliferation, especially in the last decade. UAVs stand out due to their great flexibility in the use of several types of sensors and the high temporal and spatial resolution [34,35]. In the context of viticulture, most applications and studies that use high resolution UAV data use cost-effective RGB sensors to compute three-dimensional and orthorectified information by means of photogrammetric processing. This approach allows for the gathering of 2D orthorectified outcomes and 3D information, allowing the retrieval of geometric-related grapevine features both at the plant and/or plot level (e.g., height, width, length, area, and volume) [36,37,38]. Automatic or semi-automatic classification of vineyards [39,40,41] through grapevine segmentation processes [37,42,43] are other important results that this approach allows us to achieve. However, when the goal is to estimate or determine plant-related biophysical parameters, the use of multispectral or hyperspectral data may bring great advantages. It becomes possible to estimate parameters such as leaf area index, vegetative vigour, chlorophyll concentration, and yield [31,44,45,46]. Furthermore, the use of multi and hyperspectral data can also assist in disease detection tasks [47,48]. All these advances provide knowledge at the plot level that allows for management oriented to the optimization of resources while allowing for the improvement of production and quality. By adding thermal data to this equation, a different level will be reached, namely in terms of optimising the increasingly important resource in the context of climate change: water. UAV-based thermal infrared imagery (TIR), can be used in PV to obtain grapevine temperature and estimate water status through the computation of specific indices [49,50,51,52,53,54,55].
With this study, we demonstrate the added value of using UAV-based imagery, namely TIR and RGB data, to monitor the effects of kaolin foliar applications. A commercial vineyard from the Douro Demarcated Region was surveyed with the goal of mapping the thermal variability within grapevines form vine rows with kaolin and comparing them with adjacent rows without kaolin, serving as a control. The study explores an automatic approach to extracting grapevine TIR data, shows the leaf protective effects of kaolin through time in the presence of environmental stress, and the relationship of the estimated UAV-based parameters with eco-physiological measurements.

2. Materials and Methods

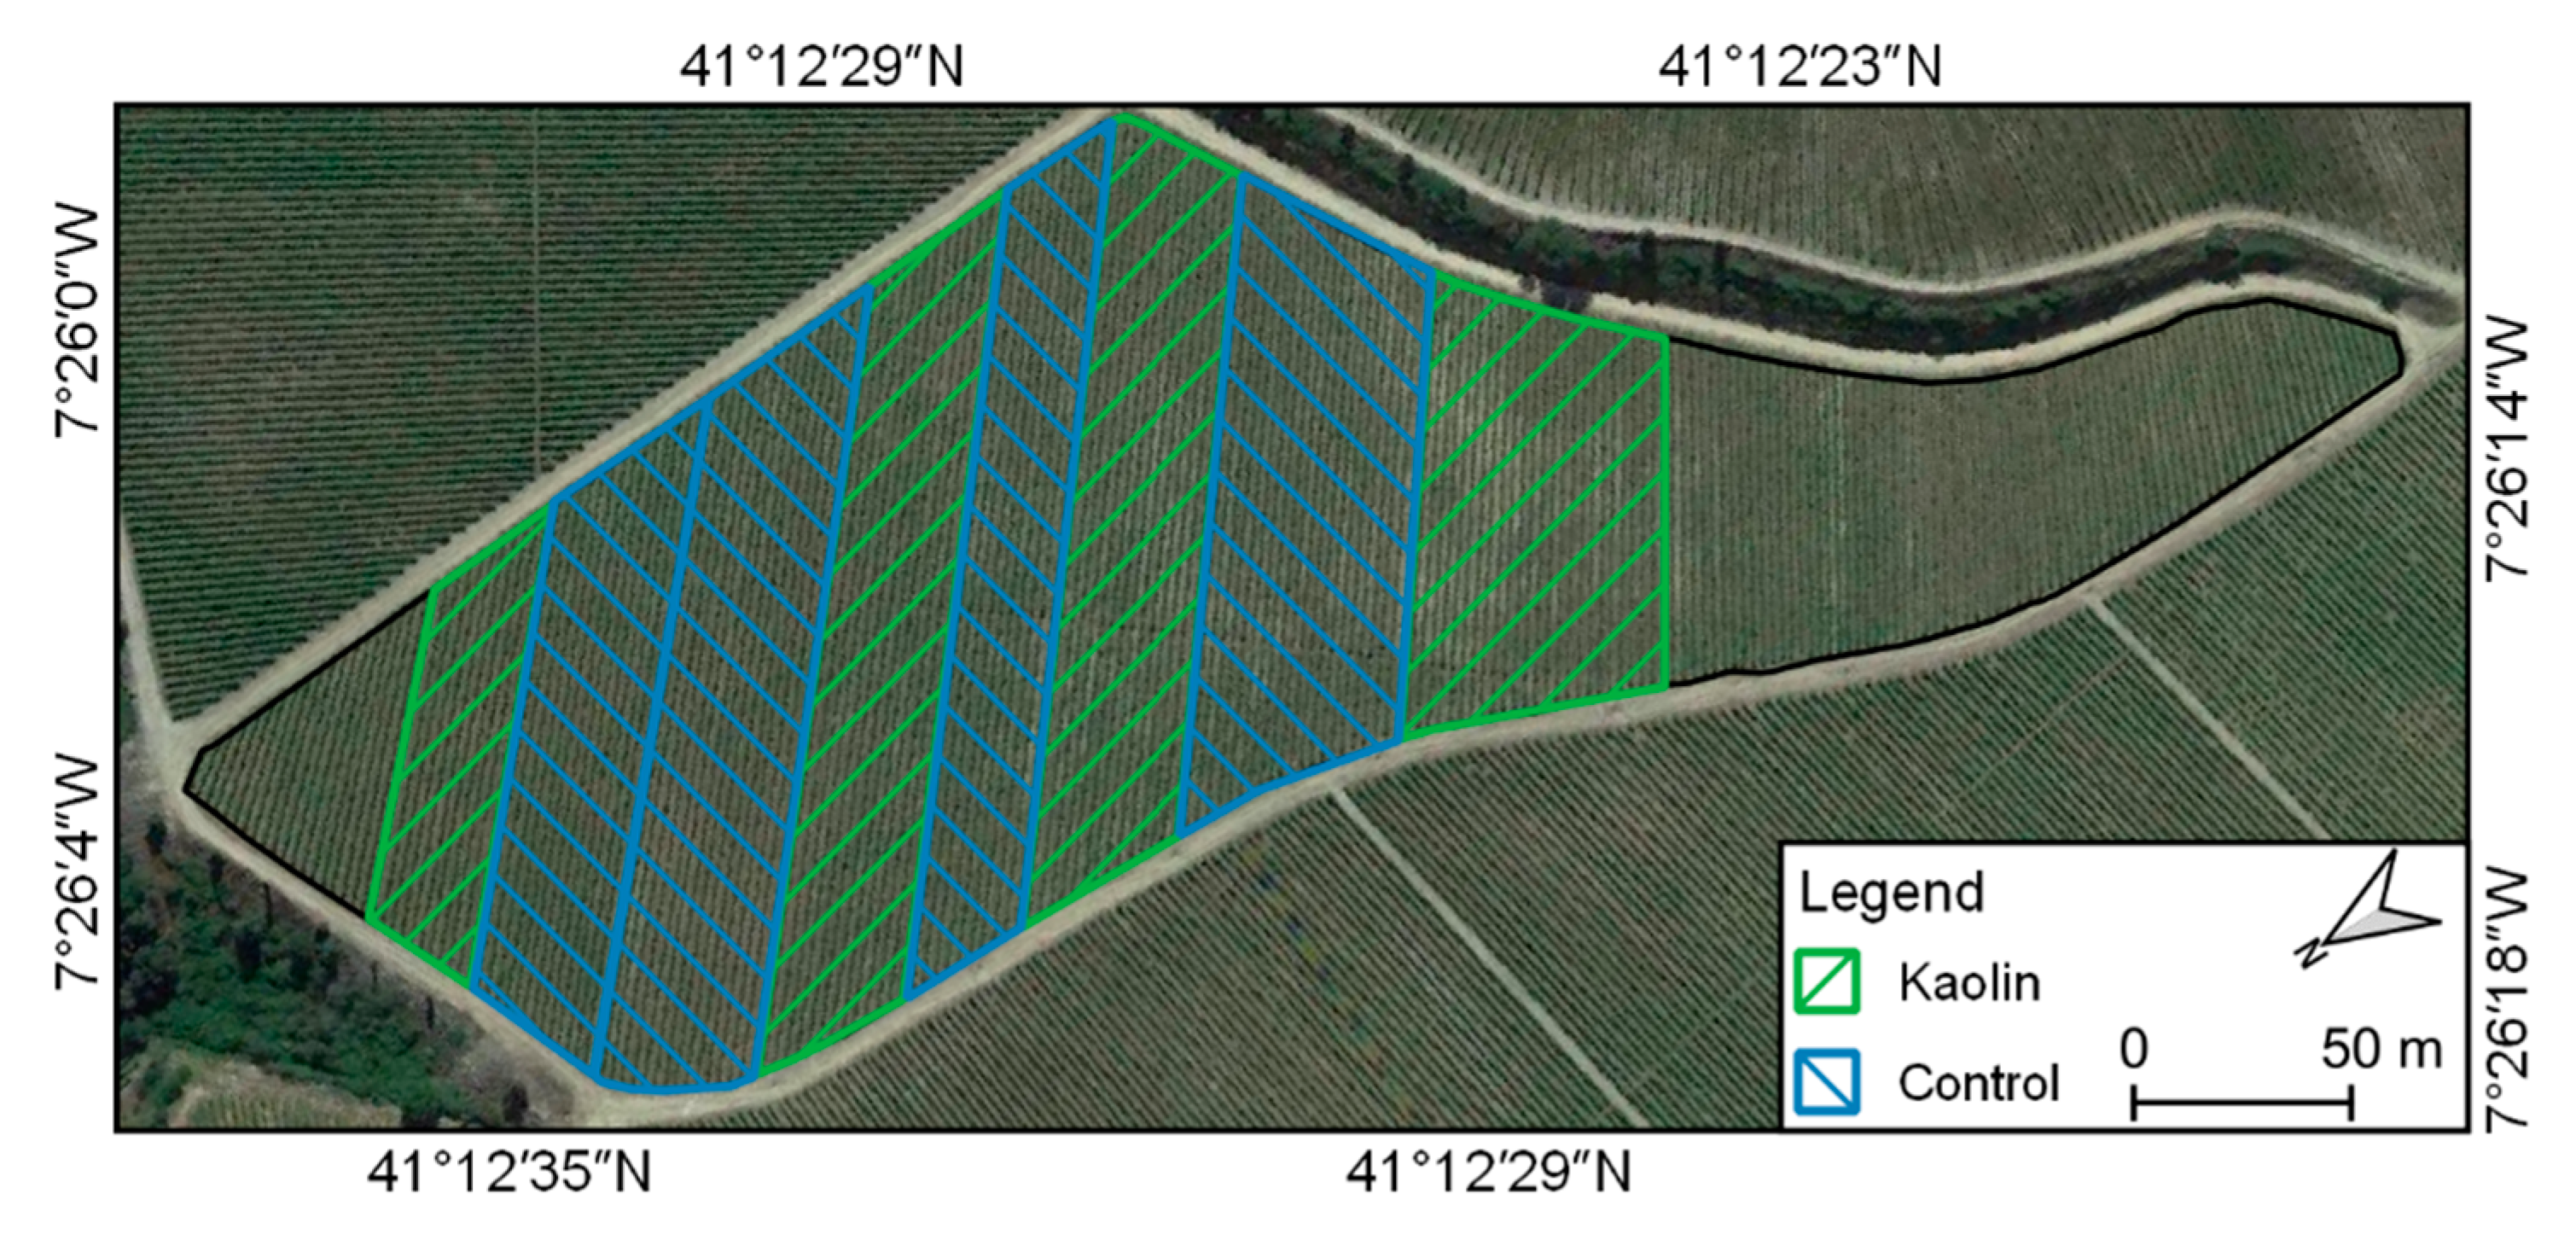
2.1. Study Area and Experiment Characterization

A general overview of the vineyard analysed in this study, located within the Douro Demarcated Region (São João da Pesqueira, Viseu, Portugal), is shown in Figure 1. It is a commercial vineyard located in Quinta dos Aciprestes (41°12′28.9″N, 7°26′07.1″W) with an area of approximately 5 ha, and is composed of red grapevines (cv. Touriga Nacional grafted on 1103-P rootstock). The plants are arranged in rows spaced by 2.2 m, with a distance between plants of one meter. Regarding the kaolin application, it was applied at a concentration of 5% over the whole canopy on 18 July 2018. Between the rows in which kaolin was applied, a set of control rows were left without any application. From the 5 ha vineyard, a total of 3.9 ha were analysed (green and blue polygons in Figure 1), with 1.9 ha containing kaolin-treated grapevines and the remaining 2 ha, serving as a control, having untreated plants. No other changes in irrigation or treatments between the two trial setups were applied. Vine rows not marked in Figure 1 were not subjected to further comparison.
A weather contextualization is provided in Figure 2 (precipitation, evapotranspiration, and mean, minimum, and maximum air temperatures) both monthly (from November 2017 to October 2018) and daily (between the period analysed). Data were obtained from the E-OBS gridded dataset v25.0e [56] by providing the central latitude and longitude coordinates of the vineyard.

2.2. Remote Sensed Data

2.2.1. Data Acquisition

The vineyard was surveyed using two different unmanned aerial systems: the multi-rotor UAV Phantom 4 (DJI, Shenzhen, China), responsible for RGB data acquisition using its 12.4 MP sensor in the first flight campaign; and the fixed-wing UAV eBee (senseFly SA, Lausanne, Switzerland) for TIR imagery acquisition using the thermoMAP sensor (senseFly SA, Lausanne, Switzerland), allowing the data acquisition between 7500 nm and 13,500 nm with an image resolution of 640 × 512 and a temperature resolution of 0.1 °C. The thermal image-based calibration is automatically performed in-flight. Moreover, in the second flight campaign, the fixed-wing UAV was also used for RGB data acquisition using a Canon IXUS 12 7 HS with 16.1 MP.
Flight campaigns were conducted using mission planning software for autonomous flight: DroneDeploy on an Android smartphone in the case of the multi-rotor UAV and eMotion (senseFly SA, Lausanne, Switzerland), installed on a Windows PC, for the fixed-wing UAV. Two flight campaigns were conducted during the 2018 growing season, with a temporal separation of 19 days. Table 1 presents the information related to the flight parameters and acquired imagery.

2.2.2. Data Processing

The photogrammetric processing of the UAV-based imagery acquired from the two sensors in each flight campaign was carried out using Pix4Dmapper Pro (Pix4D SA, Lausanne, Switzerland). It uses structure from motion (SfM) to generate high-density point clouds that enable the computation of different orthorectified outcomes. The processing applied to the data starts by computing a sparse point cloud, estimating 3D points from 2D matching points in multiple images. Then, a geolocation correction is performed using the ground control point (GCP) coordinates, acquired in the terrain using a global navigation satellite system (GNSS) receiver. After this step, point cloud densification occurs, by enlarging the number of 3D points. The point cloud density was set to high in all projects. For the computation of the orthorectified outcomes, the dense point cloud was interpolated based on the inverse distance weighting (IWD) method, and a noise filter and surface smoothing were also applied in this step. However, depending on the source data, different outcomes were computed. This way, when processing projects using RGB imagery, orthophoto mosaics, digital surface models (DSMs), and digital terrain models (DTMs) were generated. Moreover, crop surface models (CSM) were computed from the subtraction of the DTM to the DSM as in (1). From the RGB orthophoto mosaic, the G% index [57] was computed according to (2), being used for vegetation segmentation. The TIR data used in this study can also be used to generate digital elevation models, but it heavily suffers from smoothing effects due to lower resolution and a lack of textural information [58].
CSM =   DSM DTM
G % = Green Red + Green + Blue
From the acquired TIR imagery, the land surface temperature (LST) was computed. The raw reflectance data was converted to degrees Celsius. However, temperature varies along the day and epoch of the year and, for that reason, absolute values are useless for multi-temporal data analysis [51]. Thus, to be able to compare results from different epochs, it was necessary to normalise the data, which can be achieved by computing the crop water stress index (CWSI) [59] and the stomatal conductance index (IG) [60]. While CWSI is related to the detection of potential stress in agricultural crops, IG is directly related to stomatal conductance [61]. The empirical estimation of these indices is presented in (3) and (4):
CWSI = T c T wet T dry T wet
IG = T dry T c T c T wet
Both parameters rely on the use of upper and lower thermal limits (Twet and Tdry), which, respectively, correspond to the temperatures of a well-watered leaf and a non-transpiring leaf, and which are used along with the actual grapevine canopy temperature (Tc). In this study, Twet and Tdry values were obtained as described in Matese and Di Gennaro [62]. Twet values are obtained by watering grapevine leaves and immediately measuring their temperature. Tdry is obtained by applying petroleum jelly to the leaves directly exposed to the sun and its temperatures are measured after a few minutes. These temperature references were acquired in the field using a handheld infrared thermometer at the same time as the TIR flight was being conducted.
The vineyard segmentation techniques, published by Pádua et al. [42,63], were used to isolate grapevine vegetation from soil and inter-row vegetation. As an output, the method provides a mask of the pixels estimated as being grapevine. This mask was applied to the LST, CWSI, and IG raster files. The open source geographical information system QGIS was used for data processing of the photogrammetric outcomes and their subsequent analysis.

2.3. Eco-Physiological Measurements

2.3.1. Leaf Temperature

The average temperature of twenty sun-exposed and fully expanded leaves was measured at the midday period, using an infrared thermometer (Infratrace KM800S, Welwyn Garden City, Hertfordshire, UK) with a 15° field view positioned approximately 1 m above the foliar surface.

2.3.2. Leaf Gas Exchange

Leaf gas exchange measurements were performed using a portable infrared gas analyser (LCpro+, ADC, Hoddesdon, UK), operated in the open mode, at the midday period (14:00, GTM +1) in six sun-exposed and expanded leaves of the kaolin and untreated groups. The net photosynthetic rate (A, μmol m−2 s−1), stomatal conductance (gs, mmol m−2 s−1), transpiration rate (E, mmol m−2 s−1), and the ratio of intercellular to atmospheric CO2 concentration (Ci/Ca) were estimated following the formulas proposed by von Caemmerer and Farquhar [64]. The intrinsic water use efficiency was estimated as the ratio of A/gs to exclude the potential effects of air humidity and temperature on transpiration [65].

2.3.3. Chlorophyll a Fluorescence

Chlorophyll a fluorescence emission was measured with a Pulse Amplitude Modulation Fluorometer (mini-PAM, Photosynthesis Yield Analyzer; Walz, Effeltrich, Germany) at midday (14:00 GTM +1) in six fully expanded leaves by two-step readings. The first reading was recorded after a 35-s exposure to actinic light (1450 µmol m−2 s−1) in sunlight exposed leaves to determine the light-adapted steady-state fluorescence yield (Fs), followed by exposure to a saturating light pulse (6000 µmol m−2 s−1) for 0.6 s to establish Fm’. The leaves were then shaded for 5 s with a far-red light source to determine F0′. Afterwards, a leaf clip (DLC-8) was attached to the same leaf portion previously used to promote dark acclimation. After 30 to 45 min, the maximum photochemical efficiency of PSII was obtained by the relation Fv/Fm = (Fm − F0)/Fm, where F0 corresponds to the minimum fluorescence level excited by the very low intensity of the measuring light to keep PSII reaction centres open, and Fm corresponds to the maximum fluorescence level elicited by a pulse of saturating light (6000 µmol m−2 s−1), which closes all PSII reaction centres [66]. The non-photochemical quenching (NPQ) was then calculated according to Bilger and Schreiber [66] and Genty et al. [67] as follows: NPQ = (Fm − Fm’)/Fm’.

2.3.4. Transient Chlorophyll a Fluorescence Analysis by JIP-Test Parameters

Briefly, six leaves of each sampling group were dark-adapted with clips for 30 min before chlorophyll a fluorescence transient measurements at the midday period. Then, the saturating pulse measurements were performed by 1 s illumination, providing a maximum light intensity of 3000 µmol (photon) m−2 s−1 using a portable chlorophyll fluorimeter OS-30p (Opti-Sciences Inc., Hudson, NH, USA). The fast fluorescence kinetics (F0 to Fm) was recorded from 10 µs to 1 s. The fluorescence intensity at 50 µs were considered as F0. The biophysical parameters obtained were calculated according to the JIP test equations [68,69], providing structural and functional information regarding photosystem II (PSII): (i) specific energy fluxes per reaction centre (RC)–absorption (ABS/RC); electron transport (ET0/RC); trapping (TR0/RC) and dissipation (DI0/RC); (ii) phenomenological energy fluxes per excited cross-section (CS)–absorption (ABS/CS); (iii) flux ratios or yields–maximum quantum yield of primary photochemistry (ΦP0), electron transport probability (Ψ0), and the quantum yield of electron transport (Ψ E0); (iv) performance index (PIABS) on an absorption basis, measuring the performance up to the photosystem I (PSI) end electron acceptors.

2.4. Data Analysis

Statistical analyses of leaf temperature, leaf gas exchange, and chlorophyll a fluorescence were performed using the SPSS Statistics 20.0 software (IBM, New York, NY, USA). After testing for ANOVA assumptions, statistical differences among kaolin-treated and untreated leaves were evaluated by a two-way factorial ANOVA, followed by a post hoc Tukey’s test and pairwise comparisons of the factors date (August and September) and treatment (control and kaolin-treated). Different lower-case letters represent significant differences (p < 0.05) between control and kaolin-treated leaves within each sampling date. The asterisks represent significant differences (* p < 0.05) between sampling dates (August vs. September) within each treatment. The absence of letters and asterisks indicates no significant difference.
Regarding the UAV-based data and given that two epochs are available, the temporal differences of the vineyard’s vegetative development were analysed. This way, LST, CWSI, and IG changes were directly analysed to evaluate the temporal effects in kaolin-treated and in the control plants. The estimated LST was evaluated, including all information and only including data from the estimated grapevine vegetation. CWSI and IG were evaluated at the grapevine vegetation level. The grapevine vegetation cover for both treatments and its decline in area between the two epochs were also analysed. The main reason for doing this analysis is related to the fact that it is intended to analyse whether kaolin-treated plants present a lower canopy projected area decline than untreated plants.
The monitored vineyard was divided into eight polygons composed of kaolin-treated vine rows and control rows (Table 2 and Figure 3). The comparison plots were divided according to the terrain slope and by the middle of the vine rows. Each polygon is labelled with a letter according to the set of vine rows and with a number according to the location of the polygon in the vineyard: (1) for the upper part and (2) for the bottom part. Therefore, polygons with the same letters are composed of the same vine rows (Table 2).

3. Results

This section presents the results provided by remote sensed data acquired using the UAVs and by the eco-physiological parameters measured in the field. Kaolin treated plants are compared with untreated plants on a general scale and with adjacent blocks (in the case of UAV data). Values from both treatments are presented for each data acquisition period (August and September) and changes among them are also compared.

3.1. UAV-Based Results

Figure 4a presents the LST computed for August and September flight campaigns. A mean overall LST of 39.3 °C (SD = 3.6 °C) was observed in August, whereas in September, this value was 42.9 °C (SD = 3.1 °C). The maximum and minimum LST temperature were, respectively, 51.2 °C and 27.6 °C in August, and 55.3 °C and 35.4 °C in September. A closer overview of an area treated with kaolin and another that was untreated is presented in Figure 4b. The vegetation segmentation approach applied to the UAV-based data enabled us to estimate all pixels belonging to grapevine vegetation, and, therefore, grapevine vegetation could be extracted. With regards to the mean temperature of the studied parts (polygons in Figure 1), when excluding non-grapevine vegetation, it was 36.3 °C (SD = 2.0 °C) in August, and 45.0 °C (SD = 1.0 °C) in September. As for the mean vegetation temperature in kaolin treated plants, 36.2 °C (SD = 1.8 °C) was registered in August and 45.1 °C (SD = 1.0 °C) in September. On the other hand, control plants (no kaolin application) showed a temperature of 36.7 °C (SD = 1.8 °C) in August and 45.1 °C (SD = 1.0 °C) in September.
Regarding the UAV-based LST derived from TIR imagery (Figure 4a,c), an overall increase in temperature of 3.6 °C was verified between the two surveyed dates when considering the whole vineyard. By considering only grapevine vegetation, this difference increased to 7.7 °C. When comparing kaolin-treated and untreated vines in August, a difference of 0.66 °C was reached, considering all pixels, and 0.42 °C when observing only grapevine vegetation. In September, these differences were inferior, being 0.15 °C and 0.03 °C, respectively, for the whole area and grapevine vegetation.
The temperature references to calculate CWSI and IG were 30 °C and 40 °C in August and, 40 °C and 47 °C in the September flight for Twet and Tdry, respectively. The right side of Figure 4c depicts the temperature using Twet and Tdry values to produce a false colour representation in the filtered grapevine vegetation.
In August, the grapevine vegetation cover ratio was 34.4% (1.73 ha), compared to the vineyard area. In September it represented 30.6% (1.54 ha), representing a decrease of 3.8%, corresponding to 11% of vegetation area decline between the two analysed periods. In what concerns the 3.9 ha of kaolin and control treatments (polygons in Figure 1), a higher decrease (12.7%) was observed in plants without foliar kaolin application (from 0.69 ha in the August survey to 0.60 ha in September), while the vegetative decline of kaolin-treated plants was 11.6% (representing 0.65 ha in August and 0.58 ha in September).
As for CWSI (mean values for each period in Table 3), a mean overall increase of 0.08 is verified from August to September, while IG presented a decrease of 0.11 when considering grapevine vegetation. In comparing untreated and kaolin-treated plants, lower CWSI values are verified in kaolin-treated plants in the two surveyed periods. An increase of 0.10 and 0.07 between periods is verified for treated and untreated kaolin plants, respectively. As for IG, both treatments presented a decrease of 0.13 when analysing this index. The mean values for each date and TIR-based metric are presented in Table 3.

3.2. Vineyard Spatial Variability

Section 3.1 presents a general overview of the UAV-based data among the flight campaigns as it concerns the overall vineyard surface temperature, vegetation cover area, and CWSI and IG values. Despite these spatio-temporal differences, when analysing the overall perspective of these parameters, the spatial variability can be assessed in a finer scale. The comparison of each parameter is presented in this section.
Results interpretation from the comparison of treatment plots is carried towards considering high temperature and CWSI, along with lower IG, as being signs of higher plant stress, while the inverse (lower plant temperature, CWSI, and higher IG) is considered as fewer signs of plant stress. The differences among treatment plots regarding the kaolin-treated plants and untreated plants can be derived from the different parameters estimated from the UAV-based TIR imagery (Figure 5).
In August, a higher plot temperature (Figure 5a) was observed at A.1 (37.8 °C for kaolin and 37.6 °C for the control). The highest CWSI (Figure 5b) was also verified in this plot (0.60 and 0.62, respectively, for kaolin and control treatments). Lower values of IG were observed at A.2. for kaolin treated plots and in A.1. for control plots, being 0.49 and 0.52, respectively. On the other hand, lower temperature and CWSI values were verified at plot D.1, being 34.95 and 0.31 in the kaolin treated part, while the control part presented 35.23 and a CWSI value of 0.32. The higher IG value is 0.59 in the plots B.2 and C.2 for kaolin-treated plants and of 0.64 for in D.1 for control plants. As for September, the maximum mean temperature was observed in plants in the plot B.2 (45.85 °C for control and 45.46 °C for kaolin-treated plants). Higher mean CWSI values were registered in the plot B.2 for kaolin-treated grapevines (0.63) and in the plot A.1 for control plants (0.73), while IG minimum mean values were in the plot B.2 (0.32 for the control part and 0.34 for the kaolin part of the plot). Lower temperature values are registered in plot A.2 for kaolin-treated parts (43.19 °C) and in D.1 for control plants (42.84 °C). Regarding CWSI, the control part of plot D.1 showed the lowest value (0.43), while kaolin-treated plants showed a value of 0.47 in plot D.2. These plots also showed higher IG values, being 0.58 for the control treatment of D.1 and 0.50 for the kaolin-treated part of the plot.
The difference between treatments in August revealed that in six out of the eight plots, a lower temperature was observed in kaolin-treated plants. Only plots A.1 and A.2 presented an inverse behaviour. The same is verified for CWSI. As for IG, control plots presented slightly higher values, with the exception being plot C.2. As for September, the lower plant temperature is verified in six plots for kaolin-treated plants, with D.1 and D.2 presenting a higher plant temperature for both treatments.
The mean vegetation decline within the treatments over the two periods was 12.2% for kaolin-treated plots and 13.2% for control plots (Table 4). In an intra-plot comparison, both treatments present similar behaviours in terms of vegetative decline and growth. Only in plot D.2 was a vegetative increase observed. Regarding the temporal variation of other parameters, as seen in Section 3.1, an LST increase was observed between the two periods. In this case, the mean grapevine temperature increase was 7.89 °C (7.72 °C for the plot parts treated with kaolin and 8.05 °C for the control part). The biggest differences were reached in plot B.2 for both treatments. CWSI presented a mean overall increase of 0.10, being 0.09 in kaolin treated plots and 0.11 in control plots. All the control parts presented an increase in CWSI, while the kaolin treated parts of plots A.1 and A.2 showed a decrease in this value. As for IG, which presented a mean overall decrease of 0.14, with control plots presenting a mean of 0.16 decrease, and the kaolin plots showing a mean decrease of 0.11. In the case of this index, only one kaolin-treated plot (A.2) maintained the same mean plot value as August, while all the other plots decreased its value.

3.3. Eco-Physiological Parameters

Leaf gas exchange parameters, such as net photosynthetic rate (A), stomatal conductance (gs), and transpiration rate (E) values, were mainly affected by kaolin treatment in August (Figure 6). At this stage, kaolin-treated vines showed simultaneously higher A (10.10 µmol m−2 s−1), gs (119.85 mmol m−2 s−1), and E (3.39 mmol m−2 s−1) values than the control ones. Conversely, the intrinsic water use efficiency (iWUE) and the ratio of intercellular to atmospheric CO2 concentration (Ci/Ca) parameters of kaolin-treated leaves increased about 59.2% and 19%, respectively, in September, compared to untreated vines.
Figure 7 shows no significant changes in PSII photochemistry between kaolin-treated and untreated vines in both sampling dates. However, most of the parameters analysed from August to September were greatly reduced in control leaves compared to the treated ones. Specifically, Fv/Fm decreased 50.3% in control vines and 37.4% in treated plants, while NPQ increased around 120.8% and 164.1% in untreated and kaolin-treated vines, respectively. Moreover, chlorophyll transient analysis (Table 5) shows a significantly higher relative change of the kaolin-treated to control leaves in some specific energy fluxes per reaction centre, particularly DI0/RC and ET0/RC in September. Likewise, the flux ratio of the electron transport probability (Ψ0) increased in kaolin-treated vines around 315.71% in September.

4. Discussion

The acquired thermal data enabled us to observe that an overall increase in temperature occurred in between the two surveyed periods. Maximum temperatures are observed in non-vegetated areas directly exposed to sunlight. In contrast, minimum temperatures are reached in shadowed areas close to grapevine plants, where there were possible leaks in the irrigation system. These malfunctions can be seen in inter-row parts of the vineyard land surface temperature in Figure 4a, with more emphasis in September, this being one advantage of using UAV-based TIR data. Furthermore, the data processing approach followed a traditional photogrammetric alignment using GCPs to align RGB and TIR data, allowing us to directly estimate the grapevine canopy from the RGB imagery. Thus, the use of TIR data only is avoided, which could lead to the misinterpretation of grapevine values or could require more laborious and computer-intensive data coregistration approaches [70,71].
To assess if foliar kaolin applications caused a higher vegetation decrease over time, the vegetation cover ratio of the projected area was evaluated in both periods. The typical grapevine temporal and phenological dynamics demonstrated a natural overall area decrease between both August and September. The obtained grapevine cover area is within the values reported in other studies [42] and the vegetative decline was expected to occur as plants are close to harvest. If prior periods (with a higher vegetative development) were analysed, this decline would be higher [63], as the survey period in August already corresponded to an advanced ripening stage. This study shows that kaolin does not negatively affect the plants when analysing grapevine vegetation area. In fact, it was quite the opposite, a lower overall vegetative decline was observed (12.7% in control and 11.6% in kaolin areas) and, in the direct comparison of most treatment plots (Table 4), five kaolin-treated plots presented a lower vegetative decline than control plots. One treatment plot (D.2) presented a growth in both treatments, being higher in the kaolin part. In the present study, kaolin treatment showed no significant leaf cooling effect in August and September. Yet, most of the literature reports significant decreases in leaf temperature with kaolin application in grapevines, which could be associated with the grain size of the mineral, efficiency of foliar coverage, concentration, number of applications, and weather conditions [72,73]. Nonetheless, once applied as a suspension over the whole canopy, kaolin functions as a whitish barrier with reflective properties, screening radiation and heat loading, thus avoiding sunburn damage in Mediterranean crops and improving the physiological performance of vines [15,18].
Regarding the UAV-based parameters estimated from the grapevine vegetation (Figure 5), the differences among treatments in August revealed that in six out of the eight plots, a lower temperature was observed in kaolin-treated plants, only plots A.1 and A.2 presented an inverse behaviour. This result is in agreement with several data collected by hand infrared thermometers in different varieties sprayed with a kaolin suspension on vineyards located in Australia [74], Portugal [9], Italy [13], and the United States [72]. A similar response was verified for CWSI. As for IG, control plots presented slightly higher values, with the exception being plot C.2. In September, a lower plant temperature was verified in six plots for kaolin-treated plants, with D.1 and D.2 presenting a higher plant temperature for both treatments.
The two indices estimated from the TIR data showed a better performance in kaolin-treated areas, presenting lower signs of water stress (CWSI) and higher stomatal conductance (IG). Generally, both indices decrease in between flight campaigns. When observing the eco-physiological measurements on single leaves (Figure 6) through an IRGA, the stomatal conductance (gs), net photosynthesis (A), and transpiration rate (E) presented similar trends. This positive effect was mainly observed in August, as reported in Touriga Nacional and Touriga Franca leaves grown in Mediterranean wine-growing regions [11]. Though no relevant changes were found in the gs values in September, the iWUE was higher in kaolin-treated leaves at this stage, suggesting a prolonged effect of kaolin coating on improving plant performance under adverse environmental conditions. Nonetheless, the most physiological effects of kaolin treatment were mainly observed in August, possibly due to the occurrence of some precipitation after kaolin application that dissolves easily in water. By comparing the temporal differences (Table 4), higher temperatures are registered in September. Moreover, between the two survey periods, the effectiveness of kaolin protective film decreased. This can be seen in the sections of the orthophoto mosaics related to September data (presented in Figure 4b) in which the kaolin treated plants showed a higher colour resemblance to the control plants. This could also be an effect of strong winds and precipitation (Figure 2b) that occurred in between the two survey periods. Moreover, in the same region and grapevine variety, Tosin et al. [28] revealed that kaolin’s protective effect lasted for 20 days after its application and stopped about 60 days after. Regarding chlorophyll a fluorescence transient analysis (Table 5), the specific energy flux data combined with the quantum yield analysis showed higher values in kaolin-treated leaves in both studied dates, excepting the yield or primary photochemistry (ϕP0) in August and the trapping energy flux per reaction centre (TR0/RC) in September. This response was recently demonstrated by Bernardo et al. [16], indicating an apparent antenna size reduction and lower inactivation of reaction centres at the beginning of the experiment. This photoprotective response might explain the higher performance index (PIABS) found in treated plants, as previously observed in Dinis et al. [8].
Regarding in-field data acquisition and the UAV-based approaches, both have their strengths and weaknesses. Manual leaf temperature retrieval enables the precise gathering of temperature in a specific spot in the vegetative wall but has the drawback of being laborious and time-consuming for medium to large-scale assessments. On the other hand, UAV-based thermal infrared imagery can cover more area in a faster manner, retrieving temperature from the whole vineyard, but plant temperature can be influenced by soil temperature. In fact, when comparing both of these two approaches, several studies have shown that there is a high correlation (above 0.9 R2) when comparing temperature driven from UAV-based TIR imagery with in-ground handheld infrared thermometers or cameras [75,76,77,78,79]. Therefore, the temperature can be deemed correct, which, allied to the automatic self-calibration applied by the sensor before each flight line, ensures that the radiometric conditions of the imagery are comparable through space and time.
In future work, leaf density differences between control and kaolin-treated plants should also be assessed by using vegetation indices computed with multispectral or hyperspectral data. However, it should be noted that due to kaolin foliar application, grapevine spectral properties can change, which could prevent the use of typical vegetation indices. Thus, kaolin could employ a noisy effect in the spectral reflectance since it is applied throughout the leaves. This could also be an advantage to evaluate if a new kaolin foliar application is required. The combined effect of kaolin application with other irrigation strategies should also be considered to improve water management in Mediterranean vineyards.

5. Conclusions

This study shows the suitability of using UAV-based thermal infrared data in precision viticulture research. By performing UAV flight campaigns, it was not only possible to obtain thermal information about the whole vineyard but also to filter it to exclude non-grapevine information and to refine the analysis towards the plants. Thus, by comparing this with field observations, it is demonstrated that by using such a type of remote sensed data, more area can be assessed in the same period of time, obtaining more information and providing more complete decision support. Several temperature acquisitions on the same day could also help in understanding thermal gaps between treated-kaolin plants and untreated plants. Moreover, the CWSI and IG indices calculated from the data provided using UAV are in accordance with gas exchange parameters measured in Touriga Nacional leaves (iWUE, gs, and A), indicating a general improved physiological performance of kaolin-treated leaves under the current conditions, whose effects were mainly noticed at the beginning of the experiment.
In a water stress scenario, it is crucial to deliver data quickly, as a delay of some days can have negative consequences for grapevine development and berry composition, as well as economic impacts for winegrowers. Thus, quicker ways for UAV-based water stress estimation are needed, which can be based on cloud processing pipelines or even in-the-field processing through a mobile office with results being provided the same day, enabling winegrowers to quickly act upon stressed areas.

Author Contributions

Conceptualization, L.P., J.M.-P. and J.J.S.; methodology, L.P. and S.B.; software, L.P.; validation, L.P., L.-T.D., C.C., J.M.-P. and J.J.S.; formal analysis, L.P. and S.B.; investigation, L.P. and S.B.; resources, L.P., S.B., L.-T.D., C.C., J.M.-P. and J.J.S.; data curation, L.P.; writing—original draft preparation, L.P. and S.B.; writing—review and editing, L.-T.D., C.C., J.M.-P. and J.J.S.; visualization, L.P. and S.B.; supervision, L.-T.D., J.M.-P. and J.J.S.; project administration, L.-T.D., C.C., J.M.-P. and J.J.S.; funding acquisition, J.J.S. All authors have read and agreed to the published version of the manuscript.

Funding

This research activity was supported by National Funds by FCT—Portuguese Foundation for Science and Technology, under the project UIDB/04033/2020 and by the project “DATI—Digital Agriculture Technologies for Irrigation efficiency”. PRIMA—Partnership for Research and Innovation in the Mediterranean Area, (Research and Innovation activities), financed by the states participating in the PRIMA partnership and by the European Union, through Horizon 2020.

Data Availability Statement

The data presented in this study are available on request from the corresponding author.

Acknowledgments

We acknowledge the E-OBS dataset from the EU-FP6 project UERRA (http://www.uerra.eu) and the Copernicus Climate Change Service, and the data providers in the ECA&D project (https://www.ecad.eu). We would also like to thank to “Real Companhia Velha” for the collaboration and efforts in making the vineyard′s facilities available for the research and particularly to Rui Soares and Sérgio Soares for their valuable collaboration. We also thank ADVID for the encouragement given in carrying out this study.

Conflicts of Interest

The authors declare no conflict of interest. The funders had no role in the design of the study; in the collection, analyses, or interpretation of data; in the writing of the manuscript, or in the decision to publish the results.

References

  1. Gambetta, J.M.; Holzapfel, B.P.; Stoll, M.; Friedel, M. Sunburn in Grapes: A Review. Front. Plant Sci. 2021, 11, 2123. [Google Scholar] [CrossRef] [PubMed]
  2. Fraga, H.; Molitor, D.; Leolini, L.; Santos, J.A. What Is the Impact of Heatwaves on European Viticulture? A Modelling Assessment. Appl. Sci. 2020, 10, 3030. [Google Scholar] [CrossRef]
  3. Santos, J.A.; Costa, R.; Fraga, H. New Insights into Thermal Growing Conditions of Portuguese Grapevine Varieties under Changing Climates. Appl. Clim. 2019, 135, 1215–1226. [Google Scholar] [CrossRef]
  4. Bahr, C.; Schmidt, D.; Kahlen, K. Missing Links in Predicting Berry Sunburn in Future Vineyards. Front. Plant Sci. 2021, 12, 715906. [Google Scholar] [CrossRef]
  5. Venios, X.; Korkas, E.; Nisiotou, A.; Banilas, G. Grapevine Responses to Heat Stress and Global Warming. Plants 2020, 9, 1754. [Google Scholar] [CrossRef]
  6. Bernardo, S.; Dinis, L.-T.; Machado, N.; Moutinho-Pereira, J. Grapevine Abiotic Stress Assessment and Search for Sustainable Adaptation Strategies in Mediterranean-like Climates. A Review. Agron. Sustain. Dev. 2018, 38, 66. [Google Scholar] [CrossRef]
  7. Conde, A.; Neves, A.; Breia, R.; Pimentel, D.; Dinis, L.-T.; Bernardo, S.; Correia, C.M.; Cunha, A.; Gerós, H.; Moutinho-Pereira, J. Kaolin Particle Film Application Stimulates Photoassimilate Synthesis and Modifies the Primary Metabolome of Grape Leaves. J. Plant Physiol. 2018, 223, 47–56. [Google Scholar] [CrossRef]
  8. Dinis, L.-T.; Ferreira, H.; Pinto, G.; Bernardo, S.; Correia, C.M.; Moutinho-Pereira, J. Kaolin-Based, Foliar Reflective Film Protects Photosystem II Structure and Function in Grapevine Leaves Exposed to Heat and High Solar Radiation. Photosynthetica 2016, 1, 47–55. [Google Scholar] [CrossRef]
  9. Dinis, L.-T.; Bernardo, S.; Luzio, A.; Pinto, G.; Meijón, M.; Pintó-Marijuan, M.; Cotado, A.; Correia, C.; Moutinho-Pereira, J. Kaolin Modulates ABA and IAA Dynamics and Physiology of Grapevine under Mediterranean Summer Stress. J. Plant Physiol. 2018, 220, 181–192. [Google Scholar] [CrossRef]
  10. Luciani, E.; Palliotti, A.; Frioni, T.; Tombesi, S.; Villa, F.; Zadra, C.; Farinelli, D. Kaolin Treatments on Tonda Giffoni Hazelnut (Corylus avellana L.) for the Control of Heat Stress Damages. Sci. Hortic. 2020, 263, 109097. [Google Scholar] [CrossRef]
  11. Bernardo, S.; Dinis, L.-T.; Luzio, A.; Machado, N.; Gonçalves, A.; Vives-Peris, V.; Pitarch-Bielsa, M.; López-Climent, M.F.; Malheiro, A.C.; Correia, C.; et al. Optimising Grapevine Summer Stress Responses and Hormonal Balance by Applying Kaolin in Two Portuguese Demarcated Regions. OENO One 2021, 55, 207–222. [Google Scholar] [CrossRef]
  12. Dinis, L.-T.; Bernardo, S.; Matos, C.; Malheiro, A.; Flores, R.; Alves, S.; Costa, C.; Rocha, S.; Correia, C.; Luzio, A.; et al. Overview of Kaolin Outcomes from Vine to Wine: Cerceal White Variety Case Study. Agronomy 2020, 10, 1422. [Google Scholar] [CrossRef]
  13. Frioni, T.; Tombesi, S.; Luciani, E.; Sabbatini, P.; Berrios, J.G.; Palliotti, A. Kaolin Treatments on Pinot Noir Grapevines for the Control of Heat Stress Damages. BIO Web Conf. 2019, 13, 04004. [Google Scholar] [CrossRef]
  14. Hosseinabad, A.; Khadivi, A. Foliar Application of Kaolin Reduces the Incidence of Sunburn in ‘Thompson Seedless’ Grapevine. Eur. J. Hortic.Sci. 2019, 84, 171–176. [Google Scholar] [CrossRef]
  15. Dinis, L.T.; Malheiro, A.C.; Luzio, A.; Fraga, H.; Ferreira, H.; Gonçalves, I.; Pinto, G.; Correia, C.M.; Moutinho-Pereira, J. Improvement of Grapevine Physiology and Yield under Summer Stress by Kaolin-Foliar Application: Water Relations, Photosynthesis and Oxidative Damage. Photosynthetica 2018, 56, 641–651. [Google Scholar] [CrossRef]
  16. Bernardo, S.; Luzio, A.; Machado, N.; Ferreira, H.; Vives-Peris, V.; Malheiro, A.C.; Correia, C.; Gómez-Cadenas, A.; Moutinho-Pereira, J.; Dinis, L.-T. Kaolin Application Modulates Grapevine Photochemistry and Defence Responses in Distinct Mediterranean-Type Climate Vineyards. Agronomy 2021, 11, 477. [Google Scholar] [CrossRef]
  17. Rosati, A.; Metcalf, S.G.; Buchner, R.P.; Fulton, A.E.; Lampinen, B.D. Effects of Kaolin Application on Light Absorption and Distribution, Radiation Use Efficiency and Photosynthesis of Almond and Walnut Canopies. Ann. Bot. 2007, 99, 255–263. [Google Scholar] [CrossRef]
  18. Cabo, S.; Morais, M.C.; Aires, A.; Carvalho, R.; Pascual-Seva, N.; Silva, A.P.; Gonçalves, B. Kaolin and Seaweed-Based Extracts Can Be Used as Middle and Long-Term Strategy to Mitigate Negative Effects of Climate Change in Physiological Performance of Hazelnut Tree. J. Agron. Crop Sci. 2020, 206, 28–42. [Google Scholar] [CrossRef]
  19. Glenn, D.M. The Mechanisms of Plant Stress Mitigation by Kaolin-Based Particle Films and Applications in Horticultural and Agricultural Crops. HortScience 2012, 47, 710–711. [Google Scholar] [CrossRef]
  20. Steiman, S.R.; Bittenbender, H.C.; Idol, T.W. Analysis of Kaolin Particle Film Use and Its Application on Coffee. HortScience 2007, 42, 1605–1608. [Google Scholar] [CrossRef]
  21. Abdallah, M.M.S.; El-Bassiouny, H.M.S.; AbouSeeda, M.A. Potential Role of Kaolin or Potassium Sulfate as Anti-Transpirant on Improving Physiological, Biochemical Aspects and Yield of Wheat Plants under Different Watering Regimes. Bull. Natl. Res. Cent. 2019, 43, 134. [Google Scholar] [CrossRef]
  22. Campostrini, E.; Reis, F.O.; Souza, M.A.; Yamanishi, O.K. Processed-Kaolin Particle Film on Papaya Leaves: A Study Related to Gas Exchange, Leaf Temperature and Light Distribution in Canopy. Acta Hortic. 2010, 864, 195–200. [Google Scholar] [CrossRef]
  23. Frioni, T.; Saracino, S.; Squeri, C.; Tombesi, S.; Palliotti, A.; Sabbatini, P.; Magnanini, E.; Poni, S. Understanding Kaolin Effects on Grapevine Leaf and Whole-Canopy Physiology during Water Stress and Re-Watering. J. Plant Physiol. 2019, 242, 153020. [Google Scholar] [CrossRef] [PubMed]
  24. Lobos, G.A.; Acevedo-Opazo, C.; Guajardo-Moreno, A.; Valdés-Gómez, H.; Taylor, J.A.; Laurie, V.F. Effects of Kaolin-Based Particle Film and Fruit Zone Netting on Cabernet Sauvignon Grapevine Physiology and Fruit Quality. OENO One 2015, 49, 137–144. [Google Scholar] [CrossRef]
  25. Cataldo, E.; Fucile, M.; Mattii, G.B. Effects of Kaolin and Shading Net on the Ecophysiology and Berry Composition of Sauvignon Blanc Grapevines. Agriculture 2022, 12, 491. [Google Scholar] [CrossRef]
  26. Frioni, T.; Tombesi, S.; Sabbatini, P.; Squeri, C.; Lavado Rodas, N.; Palliotti, A.; Poni, S. Kaolin Reduces ABA Biosynthesis through the Inhibition of Neoxanthin Synthesis in Grapevines under Water Deficit. Int. J. Mol. Sci. 2020, 21, 4950. [Google Scholar] [CrossRef]
  27. Bernardo, S.; Rodrigo, M.J.; Vives-Peris, V.; Gómez-Cadenas, A.; Zacarías, L.; Machado, N.; Moutinho-Pereira, J.; Dinis, L.-T. Fine-Tuning of Grapevine Xanthophyll-Cycle and Energy Dissipation under Mediterranean Conditions by Kaolin Particle-Film. Sci. Hortic. 2022, 291, 110584. [Google Scholar] [CrossRef]
  28. Tosin, R.; Pôças, I.; Cunha, M. Spectral and Thermal Data as a Proxy for Leaf Protective Energy Dissipation under Kaolin Application in Grapevine Cultivars. Open Agric. 2019, 4, 294–304. [Google Scholar] [CrossRef]
  29. Bramley, R.G.V. Progress in the Development of Precision Viticulture—Variation in Yield, Quality and Soil Proporties in Contrasting Australian Vineyards; Massey University: Palmerston North, New Zealand, 2001. [Google Scholar]
  30. Pádua, L.; Marques, P.; Adão, T.; Guimarães, N.; Sousa, A.; Peres, E.; Sousa, J.J. Vineyard Variability Analysis through UAV-Based Vigour Maps to Assess Climate Change Impacts. Agronomy 2019, 9, 581. [Google Scholar] [CrossRef]
  31. Campos, J.; Llop, J.; Gallart, M.; García-Ruiz, F.; Gras, A.; Salcedo, R.; Gil, E. Development of Canopy Vigour Maps Using UAV for Site-Specific Management during Vineyard Spraying Process. Precis. Agric 2019, 20, 1136–1156. [Google Scholar] [CrossRef]
  32. Pádua, L.; Adão, T.; Hruška, J.; Sousa, J.J.; Peres, E.; Morais, R.; Sousa, A. Very High Resolution Aerial Data to Support Multi-Temporal Precision Agriculture Information Management. Procedia Comput. Sci. 2017, 121, 407–414. [Google Scholar] [CrossRef]
  33. Proffitt, A.P.B.; Bramley, R.; Lamb, D.; Winter, E. Precision Viticulture: A New Era in Vineyard Management and Wine Production; Winetitles: Ashford, Australia, 2006; ISBN 978-0-9756850-4-4. [Google Scholar]
  34. Pádua, L.; Vanko, J.; Hruška, J.; Adão, T.; Sousa, J.J.; Peres, E.; Morais, R. UAS, Sensors, and Data Processing in Agroforestry: A Review towards Practical Applications. Int. J. Remote Sens. 2017, 38, 2349–2391. [Google Scholar] [CrossRef]
  35. Matese, A.; Toscano, P.; Di Gennaro, S.F.; Genesio, L.; Vaccari, F.P.; Primicerio, J.; Belli, C.; Zaldei, A.; Bianconi, R.; Gioli, B. Intercomparison of UAV, Aircraft and Satellite Remote Sensing Platforms for Precision Viticulture. Remote Sens. 2015, 7, 2971–2990. [Google Scholar] [CrossRef]
  36. Pádua, L.; Adão, T.; Sousa, A.; Peres, E.; Sousa, J.J. Individual Grapevine Analysis in a Multi-Temporal Context Using UAV-Based Multi-Sensor Imagery. Remote Sens. 2020, 12, 139. [Google Scholar] [CrossRef]
  37. de Castro, A.I.; Jiménez-Brenes, F.M.; Torres-Sánchez, J.; Peña, J.M.; Borra-Serrano, I.; López-Granados, F. 3-D Characterization of Vineyards Using a Novel UAV Imagery-Based OBIA Procedure for Precision Viticulture Applications. Remote Sens. 2018, 10, 584. [Google Scholar] [CrossRef]
  38. Di Gennaro, S.F.; Matese, A. Evaluation of Novel Precision Viticulture Tool for Canopy Biomass Estimation and Missing Plant Detection Based on 2.5D and 3D Approaches Using RGB Images Acquired by UAV Platform. Plant Methods 2020, 16, 91. [Google Scholar] [CrossRef]
  39. Poblete-Echeverría, C.; Olmedo, G.F.; Ingram, B.; Bardeen, M. Detection and Segmentation of Vine Canopy in Ultra-High Spatial Resolution RGB Imagery Obtained from Unmanned Aerial Vehicle (UAV): A Case Study in a Commercial Vineyard. Remote Sens. 2017, 9, 268. [Google Scholar] [CrossRef]
  40. Pádua, L.; Matese, A.; Di Gennaro, S.F.; Morais, R.; Peres, E.; Sousa, J.J. Vineyard Classification Using OBIA on UAV-Based RGB and Multispectral Data: A Case Study in Different Wine Regions. Comput. Electron. Agric. 2022, 196, 106905. [Google Scholar] [CrossRef]
  41. Cinat, P.; Di Gennaro, S.F.; Berton, A.; Matese, A. Comparison of Unsupervised Algorithms for Vineyard Canopy Segmentation from UAV Multispectral Images. Remote Sens. 2019, 11, 1023. [Google Scholar] [CrossRef]
  42. Pádua, L.; Marques, P.; Hruška, J.; Adão, T.; Bessa, J.; Sousa, A.; Peres, E.; Morais, R.; Sousa, J.J. Vineyard Properties Extraction Combining UAS-Based RGB Imagery with Elevation Data. Int. J. Remote Sens. 2018, 39, 5377–5401. [Google Scholar] [CrossRef]
  43. Karatzinis, G.D.; Apostolidis, S.D.; Kapoutsis, A.C.; Panagiotopoulou, L.; Boutalis, Y.S.; Kosmatopoulos, E.B. Towards an Integrated Low-Cost Agricultural Monitoring System with Unmanned Aircraft System. In Proceedings of the 2020 International Conference on Unmanned Aircraft Systems (ICUAS), Athens, Greece, 1–4 September 2020; pp. 1131–1138. [Google Scholar]
  44. Duarte, L.; Teodoro, A.C.; Sousa, J.J.; Pádua, L. QVigourMap: A GIS Open Source Application for the Creation of Canopy Vigour Maps. Agronomy 2021, 11, 952. [Google Scholar] [CrossRef]
  45. Caruso, G.; Tozzini, L.; Rallo, G.; Primicerio, J.; Moriondo, M.; Palai, G.; Gucci, R. Estimating Biophysical and Geometrical Parameters of Grapevine Canopies (‘Sangiovese’) by an Unmanned Aerial Vehicle (UAV) and VIS-NIR Cameras. VITIS J. Grapevine Res. Vitis 2017, 56, 63–70. [Google Scholar] [CrossRef]
  46. Matese, A.; Di Gennaro, S.F.; Santesteban, L.G. Methods to Compare the Spatial Variability of UAV-Based Spectral and Geometric Information with Ground Autocorrelated Data. A Case of Study for Precision Viticulture. Comput. Electron. Agric. 2019, 162, 931–940. [Google Scholar] [CrossRef]
  47. Kerkech, M.; Hafiane, A.; Canals, R. Vine Disease Detection in UAV Multispectral Images Using Optimized Image Registration and Deep Learning Segmentation Approach. Comput. Electron. Agric. 2020, 174, 105446. [Google Scholar] [CrossRef]
  48. Albetis, J.; Duthoit, S.; Guttler, F.; Jacquin, A.; Goulard, M.; Poilvé, H.; Féret, J.-B.; Dedieu, G. Detection of Flavescence Dorée Grapevine Disease Using Unmanned Aerial Vehicle (UAV) Multispectral Imagery. Remote Sens. 2017, 9, 308. [Google Scholar] [CrossRef]
  49. Santesteban, L.G.; Di Gennaro, S.F.; Herrero-Langreo, A.; Miranda, C.; Royo, J.B.; Matese, A. High-Resolution UAV-Based Thermal Imaging to Estimate the Instantaneous and Seasonal Variability of Plant Water Status within a Vineyard. Agric. Water Manag. 2017, 183, 49–59. [Google Scholar] [CrossRef]
  50. Baluja, J.; Diago, M.P.; Balda, P.; Zorer, R.; Meggio, F.; Morales, F.; Tardaguila, J. Assessment of Vineyard Water Status Variability by Thermal and Multispectral Imagery Using an Unmanned Aerial Vehicle (UAV). Irrig. Sci. 2012, 30, 511–522. [Google Scholar] [CrossRef]
  51. Bellvert, J.; Zarco-Tejada, P.J.; Girona, J.; Fereres, E. Mapping Crop Water Stress Index in a ‘Pinot-Noir’ Vineyard: Comparing Ground Measurements with Thermal Remote Sensing Imagery from an Unmanned Aerial Vehicle. Precis. Agric. 2013, 15, 361–376. [Google Scholar] [CrossRef]
  52. Bellvert, J.; Marsal, J.; Girona, J.; Zarco-Tejada, P.J. Seasonal Evolution of Crop Water Stress Index in Grapevine Varieties Determined with High-Resolution Remote Sensing Thermal Imagery. Irrig. Sci. 2015, 33, 81–93. [Google Scholar] [CrossRef]
  53. Sepúlveda-Reyes, D.; Ingram, B.; Bardeen, M.; Zúñiga, M.; Ortega-Farías, S.; Poblete-Echeverría, C. Selecting Canopy Zones and Thresholding Approaches to Assess Grapevine Water Status by Using Aerial and Ground-Based Thermal Imaging. Remote Sens. 2016, 8, 822. [Google Scholar] [CrossRef]
  54. Espinoza, C.Z.; Khot, L.R.; Sankaran, S.; Jacoby, P.W. High Resolution Multispectral and Thermal Remote Sensing-Based Water Stress Assessment in Subsurface Irrigated Grapevines. Remote Sens. 2017, 9, 961. [Google Scholar] [CrossRef]
  55. Matese, A.; Baraldi, R.; Berton, A.; Cesaraccio, C.; Di Gennaro, S.; Duce, P.; Facini, O.; Mameli, M.; Piga, A.; Zaldei, A. Estimation of Water Stress in Grapevines Using Proximal and Remote Sensing Methods. Remote Sens. 2018, 10, 114. [Google Scholar] [CrossRef]
  56. Cornes, R.C.; van der Schrier, G.; van den Besselaar, E.J.M.; Jones, P.D. An Ensemble Version of the E-OBS Temperature and Precipitation Data Sets. J. Geophys. Res. Atmos. 2018, 123, 9391–9409. [Google Scholar] [CrossRef]
  57. Richardson, A.D.; Jenkins, J.P.; Braswell, B.H.; Hollinger, D.Y.; Ollinger, S.V.; Smith, M.-L. Use of Digital Webcam Images to Track Spring Green-up in a Deciduous Broadleaf Forest. Oecologia 2007, 152, 323–334. [Google Scholar] [CrossRef] [PubMed]
  58. Matese, A.; Di Gennaro, S.F.; Berton, A. Assessment of a Canopy Height Model (CHM) in a Vineyard Using UAV-Based Multispectral Imaging. Int. J. Remote Sens. 2017, 38, 2150–2160. [Google Scholar] [CrossRef]
  59. Idso, S.B.; Jackson, R.D.; Pinter, P.J.; Reginato, R.J.; Hatfield, J.L. Normalizing the Stress-Degree-Day Parameter for Environmental Variability. Agric. Meteorol. 1981, 24, 45–55. [Google Scholar] [CrossRef]
  60. Jones, H.G. Use of Infrared Thermometry for Estimation of Stomatal Conductance as a Possible Aid to Irrigation Scheduling. Agric. For. Meteorol. 1999, 95, 139–149. [Google Scholar] [CrossRef]
  61. Gago, J.; Douthe, C.; Coopman, R.E.; Gallego, P.P.; Ribas-Carbo, M.; Flexas, J.; Escalona, J.; Medrano, H. UAVs Challenge to Assess Water Stress for Sustainable Agriculture. Agric. Water Manag. 2015, 153, 9–19. [Google Scholar] [CrossRef]
  62. Matese, A.; Di Gennaro, S. Practical Applications of a Multisensor UAV Platform Based on Multispectral, Thermal and RGB High Resolution Images in Precision Viticulture. Agriculture 2018, 8, 116. [Google Scholar] [CrossRef]
  63. Pádua, L.; Marques, P.; Hruška, J.; Adão, T.; Peres, E.; Morais, R.; Sousa, J.J. Multi-Temporal Vineyard Monitoring through UAV-Based RGB Imagery. Remote Sens. 2018, 10, 1907. [Google Scholar] [CrossRef]
  64. von Caemmerer, S.; Farquhar, G.D. Some Relationships between the Biochemistry of Photosynthesis and the Gas Exchange of Leaves. Planta 1981, 153, 376–387. [Google Scholar] [CrossRef] [PubMed]
  65. Iacono, F.; Buccella, A.; Peterlunger, E. Water Stress and Rootstock Influence on Leaf Gas Exchange of Grafted and Ungrafted Grapevines. Sci. Hortic. 1998, 75, 27–39. [Google Scholar] [CrossRef]
  66. Bilger, W.; Schreiber, U. Energy-Dependent Quenching of Dark-Level Chlorophyll Fluorescence in Intact Leaves. Photosynth. Res. 1986, 10, 303–308. [Google Scholar] [CrossRef] [PubMed]
  67. Genty, B.; Briantais, J.-M.; Baker, N.R. The Relationship between the Quantum Yield of Photosynthetic Electron Transport and Quenching of Chlorophyll Fluorescence. Biochim. Biophys. Acta (BBA) Gen. Subj. 1989, 990, 87–92. [Google Scholar] [CrossRef]
  68. Strasser, R.J.; Srivastava, A.; Tsimilli-Michael, M. The Fluorescence Transient as a Tool to Characterize and Screen Photosynthetic Samples. In Probing Photosynthesis: Mechanisms, Regulation and Adaptation; CRC Press: Boca Raton, FL, USA, 2000; pp. 445–483. [Google Scholar]
  69. Strasser, R.J.; Tsimilli-Michael, M.; Srivastava, A. Analysis of the Chlorophyll a Fluorescence Transient. In Chlorophyll A Fluorescence: A Signature of Photosynthesis; Papageorgiou, G.C., Govindjee, Eds.; Springer: Dordrecht, The Netherlands, 2004; pp. 321–362. ISBN 978-1-4020-3218-9. [Google Scholar]
  70. Poblete, T.; Ortega-Farías, S.; Ryu, D. Automatic Coregistration Algorithm to Remove Canopy Shaded Pixels in UAV-Borne Thermal Images to Improve the Estimation of Crop Water Stress Index of a Drip-Irrigated Cabernet Sauvignon Vineyard. Sensors 2018, 18, 397. [Google Scholar] [CrossRef] [PubMed]
  71. López, A.; Jurado, J.M.; Ogayar, C.J.; Feito, F.R. A Framework for Registering UAV-Based Imagery for Crop-Tracking in Precision Agriculture. Int. J. Appl. Earth Obs. Geoinf. 2021, 97, 102274. [Google Scholar] [CrossRef]
  72. Shellie, K.C.; King, B.A. Kaolin Particle Film and Water Deficit Influence Malbec Leaf and Berry Temperature, Pigments, and Photosynthesis. Am. J. Enol. Vitic. 2013, 64, 223–230. [Google Scholar] [CrossRef]
  73. Wang, Y.; Xue, T.; Han, X.; Guan, L.; Zhang, L.; Wang, H.; Li, H. Kaolin Particle Film Affects Grapevine Berry Quality in Cv. Meili in Humid Climate Conditions. HortScience 2020, 55, 1987–2000. [Google Scholar] [CrossRef]
  74. Glenn, D.M.; Cooley, N.; Walker, R.; Clingeleffer, P.; Shellie, K. Impact of Kaolin Particle Film and Water Deficit on Wine Grape Water Use Efficiency and Plant Water Relations. HortScience 2010, 45, 1178–1187. [Google Scholar] [CrossRef]
  75. Sagan, V.; Maimaitijiang, M.; Sidike, P.; Eblimit, K.; Peterson, K.T.; Hartling, S.; Esposito, F.; Khanal, K.; Newcomb, M.; Pauli, D.; et al. UAV-Based High Resolution Thermal Imaging for Vegetation Monitoring, and Plant Phenotyping Using ICI 8640 P, FLIR Vue Pro R 640, and ThermoMap Cameras. Remote Sens. 2019, 11, 330. [Google Scholar] [CrossRef]
  76. Ribeiro-Gomes, K.; Hernández-López, D.; Ortega, J.F.; Ballesteros, R.; Poblete, T.; Moreno, M.A. Uncooled Thermal Camera Calibration and Optimization of the Photogrammetry Process for UAV Applications in Agriculture. Sensors 2017, 17, 2173. [Google Scholar] [CrossRef] [PubMed]
  77. Aragon, B.; Johansen, K.; Parkes, S.; Malbeteau, Y.; Al-Mashharawi, S.; Al-Amoudi, T.; Andrade, C.F.; Turner, D.; Lucieer, A.; McCabe, M.F. A Calibration Procedure for Field and UAV-Based Uncooled Thermal Infrared Instruments. Sensors 2020, 20, 3316. [Google Scholar] [CrossRef] [PubMed]
  78. Han, Y.; Tarakey, B.A.; Hong, S.-J.; Kim, S.-Y.; Kim, E.; Lee, C.-H.; Kim, G. Calibration and Image Processing of Aerial Thermal Image for UAV Application in Crop Water Stress Estimation. J. Sens. 2021, 2021, e5537795. [Google Scholar] [CrossRef]
  79. Kelly, J.; Kljun, N.; Olsson, P.-O.; Mihai, L.; Liljeblad, B.; Weslien, P.; Klemedtsson, L.; Eklundh, L. Challenges and Best Practices for Deriving Temperature Data from an Uncalibrated UAV Thermal Infrared Camera. Remote Sens. 2019, 11, 567. [Google Scholar] [CrossRef]
Figure 1. Overview of the surveyed vineyard and the parts analysed. Background image from Google Earth.
Remotesensing 14 04019 g001
Figure 2. Monthly mean weather for the study area between November 2017 and October 2018 (a) and daily weather data for the period of the field study (b). Mean (Tmean), minimum (Tmin) and maximum (Tmax) air temperatures, precipitation and evapotranspiration (ET0) values.
Remotesensing 14 04019 g002
Figure 3. Delimitation and identification of the compared treatment plots and the vineyard digital terrain model. Orthophoto mosaic from the first flight campaign as background.
Remotesensing 14 04019 g003
Figure 4. Land surface temperature of the thermal infrared data acquired from an unmanned aerial vehicle for the August and the September flight campaigns (a). Close-up view of the points highlighted in (a) of the RGB orthophoto mosaic (b) and thermal infrared imagery filtered for grapevine vegetation (c) in kaolin and control areas in August and September flight campaigns.
Remotesensing 14 04019 g004
Figure 5. Relative difference of the canopy temperature (°C) (a) and of the estimated indices (b) from the grapevine vegetation in August and September in each plot. Data represents the average change of kaolin-treated plants relative to control vines of Touriga Nacional. CWSI: crop water stress index; IG: stomatal conductance index.
Remotesensing 14 04019 g005
Figure 6. Leaf gas exchange parameters of Touriga Nacional control and kaolin-treated grapevines at midday (14:00 GTM+1). Stomatal conductance (gs, mmol m−2 s−1), net CO2 assimilation rate (A, µmol m−2 s−1), intrinsic water use efficiency (A/gs, µmol mol−1), intercellular CO2 concentration (Ci), ratio of intercellular to atmospheric CO2 concentration (Ci/Ca), and transpiration rate (E, mmol m−2 s−1). Data are mean ± SD of six replicates. Different lower-case letters represent significant differences between treatments (control vs. kaolin-treated) within each month. * p < 0.05 represent significant differences between sampling months (August vs. September) within each treatment.
Remotesensing 14 04019 g006
Figure 7. Midday chlorophyll fluorescence variables of Touriga-Nacional grapevines in control and kaolin-treated leaves throughout the experiment. Parameters measured: maximum (Fv/Fm) quantum efficiency of PSII and non-photochemical quenching (NPQ). Data are mean ± SD of six replicates. Different lower-case letters represent significant differences (p < 0.05) between treatments within each month. * denote significant differences (p < 0.05) between months (August vs. September) within the treatment.
Remotesensing 14 04019 g007
Table 1. Characteristics of the flight campaigns. Flight height is referred to the take-off point for the RGB sensor. GSD: ground sample distance.
Survey Period24 August 201812 September 2018
Sensor TypeRGBTIRRGBTIR
Flight Height (m)60 *135 **135 **135 **
No. of Images4452886672464
Front/Side Overlap (%)80/7090/7070/7090/70
GSD (m)0.040.270.040.25
* From the take-off position; ** Following to the terrain elevation.
Table 2. Area and number of rows used for comparing treatment plots.
ID and LocationArea (ha)No. of Rows
KaolinControl
A.10.351114
A.20.31
B.10.571315
B.20.59
C.10.531410
C.20.46
D.10.622521
D.20.52
Table 3. Mean temperature (°C), crop water stress index (CWSI), and IG values, and its standard deviation (SD) in the two surveyed periods for the whole vineyard and for treated (kaolin) and untreated (control) kaolin grapevines.
PeriodArea AnalysedTemp. (SD)CWSI (SD)IG (SD)
Aug.Overall36.3 (2.0)0.46 (0.22)0.55 (0.27)
Kaolin36.2 (1.8)0.45 (0.21)0.56 (0.27)
Control36.7 (1.8)0.49 (0.20)0.56 (0.27)
Sep.Overall45.0 (1.0)0.53 (0.25)0.44 (0.28)
Kaolin45.1 (1.0)0.55 (0.25)0.43 (0.28)
Control45.1 (1.0)0.56 (0.24)0.43 (0.28)
Table 4. Relative difference between the two periods for the grapevine vegetation area decline and estimated parameters from the thermal infrared imagery in each plot. Data represents the difference between September to August mean plot values of kaolin-treated plants with respect to the control values. Temp: temperature; CWSI: crop water stress index; IG: stomatal conductance index.
PlotVegetative Decline (%)Temp. (°C)CWSIIG
KaolinControlAbs. Diff.KaolinControlKaolinControlKaolinControl
A.123.729.25.46.008.12−0.060.11−0.03−0.19
A.212.73.09.75.987.27−0.050.040.00−0.10
B.124.626.11.67.827.770.090.08−0.13−0.16
B.28.610.62.08.798.920.110.15−0.24−0.28
C.115.926.010.18.078.440.110.14−0.15−0.19
C.29.78.71.08.698.740.160.15−0.19−0.22
D.15.34.31.18.587.610.200.11−0.09−0.06
D.2−2.9−2.10.87.867.510.120.09−0.08−0.07
Table 5. Relative difference of the JIP parameters deduced from chlorophyll a fluorescence OJIP transients in August and September in the leaves of Touriga-Nacional treated with 5% kaolin. Data are mean ± SD of six replicates. * Indicates a significant (p < 0.05) relative change in the kaolin-treated group respecting to control.
ParameterPeriod
AugustSeptember
F013.321.16
ABS/RC20.624.15
TR0/RC0.48−9.64
DI0/RC31.8651.27 *
ET0/RC2.5780.73 *
φP0−4.221.81
Ψ02.37315.71 *
ΨE02.5227.5
φD015.8727.5
PIABS30.0567.72
Publisher’s Note: MDPI stays neutral with regard to jurisdictional claims in published maps and institutional affiliations.

