Article

Assessing the Impact of Urbanization and Eco-Environmental Quality on Regional Carbon Storage: A Multiscale Spatio-Temporal Analysis Framework

1
School of Public Administration and Policy, Renmin University of China, Beijing 100872, China
2
College of Management and Economics, Tianjin University, Tianjin 300072, China
*
Author to whom correspondence should be addressed.
Remote Sens. 2022, 14(16), 4007; https://doi.org/10.3390/rs14164007
Submission received: 8 July 2022 / Revised: 12 August 2022 / Accepted: 13 August 2022 / Published: 17 August 2022

Abstract

:
Understanding the mechanisms, intensity, and spatio-temporal heterogeneity of the impacts of urbanization and eco-environmental quality on carbon storage is crucial for achieving carbon neutrality goals. This study constructed a multiscale spatio-temporal analysis framework using multi-source remote sensing data, the InVEST model, and the multiscale geographically weighted regression (MGWR) model. Then, the effects of multiple factors on regional carbon storage were assessed in an empirical study involving 199 counties in Beijing-Tianjin-Hebei. The results showed that the carbon storage loss in the Beijing-Tianjin-Hebei region from 2010 to 2018 was 58.87 Tg C, with an annual relative loss rate of 0.16%. The MGWR model used in this study explained more than 98% of the spatial variation in regional carbon storage. In contrast, the impacts of various urbanization and eco-environmental indicators on regional carbon storage varied with the spatial and temporal variation. Overall, urban land structure and vegetation growth strongly influenced regional carbon storage resulting from urbanization and eco-environmental quality, respectively. In addition, based on an analysis of spatial context, MGWR suggests that the northwestern mountains in the Beijing-Tianjin-Hebei region have a greater potential to store more carbon than the other regions. This study also details the impact of future sustainable land use on regional carbon storage. Our findings can provide a scientific reference for formulating relevant carbon storage conservation policies.

1. Introduction

Cities worldwide have experienced rapid urbanization since the advent of the Anthropocene [1]. Globally, urbanized areas are expected to grow by more than 180%, from 65,000 km2 in 2000 to 186,000 km2 in 2030 [2]. A shift to an urbanization-oriented development strategy has created spectacular results in the past decade. Nonetheless, it has also resulted in a few significant challenges, such as resource scarcity [3], population growth [4], and eco-environmental deterioration [5]. Urbanization and eco-environmental changes have resulted in several undesirable phenomena, including urban heat islands [6,7] and soil erosion [8]. However, a critical phenomenon—the loss of carbon storage—is often overlooked.
Carbon is absorbed and accumulated in terrestrial and marine ecosystems, which is beneficial for mitigating climate change and improving ecosystem services [9,10]. One of the most significant impacts of urbanization and its resulting environmental change is the loss of carbon storage [11]. Therefore, assessing how the mechanisms, intensity, and spatial heterogeneity of urbanization and eco-environmental quality impacts regional carbon storage is highly important in providing sustainable land management.
Estimating carbon storage has long been an important issue of common concern for ecology, climate change, and other disciplines. Numerical modeling, field surveys, and remote sensing data have garnered considerable attention in estimating carbon storage [12,13,14]. Researchers have developed various process-based models that incorporate the direct effects of socioeconomic and climate systems on carbon emissions [15,16,17]. However, these process-based approaches often fail to capture the relationship between changes in land use and carbon storage [11,18]. According to studies on various geographical scales [19,20,21], land use changes (LUC) pose severe threats to ecosystems [22,23]. From this perspective, LUC can be aligned with carbon storage changes using the Integrated Valuation of Ecosystem Services and Tradeoff (InVEST) model [24]. Based on the carbon density distribution at global and regional levels, various vegetation and soil types can be used to estimate carbon storage [25]. Another benefit of the InVEST model is that it combines the advantages of the model and field surveys to effectively estimate the spatial distribution of carbon storage by creating a carbon storage table.
Traditionally, ecosystem services, including carbon storage, have been evaluated primarily from the standpoint of LUC. These studies have relied heavily on qualitative analyses and simple mathematical methods [26,27]. Studies of ecosystem drivers typically overlook two critical aspects: multifactor interactions and the spatial heterogeneity and scale of impacts. Spatio-temporal pattern analyses based on visualizations of spatial information cannot accurately identify the intensity of the effects of relevant drivers on ecosystem services. In contrast, correlation analysis and ordinary least squares regression (OLSR) ignore the details of the impact mode. Spatial heterogeneity and scale are two fundamental concepts in geographic research [28,29], and there is now a general consensus that spatial processes (e.g., the weather and tides in a certain area) may differ across regions and operate at different scales [30]. As exemplified by carbon storage, ecosystem services are also a complex phenomenon influenced by multiple urbanization and eco-environmental quality factors. Therefore, theoretically and practically, it is imperative to assess the impact of urbanization on regional carbon storage and propose localized carbon storage conservation policies.
Studying the spatial scale and heterogeneity of action mechanisms simultaneously has been technically challenging in past research, with OLSR, generalized additive models, machine learning methods, and classical geographically weighted regression (GWR) models all having different limitations [28]. However, the drivers of carbon storage can be more accurately detected through multiscale geographically weighted regression (MGWR), which allows the regression to be performed at multiple bandwidths (instead of only one for each variable as in the GWR model) [31]. MGWR is considered a significant breakthrough in spatial analysis [32], as it is currently the only analytical approach that provides information on how specific factors influence the dependent variable at both the spatial scale and heterogeneity levels [33,34]; it also allows for measurements of contextual effects in determining carbon storage.
In addition to developing a basic theory of ecosystem services, examining the spatial heterogeneity and scales of carbon storage drivers can provide a valuable reference for natural resource management. To this end, we used the InVEST model to calculate carbon storage and then analyzed the multiple associated drivers using the MGWR model to address the following questions: (i) What are the mechanisms and intensities by which urbanization and eco-environmental quality affect regional carbon storage? (ii) What novel insights can MGWR contribute to ensure a better understanding of factors affecting regional carbon storage? In other words, what are the influencing factors of spatial scale and spatial heterogeneity? We present a multiscale spatial framework based on remote sensing data for analyzing carbon storage drivers and critique previous applications for assessing them in order to facilitate the development of specific carbon conservation policies.

2. Material and Methods

2.1. Research Design

The methods used in this study are illustrated in Figure 1. Combined with the multiscale model, we can determine the spatial scale and distribution patterns of the critical drivers. The study follows three steps:
  • Spatial-temporal change pattern of carbon storage based on the InVEST model;
  • Spatial calculation of multidimensional drivers;
  • Multiscale-driven assessment of spatial-temporal drivers of carbon storage.
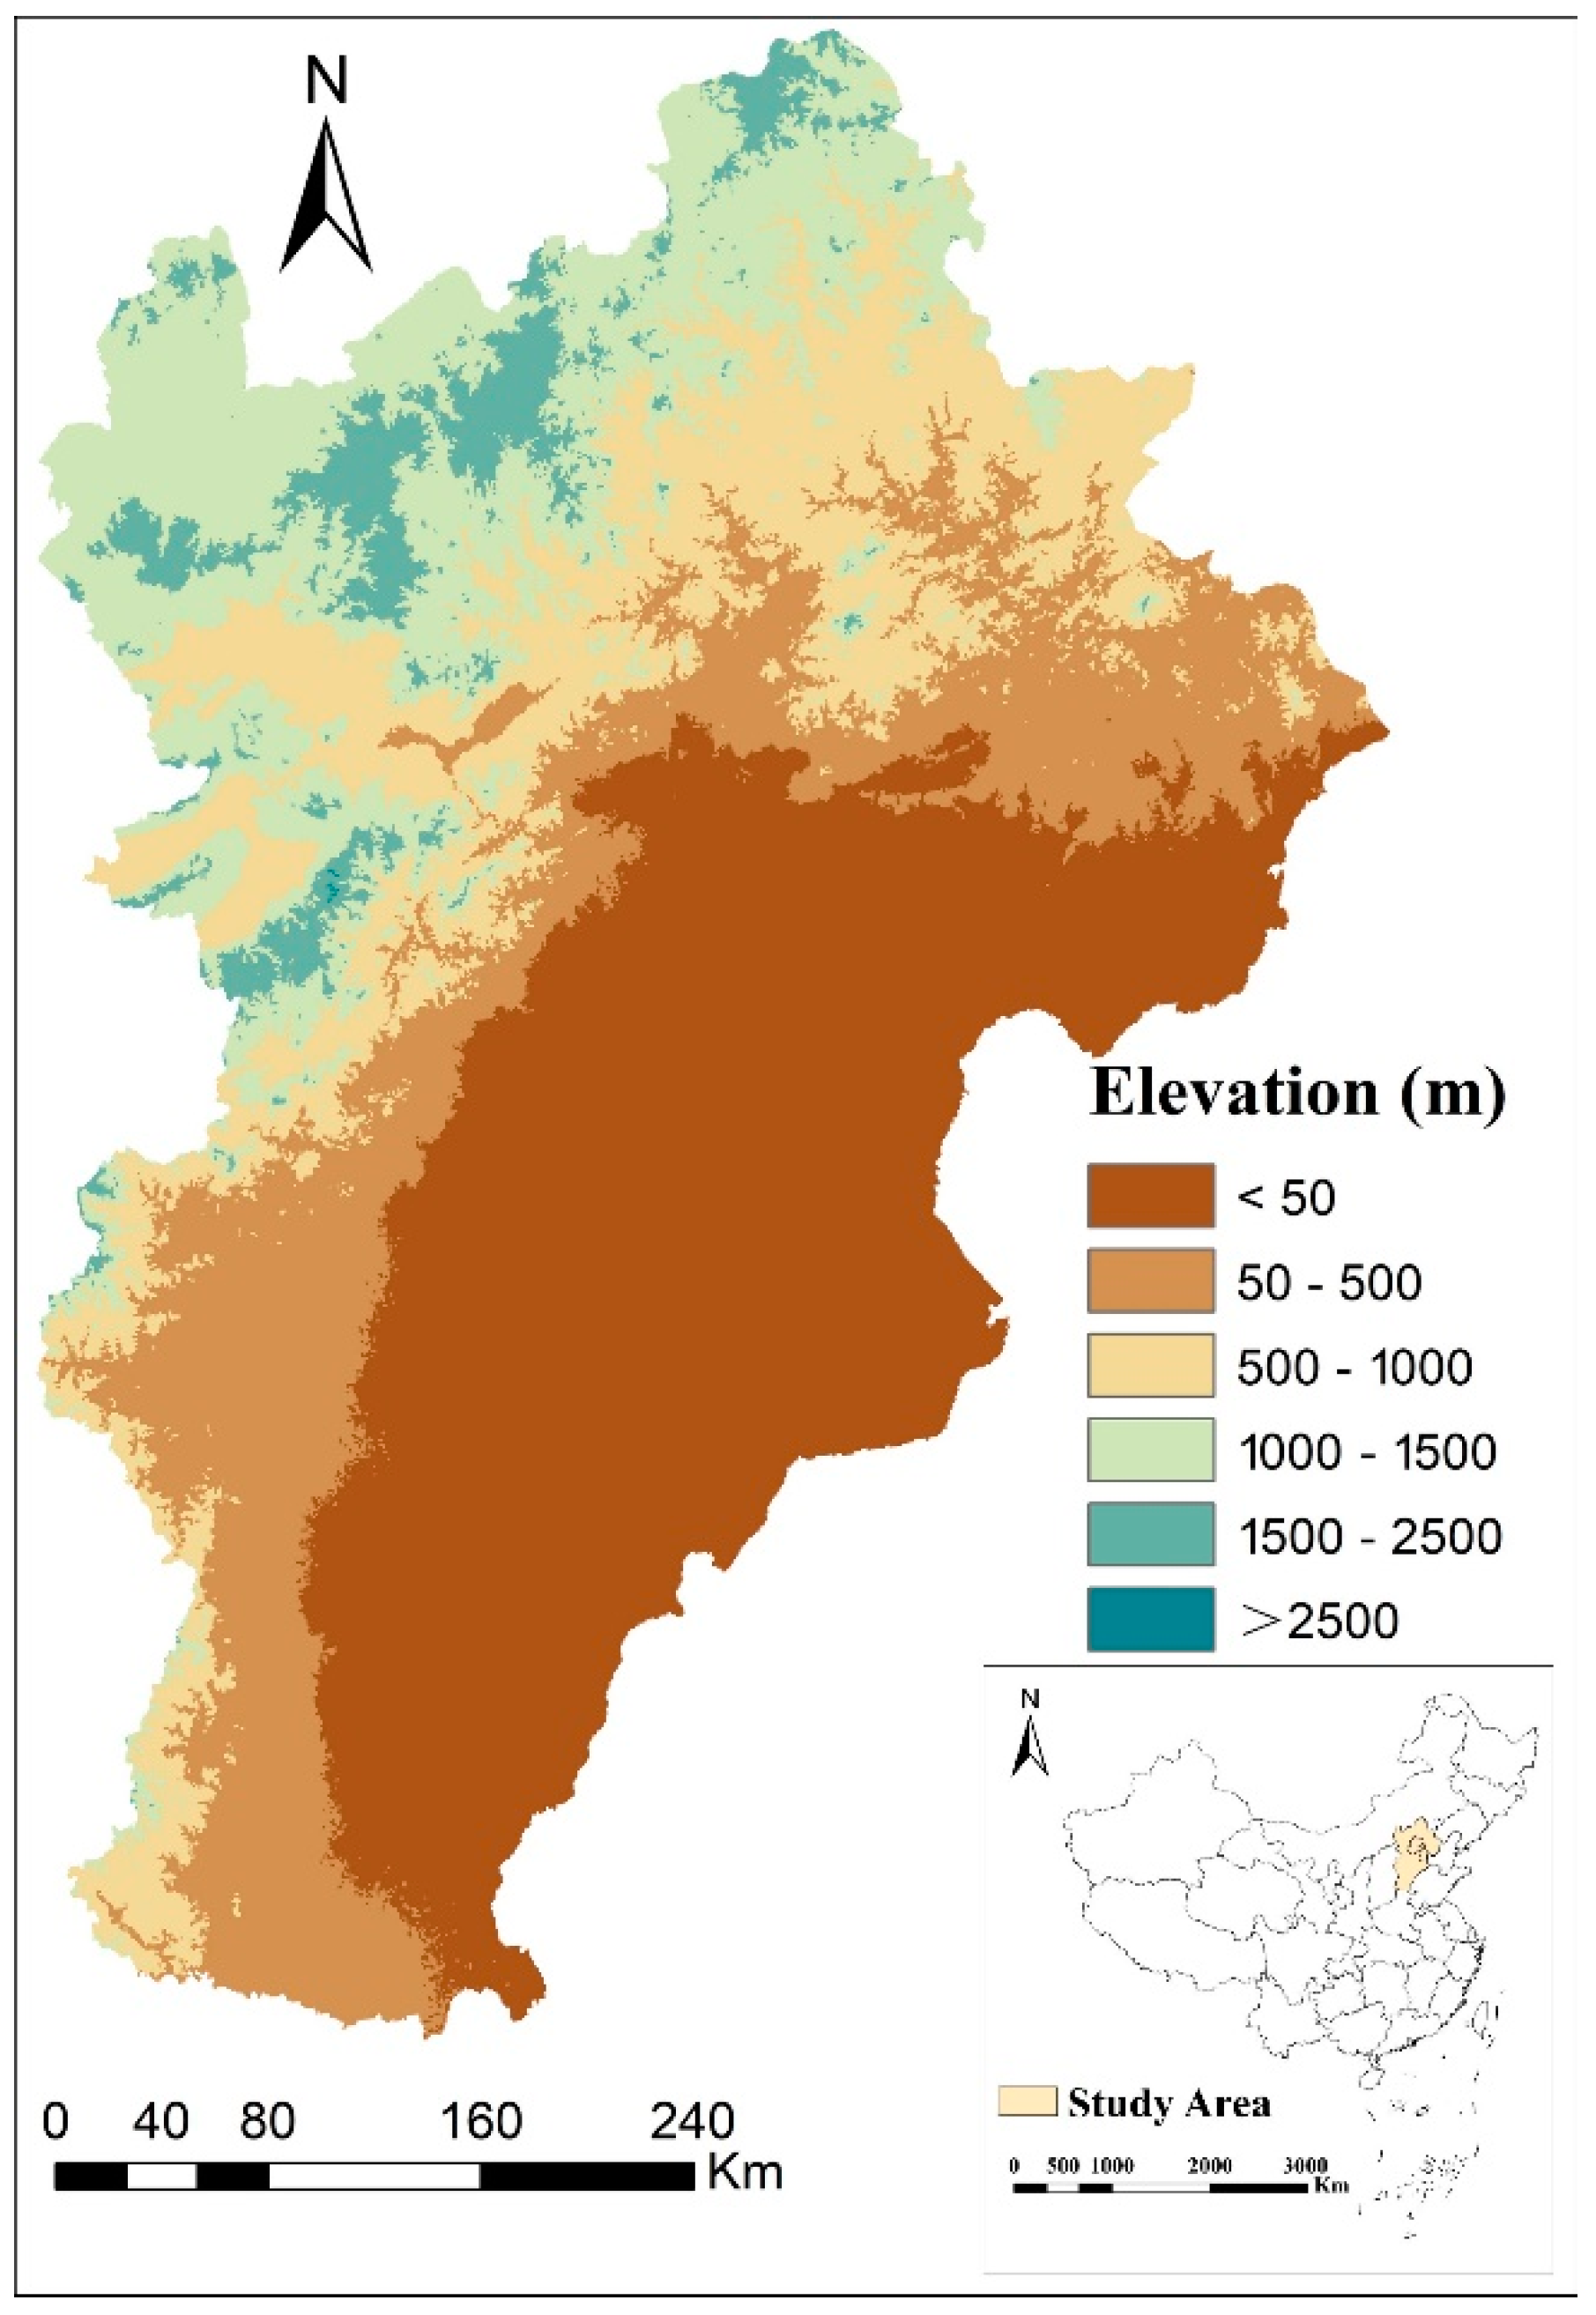
The three following principles were used to select specific indicators for different types of drivers: interpretability, being mentioned in the relevant literature, and avoiding redundancy. Based on the above principles and the urbanization-eco-environmental quality ecosystem services analysis framework constructed herein, we selected the four most important drivers for urbanization and eco-environmental quality and added four additional indicators related to background topography or climate as control variables to ensure the comprehensiveness of the MGWR model. For example, variables such as topographic position index and photosynthetically active radiation were discarded because they would significantly increase the multicollinearity of the MGWR model (i.e., making the local collinearity index of the model generally greater than 15). The built-up area (BUA) [35] represents the scale of urbanization, nighttime light intensity (NTL) represents the dynamism of economic development [11], the population density (PD) [36] represents the impact of human activities, and the percentage of impervious surfaces in urban areas (UISA) [37] represents the structural configuration of land use in urbanization. Regarding the specific indicators of ecological quality, we selected the four that are most commonly used to assess ecological quality: normalized difference vegetation index (NDVI) [38] to characterize the greenness of vegetation in the region, fine particulate matter (PM2.5) [39] to characterize the level of air pollution in the region, and relative humidity (RH) [40] and air temperature. We added four additional control variables to assess the effects of urbanization and ecological quality on regional carbon storage, including elevation (DEM) [41], slope [42], precipitation [43], and wind speed (WS) [44] to minimize errors resulting from the topography and climate.

2.2. Study Area

Beijing-Tianjin-Hebei (i.e., the Jingjinji region) is an essential urban agglomeration and economic center in China. It is located in the northern part of the North China Plain (Figure 2), specifically between 36°05′–42°40′N and 113°27′–119°50′E. This region is bounded by the Yanshan Mountains to the north, the Taihang Mountains to the west, and the Bohai Bay to the east. The northwest and northern parts of this region are mountainous. In contrast, the south and east are relatively flat, making Jingjinji a vital ecological perimeter of the North China Plain and a key area in the regional environmental security pattern. Owing to the conflict between urbanization and eco-environmental quality, the regional ecosystem services are facing critical challenges in this area.

2.3. Data

Considering that the available data was limited and that MGWR currently handles only cross-sectional data, data from 2010 and 2018 were used to analyze long-term trends. The following remote sensing and meteorological data were used in this study:
1. From the annual China Land Cover Dataset (CLCD) [45], land use data for 2010 and 2018 were divided into six primary types (cropland, woodland, grassland, built-up areas, water, and unused land). The overall accuracy of the CLCD dataset exceeds 80%.
2. The National Geographic Information Resources Catalogue System (NGIRCSS) provided a comprehensive collection of basic geographic information, primarily based on vectors and cities (https://www.webmap.cn (accessed on 12 August 2022)).
3. The elevation was determined using Shuttle Radar Topography Mission (SRTM) data from the year 2000, with a resolution of 90 m.
4. MODIS NDVI products (MYD13A2 v006) were obtained from NASA’s Terra satellite at a 1-km resolution for 2010 and 2018.
5. High-resolution (1-km) and high-quality fine particulate matter data for China (ChinaHighPM2.5) were collected using the ChinaHighAirPollutants (CHAP) dataset, which is a combination of MODIS/Terra + Aqua, Multi-Angle Implementation of Atmospheric Correction (MAIAC), and a variety of human and natural factors using the Space-Time Extra Tree (STET) model [46,47].
6. An integrated and consistent annual NTL product was developed for 2010 and 2018 based on a harmonized global nighttime light dataset [48].
7. Meteorological data (i.e., precipitation, relative humidity, air temperature, and wind speed) was spatially interpolated in accordance with the observed data in 756 Chinese meteorological stations, which were downloaded from the Resource and Environment Science and Data Center (www.resdc.cn (accessed on 12 August 2022)).
Table 1 shows a descriptive statistical analysis of all variables used in this study.

2.4. Carbon Storage Estimation

There are several factors that affect the carbon storage capabilities of each land cover type, including the densities of above-ground carbon (AGC), below-ground carbon (BGC), soil organic carbon (SOC), and dead organic carbon (DOC) [50]. Based on land use mapping and the parameters of carbon density, the InVEST model calculates the regional carbon storage at the following rate:
C p i k = A × ( D A G C + D B G C + D S O C + D D O C )
where Cp,k (unit: Mg/hm2) refers to carbon storage in the specific cell p associated with the land use type k. A (unit: hm2) refers to the cell area. The densities of AGC, BGC, SOC, and DOC are indicated by DAGC, DBGC, DSOC, and DDOC (unit: Mg/hm2), respectively, according to land use types. The four carbon density types in each land cover were estimated for use in the InVEST model based on past studies [37,51,52,53,54,55,56,57,58] (Table 2). The data in the above literature include both model estimates and field surveys, and this study especially focuses on the carbon storage data in North China to better fit the Beijing-Tianjin-Hebei region.

2.5. MGWR Model

The spatial autocorrelation observed in previous ecosystem services research may be a result of the following reasons: (i) the high level of regional heterogeneity; (ii) when comparing with neighboring regions, the difference in urbanization and eco-environmental quality may be highly significant in investigating the relationship between carbon storage and several driving factors using MGWR, which is an improved version of the GWR traditionally used by researchers to analyze these issues. In MGWR, different bandwidths can be assigned to other variables rather than a single global bandwidth [30]. Each observation is associated with estimates of the parameters of MGWR, thus providing a more comprehensive and intuitive understanding of the spatially varying correlation between carbon storage and associated drivers.
A linear regression model for spatial data assumes that the response to stimuli is relatively stationary. Specifically, when the stimuli are the same or similar, they will affect all components of the study area in the same manner. Despite this assumption, there remains data that must be processed according to spatially variant methods, where spatial non-stationarity is manifest. It is possible to address this problem using the GWR, which is formulated as follows:
Y i = α 0 ( i ) + k = 1 p α k ( i ) X ik + ε i , i = 1 , , n
Given that the parameters of the model are different across locations I, the GWR can be estimated as follows:
α ( i ) = ( X T W X ( i ) ) 1 X T W ( i ) Y
Considering that observations located closer to i (latitude and longitude) should be given greater weight than those farther from it, the matrix W(i) can be thought of as a matrix of weights that is subject to changes in i.
GWR estimates the data for the current location based on the data for neighboring locations. Generally, the weighting matrix of a spatial process can typically be determined using various strategies. However, they are typically Gaussian in nature and reflect the types of dependencies that often exist in spatial processes. Weighing methods can be classified as either adaptive or fixed. Local regression models with a fixed Gaussian kernel use the parameter Wij to identify a continuous function between the location j of the data and the regression location i:
W ij = exp [ ( d i j / h ) 2 2 ]
where dij represents the distance between i and j, and h indicates the bandwidth; if h is increased, the steepness of the kernel gradient will diminish, and the local calibration will include additional data points. During the GWR calibration, it is possible to determine the optimum value of h. A choice must be made between the variance and bias to select the most appropriate bandwidth. We have minimized the corrected Akaike Information Criterion (AIC) value in each GWR calibration by performing an iterative process to obtain the optimal bandwidth.
The spatial heterogeneity in a relationship can be captured using GWR. However, there is a similar spatial scale to these relationships as they change with each covariate. In addition, as the assumption of the variables with the same spatial scale can be relaxed, MGWR can significantly improve GWR as it can optimize covariate-specific bandwidths. The formulation is as follows:
log Y i = β bw ( U i , V i ) + j β bw ( U i , V i ) log X i j + ε i
where bw* refers to the specific bandwidth that will be used to estimate the corresponding expression for the *th conditional regression equation; several processes can be applied to different spatial scales using MGWR to find the corresponding bandwidths for other dependent relationships involving the response variables and different predictor variables.
The MGWR can be calibrated using Fotheringham et al.’s back-fitting algorithm [30]. Calibration was performed using MGWR 2.2.1 (more information can be found at https://github.com/pysal/mgwr (accessed on 12 August 2022)).

3. Results

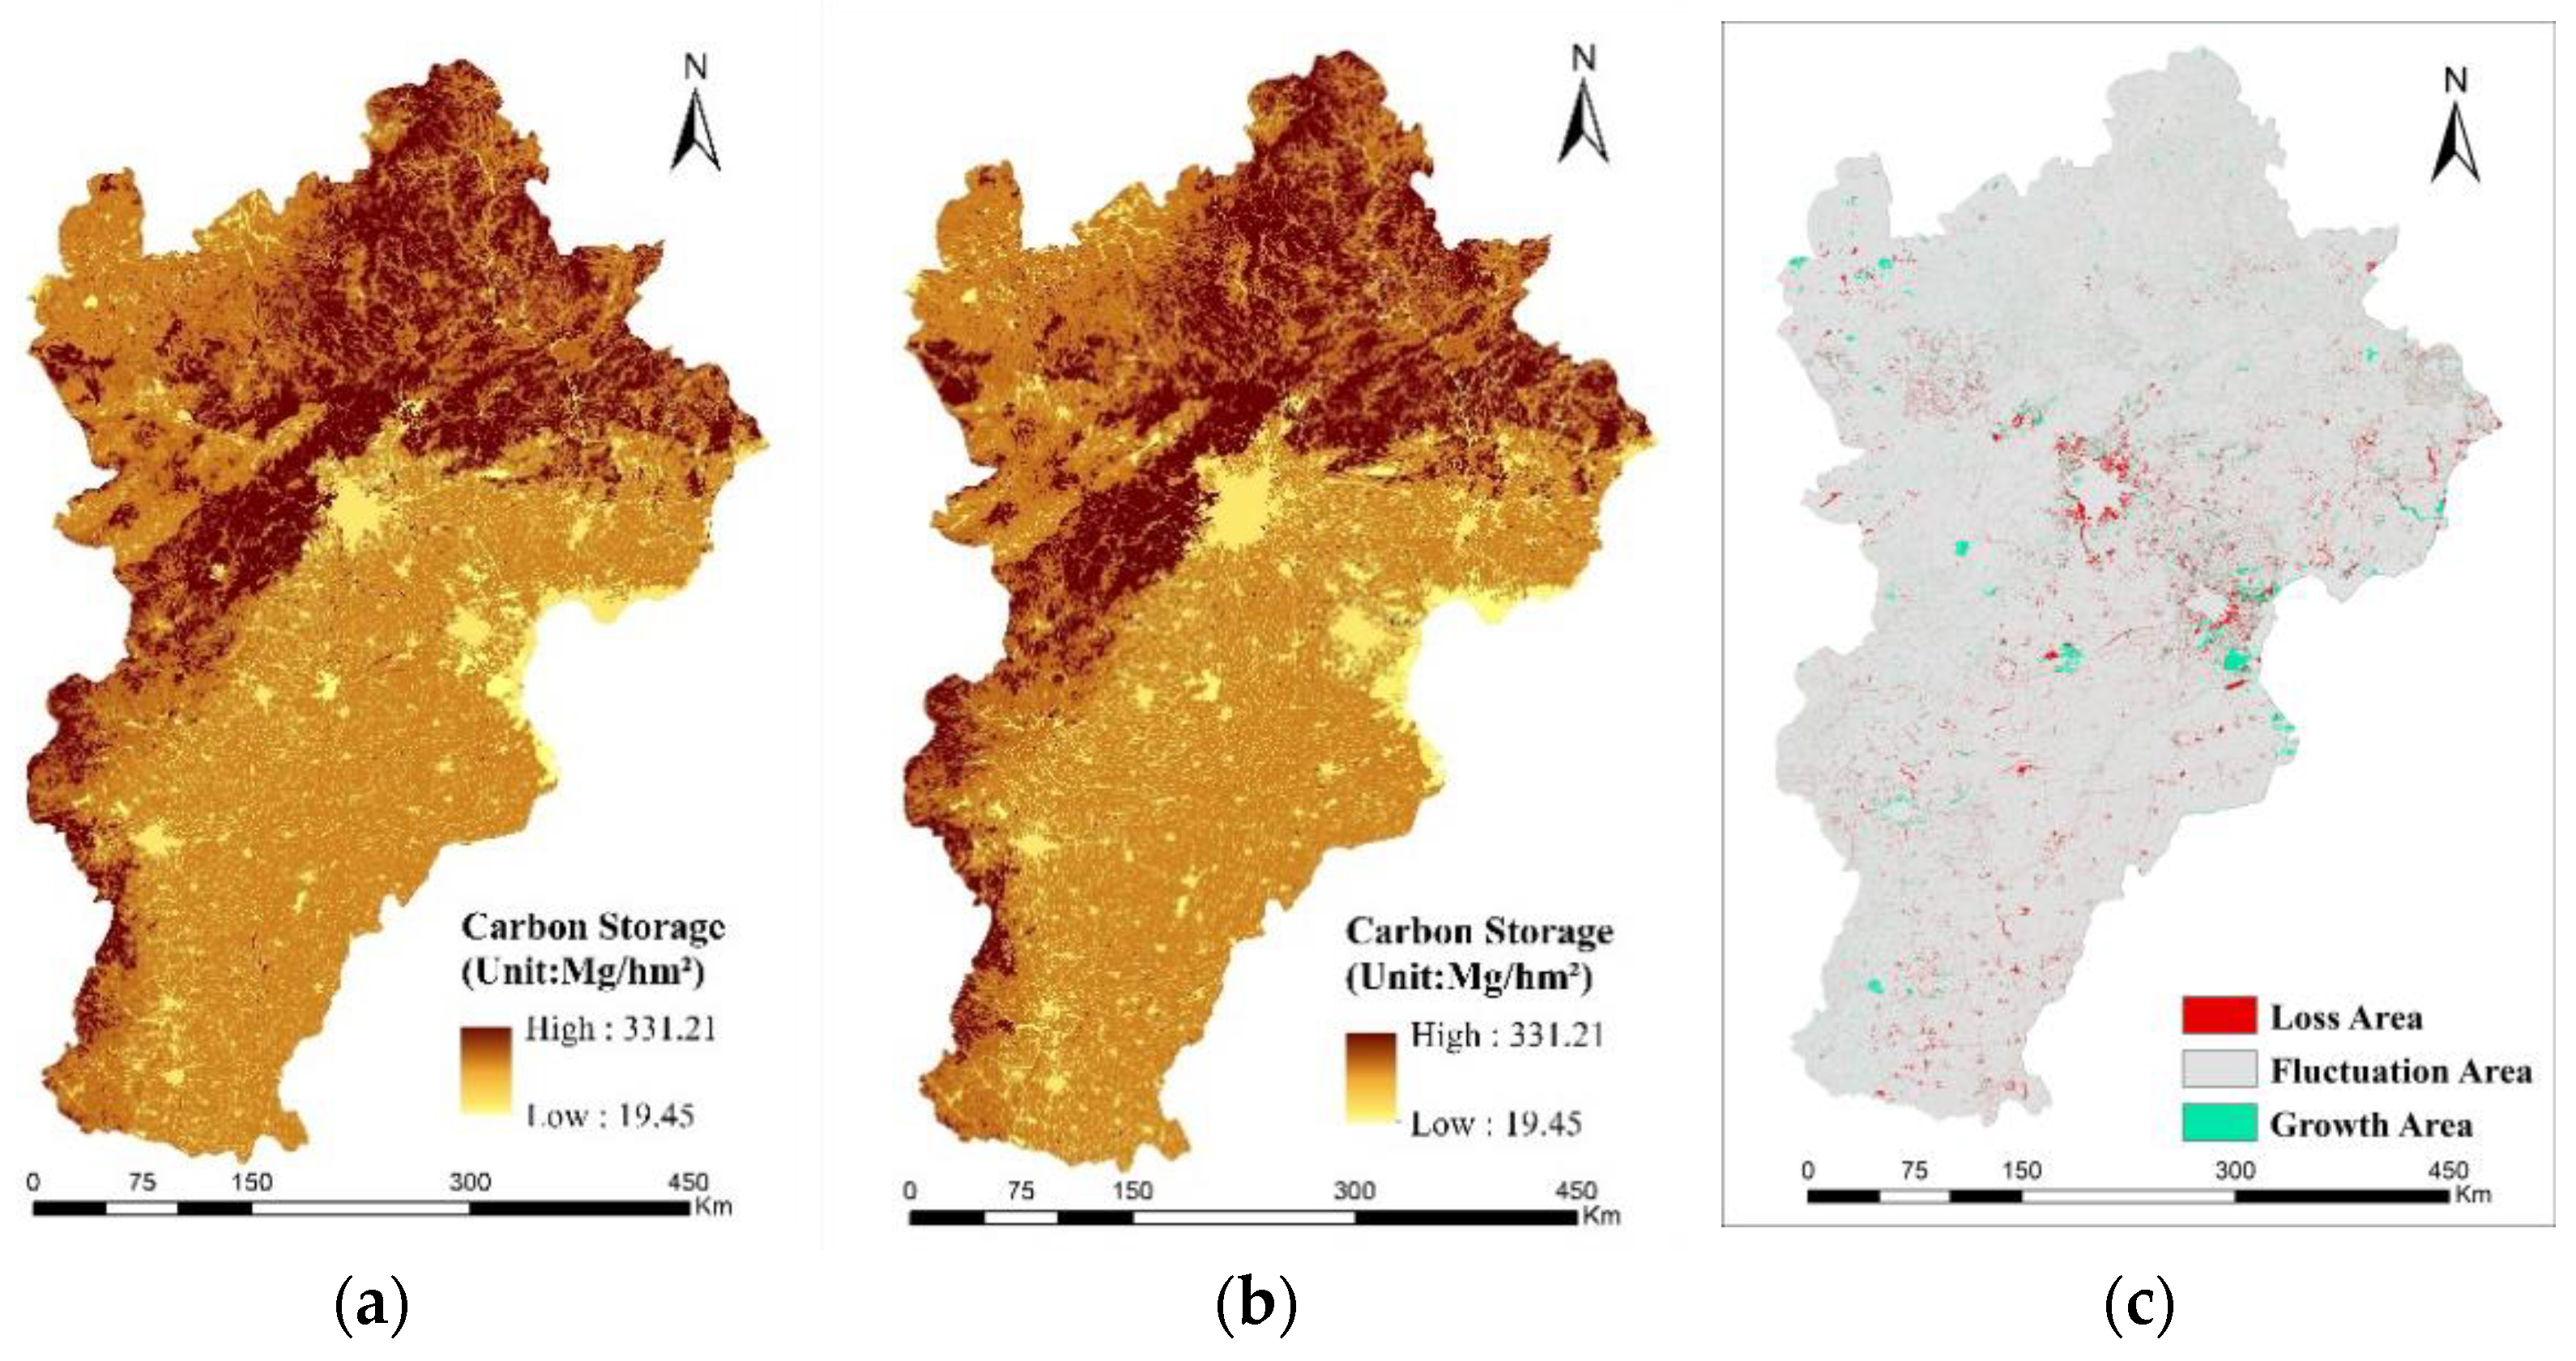
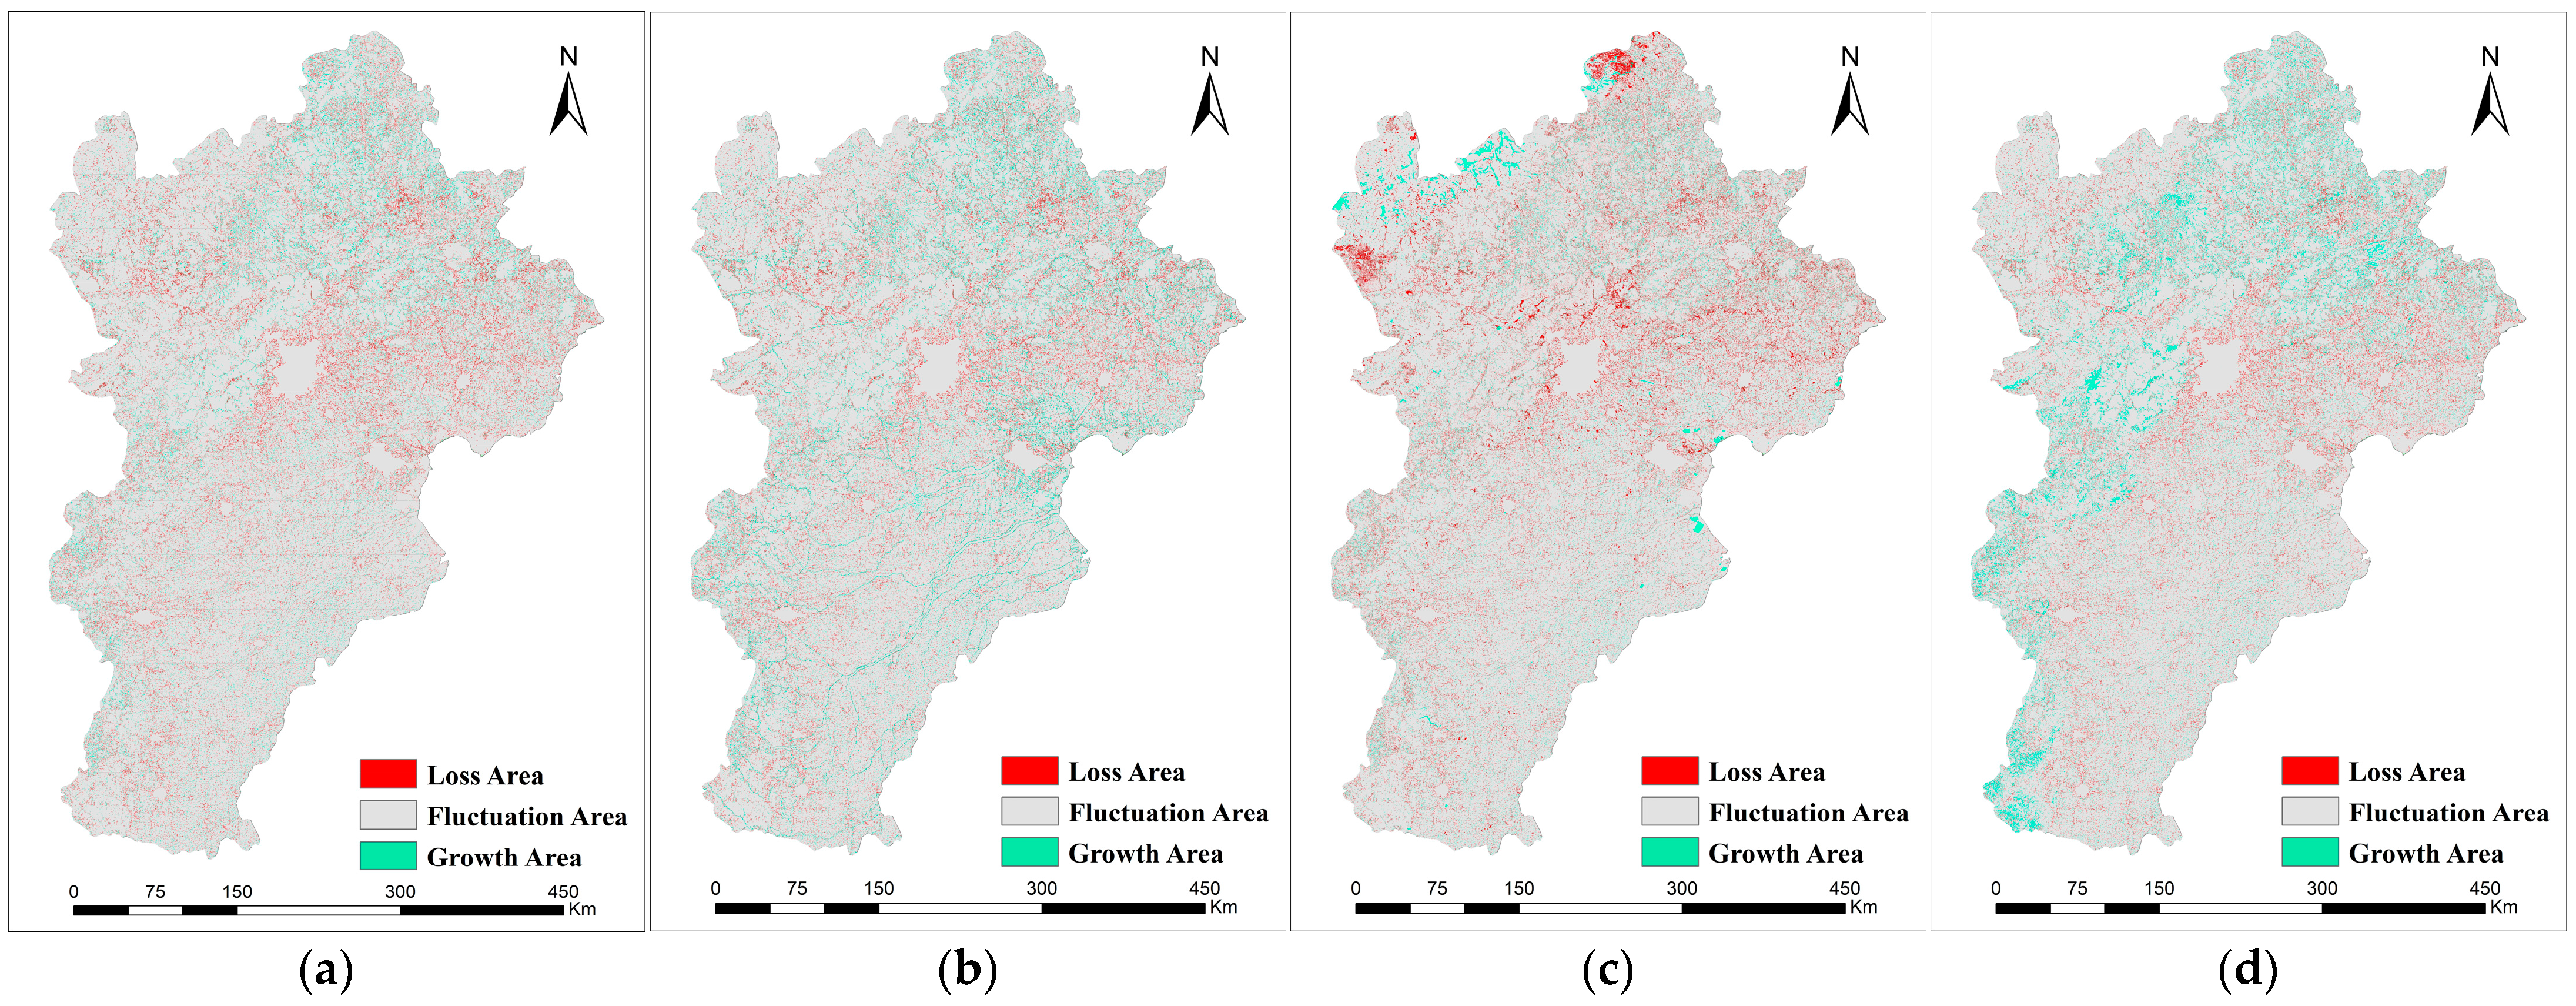
3.1. Patterns of Carbon Storage in Space and Time
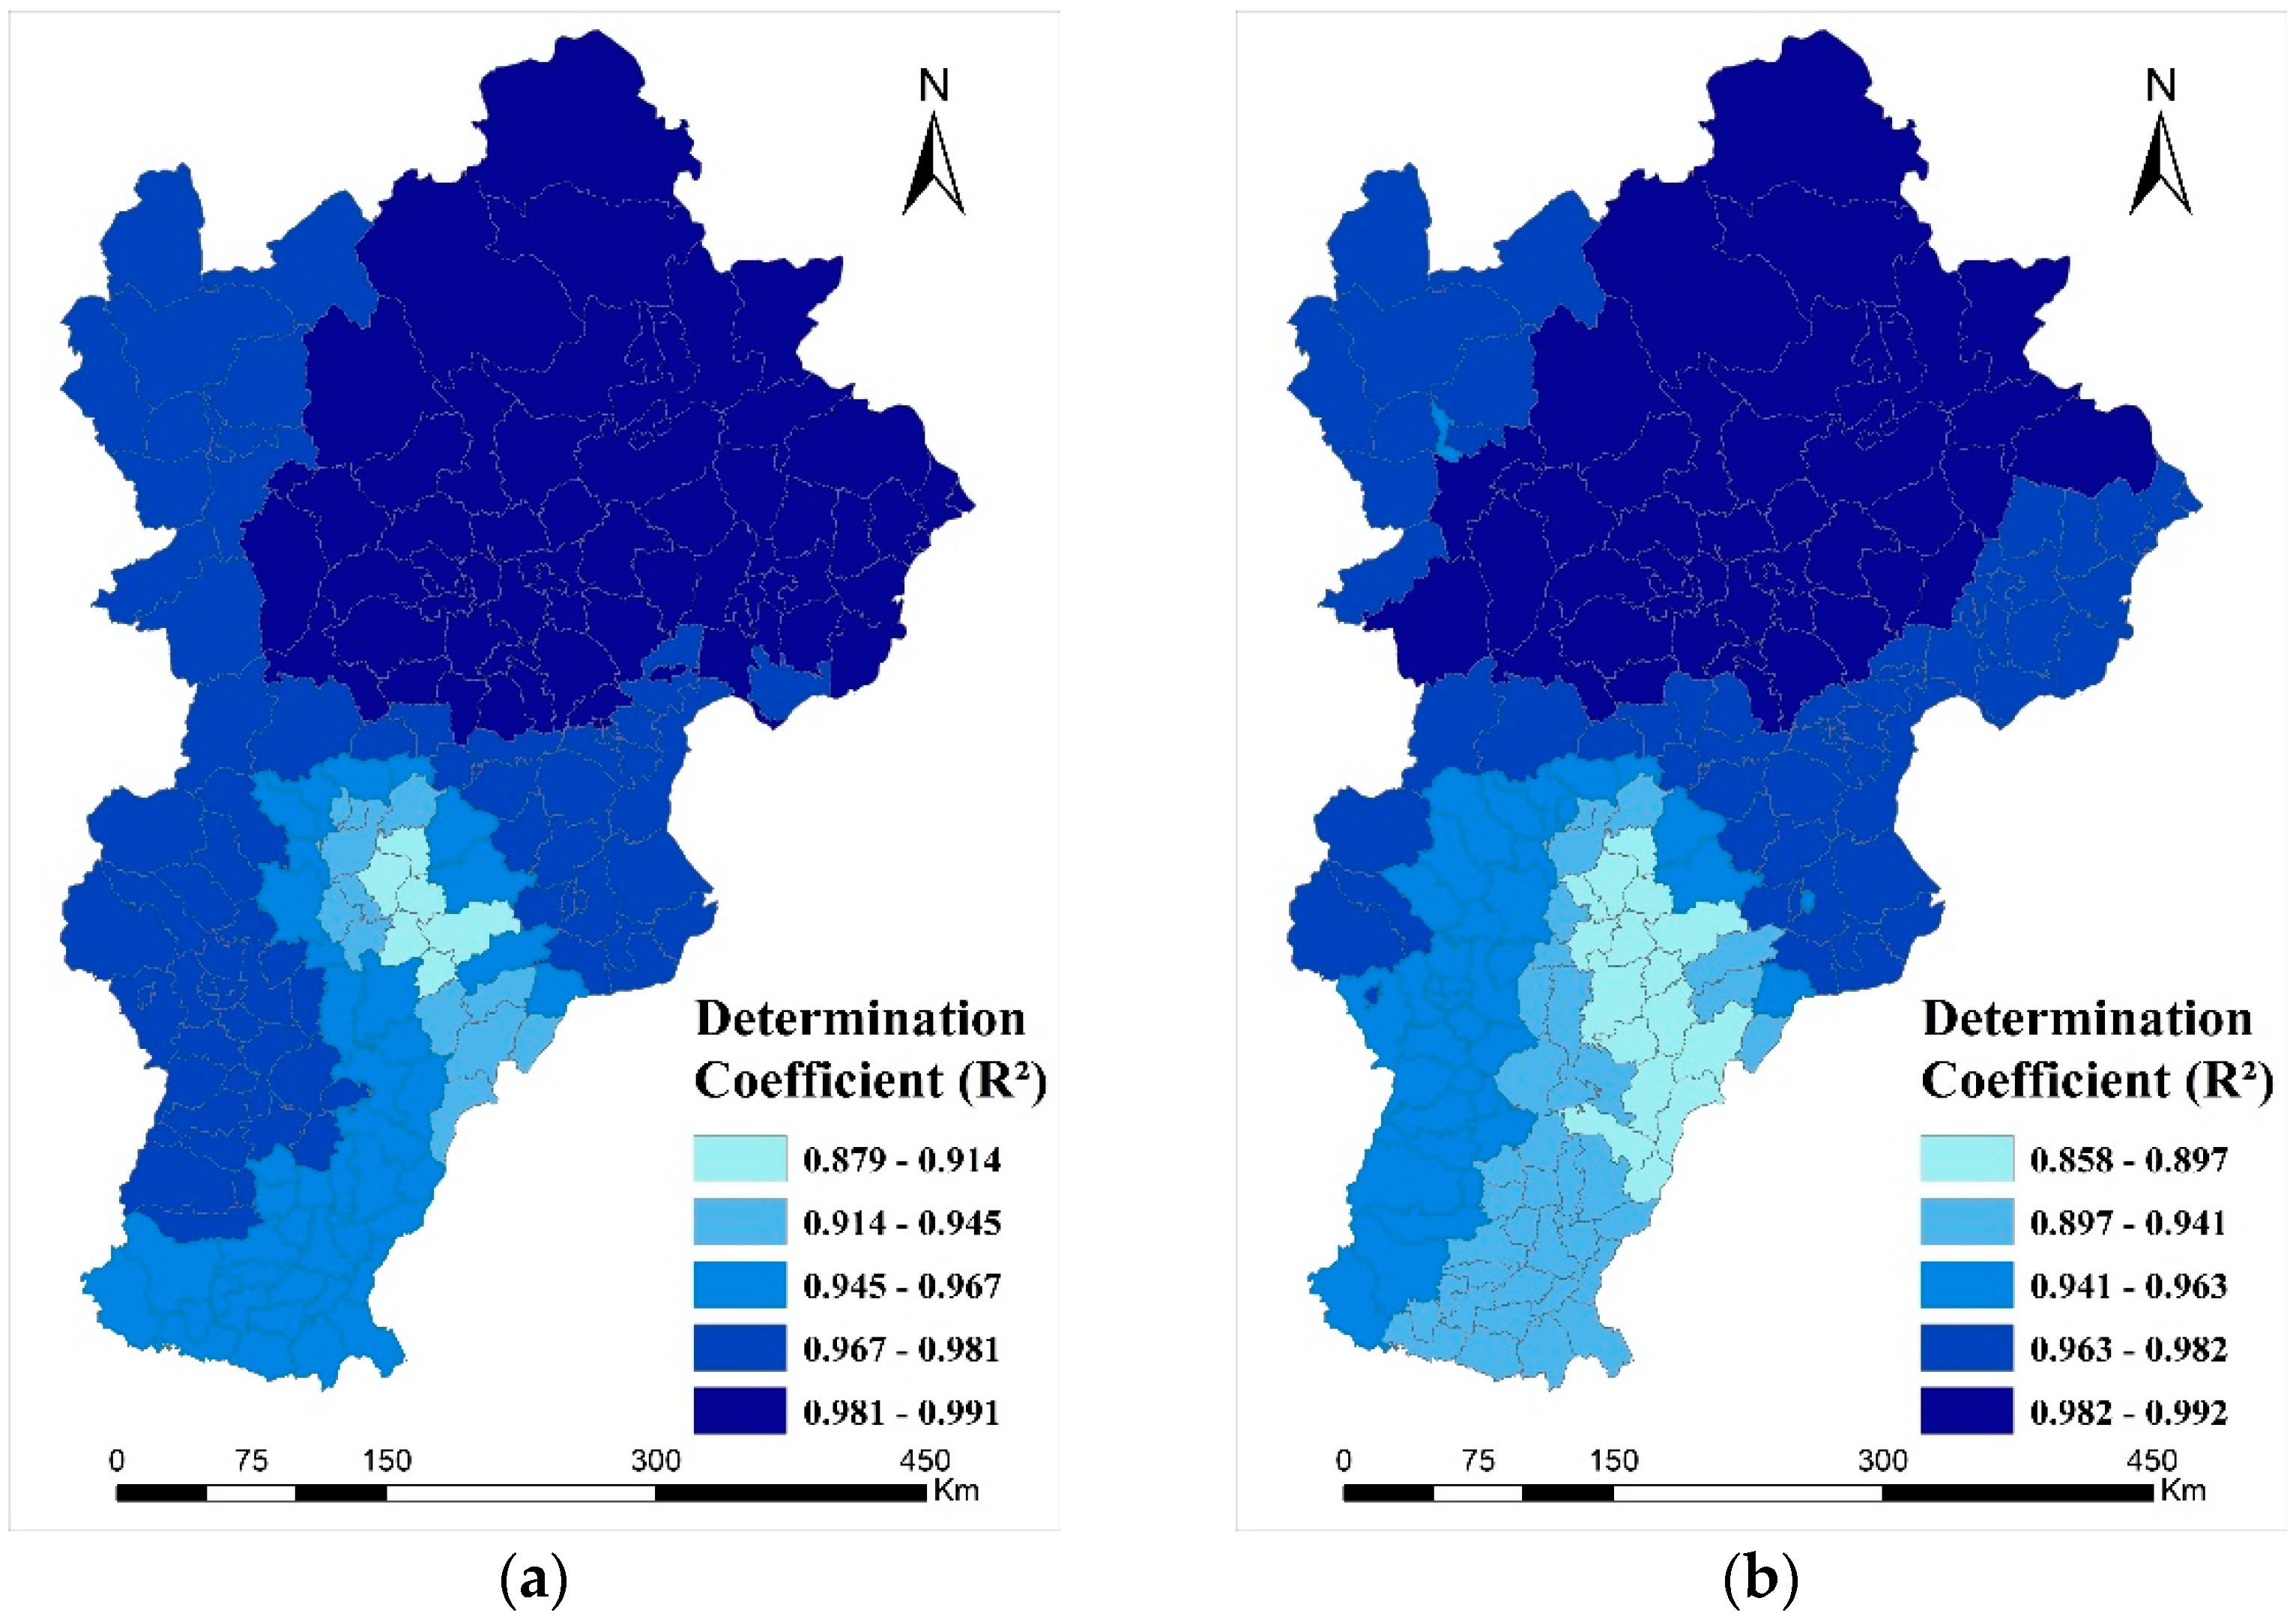
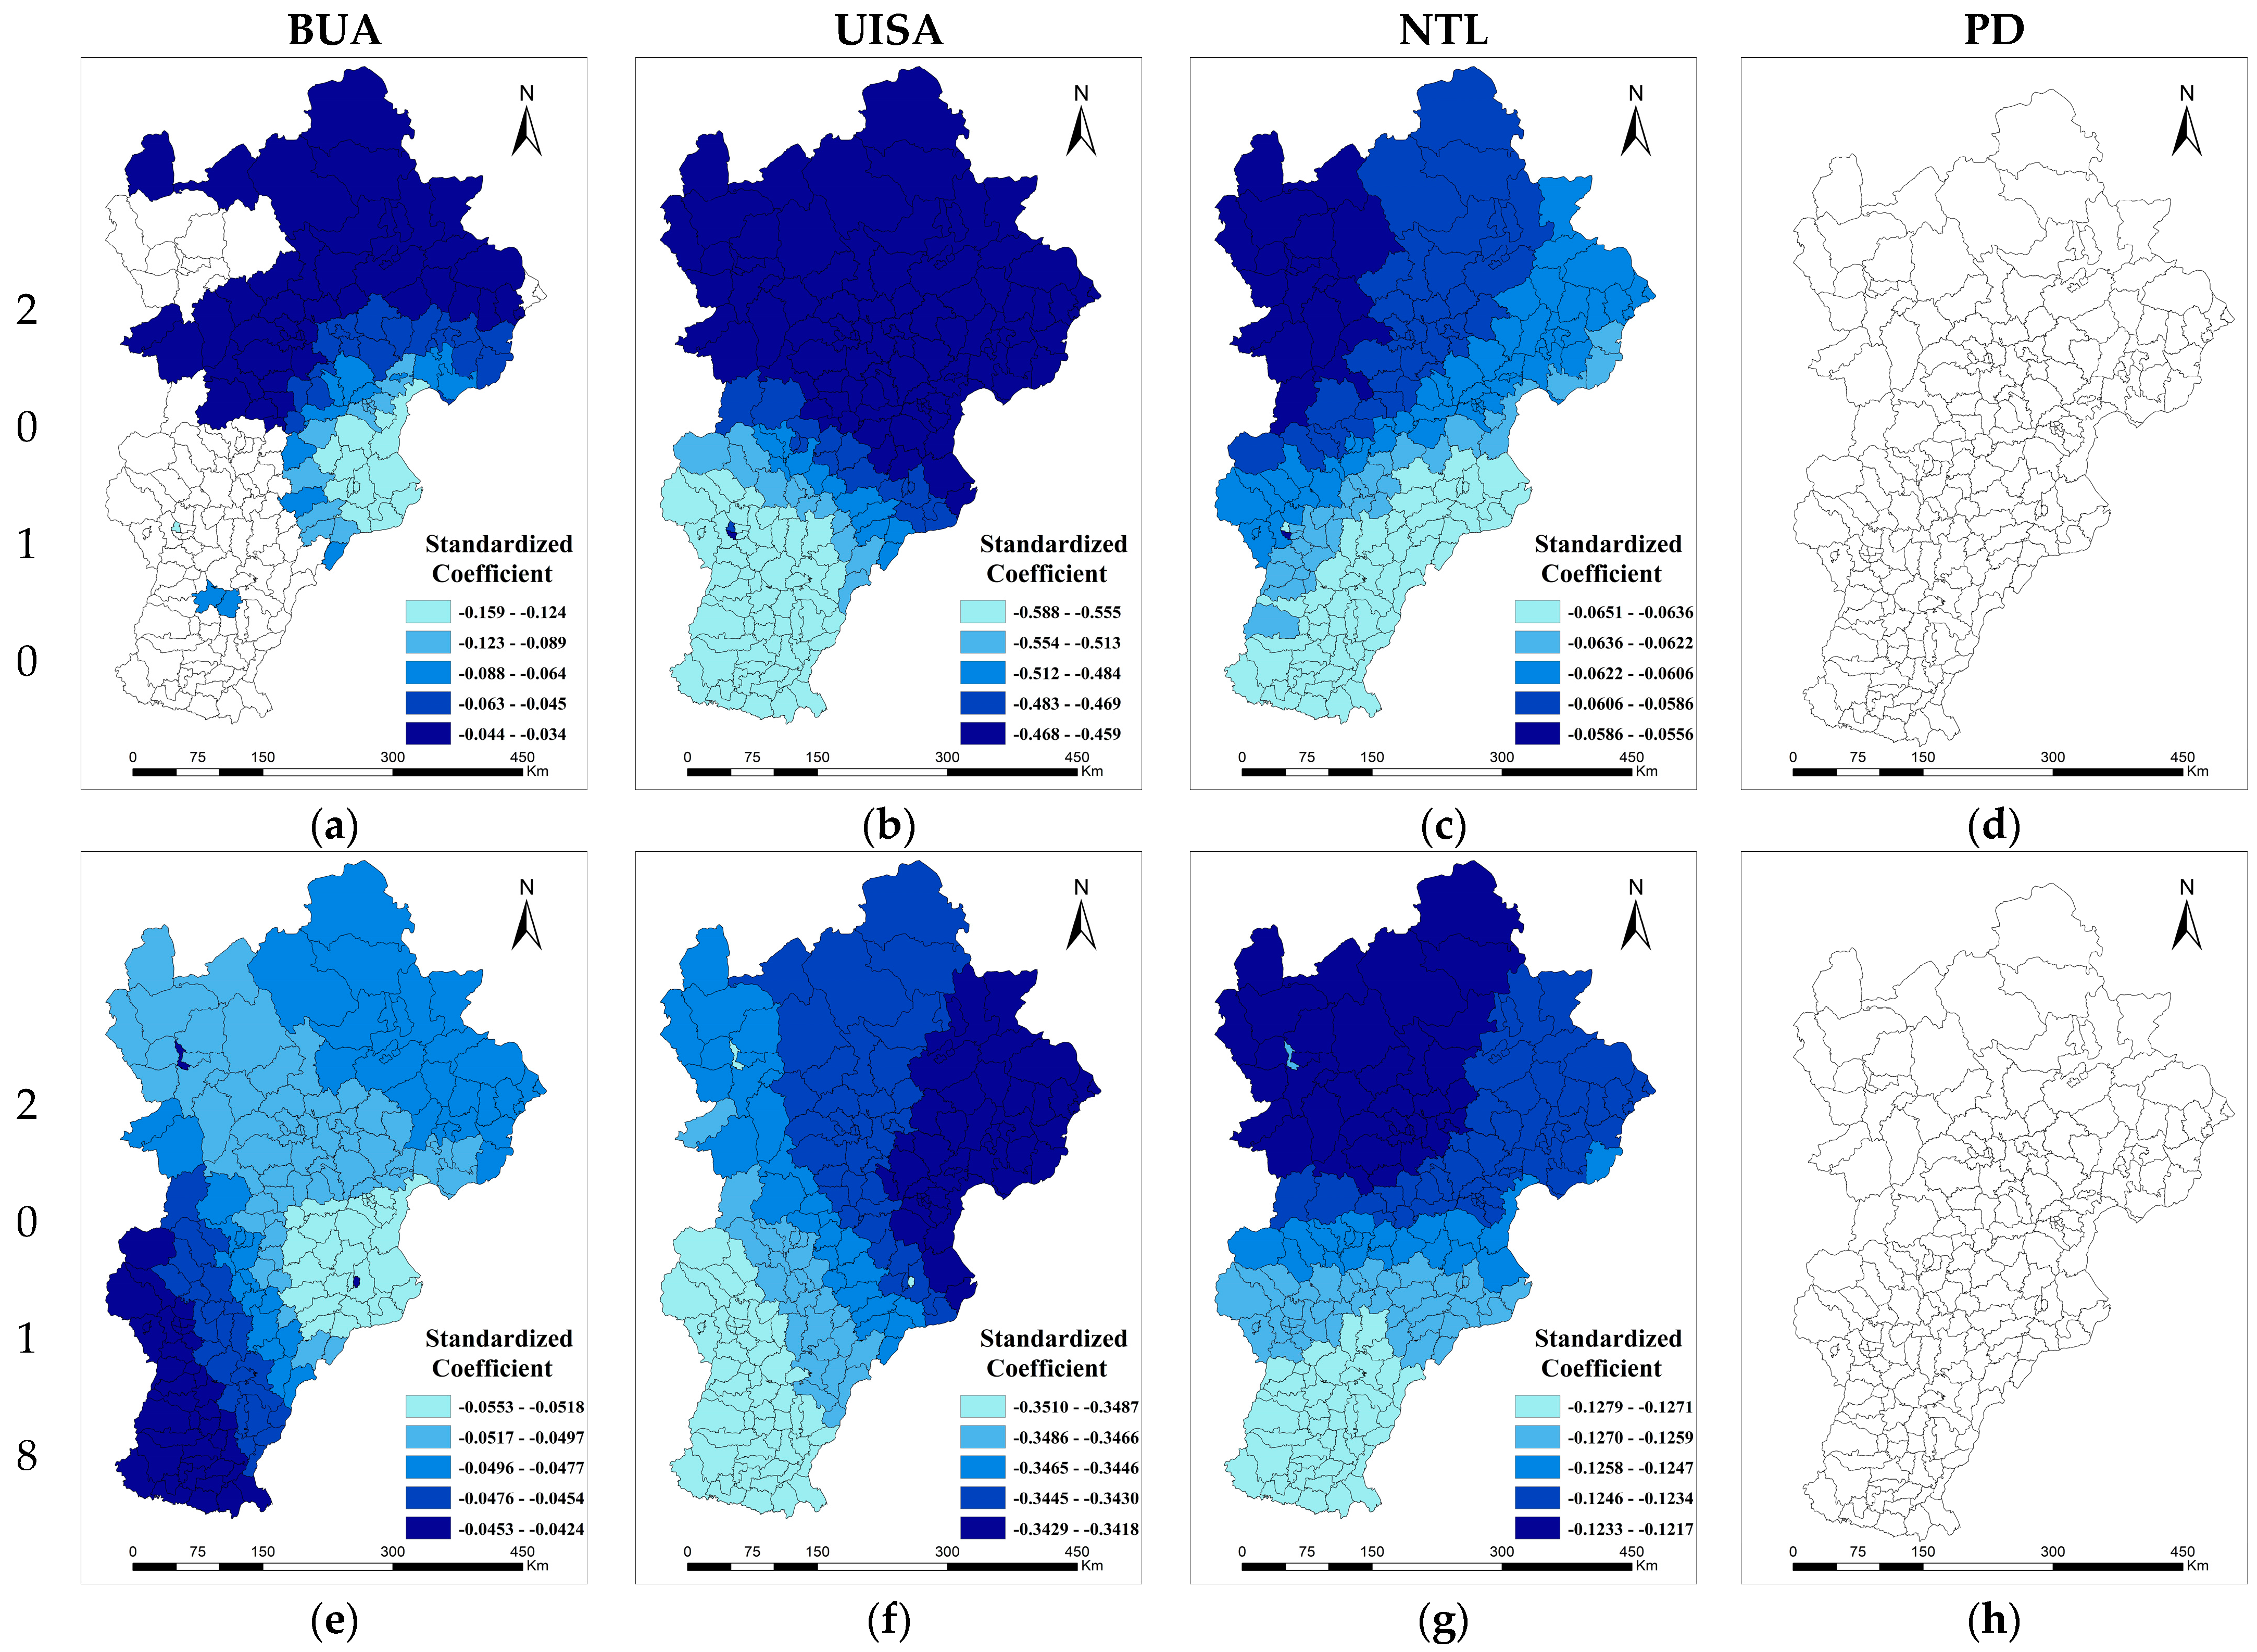
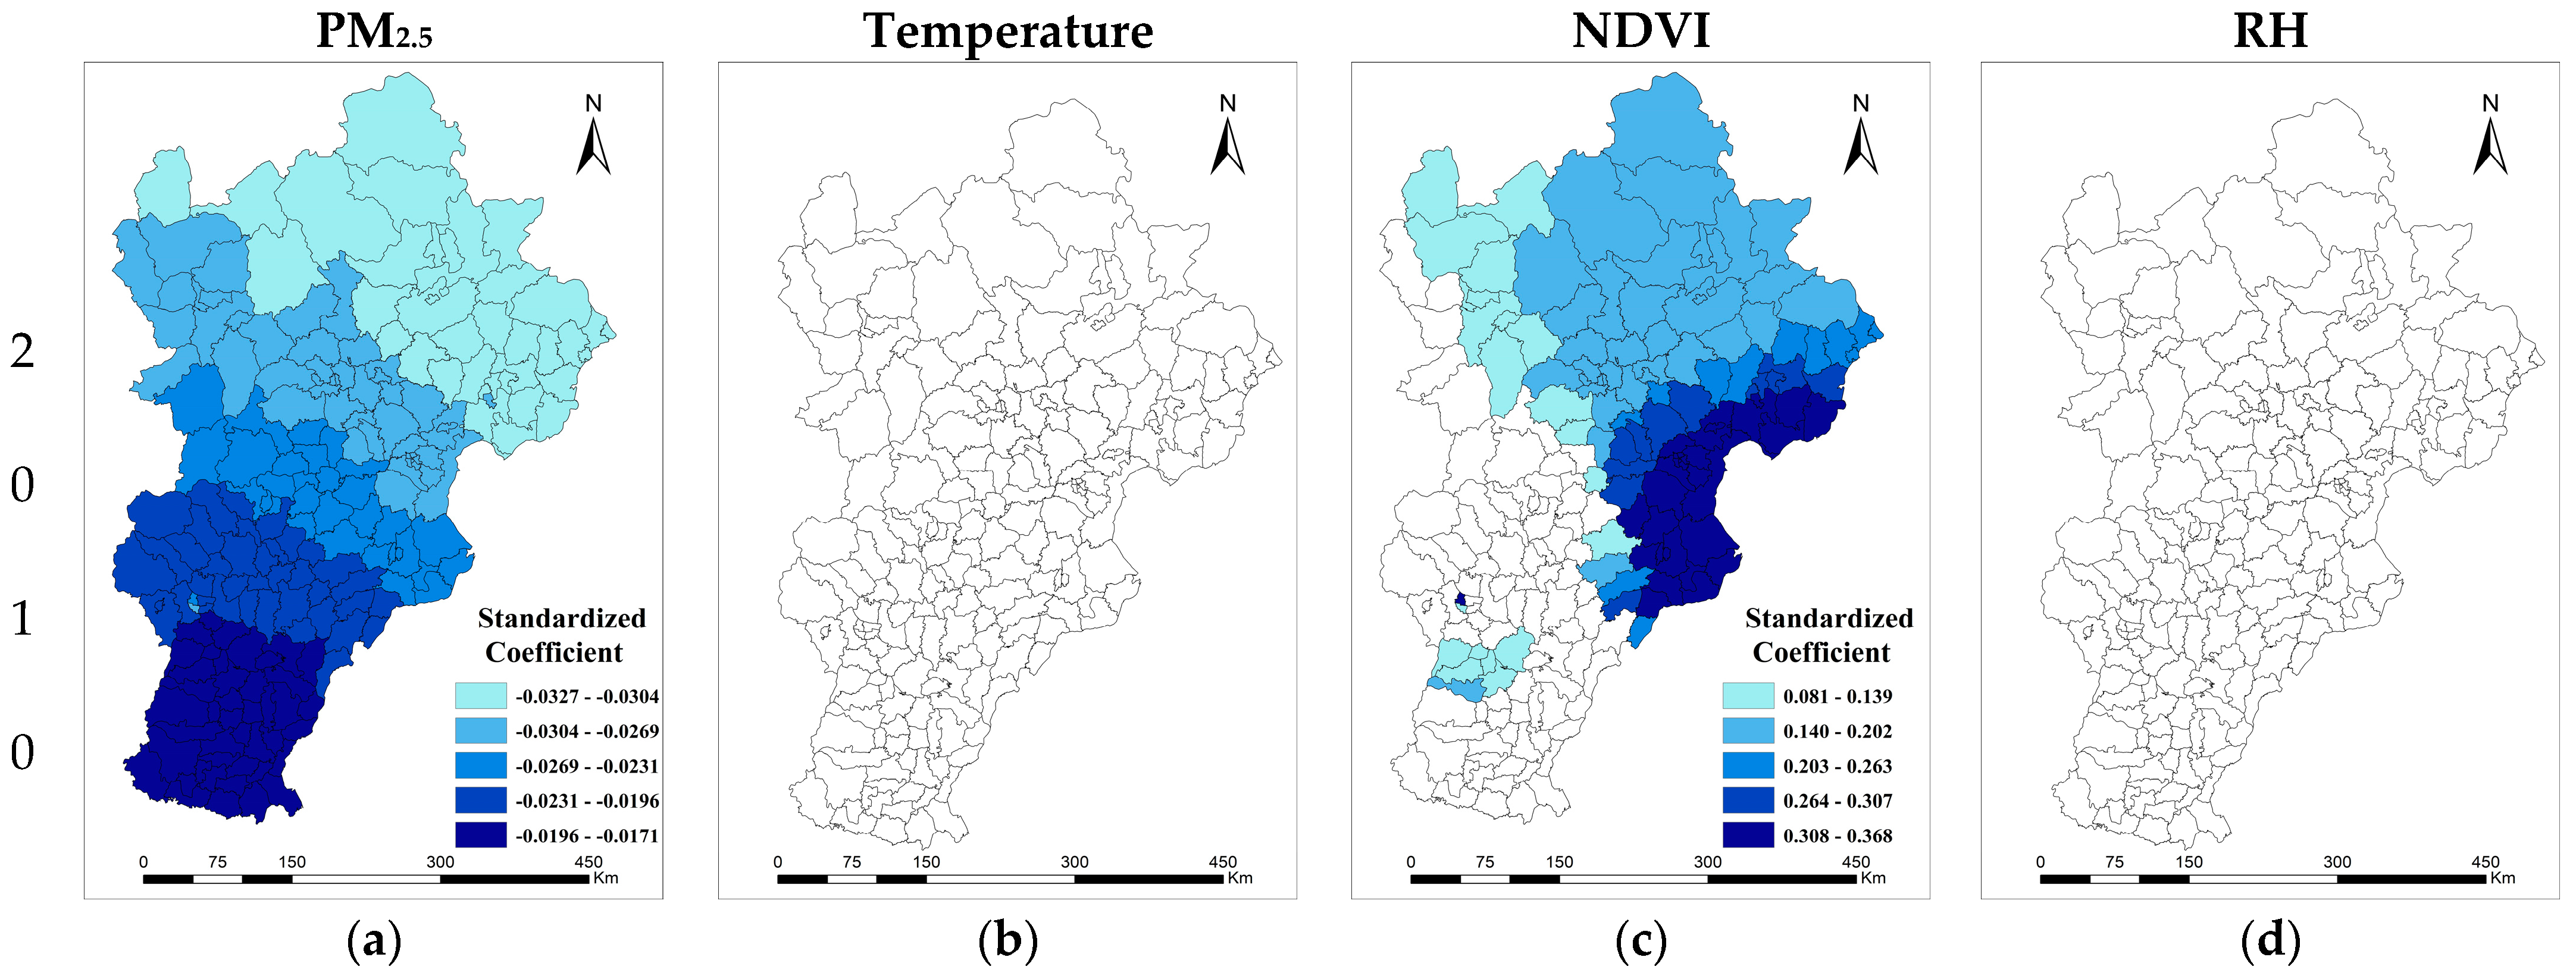
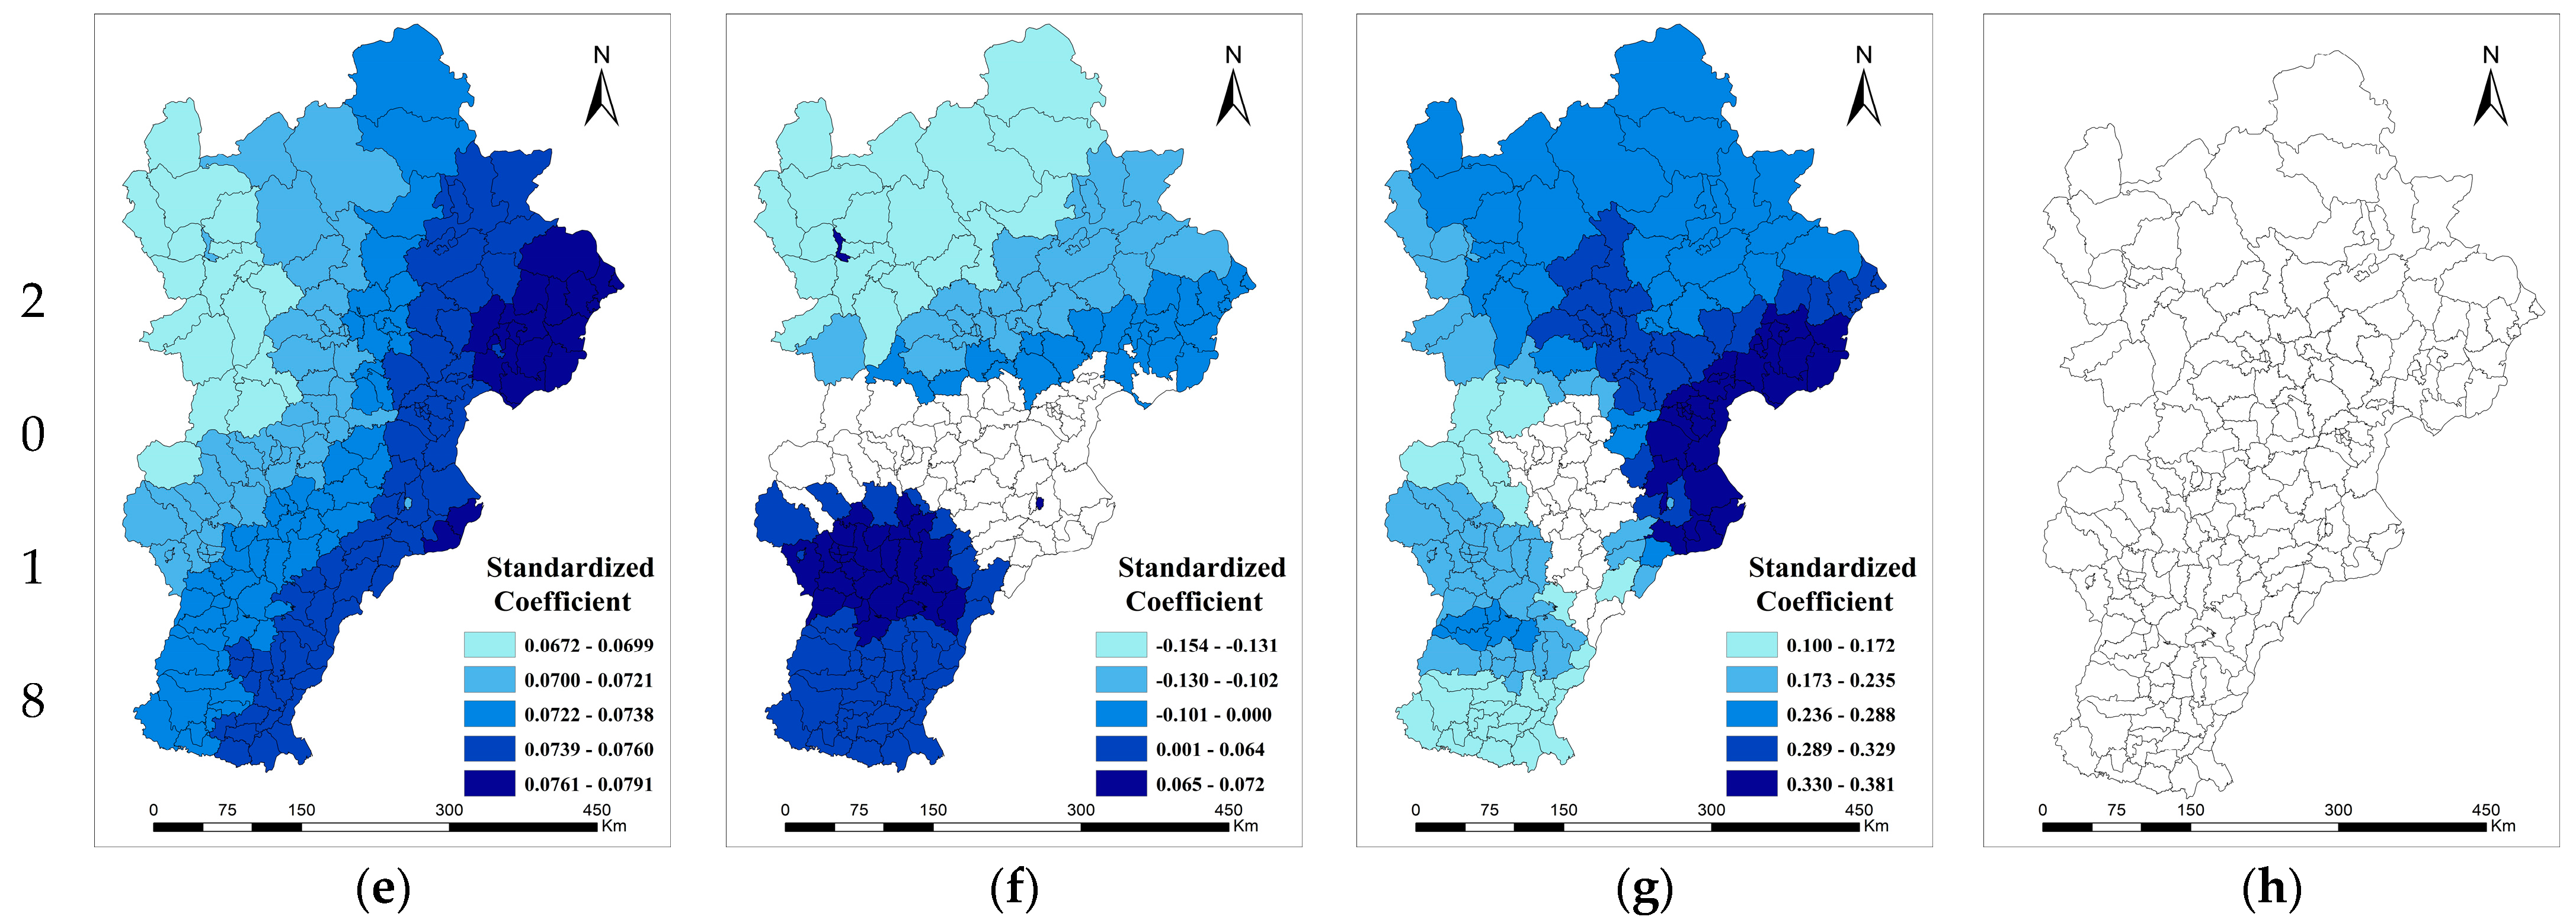
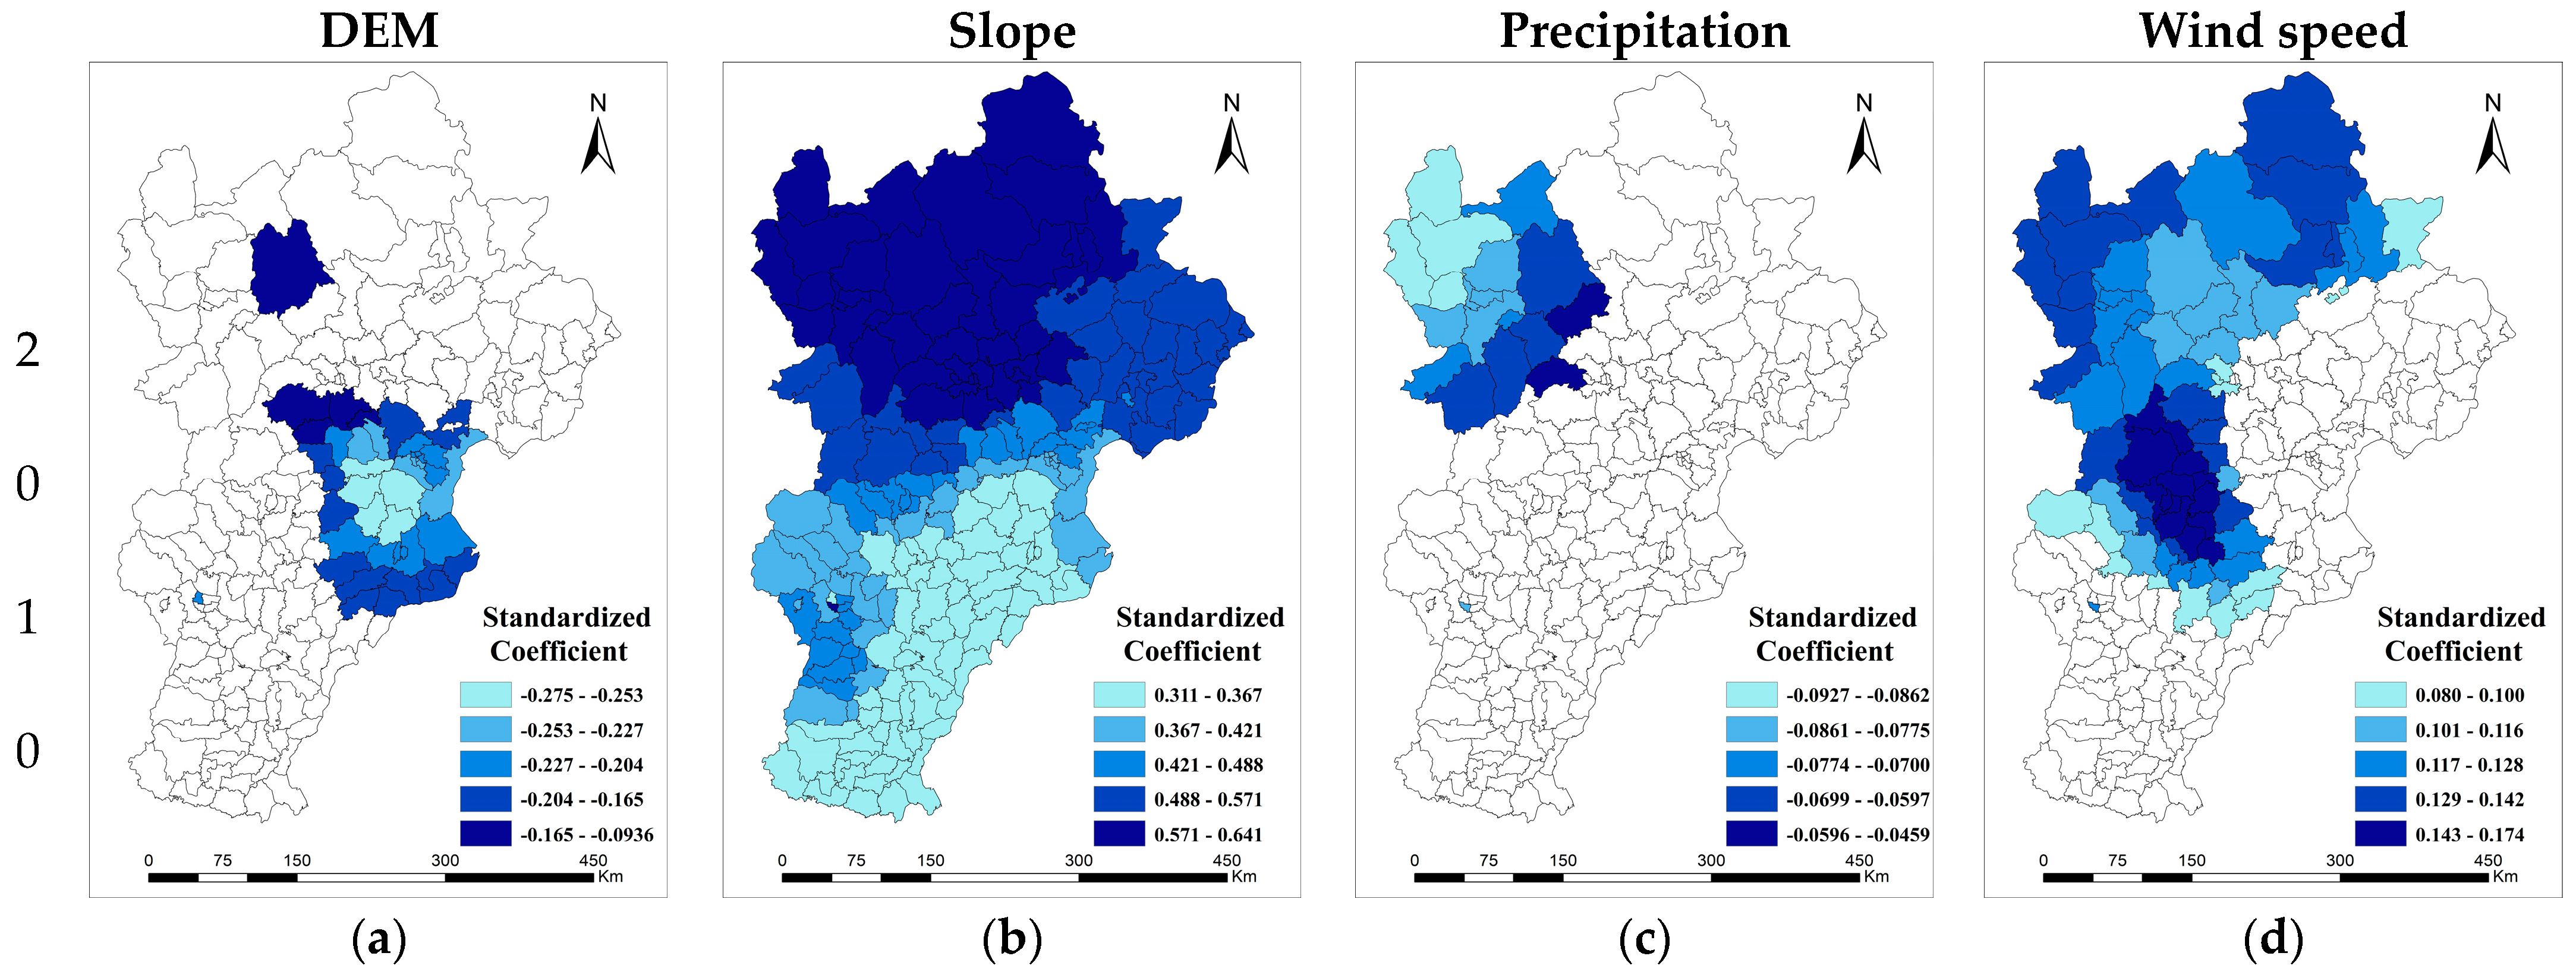
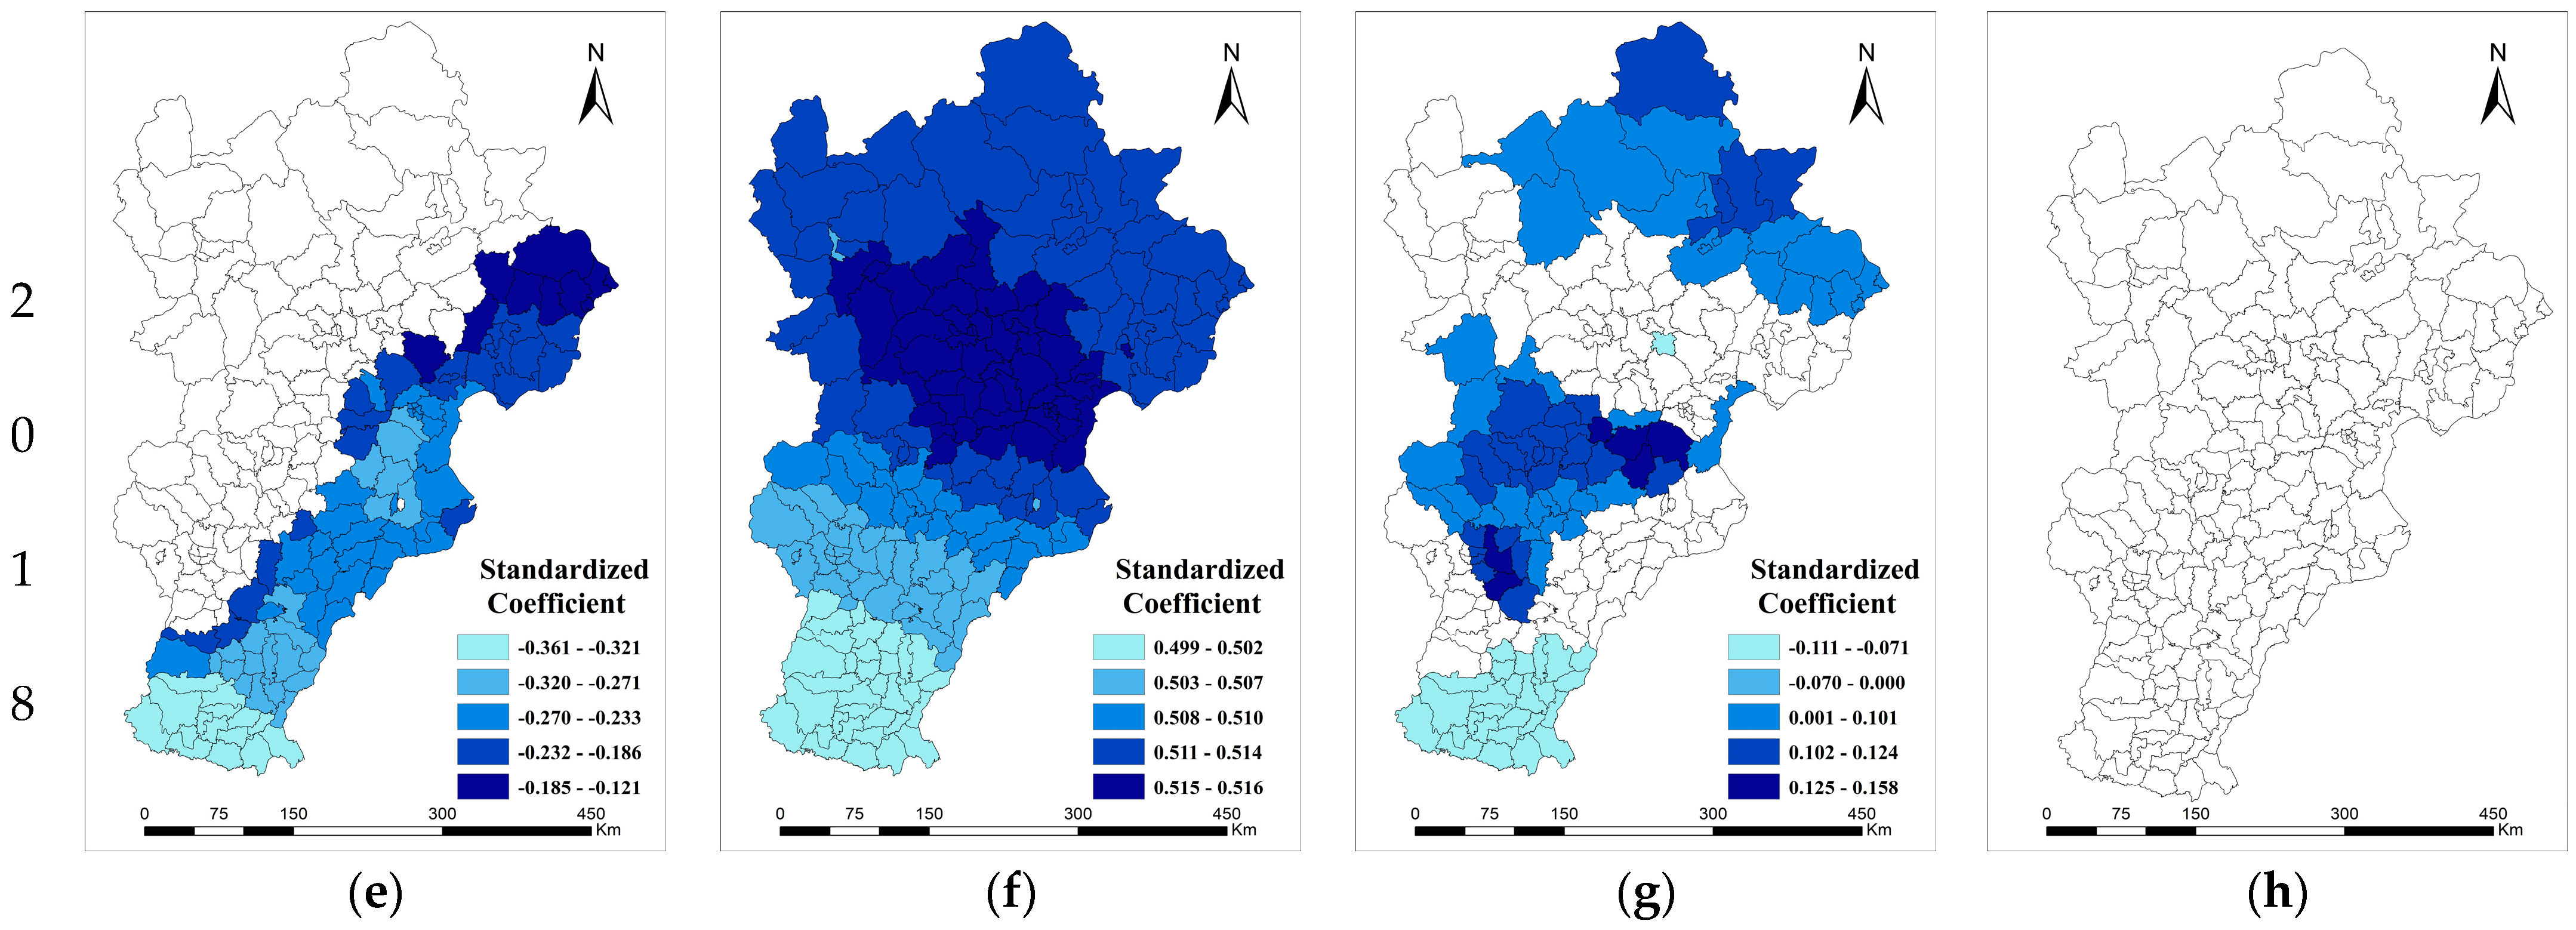
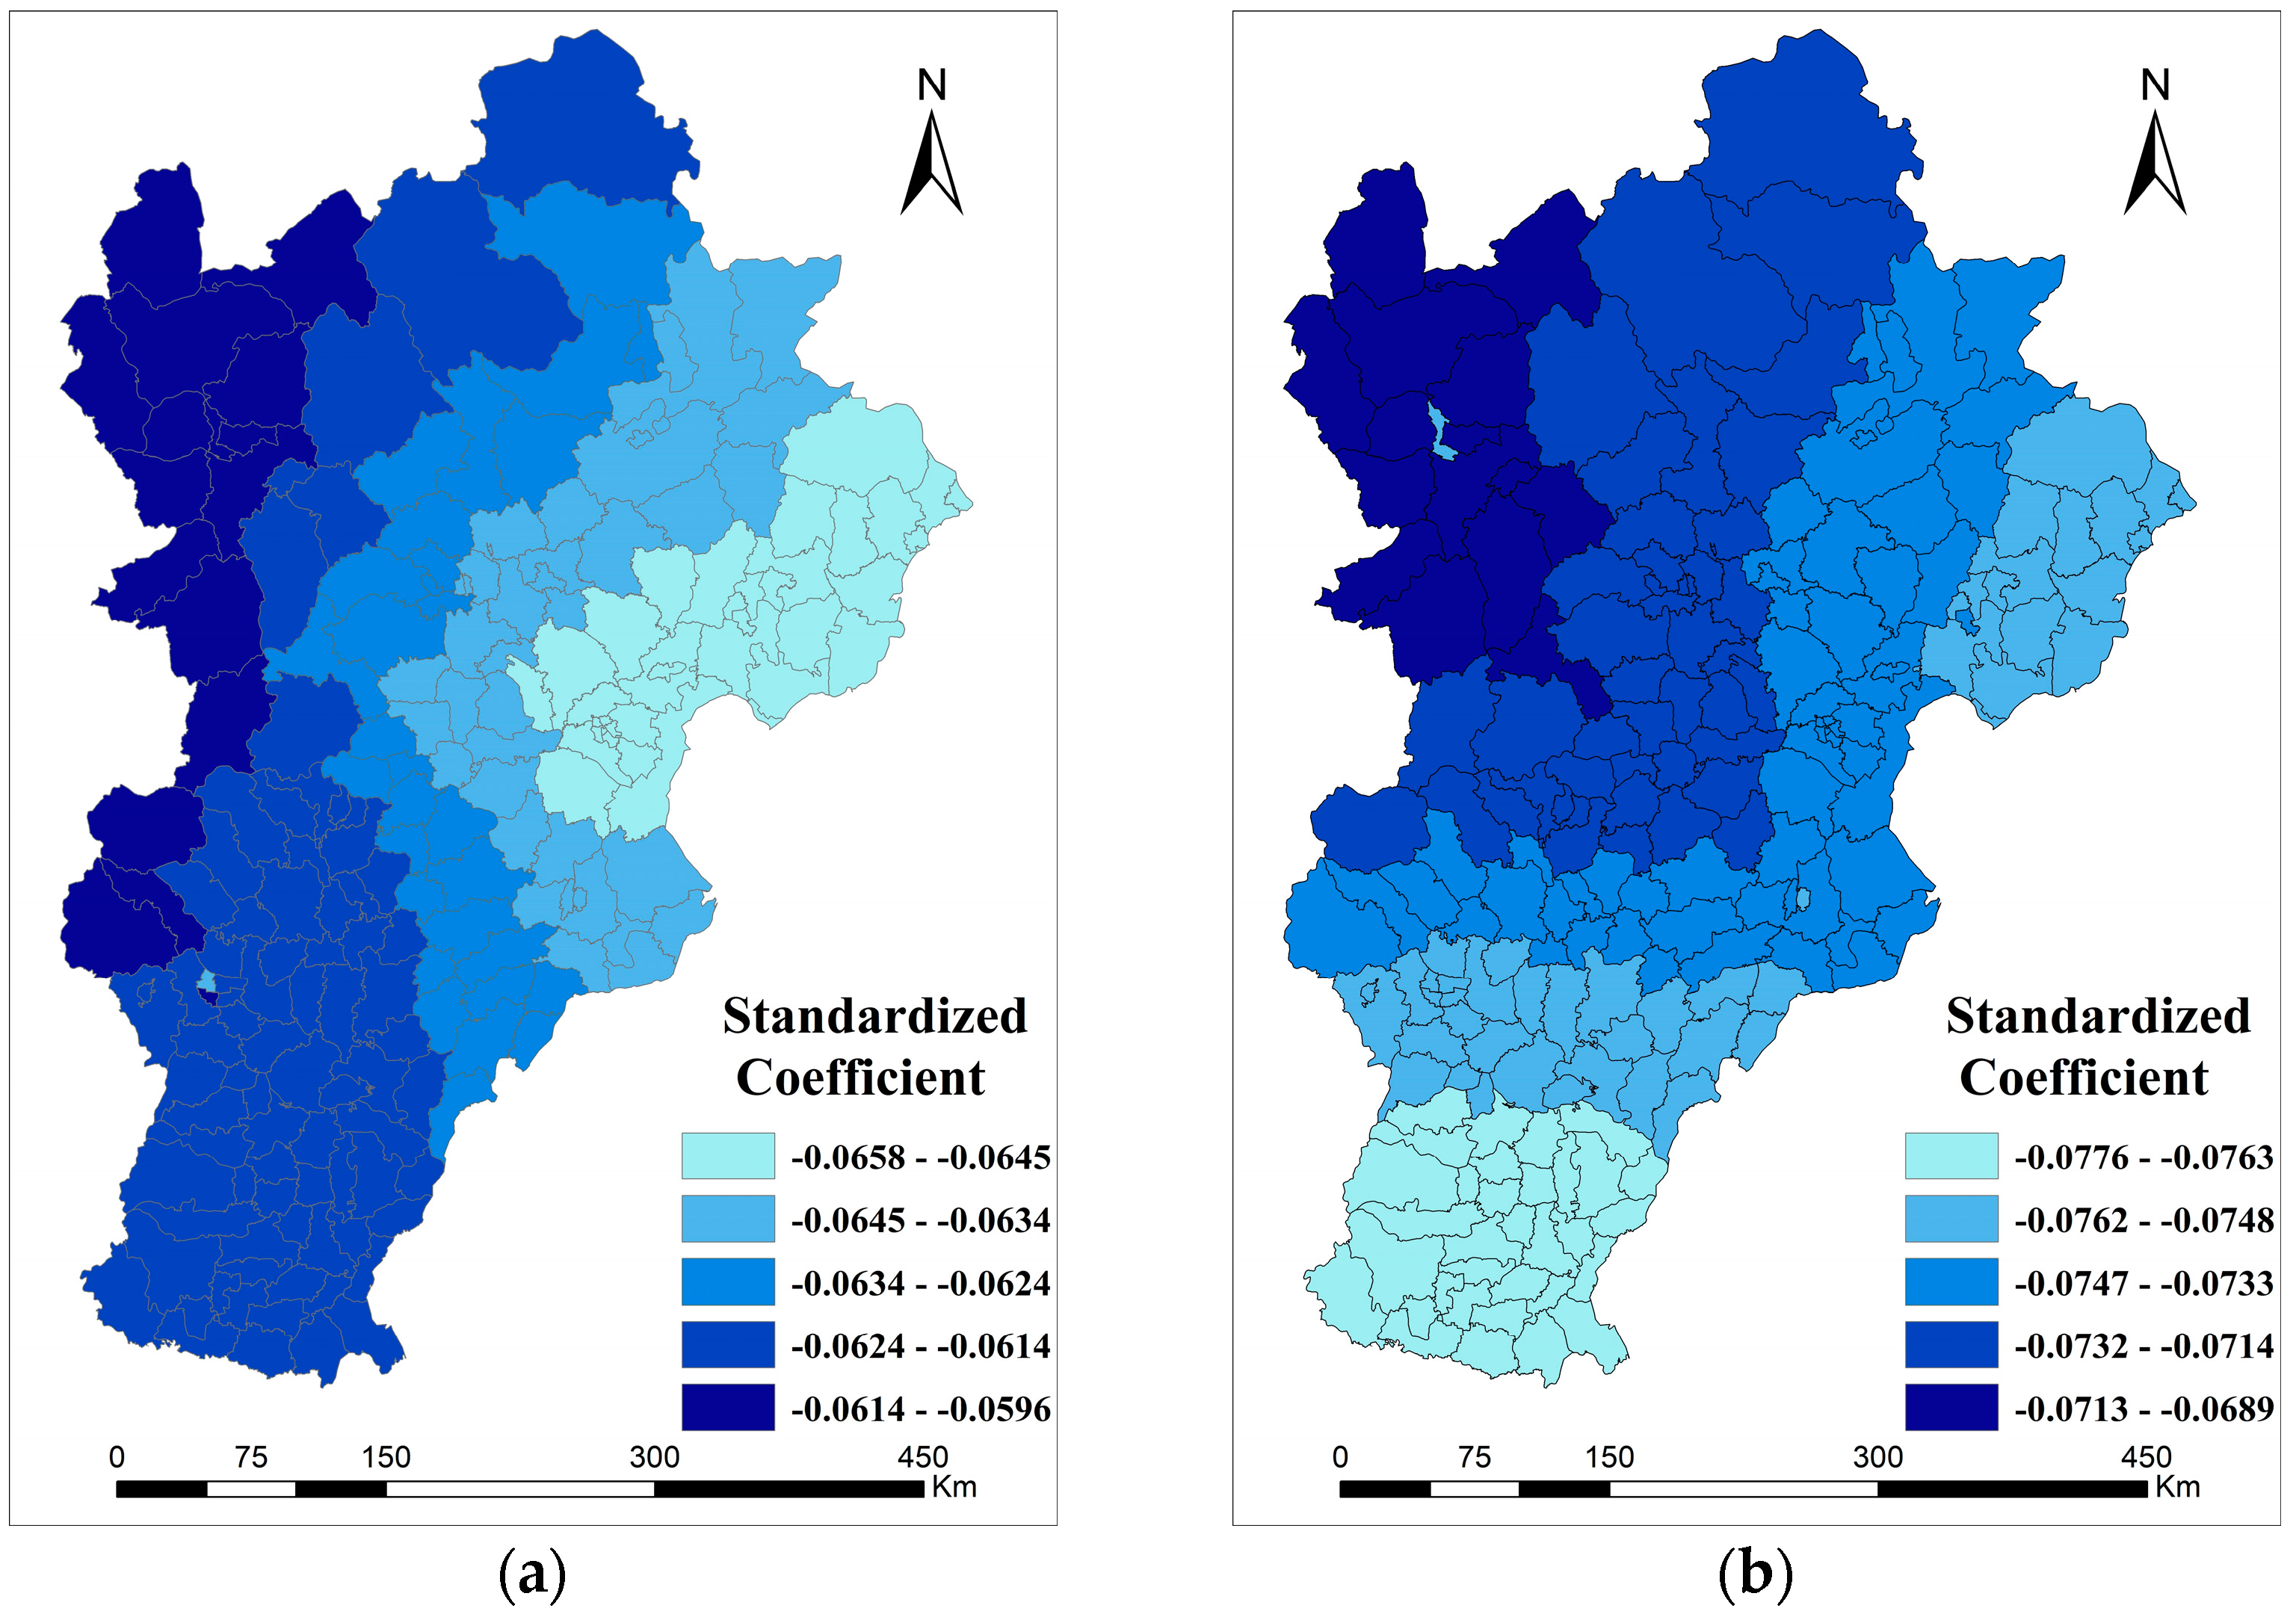
The spatial pattern of carbon storage and land use from 2010–2018 is shown in Figure 3 and Figure S1. Between 2010 and 2018, the urban land area in the Jingjinji region increased from 18,144 km2 (8.5% of the total area) to 27,284 km2 (12.7%). On average, the urban land area expanded by 6.2% annually. Concurrently, water and the woodland regions increased, whereas the rest of the land use types decreased. According to the spatial distribution of land use, most of the new urban lands are situated in the Beijing city center and the Tianjin city center. Similarly, regional carbon storage shows similar spatial and temporal variation characteristics. From 2010 to 2018, carbon storage loss in the Beijing-Tianjin-Hebei region was 58.87 Tg, representing a loss of 0.16%. It is worth noting that since the InVEST model assumes that carbon storage is the same within the same land use type, the maps of carbon storage change in this paper only show areas of carbon storage growth or loss rather than specific values (Figure 3c).
Further, to validate the existence of spatial autocorrelation in carbon storage, Moran’s criterion was applied for both periods (see Table 3). Based on these test results, storage had a probability of occurrence greater than 1% (p-value of 0.001) in all the studied years, showing a significant spatial correlation between carbon storage and global warming. In combination with the maps of residual distribution (Figures S2 and S3), we concluded that clustered patterns may have been caused by random processes, which strongly indicates spatial heterogeneity in the model.

3.2. MGWR Results

Table 4 and Table 5 show the coefficient statistic values with diagnostic information for the MGWR model results in 2010 and 2018, respectively. Both years of the MGWR in this study show an outstanding performance with very high coefficients of determination (0.980–0.983), indicating that the drivers employed and evaluated in this research can explain more than 98% of the spatial variation in regional carbon storage. Additionally, the adjusted coefficients of determination were not significantly lower, which indicates that the MGWR does not contain redundant independent variables. Furthermore, the MGWR can allocate variable bandwidths; thus, the bandwidths are adapted based on the variables (see Table 4 and Table 5 for more information).
Being global variables (bandwidths ranging from 176–196), NT, PM2.5, and RH impact carbon storage in a similar manner. The remaining variables, however, show considerable spatial variation (bandwidths of 43–143), which further supports the need for using the MGWR model. In general, indicators related to urbanization affect regional carbon storage at a more global scale, followed by indicators related to ecological quality; background topography and climatic factors have the most localized scale of influence. As the MGWR model can exert a spatially explicit influence on the relationship between the independent and dependent variables, the coefficient statistics values can only be used as a preliminary guide.
Figure 4 shows the variations in local determination of the coefficient spatial distribution during the analyzed period. In general, higher determination coefficients indicate more effective explanations for correlation within a region. According to its spatial distribution pattern, the relatively lower determination coefficient was typically located in the southern–central region and remained relatively stable from 2010 to 2018. According to the above results, the strength of the explanation of the MGWR in this study decreased slightly (about 10%) in individual regions, suggesting that carbon storage changes in these regions may be affected by other, more specific factors, and therefore merit closer attention.
Figure 5, Figure 6 and Figure 7 illustrate the change in local significance and the coefficients of the variables from 2010 to 2018. We only colored areas with a noteworthy correlation between carbon storage and the variables (p-value < 0.1). Several patterns and characteristics can be identified, including the following:
(a) Except for PD, all four urbanization indicators have a significant impact on regional carbon storage, and the influence direction is negative overall (Figure 5a–h). Initially, BUA appeared to affect regional carbon storage only in the northern and eastern regions in 2010, ultimately extending to the entire study area in 2018 (Figure 5a,e). However, the intensity of the impact decreased by approximately two-thirds overall. The results suggest that changes in urbanization patterns in the Beijing-Tianjin-Hebei region from 2010 to 2018 also influenced changes in regional carbon storage. Nonetheless, the effects were the most substantial along the eastern coast. The impact of UISA (Figure 5b,f) on regional carbon storage was the strongest of all drivers, which indicated that the optimization of land use structure configuration in urban areas is an important aspect that requires attention in future carbon storage conservation efforts. The spatial differences in UISA and NTL (Figure 5c,g) effects on regional carbon storage are relatively small (only 10–15%), and the patterns of these effects did not differ significantly between 2010 and 2018, thereby suggesting that these two factors have a relatively stable impact on regional carbon storage. In terms of the study area and period, PD (Figure 5d,h) had no significant effect on regional carbon storage. Although we cannot assume with confidence that human activities do not impact carbon storage, this result at least suggests that the mode of influence was indirect. In general, urbanization affects regional carbon storage mainly by the expansion of the urban area, the increase of impervious surface percentage, and economic vitality. It shows an apparent spatial heterogeneity, among which the growth of impervious surface percentage has the most significant impact.
(b) The four factors of the ecological environment influenced the regional carbon storage; in order of intensity: NDVI, PM2.5, temperature, and RH (Figure 6a–h). The power and extent of the impact of NDVI (Figure 6c,g) on regional carbon storage increased over time, which indicates that vegetation was increasingly critical in the conservation of carbon storage with the implementation of vegetation protection policies in the Beijing-Tianjin-Hebei region (e.g., the Three Northern Protected Forest Project). The effect of PM2.5 (Figure 6a,e) on regional carbon storage shifted from negative to positive from 2010–2018, and the spatial pattern changed significantly. The Chinese government launched an air pollution prevention and control action plan in 2013, which substantially reduced air pollution levels. Based on these results and facts, air pollution significantly impacts regional carbon storage, and temporal changes in air pollution should be incorporated into the analysis. Regarding temperature (Figure 6b,f) and RH (Figure 6d,h), their influence patterns differed substantially. Temperature is an essential parameter for measuring climate change, and, in this study, it was also one of the main factors influencing the impact on regional carbon storage. The impact of temperature on carbon storage was insignificant in 2010. However, it displays a clear pattern of latitudinal variation in 2018, specifically, a negative effect in the north and a positive effect in the south of the Beijing-Tianjin-Hebei region. It suggests that dramatic land use change during 2010–2018 changes the impact of drivers on carbon storage and that this change is composed of both direct and indirect components due to the complex multivariate MGWR model used in this paper. However, it is worth noting that this variation in drivers over time also represents some uncertainty in the study results (please see Section 4.3). The impact of RH on regional carbon storage was insignificant.
(c) The control variables of the MGWR model, i.e., the background topographic and climatic factors in this study, are usually not included in relevant analyses. However, considering that these factors are also essential aspects of sustainable land use, it is necessary to explain the main factors involved. The results demonstrate that slope (Figure 7b,f) has a powerful influence on regional carbon storage, which suggests that this is an issue that must be considered in the development of carbon storage conservation policies. We also discuss the future land use and carbon storage relationship based on this important finding, especially considering slope (see Section 4.2).

4. Discussion

4.1. Multiscale Extensions of the GWR Model

The geographic scale can be intuitively interpreted by utilizing MGWR’s respective bandwidths. A combination of global, regional, and local spatial contexts can also enhance policymaking regarding carbon storage determinants. To compare the differences between the GWR and MGWR models, we analyzed the same variables utilized in the GWR model (Table 6).
The bandwidth of the GWR can be regarded as an intermediate value of the MGWR bandwidth, which is to say that it ignores the robustness and does not capture the spatial heterogeneity of some variables. Therefore, GWR models generally have a lower R2, higher AIC, and residual sum of squares, as well as specific local parameters that are difficult to interpret. According to the MGWR analysis results, the effect of vegetation on carbon storage became increasingly localized over time, whereas the impact of built-up areas was more global, which illustrates that carbon storage conservation policies should focus on inter-regional factors from both perspectives.
In addition to the spatial scale, one of the essential features of MGWR is that it provides information regarding the effect of spatial context on the dependent variable, and the intercept of the model is considered a spatial effect when all observable, reasonable, and valuable independent variables are controlled as much as possible [29]. In this study, 12 independent variables were selected from three different levels, and the explanatory degree of the model was more than 98%. Hence, the intercept term of our MGWR model has a strong explanatory power. Figure 8 shows that the effect of spatial context on regional carbon storage was significant throughout the study area during 2010–2018, and the spatial pattern of impact intensity changes from high in the west to low in the east, to high in the northwest to low in the south. These findings suggest that the mountainous regions in the northwest have the strongest potential for carbon storage increase.

4.2. Future Sustainable Land Management and Carbon Storage Change

We conducted a further analysis of the impact of land use on carbon storage by simulating the land use status under natural development scenarios in 2030 using a cellular automata–Markov model (referring to Zhao et al. [24]); three different scenarios were derived from this research (Table 7). The results (Figure 9) show that without the implementation of any land management policies, the carbon storage in the Beijing-Tianjin-Hebei region will continue to decline by 112.5 Tg until 2030, whereas the adoption of agricultural expansion policies will decrease this number to 62.2 Tg, and the implementation of forest buffer zones and forest rehabilitation from slope agriculture will ultimately lead to a decrease in carbon storage. The implementation of the forest buffer zone and forest rehabilitation from slope agriculture policies would result in almost no loss of carbon storage. The above findings are compatible with the findings in Section 3, wherein rapid urbanization can result in severe losses of carbon storage. The discussion in this section complements the previous section’s driver analysis by presenting the consequences of different land management policies via simulations.

4.3. Limitations and Future Studies

Although this study incorporates innovations in constructing its analytical framework and valuable new findings, some limitations still exist. First, although the MGWR model substantially improved the explanatory power and rationality of the existing regression models, it still cannot process long-time series data and the nonlinear relationships between variables; the development of new statistical models remains a need for future research. For example, analyzing the impact of temporal driver changes on carbon storage based on a long-time series of panel data. Second, there is still some uncertainty regarding the estimations of carbon storage and drivers. Although the assumption of consistent carbon storage for the same land use type in the InVEST model is widely accepted, we must acknowledge that it is based on high-quality land use data and carbon density tables. Therefore, further land use mapping and carbon density field surveys are needed to obtain accurate carbon density data, and more accurate measurement of drivers also helps improve identification. Third, although the current model has a considerably high degree of explanation, the selection of drivers can be further optimized, such as by adding additional indicators that are currently difficult to quantify or analyze based on the future development of accurate remote sensing products. Finally, this study only analyzed carbon storage in ecosystem services, and a comprehensive assessment of multiple ecosystem services such as food supplies, soils, and water conservation should be conducted in the future.

5. Conclusions

Based on the MGWR model and multi-source remote sensing data from the spatial multiscale and heterogeneity perspectives, this study represents a comprehensive and in-depth analysis of the impact of urbanization and environmental quality on carbon storage in the Beijing-Tianjin-Hebei region in 2010 and 2018. Overall, the urban land use structure, urban land area, vegetation growth, economic vitality, air pollution, and air temperature are the main factors through which urbanization and eco-environmental factors affect the regional carbon storage order. Concurrently, the effects of PD and RH were insignificant. The pattern and scale of influence of the variables also differed significantly with time and space. The MGWR model revealed the impact of spatial context on regional carbon storage; specifically, the northwest mountainous region showed a more substantial potential for carbon storage increase in this study. Finally, based on multi-scenario land-use simulations, the loss of carbon storage by 2018–2030 could be more than twice as high as that of 2010–2018 if the current scenario continues. To achieve future carbon neutrality goals, site-specific carbon storage conservation policies based on the impact of urbanization and ecological quality should be developed.

Supplementary Materials

The following are available online at https://www.mdpi.com/article/10.3390/rs14164007/s1. Figure S1: Spatial distribution of land use in the Beijing-Tianjin-Hebei region from 2010–2018. (a) 2010; (b) 2018; Figure S2: Spatial distribution of the OLSR model’s residual in the Beijing-Tianjin-Hebei region from 2010–2018. (a) 2010; (b) 2018; Figure S3: Spatial distribution of MGWR model’s residual in the Beijing-Tianjin-Hebei region from 2010–2018. (a) 2010; (b) 2018. Figure S4: Simulation results of carbon storage in 2030 (a): Natural Development; (b): Woodland buffer zone; (c): Agricultural expansion; (d): Forest rehabilitation from slope agriculture. Table S1: The abbreviations and their definitions for all the figures and tables involved in the paper.

Author Contributions

Conceptualization, L.N. and Y.H.; methodology, L.N.; software, L.N.; validation, Y.L.; writing—original draft preparation, L.N.; writing—review and editing, L.N.; visualization, L.N.; supervision, Y.H.; project administration, Z.Z. and funding acquisition, Z.Z. All authors have read and agreed to the published version of the manuscript.

Funding

This work is supported by the National Natural Science Foundation of China (Grant Nos. 42077433 and 71874196), and the Outstanding Innovative Talents Cultivation Funded Programs 2021 of Renmin University of China.

Data Availability Statement

The data are freely available upon request.

Conflicts of Interest

The authors declare no conflict of interest.

References

  1. Wei, Y.D.; Li, H.; Yue, W. Urban land expansion and regional inequality in transitional China. Landsc. Urban Plan. 2017, 163, 17–31. [Google Scholar] [CrossRef]
  2. Seto, K.C.; Güneralp, B.; Hutyra, L.R. Global forecasts of urban expansion to 2030 and direct impacts on biodiversity and carbon pools. Proc. Natl. Acad. Sci. USA 2012, 109, 16083–16088. [Google Scholar] [CrossRef] [PubMed]
  3. Fang, C.; Liu, H.; Li, G. International progress and evaluation on interactive coupling effects between urbanization and the eco-environment. J. Geogr. Sci. 2016, 26, 1081–1116. [Google Scholar] [CrossRef]
  4. Buhaug, H.; Urdal, H. An urbanization bomb? Population growth and social disorder in cities. Glob. Environ. Chang. 2013, 23, 1–10. [Google Scholar] [CrossRef]
  5. Zhang, W.; Wang, H.; Cao, K.; He, S.; Shan, L. Ecological conservation–and economic development–based multiobjective land-use optimization: Case study of a rapidly developing city in central China. J. Urban Plan. Dev. 2019, 145, 05018023. [Google Scholar] [CrossRef]
  6. Niu, L.; Tang, R.; Jiang, Y.; Zhou, X. Spatiotemporal patterns and drivers of the surface urban heat island in 36 major cities in China: A comparison of two different methods for delineating rural areas. Sustainability 2020, 12, 478. [Google Scholar] [CrossRef]
  7. Niu, L.; Peng, Z.; Tang, R.; Zhang, Z. Development of a Long-Term Dataset of China Surface Urban Heat Island for Policy Making: Spatio-Temporal Characteristics. In Proceedings of the 2021 IEEE International Geoscience and Remote Sensing Symposium IGARSS, Brussels, Belgium, 11–16 July 2021; pp. 6928–6931. [Google Scholar]
  8. Wuepper, D.; Borrelli, P.; Finger, R. Countries and the global rate of soil erosion. Nat. Sustain. 2020, 3, 51–55. [Google Scholar] [CrossRef]
  9. Dybala, K.E.; Steger, K.; Walsh, R.G.; Smart, D.R.; Gardali, T.; Seavy, N.E. Optimizing carbon storage and biodiversity co-benefits in reforested riparian zones. J. Appl. Ecol. 2019, 56, 343–353. [Google Scholar] [CrossRef]
  10. Molotoks, A.; Stehfest, E.; Doelman, J.; Albanito, F.; Fitton, N.; Dawson, T.P.; Smith, P. Global projections of future cropland expansion to 2050 and direct impacts on biodiversity and carbon storage. Glob. Change Biol. 2018, 24, 5895–5908. [Google Scholar] [CrossRef]
  11. Yang, H.; Huang, J.; Liu, D. Linking climate change and socioeconomic development to urban land use simulation: Analysis of their concurrent effects on carbon storage. Appl. Geogr. 2020, 115, 102135. [Google Scholar] [CrossRef]
  12. Eslamdoust, J.; Sohrabi, H. Carbon storage in biomass, litter, and soil of different native and introduced fast-growing tree plantations in the South Caspian Sea. J. For. Res. 2018, 29, 449–457. [Google Scholar] [CrossRef]
  13. Ren, Y.; Wei, X.; Wei, X.; Pan, J.; Xie, P.; Song, X.; Peng, D.; Zhao, J. Relationship between vegetation carbon storage and urbanization: A case study of Xiamen, China. For. Ecol. Manag. 2011, 261, 1214–1223. [Google Scholar] [CrossRef]
  14. Steger, K.; Fiener, P.; Marvin-DiPasquale, M.; Viers, J.H.; Smart, D.R. Human-induced and natural carbon storage in floodplains of the Central Valley of California. Sci. Total Environ. 2019, 651, 851–858. [Google Scholar] [CrossRef] [PubMed]
  15. Necpálová, M.; Anex, R.P.; Fienen, M.N.; Del Grosso, S.J.; Castellano, M.J.; Sawyer, J.E.; Iqbal, J.; Pantoja, J.L.; Barker, D.W. Understanding the DayCent model: Calibration, sensitivity, and identifiability through inverse modeling. Environ. Model. Softw. 2015, 66, 110–130. [Google Scholar] [CrossRef]
  16. Hobley, E.; Steffens, M.; Bauke, S.L.; Kögel-Knabner, I. Hotspots of soil organic carbon storage revealed by laboratory hyperspectral imaging. Sci. Rep. 2018, 8, 13900. [Google Scholar] [CrossRef]
  17. Ma, T.; Li, X.; Bai, J.; Ding, S.; Zhou, F.; Cui, B. Four decades’ dynamics of coastal blue carbon storage driven by land use/land cover transformation under natural and anthropogenic processes in the Yellow River Delta, China. Sci. Total Environ. 2019, 655, 741–750. [Google Scholar] [CrossRef]
  18. Pei, F.; Li, X.; Liu, X.; Wang, S.; He, Z. Assessing the differences in net primary productivity between pre-and post-urban land development in China. Agric. For. Meteorol. 2013, 171, 174–186. [Google Scholar] [CrossRef]
  19. Metzger, M.; Rounsevell, M.; Acosta-Michlik, L.; Leemans, R.; Schröter, D. The vulnerability of ecosystem services to land use change. Agric. Ecosyst. Environ. 2006, 114, 69–85. [Google Scholar] [CrossRef]
  20. Wang, X.; Wu, J.; Liu, Y.; Hai, X.; Shanguan, Z.; Deng, L. Driving factors of ecosystem services and their spatiotemporal change assessment based on land use types in the Loess Plateau. J. Environ. Manag. 2022, 311, 114835. [Google Scholar] [CrossRef]
  21. Petroni, M.L.; Siqueira-Gay, J.; Gallardo, A.L.C.F. Understanding land use change impacts on ecosystem services within urban protected areas. Landsc. Urban Plan. 2022, 223, 104404. [Google Scholar] [CrossRef]
  22. Kuang, W. National urban land-use/cover change since the beginning of the 21st century and its policy implications in China. Land Use Policy 2020, 97, 104747. [Google Scholar] [CrossRef]
  23. Kuang, W.; Du, G.; Lu, D.; Dou, Y.; Li, X.; Zhang, S.; Chi, W.; Dong, J.; Chen, G.; Yin, Z. Global observation of urban expansion and land-cover dynamics using satellite big-data. Sci. Bull. 2021, 66, 297–300. [Google Scholar] [CrossRef]
  24. Zhao, M.; He, Z.; Du, J.; Chen, L.; Lin, P.; Fang, S. Assessing the effects of ecological engineering on carbon storage by linking the CA-Markov and InVEST models. Ecol. Indic. 2019, 98, 29–38. [Google Scholar] [CrossRef]
  25. Lahiji, R.N.; Dinan, N.M.; Liaghati, H.; Ghaffarzadeh, H.; Vafaeinejad, A. Scenario-based estimation of catchment carbon storage: Linking multi-objective land allocation with InVEST model in a mixed agriculture-forest landscape. Front. Earth Sci. 2020, 14, 637–646. [Google Scholar] [CrossRef]
  26. Li, T.; Li, M.-Y.; Tian, L. Dynamics of carbon storage and its drivers in Guangdong Province from 1979 to 2012. Forests 2021, 12, 1482. [Google Scholar] [CrossRef]
  27. Li, Y.; Bao, W.; Bongers, F.; Chen, B.; Chen, G.; Guo, K.; Jiang, M.; Lai, J.; Lin, D.; Liu, C. Drivers of tree carbon storage in subtropical forests. Sci. Total Environ. 2019, 654, 684–693. [Google Scholar] [CrossRef]
  28. Niu, L.; Zhang, Z.; Peng, Z.; Liang, Y.; Liu, M.; Jiang, Y.; Wei, J.; Tang, R. Identifying Surface Urban Heat Island Drivers and Their Spatial Heterogeneity in China’s 281 Cities: An Empirical Study Based on Multiscale Geographically Weighted Regression. Remote Sens. 2021, 13, 4428. [Google Scholar] [CrossRef]
  29. Stewart Fotheringham, A.; Li, Z.; Wolf, L.J. Scale, Context, and Heterogeneity: A Spatial Analytical Perspective on the 2016 USPresidential Election. Ann. Am. Assoc. Geogr. 2021, 111, 1602–1621. [Google Scholar] [CrossRef]
  30. Fotheringham, A.S.; Yang, W.; Kang, W. Multiscale geographically weighted regression (MGWR). Ann. Am. Assoc. Geogr. 2017, 107, 1247–1265. [Google Scholar] [CrossRef]
  31. Oshan, T.M.; Li, Z.; Kang, W.; Wolf, L.J.; Fotheringham, A.S. mgwr: A Python implementation of multiscale geographically weighted regression for investigating process spatial heterogeneity and scale. ISPRS Int. J. Geo-Inf. 2019, 8, 269. [Google Scholar] [CrossRef]
  32. Shabrina, Z.; Buyuklieva, B.; Ng, M.K.M. Short-term rental platform in the urban tourism context: A geographically weighted regression (GWR) and a multiscale GWR (MGWR) approaches. Geogr. Anal. 2021, 53, 686–707. [Google Scholar] [CrossRef]
  33. Wu, B.; Yan, J.; Lin, H. A cost-effective algorithm for calibrating multiscale geographically weighted regression models. Int. J. Geogr. Inf. Sci. 2022, 36, 898–917. [Google Scholar] [CrossRef]
  34. Rong, Y.; Li, K.; Guo, J.; Zheng, L.; Luo, Y.; Yan, Y.; Wang, C.; Zhao, C.; Shang, X.; Wang, Z. Multi-scale spatio-temporal analysis of soil conservation service based on MGWR model: A case of Beijing-Tianjin-Hebei, China. Ecol. Indic. 2022, 139, 108946. [Google Scholar] [CrossRef]
  35. Ma, J.; Li, X.; Baoquan, J.; Liu, X.; Li, T.; Zhang, W.; Liu, W. Spatial variation analysis of urban forest vegetation carbon storage and sequestration in built-up areas of Beijing based on i-Tree Eco and Kriging. Urban For. Urban Green. 2021, 66, 127413. [Google Scholar] [CrossRef]
  36. Zhang, L.; Wang, L.; Cai, W.-J.; Liu, D.; Yu, Z. Impact of human activities on organic carbon transport in the Yellow River. Biogeosciences 2013, 10, 2513–2524. [Google Scholar] [CrossRef]
  37. Chuai, X.; Huang, X.; Lai, L.; Wang, W.; Peng, J.; Zhao, R. Land use structure optimization based on carbon storage in several regional terrestrial ecosystems across China. Environ. Sci. Policy 2013, 25, 50–61. [Google Scholar] [CrossRef]
  38. Zhang, Y.; Guo, L.; Chen, Y.; Shi, T.; Luo, M.; Ju, Q.; Zhang, H.; Wang, S. Prediction of soil organic carbon based on Landsat 8 monthly NDVI data for the Jianghan Plain in Hubei Province, China. Remote Sens. 2019, 11, 1683. [Google Scholar] [CrossRef]
  39. Grennfelt, P.; Engleryd, A.; Forsius, M.; Hov, Ø.; Rodhe, H.; Cowling, E. Acid rain and air pollution: 50 years of progress in environmental science and policy. Ambio 2020, 49, 849–864. [Google Scholar] [CrossRef]
  40. Aryal, D.R.; Gómez-González, R.R.; Hernández-Nuriasmú, R.; Morales-Ruiz, D.E. Carbon stocks and tree diversity in scattered tree silvopastoral systems in Chiapas, Mexico. Agrofor. Syst. 2019, 93, 213–227. [Google Scholar] [CrossRef]
  41. Zhuo, Z.; Chen, Q.; Zhang, X.; Chen, S.; Gou, Y.; Sun, Z.; Huang, Y.; Shi, Z. Soil organic carbon storage, distribution, and influencing factors at different depths in the dryland farming regions of Northeast and North China. Catena 2022, 210, 105934. [Google Scholar] [CrossRef]
  42. Xu, H.; Wang, X.; Qu, Q.; Zhai, J.; Song, Y.; Qiao, L.; Liu, G.; Xue, S. Cropland abandonment altered grassland ecosystem carbon storage and allocation and soil carbon stability in the Loess Hilly Region, China. Land Degrad. Dev. 2020, 31, 1001–1013. [Google Scholar] [CrossRef]
  43. Chen, S.; Wang, W.; Xu, W.; Wang, Y.; Wan, H.; Chen, D.; Tang, Z.; Tang, X.; Zhou, G.; Xie, Z. Plant diversity enhances productivity and soil carbon storage. Proc. Natl. Acad. Sci. USA 2018, 115, 4027–4032. [Google Scholar] [CrossRef] [PubMed]
  44. Li, P.; Liu, L.; Wang, J.; Wang, Z.; Wang, X.; Bai, Y.; Chen, S. Wind erosion enhanced by land use changes significantly reduces ecosystem carbon storage and carbon sequestration potentials in semiarid grasslands. Land Degrad. Dev. 2018, 29, 3469–3478. [Google Scholar] [CrossRef]
  45. Yang, J.; Huang, X. The 30 m annual land cover dataset and its dynamics in China from 1990 to 2019. Earth Syst. Sci. Data 2021, 13, 3907–3925. [Google Scholar] [CrossRef]
  46. Wei, J.; Li, Z.; Cribb, M.; Huang, W.; Xue, W.; Sun, L.; Guo, J.; Peng, Y.; Li, J.; Lyapustin, A. Improved 1 km resolution PM 2.5 estimates across China using enhanced space–time extremely randomized trees. Atmos. Chem. Phys. 2020, 20, 3273–3289. [Google Scholar] [CrossRef]
  47. Wei, J.; Li, Z.; Lyapustin, A.; Sun, L.; Peng, Y.; Xue, W.; Su, T.; Cribb, M. Reconstructing 1-km-resolution high-quality PM2. 5 data records from 2000 to 2018 in China: Spatiotemporal variations and policy implications. Remote Sens. Environ. 2021, 252, 112136. [Google Scholar] [CrossRef]
  48. Li, X.; Zhou, Y.; Zhao, M.; Zhao, X. A harmonized global nighttime light dataset 1992–2018. Sci. Data 2020, 7, 168. [Google Scholar] [CrossRef]
  49. Kuang, W.; Zhang, S.; Li, X.; Lu, D. A 30 m resolution dataset of China’s urban impervious surface area and green space, 2000–2018. Earth Syst. Sci. Data 2021, 13, 63–82. [Google Scholar] [CrossRef]
  50. Turner, D.P.; Koerper, G.J.; Harmon, M.E.; Lee, J.J. A carbon budget for forests of the conterminous United States. Ecol. Appl. 1995, 5, 421–436. [Google Scholar] [CrossRef]
  51. He, Y.; Xia, C.; Shao, Z.; Zhao, J. The Spatiotemporal Evolution and Prediction of Carbon Storage: A Case Study of Urban Agglomeration in China’s Beijing-Tianjin-Hebei Region. Land 2022, 11, 858. [Google Scholar] [CrossRef]
  52. Fang, J.; Chen, A.; Peng, C.; Zhao, S.; Ci, L. Changes in forest biomass carbon storage in China between 1949 and 1998. Science 2001, 292, 2320–2322. [Google Scholar] [CrossRef] [PubMed]
  53. Ni, J. Carbon storage in terrestrial ecosystems of China: Estimates at different spatial resolutions and their responses to climate change. Clim. Chang. 2001, 49, 339–358. [Google Scholar] [CrossRef]
  54. Shao-qiang, W.; Cheng-hu, Z.; Ke-rang, L.; Song-li, Z.; Fang-hong, H. Estimation of soil organic carbon reservoir in China. J. Geogr. Sci. 2001, 11, 3–13. [Google Scholar] [CrossRef]
  55. Fan, J.; Zhong, H.; Harris, W.; Yu, G.; Wang, S.; Hu, Z.; Yue, Y. Carbon storage in the grasslands of China based on field measurements of above-and below-ground biomass. Clim. Chang. 2008, 86, 375–396. [Google Scholar] [CrossRef]
  56. Zhang, C.; Tian, H.; Chen, G.; Chappelka, A.; Xu, X.; Ren, W.; Hui, D.; Liu, M.; Lu, C.; Pan, S. Impacts of urbanization on carbon balance in terrestrial ecosystems of the Southern United States. Environ. Pollut. 2012, 164, 89–101. [Google Scholar] [CrossRef]
  57. Zhang, F.; Zhan, J.; Zhang, Q.; Yao, L.; Liu, W. Impacts of land use/cover change on terrestrial carbon stocks in Uganda. Phys. Chem. Earth Parts A/B/C 2017, 101, 195–203. [Google Scholar] [CrossRef]
  58. Chu, X.; Zhan, J.; Li, Z.; Zhang, F.; Qi, W. Assessment on forest carbon sequestration in the Three-North Shelterbelt Program region, China. J. Clean. Prod. 2019, 215, 382–389. [Google Scholar] [CrossRef]
Figure 1. Research framework for multiscale spatio-temporal analysis. Please see Table S1 for an explanation of each abbreviation used in this figure.
Remotesensing 14 04007 g001
Figure 2. The Beijing-Tianjin-Hebei region.
Remotesensing 14 04007 g002
Figure 3. Spatial distribution or variation of carbon storage in the Beijing-Tianjin-Hebei region from 2010–2018. (a) Spatial distribution of carbon storage in 2010, (b) Spatial distribution of carbon storage in 2018, and (c) Spatial distribution of carbon storage loss from 2010 to 2018.
Remotesensing 14 04007 g003
Figure 4. Spatial distribution of the coefficients of determination of the MGWR model. (a) 2010, (b) 2018.
Remotesensing 14 04007 g004
Figure 5. Spatial heterogeneity of the impact of urbanization factors on carbon storage. The first and second rows represent the results for 2010 and 2018, respectively. (a,e): BUA; (b,f): UISA; (c,g): NTL; (d,h): PD. Please see Table S1 for an explanation of each abbreviation in this figure.
Remotesensing 14 04007 g005
Figure 6. Spatial heterogeneity of the influence of ecological factors on carbon storage. The first and second rows represent the results for 2010 and 2018, respectively. (a,e): PM2.5; (b,f): Tempreture; (c,g): NDVI; (d,h): RH. Please see Table S1 for an explanation of each abbreviation in this figure.
Remotesensing 14 04007 g006aRemotesensing 14 04007 g006b
Figure 7. Impact of background topography and climate factors on carbon storage. The first and second rows represent the results for 2010 and 2018, respectively. (a,e): DEM; (b,f): Slope; (c,g): Precipitation; (d,h): WS. Please see Table S1 for an explanation of each abbreviation in this figure.
Remotesensing 14 04007 g007aRemotesensing 14 04007 g007b
Figure 8. Spatial heterogeneity of the influence of spatial context on carbon storage (a): 2010, (b): 2018.
Remotesensing 14 04007 g008
Figure 9. Spatial distribution of carbon storage loss in Beijing-Tianjin-Hebei from 2018 to 2030. (a): Natural Development scenario, (b): Woodland buffer zone scenario, (c): Agricultural expansion scenario, (d): Forest rehabilitation from slope agriculture scenario.
Remotesensing 14 04007 g009
Table 1. Descriptive statistics for variables used in this study.
VariableYearNStd. Dev.MeanMaxMinMedianData Source
C (Mg/hm2)201019947.95182.57303.8554.27182.94/
201819949.19178.50302.1754.29179.47
BUA (km2)201019967.1073.55414.363.0654.54China Land Cover Dataset [45]
201819977.91196.02477.635.2278.75
NTL (DN value)201019915.2712.99630.157.52available literature [48]
201819915.6715.9960.510.449.44
UISA20101990.190.0920.8800.02available literature [49]
20181990.190.1000.8800.02
PD (Person/km2)2010199483719963117641630China City Statistical Yearbook
2018199597923353802942668
NDVI (1/103)201019977.93283.53492.1279.21287.92MOD13A2
201819986.57307.27508.9897.81308.08
PM2.5 (μg/m3)201019921.0875.11113.0124.2778.42CHAP [46]
201819913.8054.1981.9720.1357.01
Temp (°C)20101992.0111.6014.304.7312.27Resource and Environment Science and Data Center (www.resdc.cn (accessed on 12 August 2022))
20181991.97112.2914.995.5712.82
RH (%)20101993.0257.9170.1750.1157.80
20181993.5056.9967.4346.6357.46
WS (m/s)20101990.342.223.251.542.17
20181990.3042.283.161.622.25
Pre (mm)201019969.53607.60797.48418.89600.90
201819956.18596.90703.19420.42613.24
DEM (m)/199362.17227.631487.012.0743.88SRTM
Slope (°)/1994.643.61818.760.3490.69
Note: Please see Table S1 for an explanation of each abbreviation in this table.
Table 2. Carbon density of each land use type in the InVEST model (unit: Mg/hm2).
TypesAGCBGCSOCDOC
Cultivated land 1787.792.99.82
Woodland 42.4115.9158.814.11
Grassland 35.386.599.97.28
Water 2.29017.160
Urban 7.614.5142.170
Bare land 9.114.222.630
Note: Please see Table S1 for an explanation of each abbreviation in this table.
Table 3. Spatial autocorrelation statistics results for the carbon storage in each of the two time periods.
20102018
Moran’s Index0.5630.561
Z-score19.5119.47
p-value<0.001<0.001
Table 4. Result of the MGWR model between carbon storage and drivers in 2010.
Int.BUANTLUISAPDNDVIPM2.5TempRHWsPreDEMSlope
Mean−0.063−0.055−0.062−0.5050.0440.143−0.025−0.012−0.0020.062−0.019−0.0630.453
STD0.0010.0310.0020.0520.0010.1150.0050.0090.0010.0560.0190.0010.106
Min−0.066−0.159−0.065−0.5880.043−0.013−0.033−0.027−0.005−0.044−0.093−0.0660.31
Median−0.062−0.045−0.062−0.4680.0430.112−0.025−0.009−0.0020.052−0.015−0.0620.424
Max−0.06−0.02−0.056−0.4590.0450.368−0.017000.174−0.001−0.060.642
Bandwidth1967319512919644176153196631314343
Diagnostics Info:
R20.983
Adj. R20.978
AICC−128.138
Residual Sum of Squares3.379
Note: Please see Table S1 for an explanation of each abbreviation in this table.
Table 5. Results of the MGWR model between carbon storage and drivers in 2018.
Int.BUANTLUISAPDNDVIPM2.5Temp.RHWsPre.DEMSlope
Mean−0.074−0.049−0.125−0.3460.0120.2230.073−0.0190.024−0.0020.034−0.1240.51
STD0.0020.0030.0020.0030.0170.1050.0020.0790.0020.0120.0740.1380.005
Min−0.078−0.055−0.128−0.351−0.004−0.0770.067−0.1540.019−0.019−0.111−0.3610.499
Median−0.074−0.049−0.125−0.3450.0010.2380.073−0.0010.025−0.0010.065−0.1320.513
Max−0.069−0.042−0.122−0.3420.0630.3810.0790.0720.0260.0160.1580.0940.516
Bandwidth196186196192143451791191961924343196
Diagnostics Info:
R20.980
Adj. R20.975
AICC−107.198
RSS3.983
Note: Please see Table S1 for an explanation of each abbreviation in this table.
Table 6. Diagnostic information for the classical GWR model across both periods.
20102018
Bandwidth8188
R20.9860.985
Adj. R20.9810.978
AICC−129.664−109.886
RSS3.7394.025
Table 7. Specific settings of scenario simulations with corresponding carbon storage loss.
ScenarioSettingsCarbon Storage Loss (Tg C)
Natural DevelopmentProjections based on changes from 2010–2018112.5
Woodland buffer zoneConvert 100 m of the area near the water to woodland8.5
Agricultural expansionConversion of woodland, grassland, and unused land with slopes below 6° into cultivated land62.2
Forest rehabilitation from slope agricultureConvert cultivated land and unused land with slopes of 15–25° to forest land, and convert grassland with slopes >25° to forest land2.3
Publisher’s Note: MDPI stays neutral with regard to jurisdictional claims in published maps and institutional affiliations.

