Article

Spatiotemporal Variation in Compound Dry and Hot Events and Its Effects on NDVI in Inner Mongolia, China

1
College of Geographical Science, Inner Mongolia Normal University, Hohhot 010022, China
2
Inner Mongolia Key Laboratory of Disaster and Ecological Security on the Mongolian Plateau, Inner Mongolia Normal University, Hohhot 010022, China
3
Inner Mongolia Key Laboratory of Remote Sensing and Geographic Information Systems, Inner Monglia Normal University, Hohhot 010022, China
4
Pastoral Water Conservancy Research Institute of Water Conservancy and Hydropower Research Institute, Inner Mongolia, Hohhot 010022, China
*
Author to whom correspondence should be addressed.
Remote Sens. 2022, 14(16), 3977; https://doi.org/10.3390/rs14163977
Submission received: 22 July 2022 / Revised: 6 August 2022 / Accepted: 14 August 2022 / Published: 16 August 2022

Abstract

:
In recent decades, frequent compound dry and hot events have posed a great threat to humans and the ecological environment, especially in Inner Mongolia, which has arid and semi-arid characteristics. In this study, monthly temperature and precipitation data from 115 meteorological stations in Inner Mongolia from 1982 to 2020 were used to establish a standardized dry and hot index (SDHI). Theil–Sen median trend analysis, Mann–Kendall test, partial correlation analysis, and stepwise multiple regression models were used to characterize the changes in compound dry and hot events and the normalized difference vegetation index (NDVI) from 1982 to 2020, and the relationship between the SDHI and NDVI was quantitatively evaluated. The results showed that the overall SDHI values in Inner Mongolia showed a significant decrease at a rate of 0.03/year from 1982 to 2020, indicating an increase in the severity of compound dry and hot events. NDVI values showed a significant increasing trend and NDVI showed mutated 2001. Among the grassland vegetation types, SDHI and NDVI trends were more significant in forests, and meadow steppe, desert steppe, and desert were more susceptible to compound dry and hot events, and forests had the greatest severity of compound dry and hot events. The results of the partial correlation analysis showed that the average value of the partial correlation coefficient between the SDHI and NDVI was 0.68, and the area of positive correlation was 84.13%. Spatially, it showed strong response characteristics in the middle and gradual weakening towards the east and west sides. The correlation between NDVI and climatic conditions varied greatly in different vegetation areas. The forest area is most sensitive to the influence of temperature, and the desert steppe area is most affected by compound dry and hot events. The overall vegetation growth in Inner Mongolia was most affected by temperature conditions, followed by compound dry and hot conditions, and the influence of drought conditions was the least significant. The results of the relative importance analysis confirmed this. The research results provide a more detailed understanding of compound dry and hot events in arid and semi-arid regions and useful insights and support for ecological protection.

Graphical Abstract

1. Introduction

In the context of global warming, the average global surface temperature is approximately 1 °C higher than that during industrialization, resulting in frequent extreme climate events. Among them, heat waves and drought events have had serious impacts on society and human life [1,2,3,4]. Studies have shown that the frequency and severity of global terrestrial droughts and high temperatures are increasing, and the resulting climate fluctuations are bringing a variety of compound impacts to different regions [5,6,7]. As the impact of compound dry and hot events is far greater than that of single extreme events, a comprehensive analysis of the characteristics of compound dry and hot events can provide more effective information for mitigating global warming and maintaining ecological stability.
Vegetation plays an important role in the energy exchange of different layers of the earth and is an important part of the ecological environment of the earth system and an important member of the biological carbon cycle [8,9,10]. Vegetation change is the result of the combined action of the interior and exterior of the Earth. The vegetation index covers a wealth of surface vegetation information, which is of great significance for the study of hydrology, ecology, and regional changes [11,12]. NDVI is the most often used and is an operational, global-based vegetation index, partly due to its “ratio” properties, which enable the NDVI to cancel out a large proportion of the noise caused by changing sun angles, topography, clouds or shadow, and atmospheric conditions [13,14]. The NDVI has been widely used to study vegetation growth in recent years [15,16,17]. The extraction of vegetation information using NDVI is commonly used to indicate the quantitative characteristics of vegetation and for monitoring seasonal changes in vegetation and land cover studies [18,19].
Drought and heat waves often lead to reduced carbon uptake and productivity in ecosystems, affecting the growth and development of vegetation [20,21]. However, the factors that have the greatest impact on vegetation often do not originate from a single extreme weather event but are more likely to be compounded by feedback associations between single extreme weather events; therefore, focusing only on traditional single extreme weather events may underestimate such impacts. In particular, the frequency of simultaneous droughts and heat waves has increased significantly in recent years, and the effects of the resulting compound dry and hot events on vegetation growth can be exacerbated by soil moisture-atmosphere coupling. These events often directly impact the carbon cycle by reducing water availability, reducing vegetation productivity, and regulating soil respiration and indirectly impact it through time-lagged responses that simultaneously trigger forest fires and tree mortality [22,23]. Complex and large-scale changes in the carbon, water, and energy cycles result from these non-linear and combined impacts and small changes in terrestrial ecosystems due to climate extremes. Therefore, it is essential to understand the mechanisms by which vegetation responds to extreme climatic events, especially compound extreme events [24,25].
In recent years, global climate and ecological issues have attracted widespread attention from the community and research scholars, and a series of studies have been conducted using bivariate distributions of drought (precipitation) and high temperature (temperature) to model the occurrence of compound dry and hot events. Zscheischler and Seneviratne et al. quantified the occurrence of compound dry and hot events on a global scale by establishing a joint distribution function based on copula’s principle and found that when summer rainfall and temperature are negatively correlated, a compound event occurs [26]. Wu et al. explored the historical variability characteristics of compound extreme events, including dry/warm, dry/cold wet/warm, and wet/cold combinations, based on monthly precipitation and temperature observations for summer and winter in China from 1961 to 2014 [27]. In terms of indices, Hao et al. developed standardized composite event indicators standardized compound event indicator (SCEI) and standardized dry and hot index (SDHI) to characterize the severity and spatial distribution of compound dry and hot events in Southern Africa and globally, based on the meta–Gaussian model and the concept of standardized precipitation index (SPI), respectively [28,29,30]. Although there have been studies on the characteristics and spatial distribution of compound dry and hot events through the construction of indicators, there is still a lack of unified systems and indicators for the characterization of compound dry and hot events.
Identifying characteristics that contribute to the persistence and resilience of vegetation systems in the face of climate change is a research priority of global relevance [31]. In general, increased precipitation promotes vegetation growth in water-limited ecosystems; in turn, surface greening produces biophysical feedbacks on climate that increase evapotranspiration, which in turn accelerates surface temperature cooling and increased precipitation [32,33]. Vegetation growth trends are spatially heterogeneous and closely related to climatic factors. Climate warming has been widespread globally in recent decades, and in cold and high-latitude ecosystems, rapid warming has led to a 16.4% reduction in the land area of temperature-limited vegetation [34], the spatial extent of vegetation productivity in water-scarce grasslands is consistent with the distribution of annual precipitation [35]. This suggests that the trends of dominant climate factors will have important effects on the spatial and temporal patterns of vegetation growth, but most of the existing studies have focused on the effects of single climate events on vegetation at large scale regions, and in arid and semi-arid regions with unique climatic characteristics, the interaction between compound climate change and changes in vegetation activities and how to regulate the relationship between climate factors and vegetation growth trends are not clear.
The objectives of this study were (1) to construct a compound dry and hot index in Inner Mongolia from meteorological station data. (2) Based on the NDVI and the compound dry and hot index constructed in Objective 1, the spatial and temporal variation characteristics of compound dry and hot events and vegetation dynamics in Inner Mongolia were analyzed by utilizing the Theil–Sen slope and Mann–Kendall test. (3) The driving effects of three climatic conditions (drought, high temperature, and compound dry and hot condition) on the overall and different grassland types of vegetation in Inner Mongolia and the dominant climatic condition factors affecting NDVI changes in different grassland types were quantitatively revealed with the help of partial correlation analysis and in a multiple stepwise regression framework.

2. Materials and Methods

2.1. Study Area

The Inner Mongolia Autonomous Region is in the northern borderlands of China between 7°12′–126°04′E and 37°24′–53°23′N. The climate is mainly temperate continental monsoon with obvious regional differences, with an average annual temperature of 1–15 °C and average annual precipitation of 500 mm. Precipitation decreases from northeast to southwest and shows an obvious gradient distribution pattern, while the average annual temperature increases from northeast to southwest. Affected by the southeast wind in summer, it is easy to form a high-temperature and rainy climate. However, in winter, the climate in the region becomes dry and cold again owing to the influence of Siberia–Mongolia high pressure [36,37]. The main landforms in Inner Mongolia include mountains, hills, and plateaus, with an average altitude of 1000 m. The terrain undulates significantly from south to north and slopes downward from west to east (Figure 1).

2.2. Data Sources

The data used in this research include meteorological data and NDVI datasets (Table 1).
Monthly temperature and precipitation data from 115 meteorological stations in Inner Mongolia from 1982 to 2020 were used in this study and obtained from the Meteorological Information Center of the Inner Mongolia Meteorological Bureau. For each station, we calculated three indicators (SPI, standardized temperature index (STI), and SDHI) that characterize drought, high temperature, and compound hot and dry events. This was performed on a station-by-station basis for the average precipitation and temperature during the 12 months of the year.
The NDVI data were derived from the AVHRR long-term NDVI daily product dataset developed by the National Aeronautics and Space Administration (http://ltdr.nascom.nasa.gov (accessed on 10 January 2022)) with a time range of 1982–2020 and spatial resolution of 5 km. AVHRR aboard the National Oceanic and Atmospheric Administration (NOAA) polar-orbiting environmental satellite for NDVI calculations [38]. Daily NDVI estimates were derived using daily surface reflectance data from the AVHRR instrument on the NOAA platform, which has two spectral channels (infrared and near-infrared) that are used to calculate daily NDVI values. The datasets used in this study were compiled using the NOAA–16, 18, and 19 sensors. LTDR NDVI products have been used to map vegetation areas and assess drought [39]. NDVI ranges from −1 to 1, where positive values represent areas of vegetation cover and negative values represent water, snow, clouds, and non-vegetated surfaces. These data products are processed and distributed by the MEaSUREs Long-Term Data Record project by the Level–1 and Atmosphere Archive & Distribution System (LAADS) Distributed Active Archive Center (DAAC) at the Goddard Space Flight Center.

2.3. Methods

2.3.1. Construction of Indices of Dry and Hot Extreme Events

When describing a compound event, it makes sense to indicate the severity of the event by normalizing the variables [40,41]. In this study, rainfall (P) was used as a measure of the severity of drought events in the assessment of compound dry and hot events, whereas higher temperature values (T) were used to indicate more severe hot events. The method for assessing the severity (X) of a compound dry and hot event was X = P/T.
To study the state of drought and high-temperature events when they occur simultaneously, we first calculated the marginal probability distribution functions G1(P) and G2(T) for precipitation and temperature. Gringorten′s empirical method was used to calculate the marginal probability distribution [42]:
P = i 0 . 44 n + 0.12
where i is the rank, and n is the length of observations.
Next, we defined X = G1(P)/G2(T), where lower X values indicate more severe compound dry and hot events and then normalized X based on the SPI. First, we fitted the marginal cumulative distribution F and then performed normalization according to the standard normal distribution Φ. This index is referred to as the standardized dry and hot index (SDHI), which can be expressed as:
SDHI = Φ 1 [ F ( X ) ]
This standardization procedure has been applied to a variety of variables to derive extreme indices, including STI.
To calculate the SDHI, three marginal distribution functions need to be fitted (i.e., G1(P), G2(T), and F). A lower SDHI value indicates more severe dry and hot compound events. As the SDHI is also calculated using a standardized approach similar to the SPI, the same grading approach as the SPI is used for grading dry and hot events. Consequently, threshold values of −0.5, −0.8, −1.3, −1.6, and −2.0 were chosen to define abnormal dry and hot events, moderate dry and hot events, severe dry and hot events, extreme dry and hot events, extreme dry and hot events, and exceptional dry and hot events, respectively [30]. In this manuscript, we will also study part of the compound dry and hot events (SDHI > −0.5), which are called no dry and hot events.

2.3.2. Spatiotemporal Variation Analysis

In this study, the SDHI and NDVI values of each pixel in the study area from 1982 to 2020 were analyzed using the Theil–Sen Median trend, and the spatial distribution of the trend value β was obtained. If β > 0, the annual average SDHI and NDVI values of the pixel increase with time; if β < 0, the annual average SDHI and NDVI values of the pixel show a decreasing trend. Since there is no region where β is strictly equal to 0, according to the actual situation of β, this study defined the interval of β between −0.001 and 0.001 as stable and constant. The results of the Mann–Kendall test for significance at the 0.05 confidence level were classified as significant changes (Zc ≥ 1.96 or Zc ≤ −1.96) and no significant changes (−1.96 < Zc < 1.96).

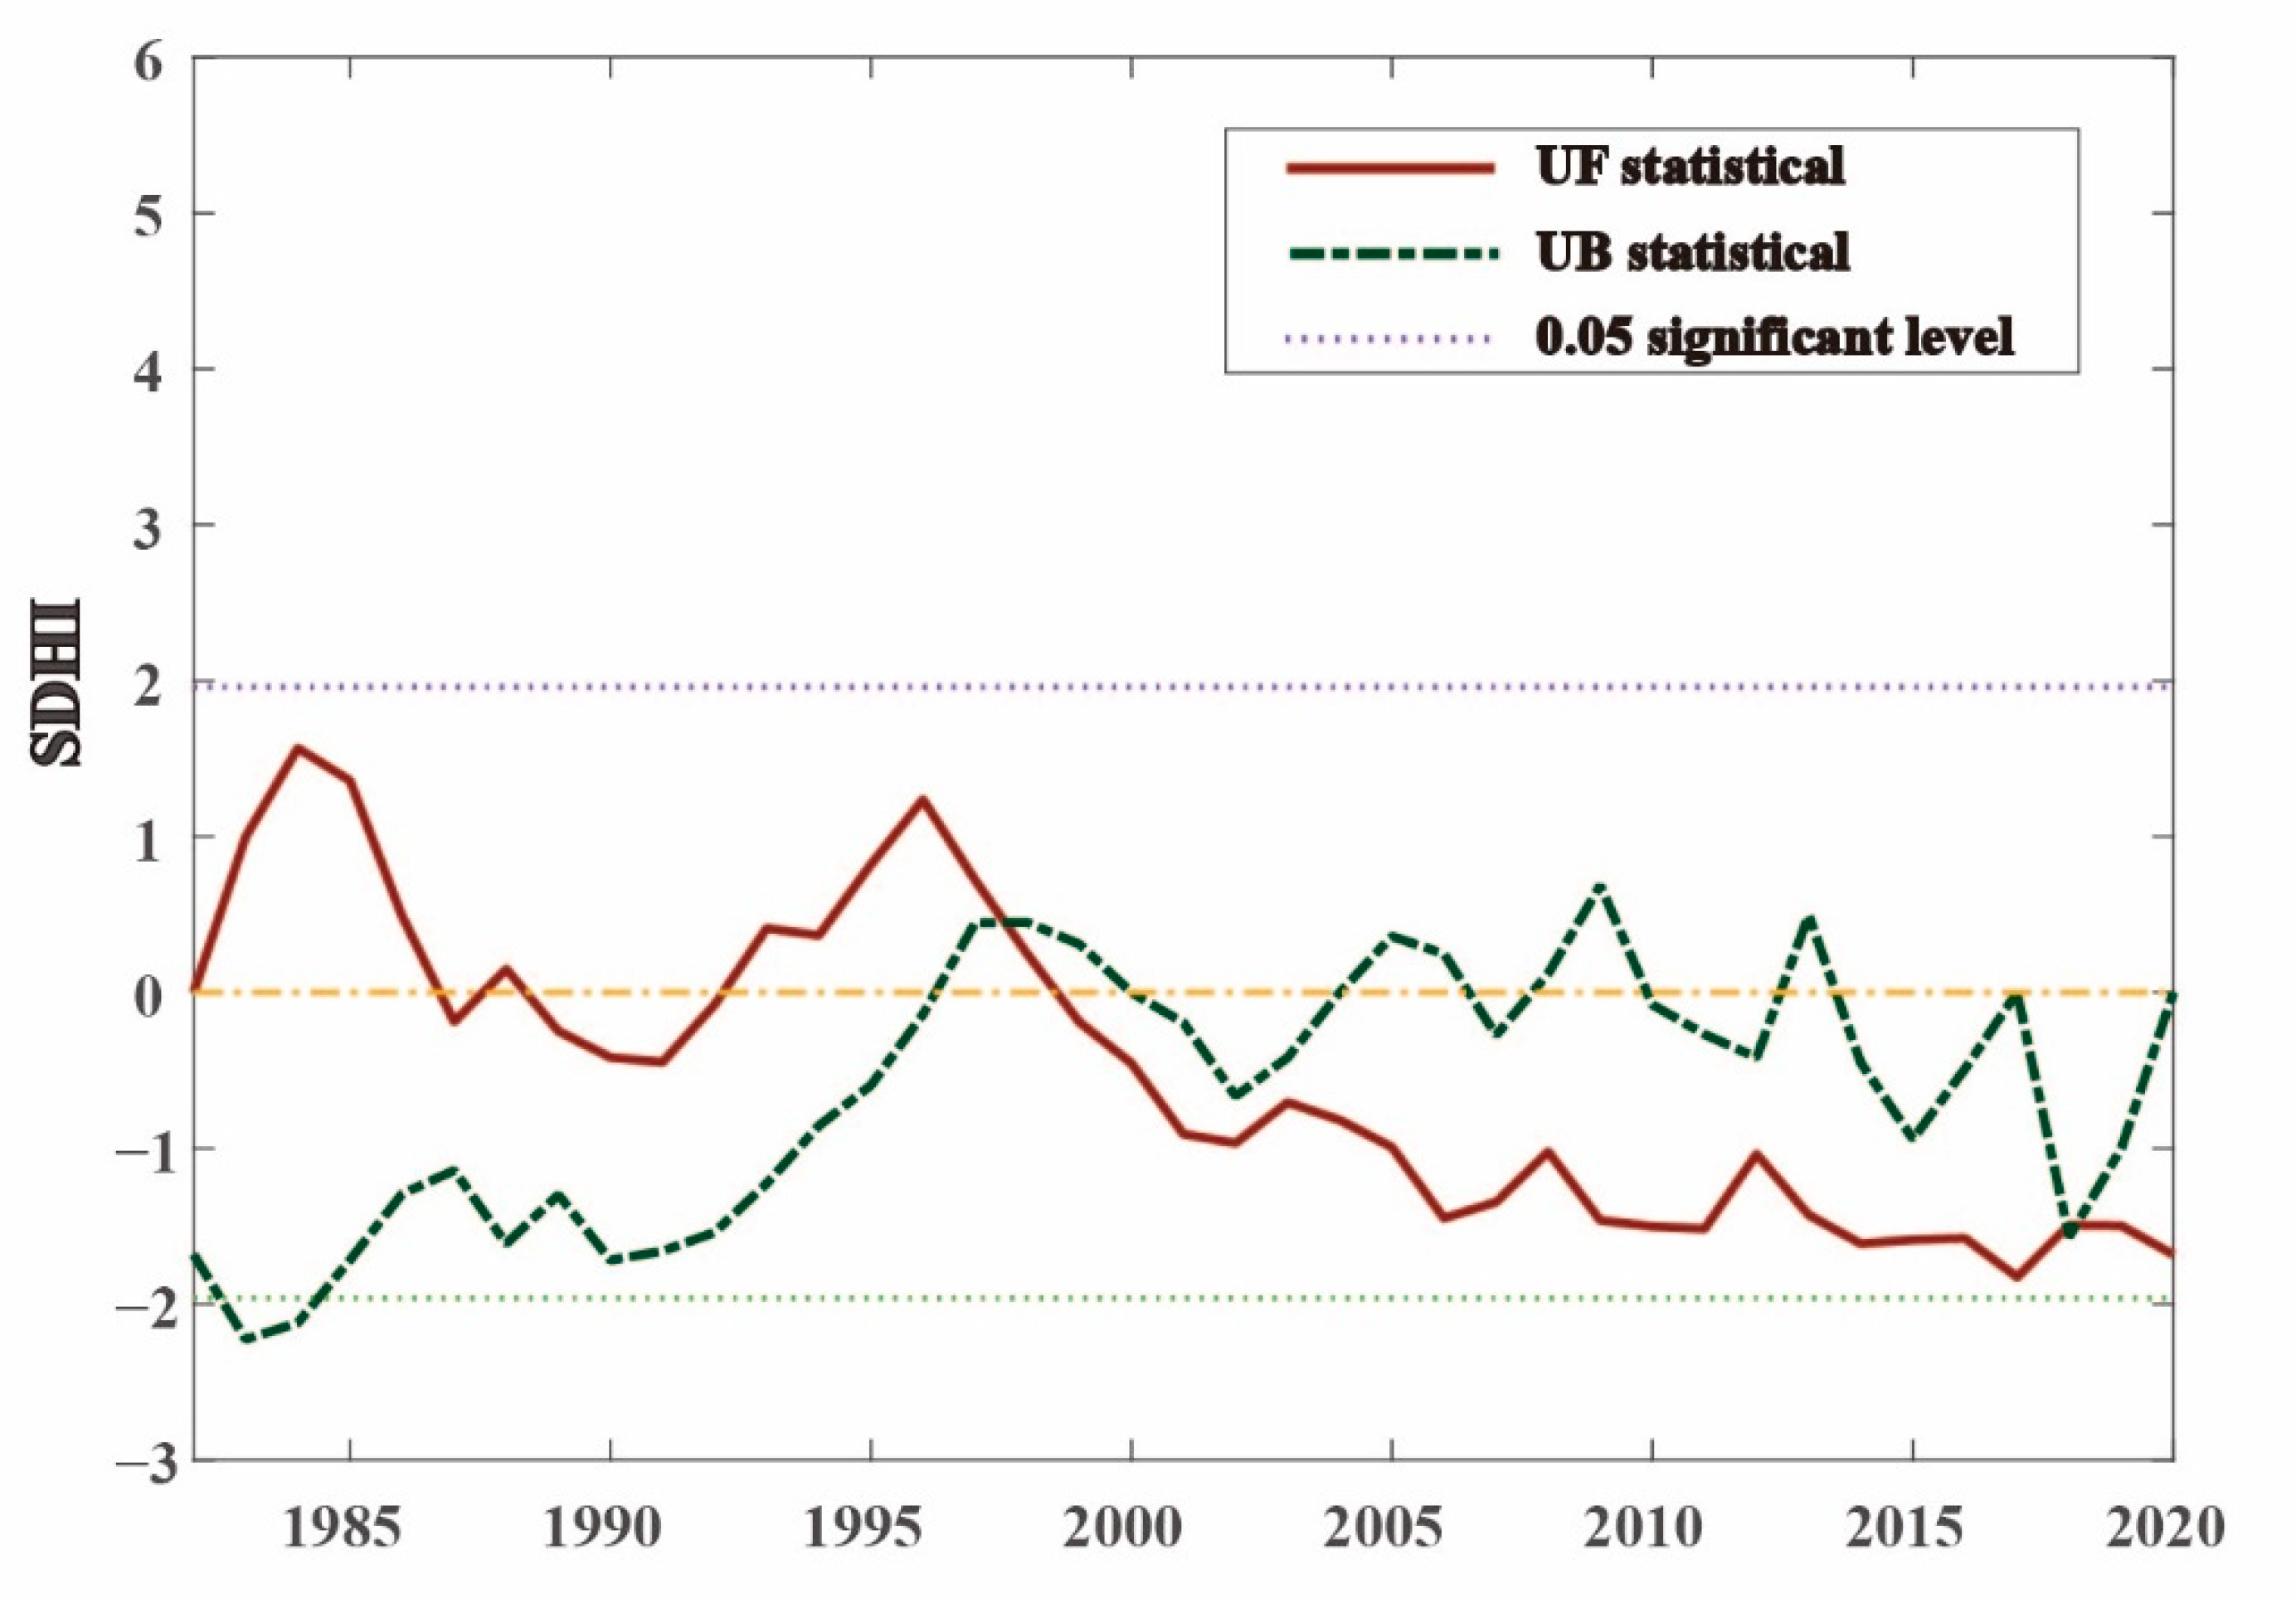
2.3.3. Mutation Analysis

In this study, Mann–Kendall test can also be used to detect the abrupt changes of SDHI and NDVI. The Mann–Kendall test is a nonparametric statistical test method [43].
The UF curve is a time-positive sequence statistic curve, with a value of less than 0 indicating that the sequence is decreasing and a value greater than 0 indicating that the sequence is increasing. When the significance level of 0.05 is exceeded (the critical line is ±1.96, which is referred to as the confidence line), a significant trend of change is indicated; the UB curve is a time-inverse statistical curve, and the intersection of the UF and UB curves within the confidence line is the possible mutation point.

2.3.4. Partial Correlation Analysis

When NDVI was influenced by several factors simultaneously, we used partial correlation analysis to eliminate the influence of other factors and analyze the correlation between only one of the factors and NDVI. The formula for partial correlation analysis is as follows:
r x y . z 1 z 2 z g = r x y . z 1 z 2 z g 1 r x z g . z 1 z 2 z g 1 r y z g . z 1 z 2 z g 1 ( 1 r x z g . z 1 z 2 z g 1 2 ) ( 1 r y z g . z 1 z 2 z g 1 2 )
where r x y . z 1 z 2 z g is the partial correlation coefficient of the x and y variables when they are controlled for z 1 z 2 z g .
In this study, we eliminated the effects of SPI and STI on NDVI, which express the severity of drought and high temperatures in Inner Mongolia, respectively, and only the correlation between NDVI and SDHI for the severity of compound dry and hot events in Inner Mongolia was quantified.
Based on the partial correlation coefficient between NDVI and SDHI, we used the t-test method to perform a significance test at a 0.05 level to determine whether the combined results were statistically significant.

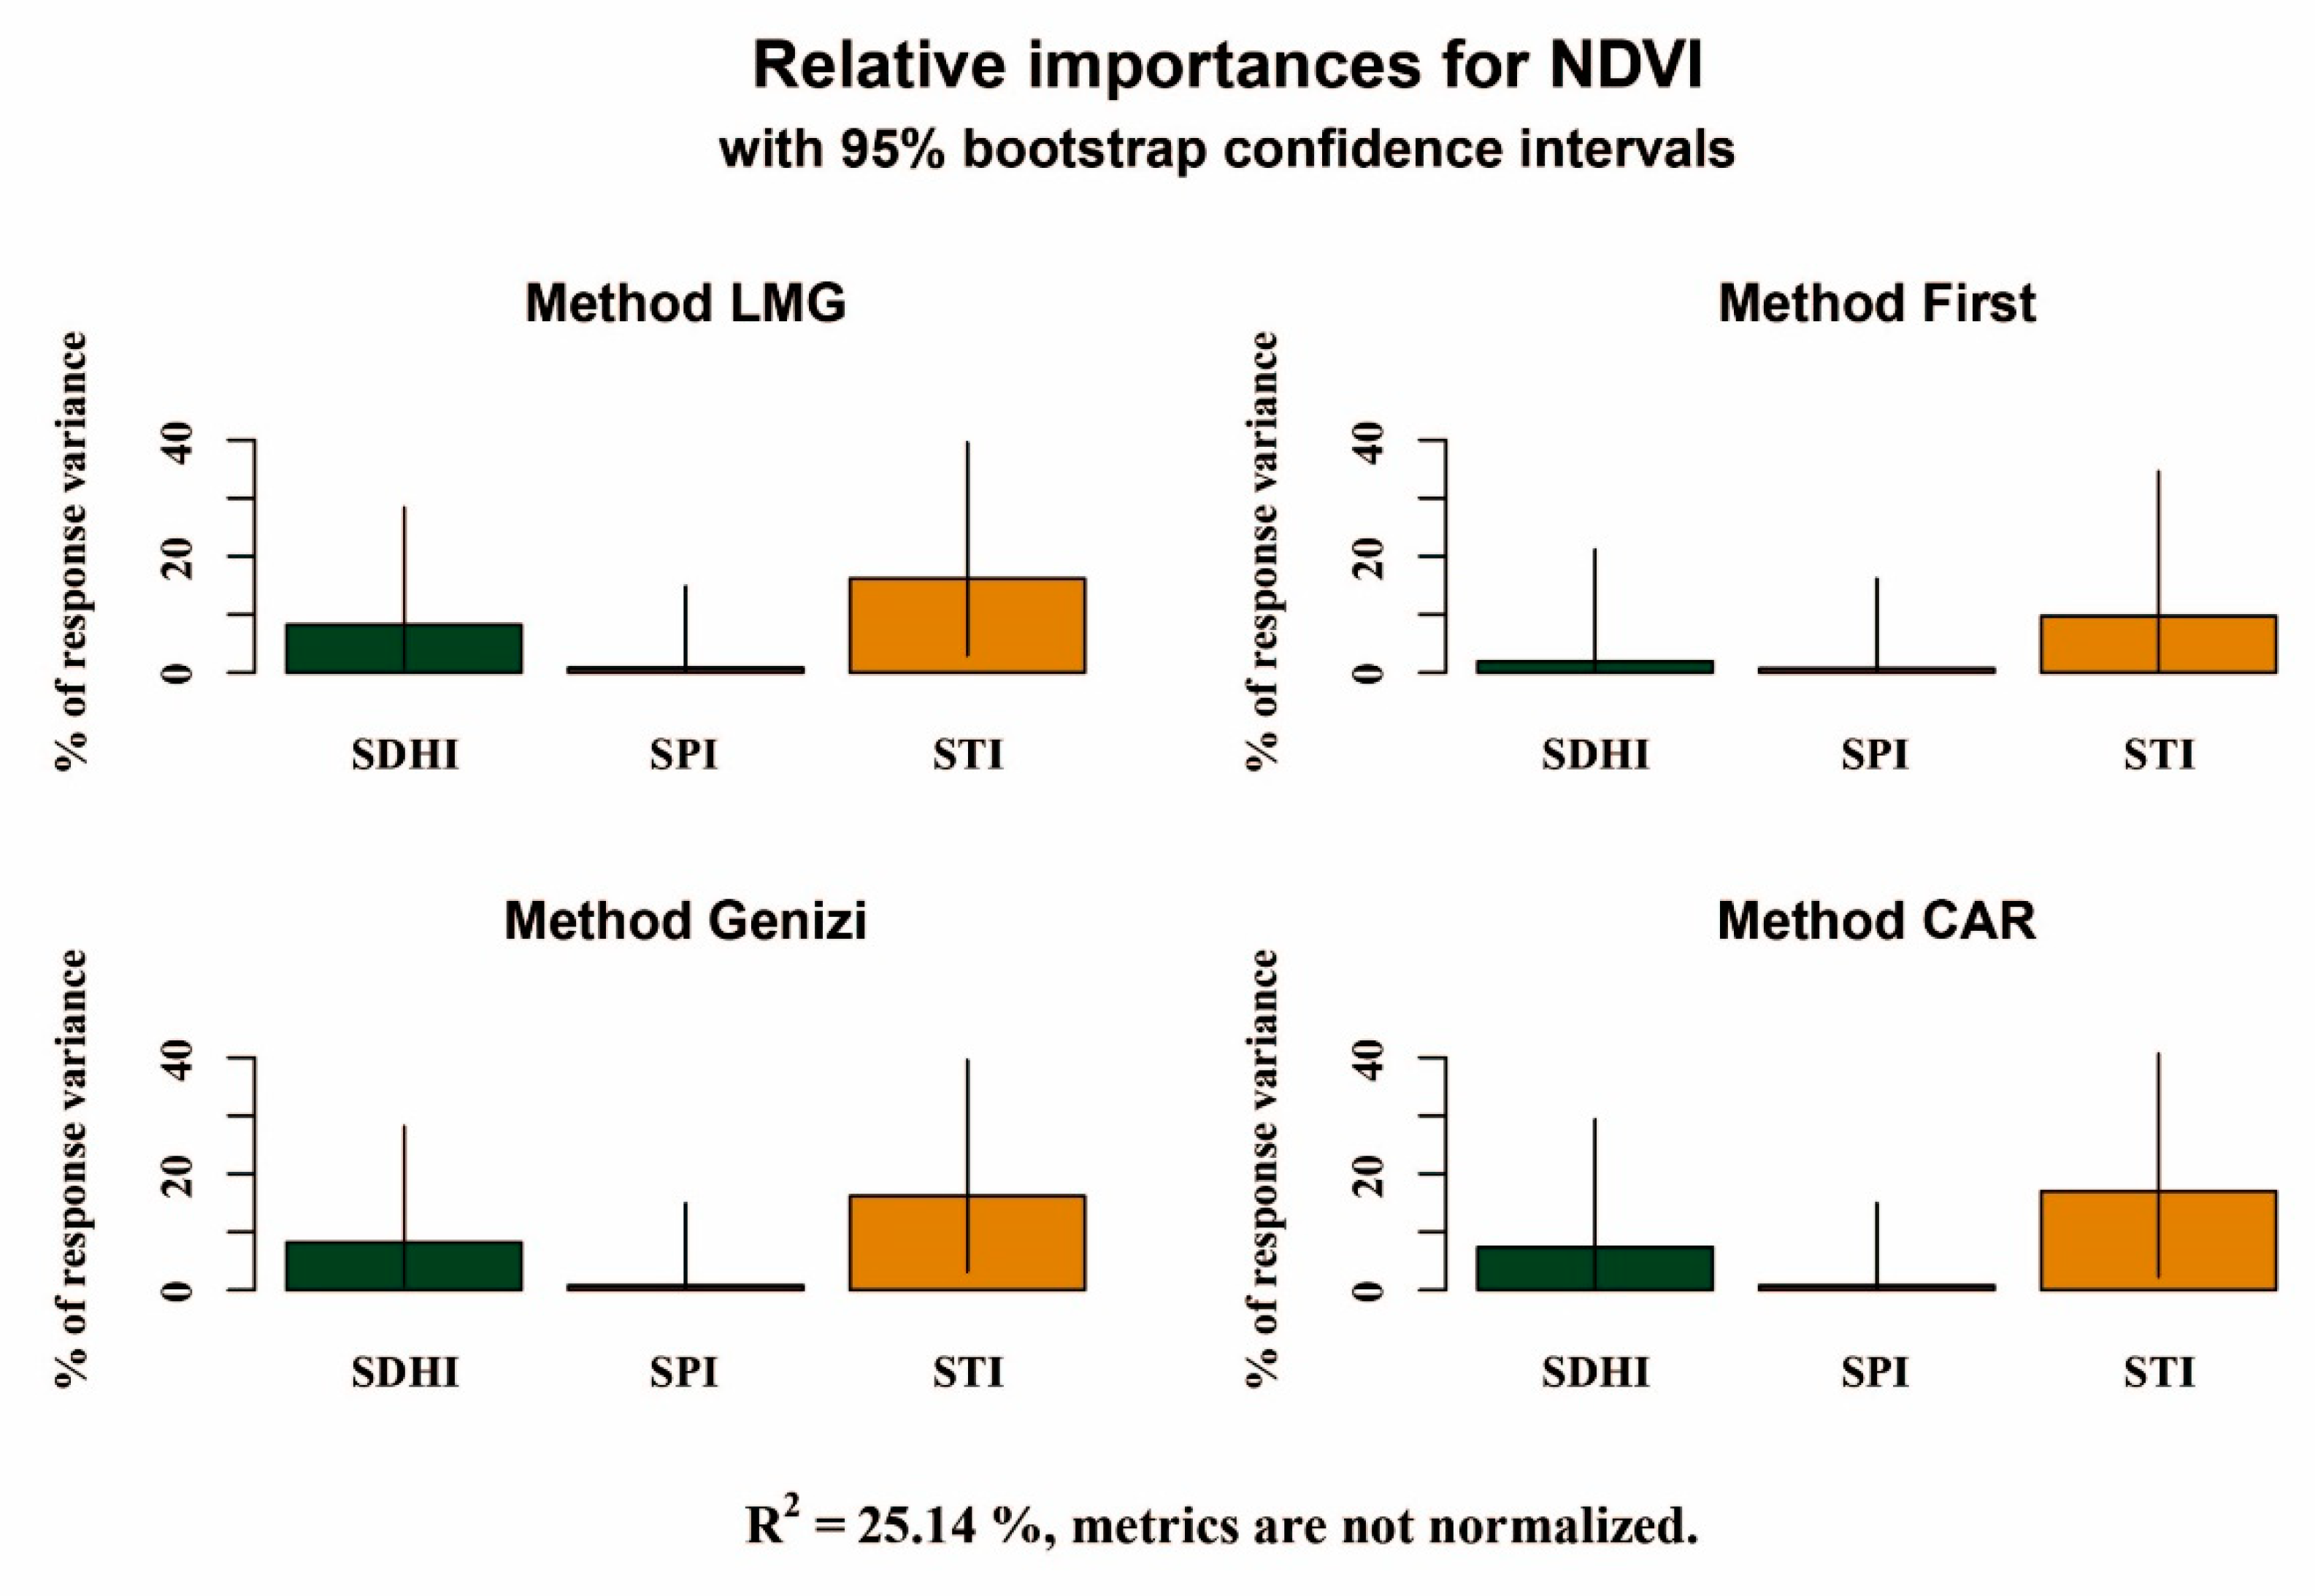
2.3.5. Relative Importance Analysis

A stepwise multiple regression model was used to assess the relative importance of the three climatic conditions to the interannual variation of NDVI in Inner Mongolia using the following formula:
NDVI ~ SDHI + SPI + STI
In the formula, NDVI represents the annual NDVI value in Inner Mongolia from 1982 to 2020, and SDHI, SPI, and STI represent the annual compound dry and hot conditions, intensity of drought conditions, and high-temperature conditions, respectively.
To reduce the uncertainty of other factors or interactions between factors, we chose four models in a multiple regression framework to study the relative importance of climatic conditions for NDVI changes: LMG, First, Genizi, and CAR. This method can be implemented using the R package “relaimpo” [44].

3. Results

3.1. Characterization of SDHI Change

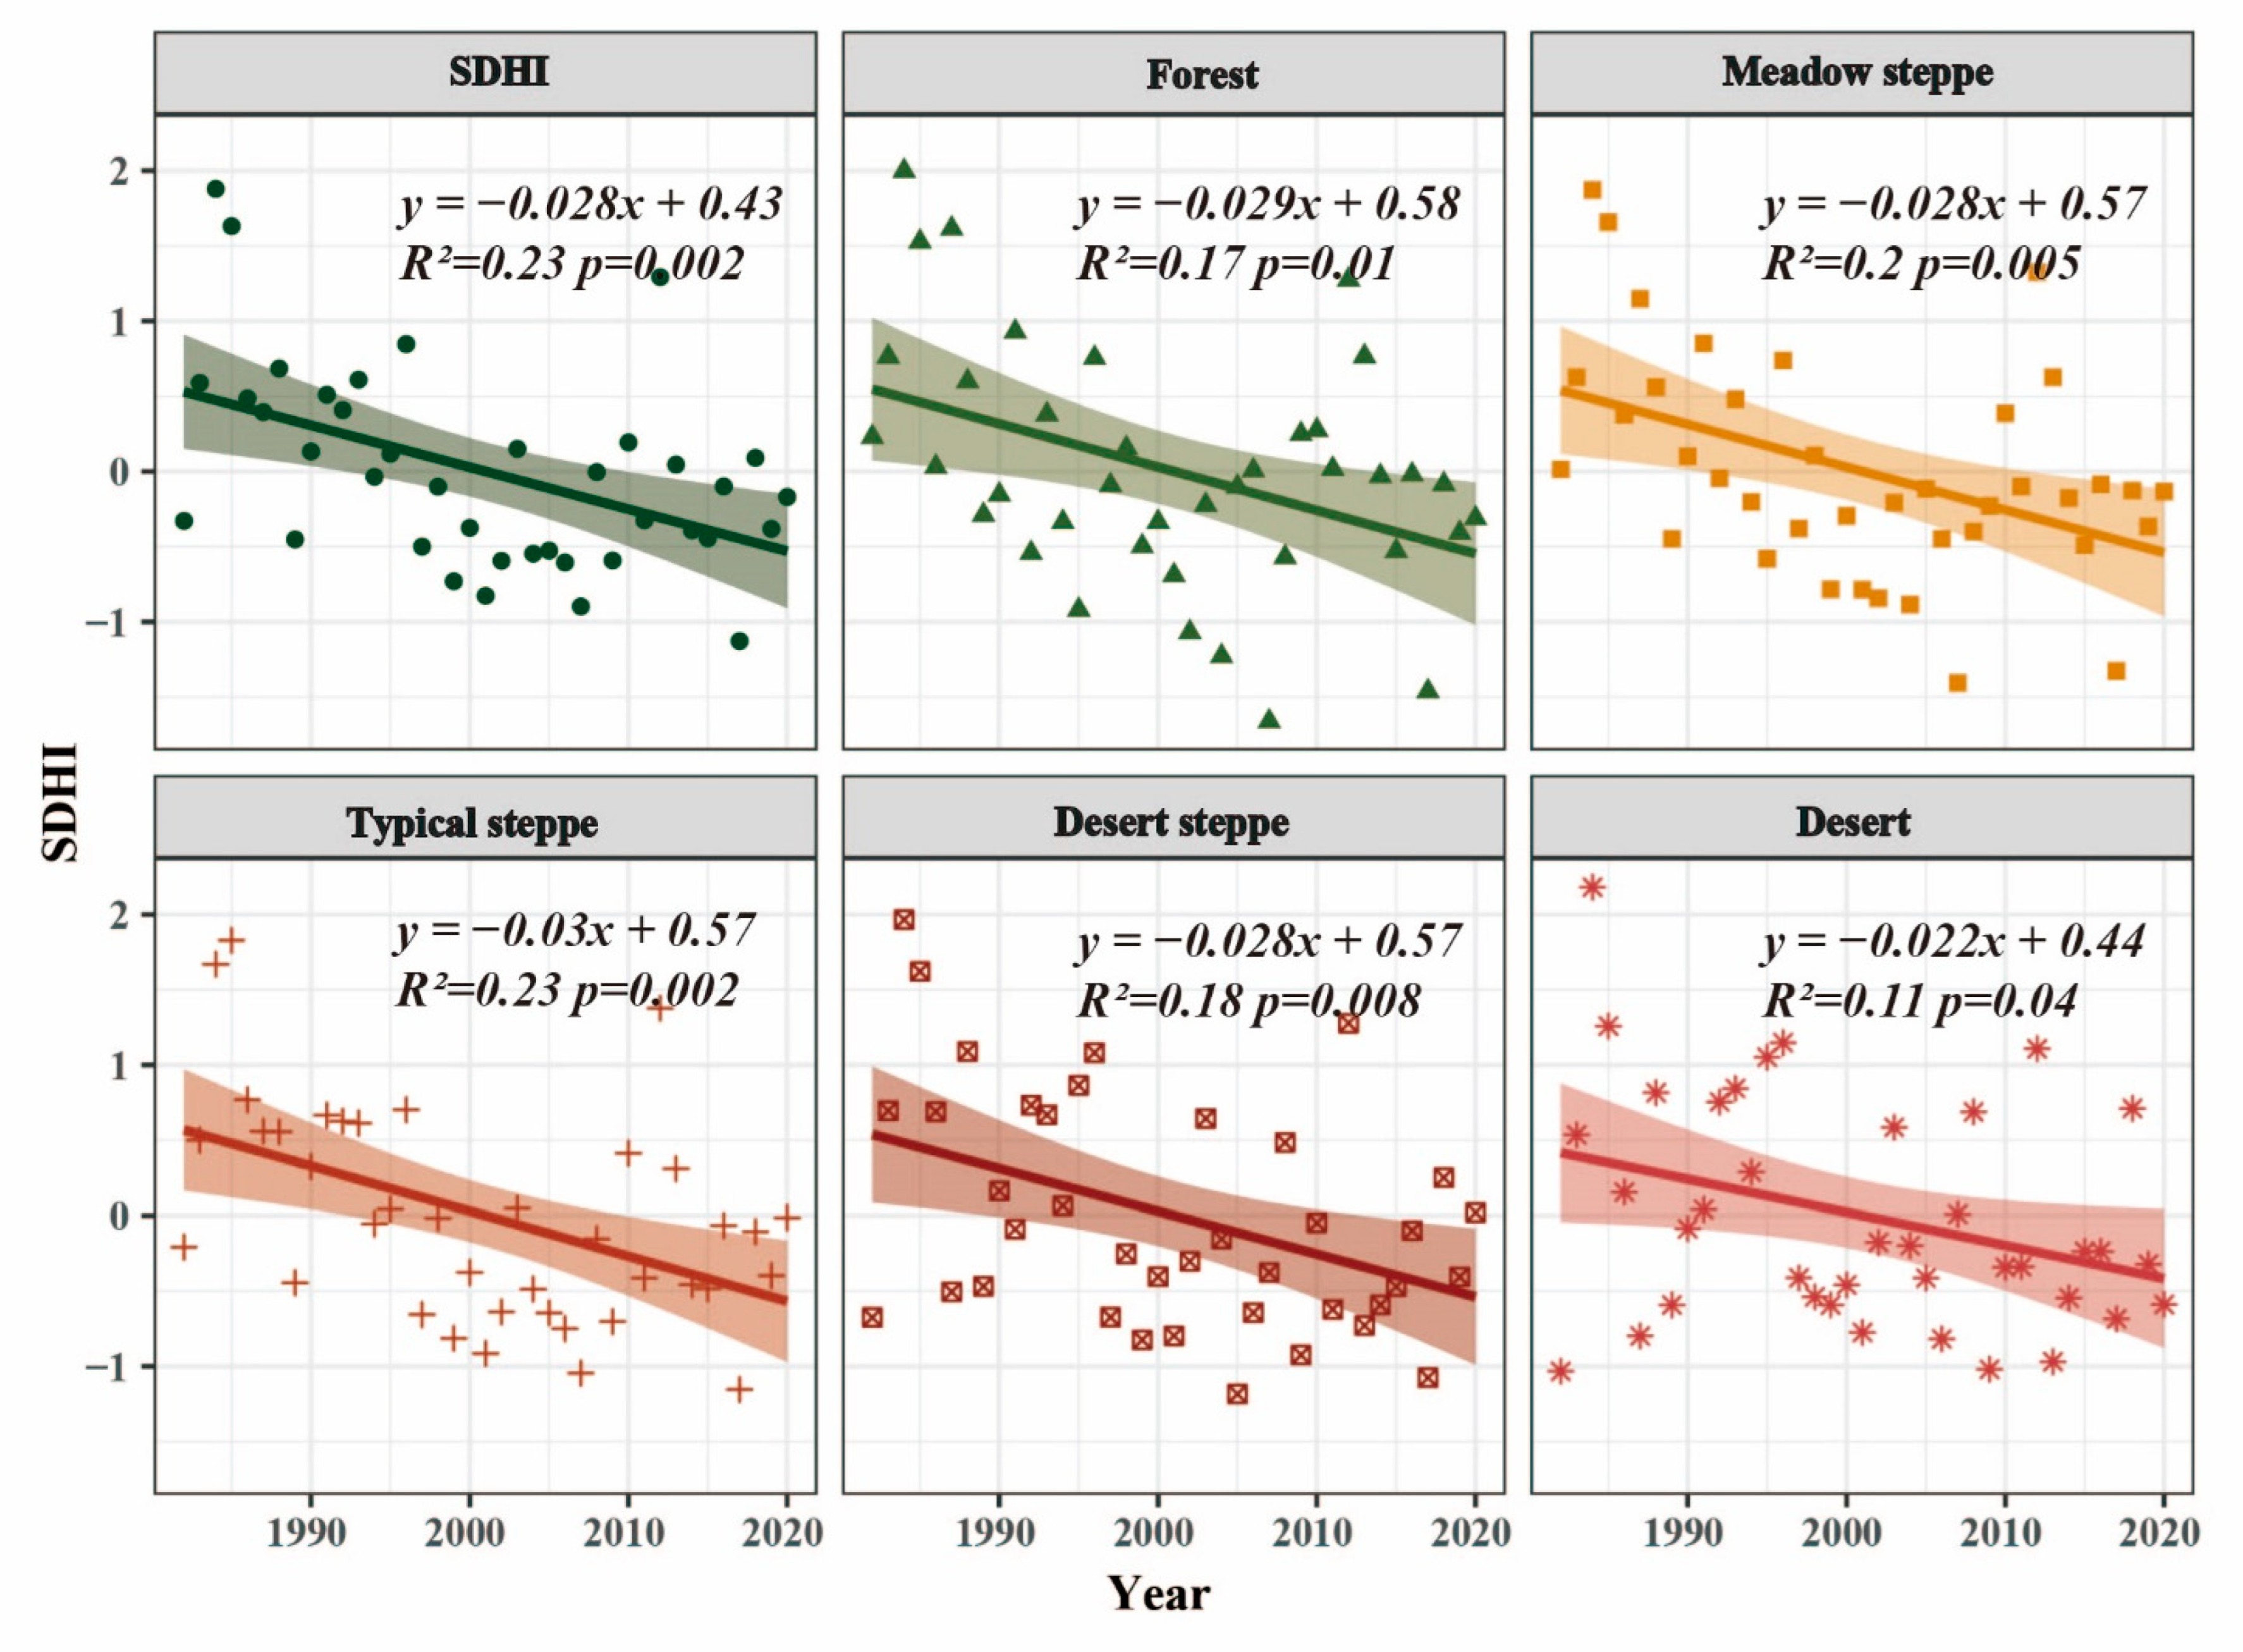
3.1.1. Temporal Variation in SDHI

The SDHI values for Inner Mongolia as a whole and each grassland type showed a decreasing trend from 1982 to 2020 (Figure 2). The overall SDHI value decreased at a rate of 0.03/year (p < 0.05), and the SDHI fluctuated in the range of 1.88–1.13. The highest SDHI in 1984 was 1.88, indicating that the compound dry and hot event in 1984 had the lowest severity in the past 39 years, whereas the lowest SDHI value occurred in 2017, indicating that the compound event that occurred in 2017 was the most serious. Among the grassland types, the SDHI value in the forest area decreased by 0.029/year (p < 0.05), the maximum value of 1.99 appeared in 1984, and the minimum of −1.66 appeared in 2007. The meadow steppe and desert steppe both decreased at a rate of 0.28/year (p < 0.05). Among the five grassland types, typical grassland decreased at the highest rate at 0.03/year (p < 0.05). The SDHI value of typical grassland was the highest in 1985 and lowest in 2017. As the desert region with the lowest decrease rate, the highest value still appeared in 1984, whereas the year with the highest severity of the compound dry and hot events in the desert region was 2017.
As the SDHI value in Inner Mongolia fluctuated greatly in different years, the Mann–Kendall mutation test method was used to diagnose whether a mutation occurred. Figure 3 shows an analysis of the years when the SDHI value in Inner Mongolia may have mutated from 1982 to 2020, where UF and UB are statistical curves, and plus or minus 1.96 was used as the critical curve to determine whether the Mann–Kendall test value passed the 0.05 significance level. The results showed that the UF curves for the SDHI values were within the confidence line throughout; therefore, SDHI has not mutated over the past 39 years, and the trends of increase or decrease were not significant.

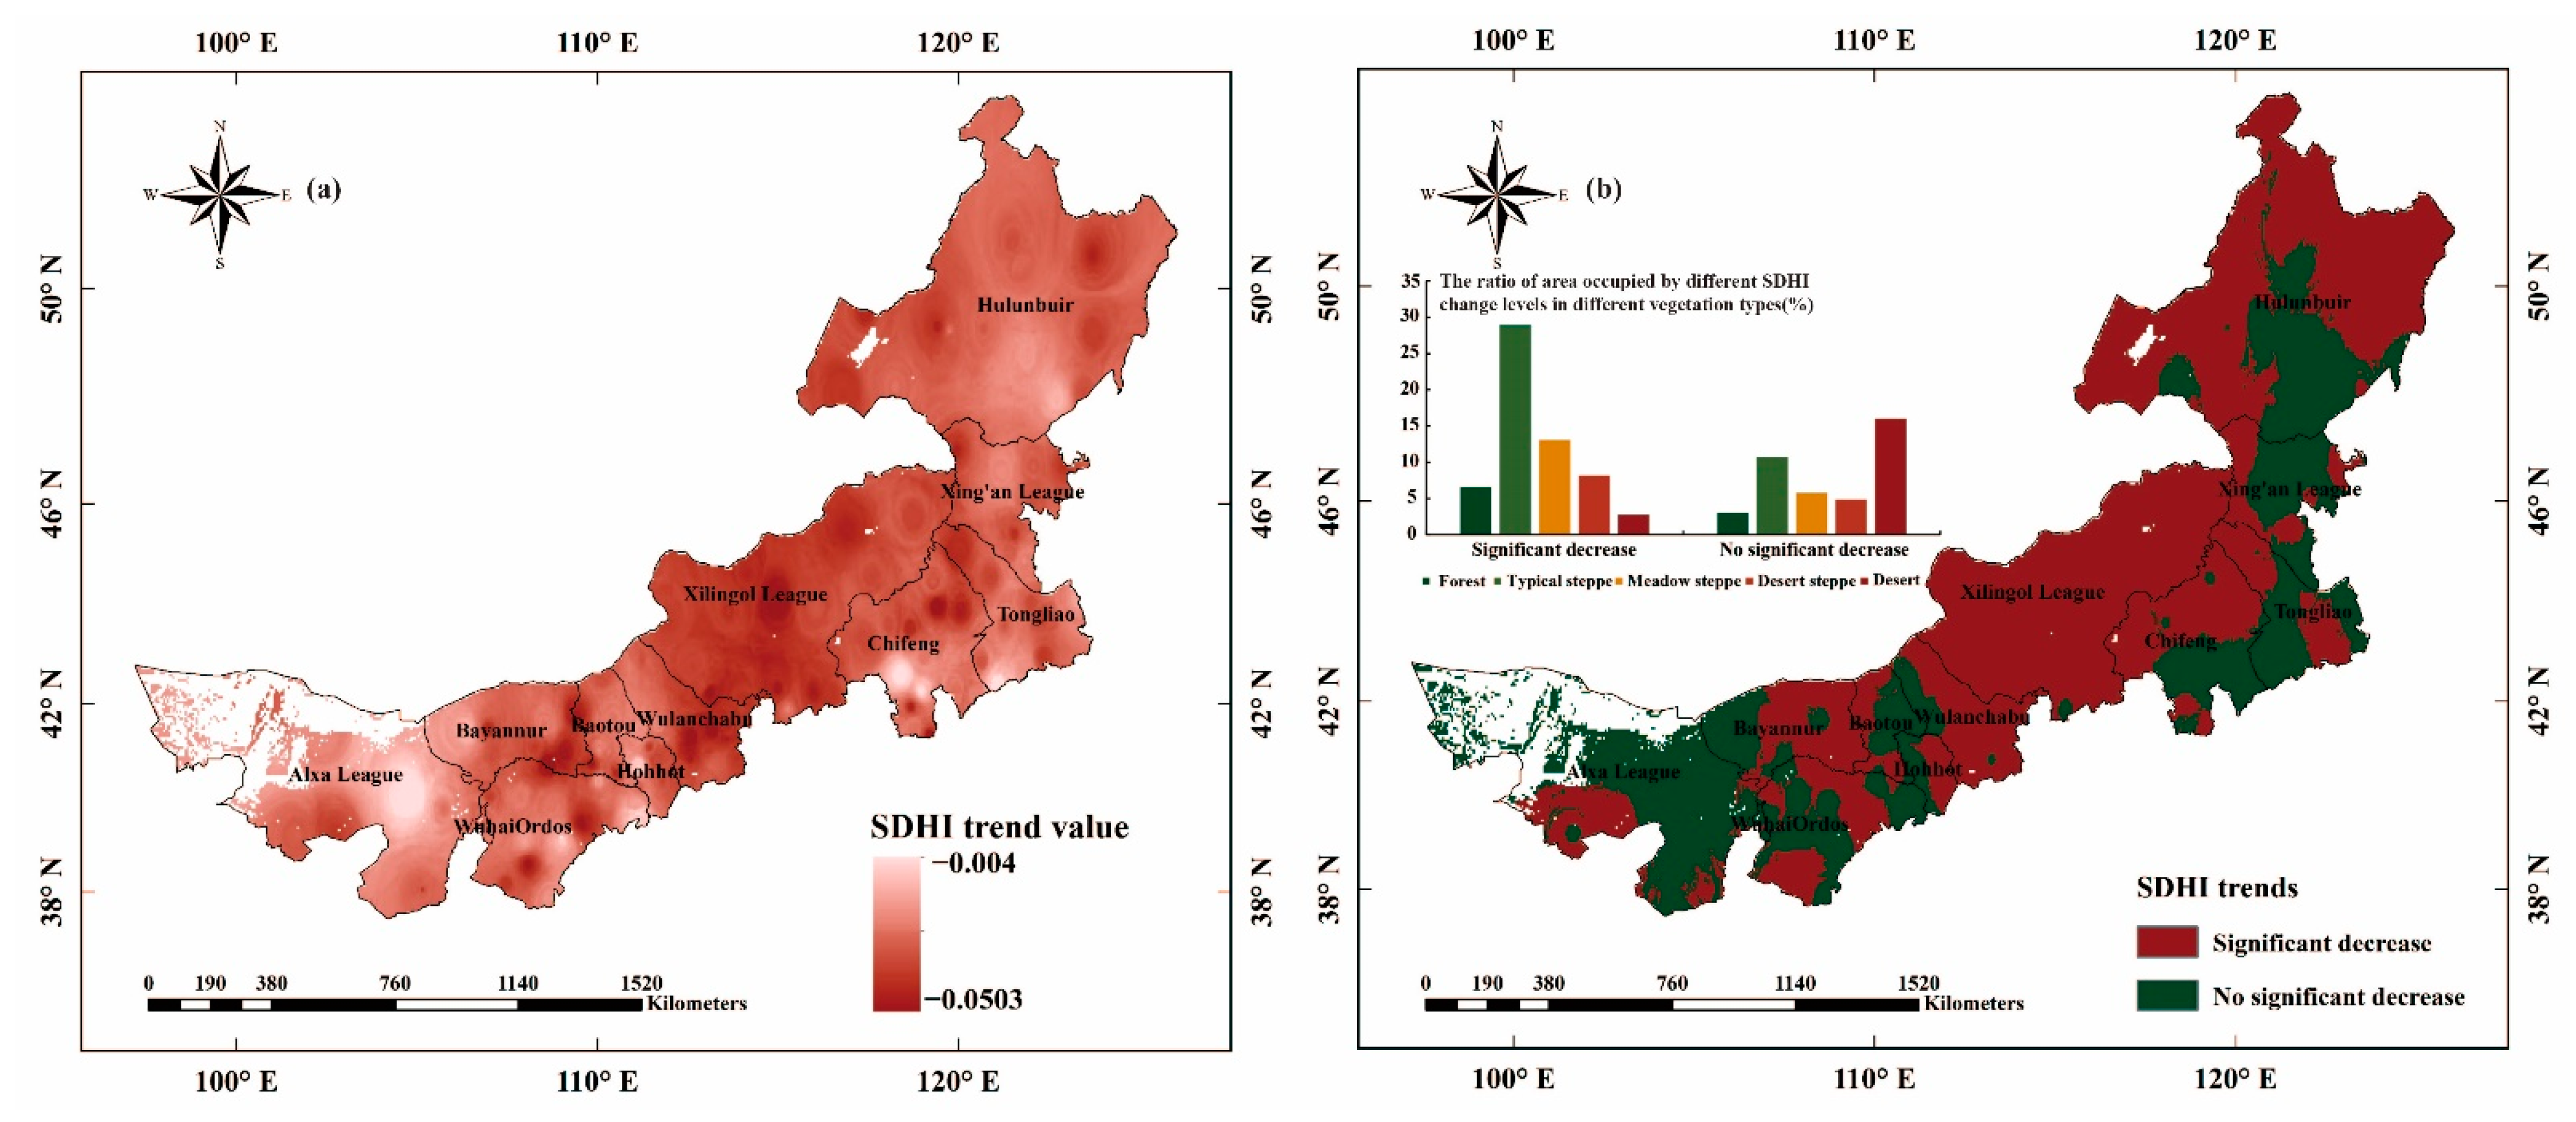
3.1.2. Spatial Variation in SDHI

As can be seen from Figure 4a, the overall SDHI values in Inner Mongolia have shown a decreasing trend over the past 39 years. Specifically, 63.61% of the regions showed a significant decreasing trend in SDHI, mainly concentrated in northwestern Hulunbeier, Xilingol league, Ulanqab, and the border areas of Bayannur, Baotou, and Erdos. In terms of vegetation types, except for the desert area, the area with significant decreased SDHI was larger than the area with no-significant decrease in all other four vegetation types, among which the meadow steppe and typical steppe located in central Inner Mongolia showed a more obvious decreasing trend in SDHI, and the area with no-significant decreasing trend in SDHI was larger in the desert area (Figure 4b).

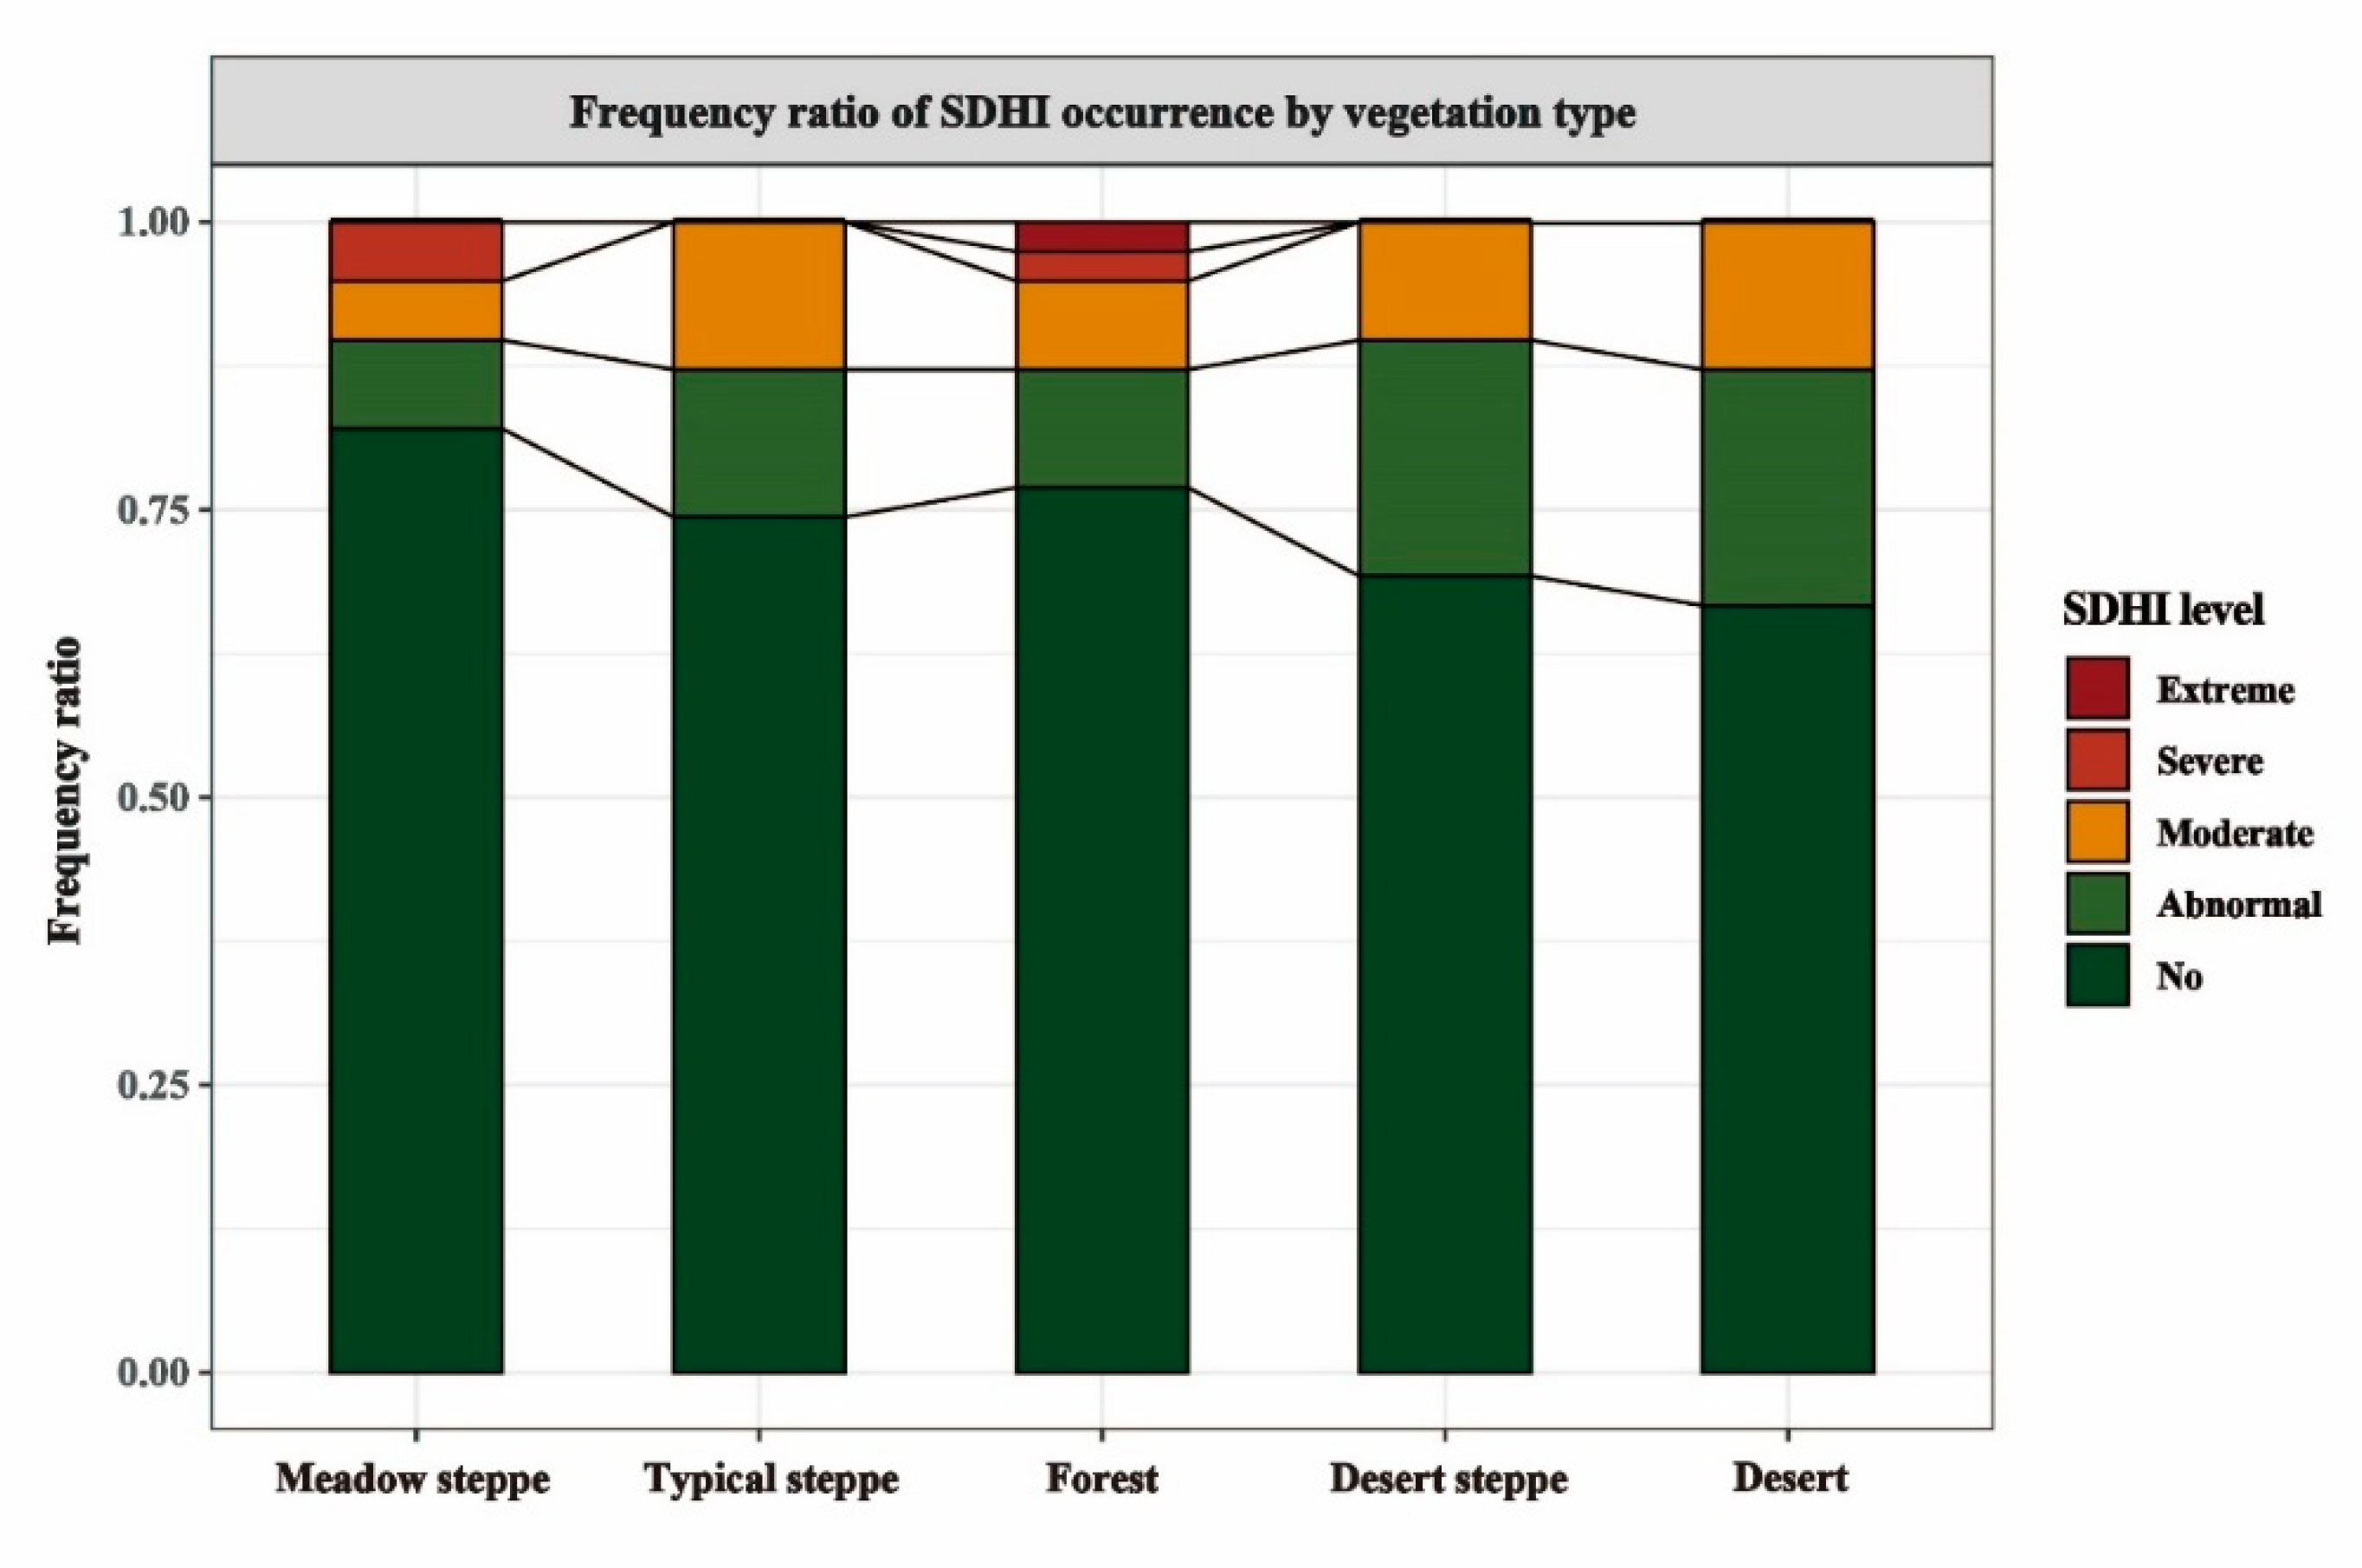
3.1.3. Frequency Ratios of SDHI for Different Grassland Types

To obtain detailed information on the severity of compound events occurring in different vegetation types, the frequency ratios of the different levels of compound dry and hot events occurring in the five grassland types in Inner Mongolia were tabulated (Figure 5). Overall, the results indicate that Inner Mongolia is dominated by the occurrence of abnormal compound dry and hot events, and the desert steppe and desert areas are more prone to compound dry and hot events than other grassland vegetation types. In addition, forests are more prone to low frequency but higher severity compound dry and hot events. The typical steppe had only mild and moderate compound dry and hot events over 39 years, with a frequency rate of approximately 25%, with both types of compound dry and hot events occurring with equal frequency. The meadow steppe has the highest frequency of severe compound dry and hot events.

3.2. Characterization of NDVI Change

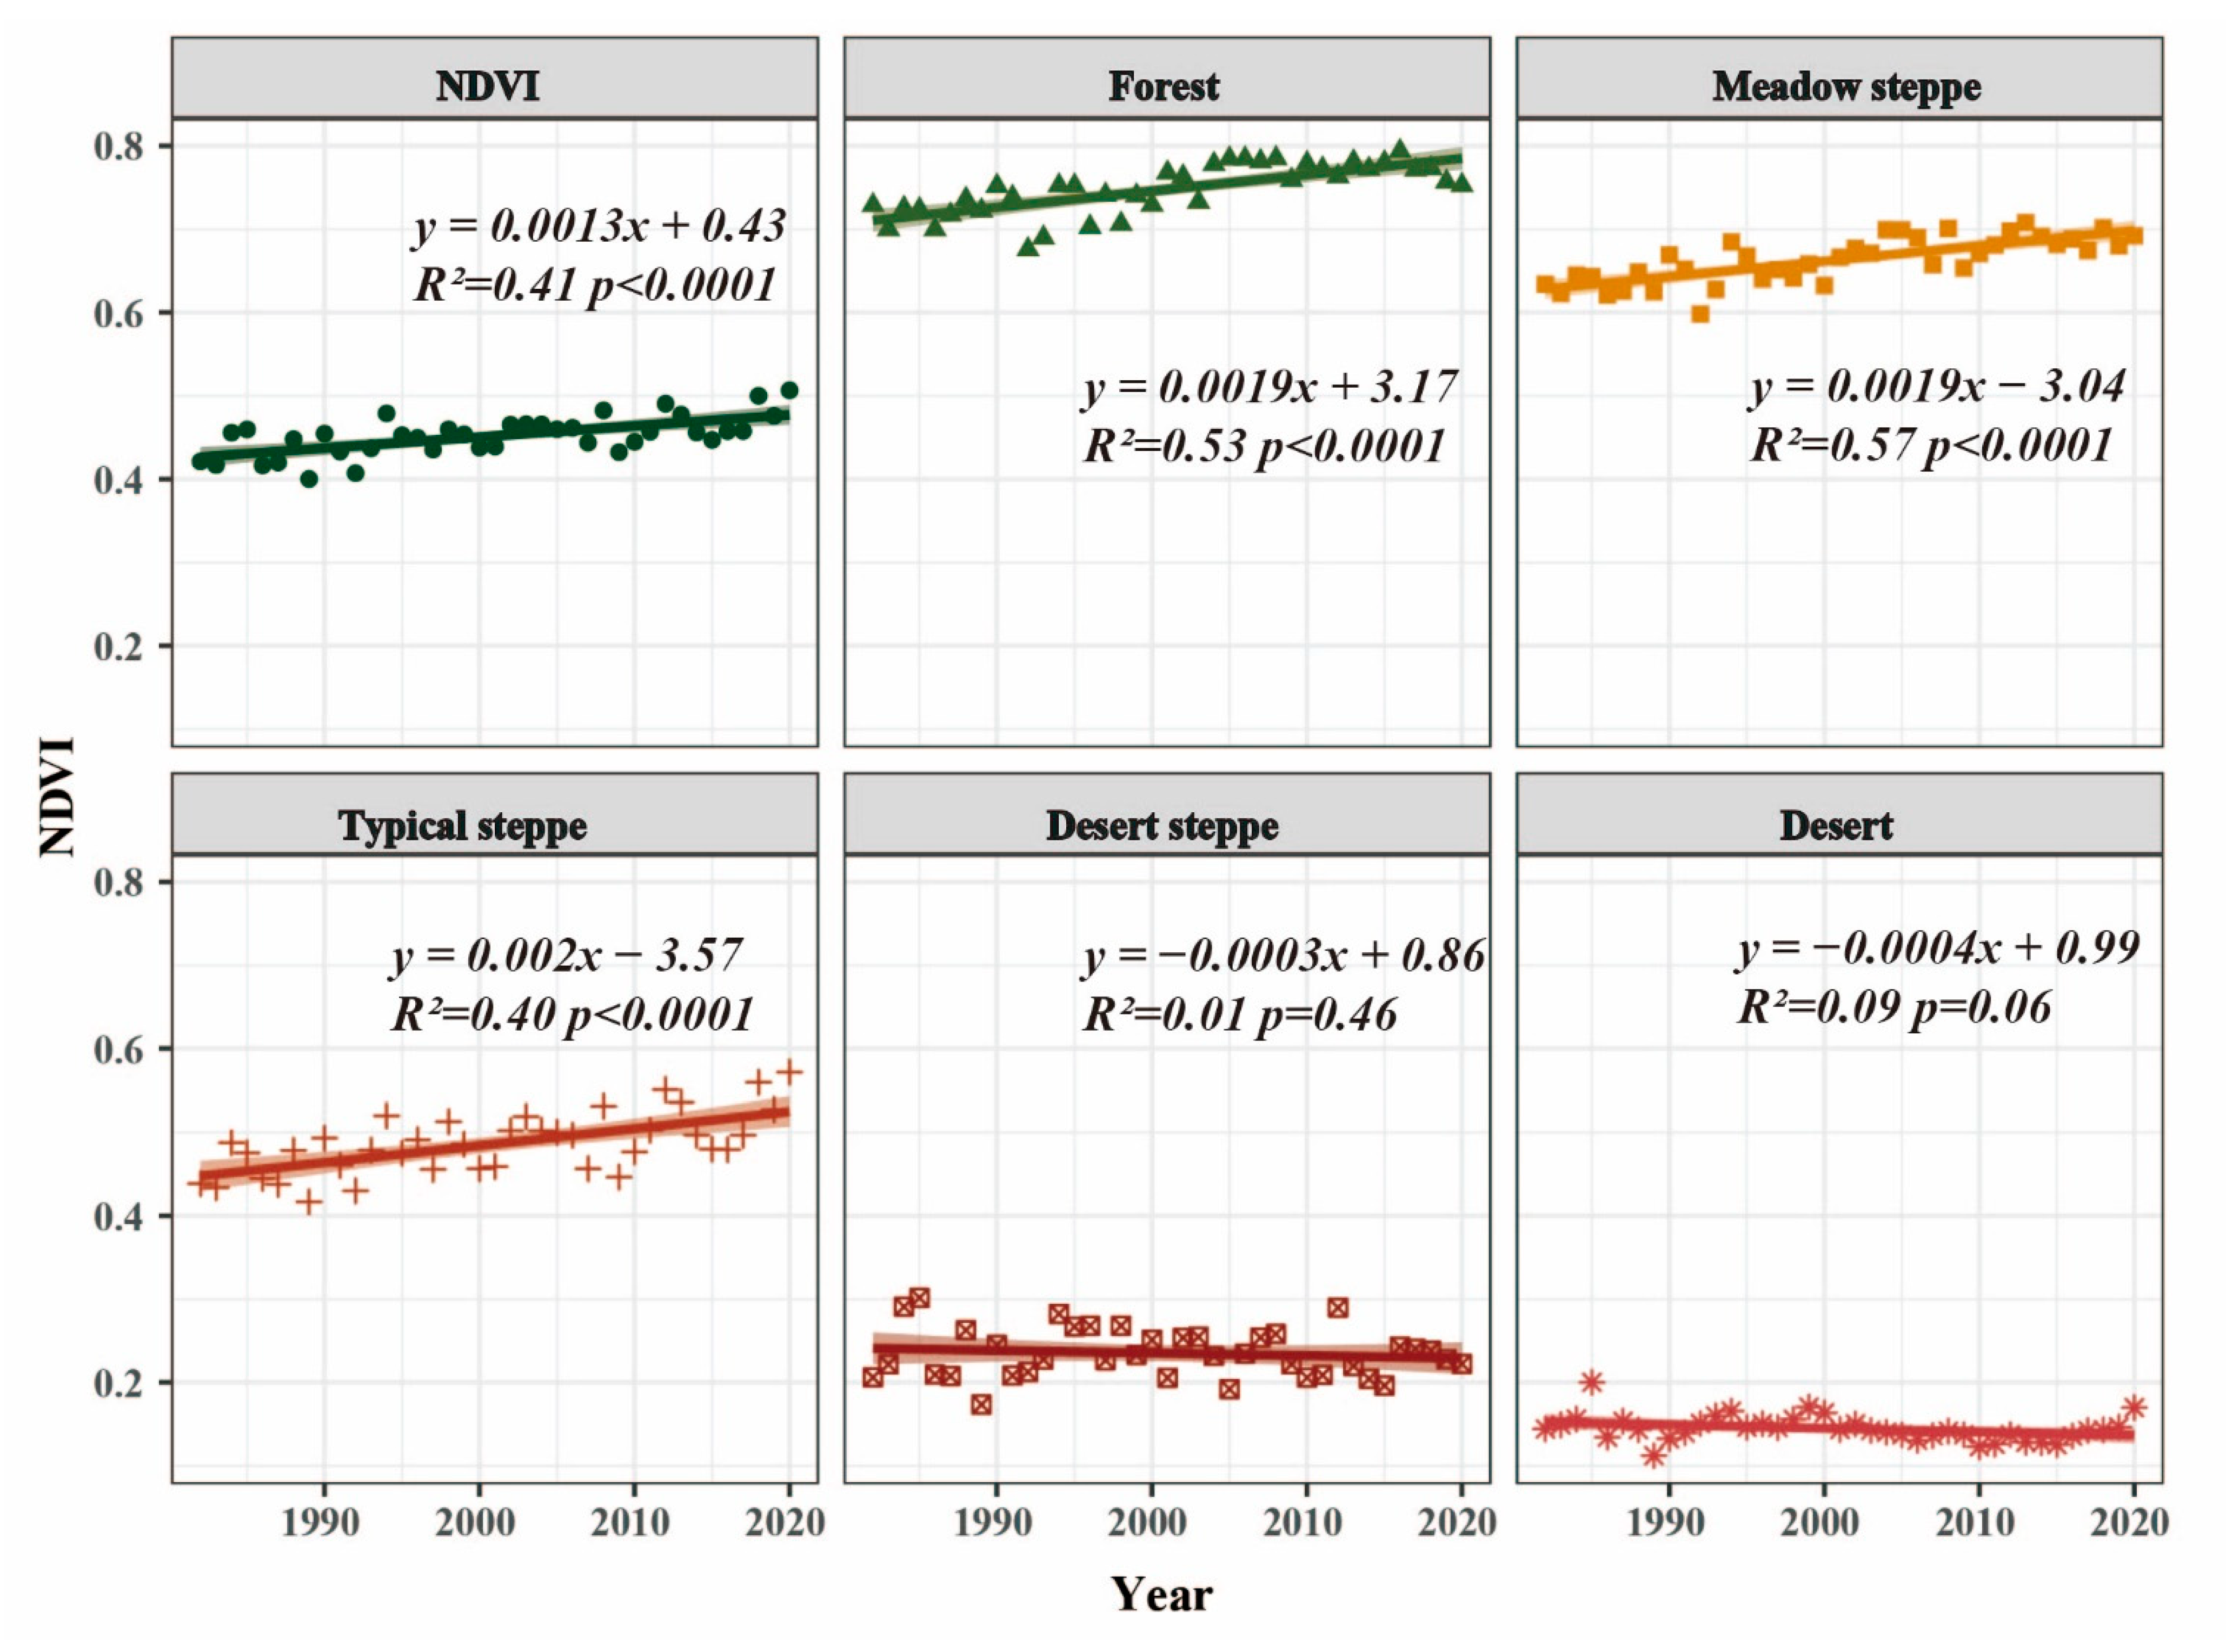
3.2.1. Temporal Variation in NDVI

The temporal trends in NDVI values for Inner Mongolia as a whole and each grassland type from 1982 to 2020 are shown in Figure 6. In the last 39 years, the mean NDVI in Inner Mongolia has been increasing at 0.013/10a (p < 0.05), with annual mean values ranging from 0.4 to 0.6, with the highest value occurring in 2020 and the lowest in 1989. Among all grassland types, forest and meadow steppe showed increasing trends, both at 0.019/10a (p < 0.05), with the highest mean NDVI values in forest areas fluctuating from 0.6–0.8, with the highest value (0.79) occurring in 2016 and the lowest (0.68) in 1992, and the highest value in meadow steppe occurring in 2013 and the lowest value in 1992. Typical steppe showed an increasing trend at 0.02/10a (p < 0.05), with the highest and lowest values occurring in 2020 and 1989, respectively. NDVI values in desert steppe showed a non-significant decreasing trend at a rate of −0.0003/year. In addition, the desert NDVI showed a non-significant decreasing trend of 0.004/10a over the last 39 years, with the highest value occurring in 1985 and the lowest in 1989.
The Mann–Kendall mutation test was used to diagnose the mutation scenario of NDVI in Inner Mongolia over the last 39 years (Figure 7). The results showed that the UF and UB curves of NDVI intersected in the confidence interval in 2001, indicating that a mutation in NDVI may have occurred in 2001. The overall NDVI values in Inner Mongolia exhibited a fluctuating trend, with a decreasing trend from 1982–2001 and an increasing trend after 2001. That is, 2001 was the year when NDVI values changed abruptly from decreasing to increasing.

3.2.2. Spatial Variation in NDVI

Figure 8 shows the spatial variation of NDVI in Inner Mongolia from 1982 to 2020. In the past 39 years, the NDVI values in 74.22% of Inner Mongolia showed an increasing trend (Figure 8a), of which 49.82% showed a significant increase, mainly in Hulunbeier, Xing′an Meng, Tongliao, Chifeng, Erdos, and Hohhot. In addition, 23.62% of the areas showed a decreasing trend in NDVI values during 1982–2020, mainly in the western part of Xilingol league, the northern part of Ulanqab city, Baotou city, Bayannur, and most of Alxa league. Among the five vegetation types, except for desert steppe and desert, NDVI is the largest area of significant increasing level, desert steppe and desert areas have the largest area of stable and constant level of NDVI, and desert is the area with the largest decrease in NDVI value. It indicates that the vegetation in the southeastern part of Inner Mongolia showed a greening scenario during 1982–2020, while the vegetation in the central and northern parts of the country showed little fluctuation, and the largest area of vegetation turning brown in Inner Mongolia was in the west (Figure 8b).

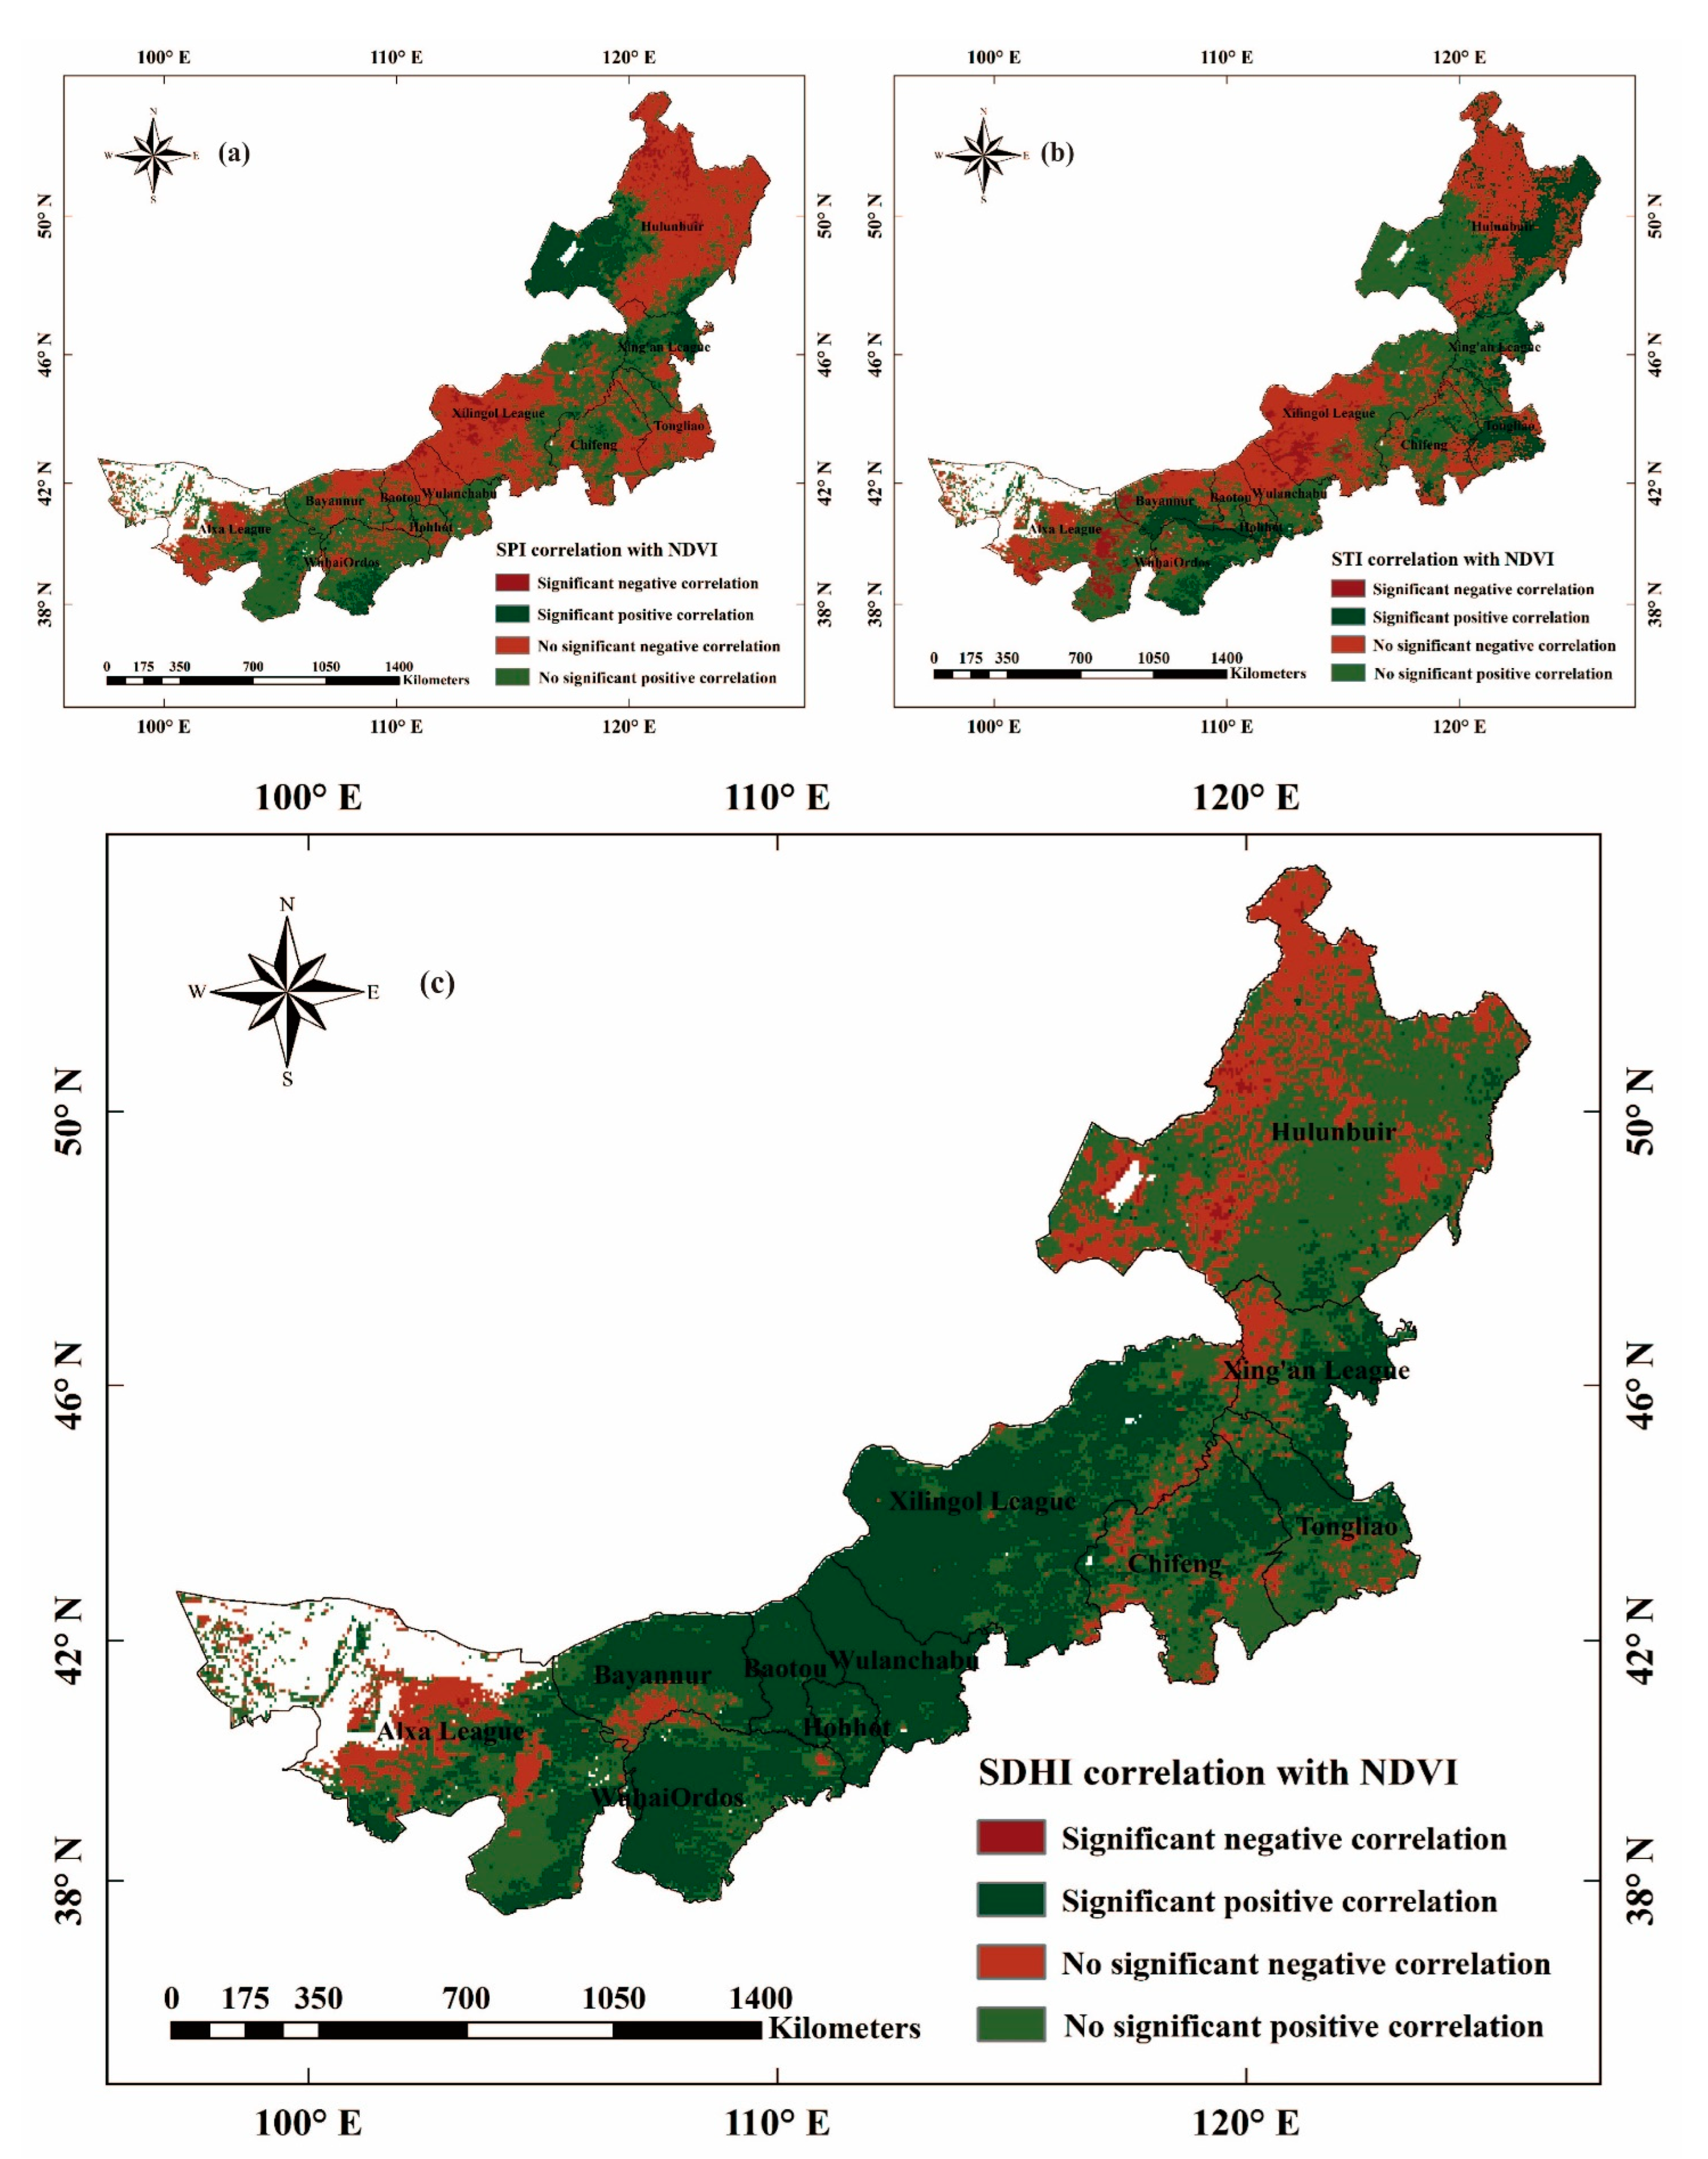
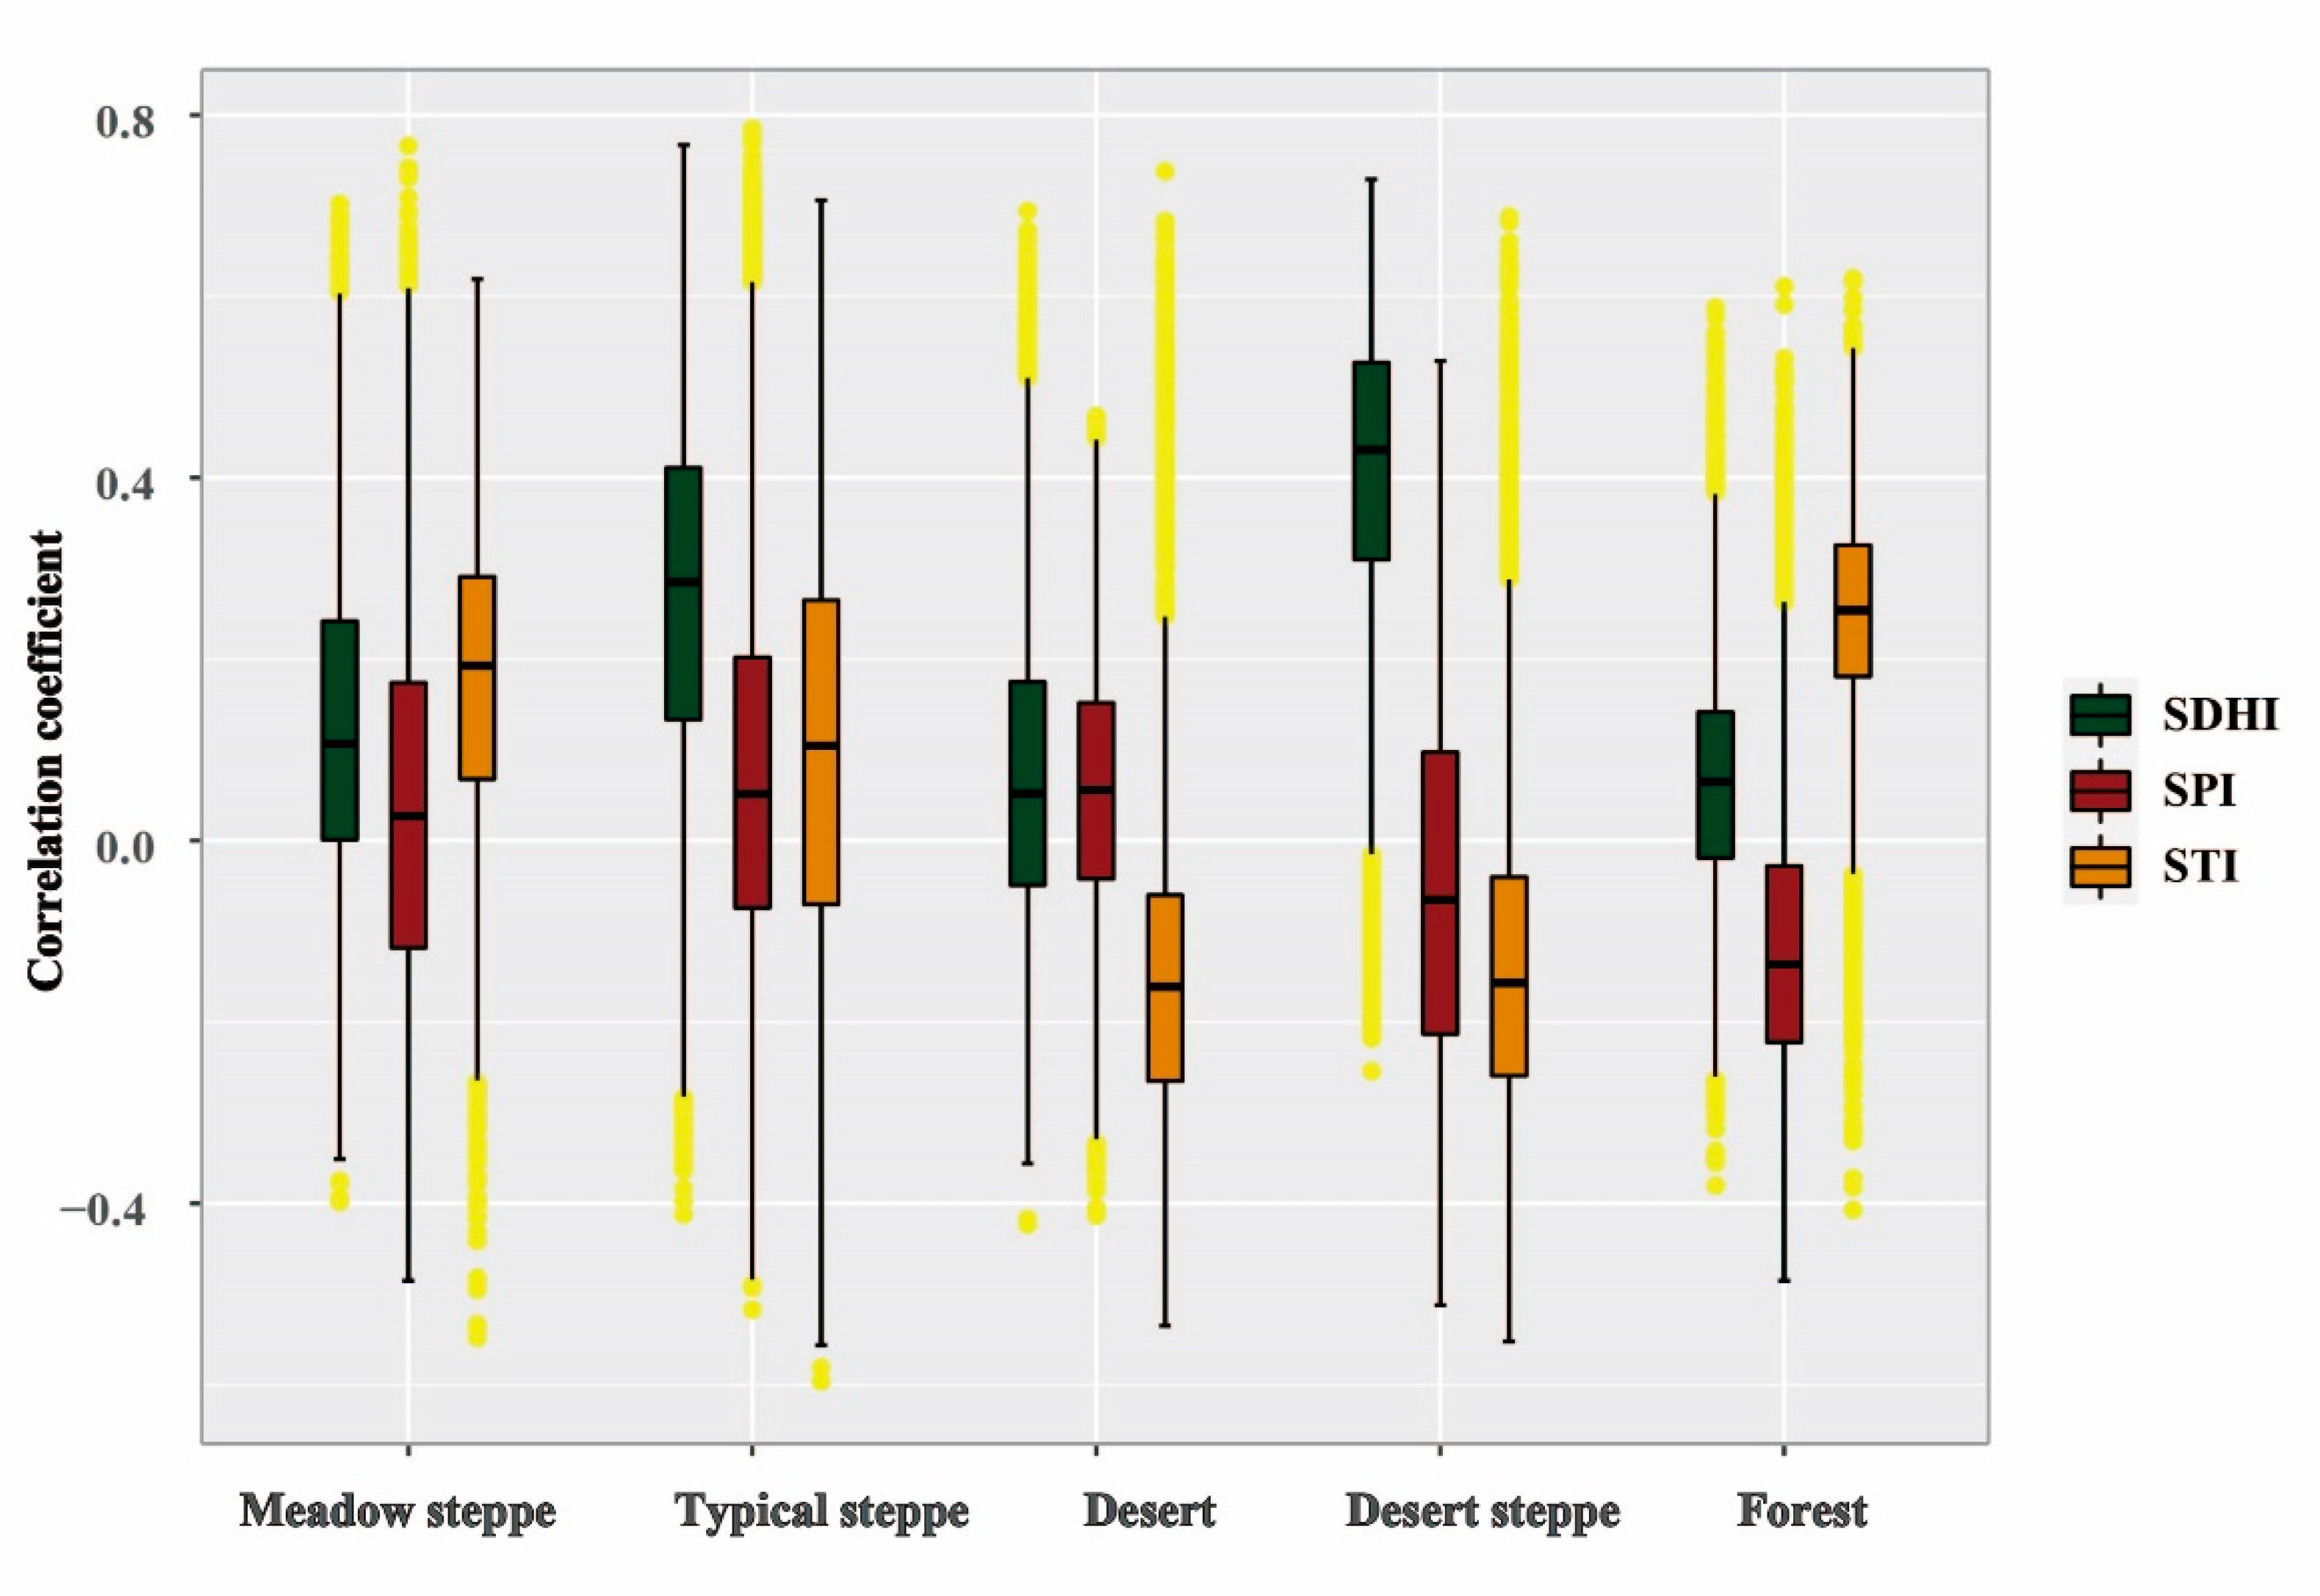
3.3. Correlation Analysis between SDHI and NDVI

The correlation between SPI and NDVI is shown (Figure 9a); 52.21% of Inner Mongolia has a positive correlation between SPI and NDVI values, which are distributed in each league city. Although studies have shown that the rapid increase in temperature in northern China in recent decades has had a negative impact on vegetation growth to some extent, the partial correlation between STI and NDVI in the present study (Figure 9b) shows that while the increase in temperature suppressed NDVI growth, it also promoted vegetation growth in the northeast and southwest Inner Mongolia. When the temperature and precipitation increase simultaneously within a certain level, the optimum temperature for photosynthesis of vegetation increases as the temperature of the growing environment increases, indicating that vegetation growth becomes more adaptive to changes in environmental temperature. Moreover, the higher the precipitation, the stronger the adaptive capacity of vegetation. Further research found that in the cold regions of the Northern Hemisphere, the optimal temperature for vegetation photosynthesis is lower than the temperature during the growing season, indicating that there is still room for future warming to promote vegetation growth to a certain extent [45]. In contrast, when a high-temperature event and a drought event occur simultaneously, a compound dry and hot event occurs, intensifying the damage to vegetation growth. In particular, since the 1980s, due to the gradual weakening of the humidity compensation effect after extreme climatic events, a large-scale continuous decline in tree growth in inland semi-arid regions of Asia has occurred. The warming trend is aggravating, and the occurrence and severity of compound events may further reduce carbon sink intensity in inland semi-arid Asia in the future [46].
Therefore, we analyzed the SDHI, an indicator representing the severity of compound events in Inner Mongolia, for partial correlations with NDVI; the spatial distribution is shown in (Figure 9c). Overall, the SDHI and NDVI were positively correlated in Inner Mongolia, with the largest area of non-significant positive correlation between the two, at approximately 41.91%. The mean value of the partial correlation coefficient between the SDHI and NDVI was 0.68, showing a spatial response that was strong in the center and gradually decreased towards the east and west. The SDHI was positively correlated with NDVI in 83.77% of the study area, with significant positive correlations mainly in the central areas of the Hohhot, Ulanqab, and Xilingol leagues, where typical steppe is mainly distributed, indicating that vegetation in typical steppe in Inner Mongolia is more sensitive to changes in the occurrence and severity of compound dry and hot events. In addition, in approximately 15.87% of Inner Mongolia, SDHI is negatively correlated with NDVI, of which 15.83% is non-significantly negatively correlated, mostly in the northwestern part of Hulunbeier, the northwestern part of Xing′an League, the Wuliang Suhai watershed of Bayannur City, and the central part of Alxa League, indicating that NDVI changes in these areas are not significantly influenced by compound dry heat events. Hulunbuir City shows a non-significant negative correlation with the distribution of forest reserves such as Moldauga and Iksama, where vegetation changes are more influenced by national policies and other anthropogenic influences, including the Wuliangsuhai in Bayannur, since the establishment of the Wuliang Suhai Wetland Waterfowl Nature Reserve and Ecological Protection and Restoration Project began in 1998. In terms of ecological benefits, the desertification process in the Wuliangsuhai watershed has been controlled, and the comprehensive improvement and restoration of the nature reserve and surrounding ecological environment have been effective. Wuliangsuhai has received sufficient ecological water supply; the ecological environment has been greatly improved and effectively protected, and the service function of the ecosystem has been greatly improved. The desert area in the central part of the Alxa League is subject to the implementation of key ecological construction projects, such as the National Natural Forest Protection Project, returning farmland to forest (grass), the “Three Norths” and wildlife protection, and the construction of nature reserves. The southeastern edge of the Geli Desert and the southwestern edge of the Desert have formed two large-scale sand-proof and Dust Storm Blocking Border Protection Forest and Grass Belts, which effectively curb the pre-invasion and spread of the Tengger Desert and the Ulanbuhe Desertb [47].
To understand in more detail the pattern of extreme events in different grassland vegetation types in Inner Mongolia, a partial correlation analysis was conducted between different vegetation types and the SDHI, SPI, and STI (Figure 10). The correlation coefficient results show that typical steppe and desert are positively affected by SPI, whereas desert steppe and forest area are more negatively correlated with SPI, and the forest is most significantly positively affected by STI. Deserts and desert grasslands show a negative correlation, indicating that these two areas are more sensitive to temperature conditions compared to woodland. The five types of grassland vegetation were positively correlated with the SDHI, and the area most affected by the compound dry and hot conditions was the desert steppe. The compound dry and hot conditions were also the dominant factors for the growth of the typical steppe. The correlations between NDVI and individual and compound climatic conditions in the different vegetation areas were quite different. The meadow steppe and typical steppe were positively correlated with climatic conditions, but the dominant factors of the two differed, with typical steppe being more sensitive to compound dry and hot conditions. Both the desert and desert steppe areas were negatively influenced by temperature conditions, with the most significant factor affecting the growth of desert grassland vegetation being compound dry and hot conditions. For forest, the response to temperature conditions was the strongest. In general, overall vegetation growth in Inner Mongolia was most influenced by temperature conditions, followed by compound dry and hot conditions, with drought conditions having the least significant effect, which shows that drought conditions are not the dominant factor in vegetation growth in Inner Mongolia [48,49]. To further validate this conclusion, we chose the SDHI, SPI, and STI as factors to quantify the contribution of the three to NDVI (Figure 11) and obtained conclusions consistent with the correlation analysis.

4. Discussion

This study was based on an analysis of the severity of compound dry and hot events, changes in vegetation cover, and the relationship between them in Inner Mongolia from 1982 to 2020. The Theil–Sen median trend analysis and Mann–Kendall test were used to investigate the heterogeneity of the spatial and temporal variability of the two, and the degree of independent influence of SDHI on NDVI was quantified using partial correlation analysis based on excluding the influence of SPI and STI on NDVI, which provides a reliable scientific basis for future disaster prevention and mitigation and maintenance of sustainable development of ecosystems at the regional scale.
In studying the partial correlation between SDHI and NDVI, it was found that 83.77% of Inner Mongolia had a positive correlation between SDHI and NDVI, and the central region was more significantly affected by the compound dry and hot events than other regions. When using multiple linear regression to quantify the influence of climatic factors on vegetation change in Inner Mongolia, it was concluded that grasslands in central Inner Mongolia contributed more significantly to vegetation when subjected to a combination of climatic factors [13,37]. When studying the driving factors of vegetation cover change in central Inner Mongolia, it was found that climatic factors have a greater impact on vegetation cover in central Inner Mongolia than non-climatic factors, and when two factors interact, their explanatory power will be stronger [37,50]. To study the changing mechanism of the severity of compound dry and hot events, the trends of SPI and STI values representing drought and high-temperature conditions in Inner Mongolia over the past 39 years were analyzed (Figure 12). The SPI shows a non-significant decreasing trend, while the STI value has a very significant increasing trend at 0.04/year. Combined with the changing trend of the SDHI value, we can obtain the change in SDHI in Inner Mongolia, which is mainly dominated by the increase in high-temperature conditions. Compared with the drought events, in which the aggravating trend is still more controversial, existing research shows that the increase in the frequency of extreme high-temperature events is more significant in the context of global warming, which supports the view of this study [30,51]. For the remaining 16.23% of the areas where SDHI and NDVI were negatively correlated, especially in the northeastern region, such as the forest vegetation distribution area, the degree of drought was weaker than that of other grassland vegetation areas. Elevation also has a promoting effect on vegetation in this area [52,53].
Among existing VIs, the Normalized Difference Vegetation Index (NDVI) is the most often used and is an operational, global-based vegetation index, NDVI is a good proxy for vegetation density parameters such as leaf area index (LAI), vegetation cover (FVC), and absorbed photosynthetically active radiation (fAPAR) [54,55]. However, NDVI has two major limitations in characterizing biomass and productivity. First, the relationship between NDVI and green biomass is non-linear and can be saturated in areas with high vegetation cover. The second limitation is that NDVI mainly reflects vegetation greenness rather than photosynthesis itself. However, total primary productivity (GPP) can decline without any reduction in LAI or chlorophyll. Combining the shortcomings of NDVI, a new vegetation index, kNDVI, was proposed by applying the theory of nuclear methods to NDVI, using machine learning. The kNDVI correlated with GPP similarly or better than other indices globally. kNDVI correlated with SIF better than other indices in general and in all biomes, especially in deciduous broadleaf forests and for herbaceous and cultivated crops. The correlations of kNDVI were higher in nearly all cases (e.g., Spearman correlation and distance correlation), thus confirming the advantage of kNDVI over other indices. Using the kNDVI index in future studies on vegetation will increase the significance of geo-monitoring and terrestrial biosphere studies [36].
This study had some limitations. This study only used AVHRR NDVI data to perform a static analysis of past vegetation cover changes by means of multi-year average NDVI values. In the future, the dynamic changes of vegetation should be described in more detail with the help of multiple data sources and multiple means. In our study of SDHI values, we used 115 meteorological stations in Inner Mongolia for inverse weight interpolation to present the changes in compound dry and hot events in spatial form. In the interpolation process, a spatial resolution of 5 × 5 km was chosen, which may lead to low accuracy and a small number of rasters, which is not sufficiently detailed in the analysis of the results. In the future, an interpolation form with higher precision should be chosen, or the interpolation should be verified through multiple data sources, which is a serious problem for compound dry and hot events in Inner Mongolia, for a more accurate representation of the degree. The relative importance results showed that 24.15% of NDVI changes in Inner Mongolia were dominated by SPI, STI, and SDHI, suggesting that NDVI may also be influenced by policy factors implemented by the government and by the vigorous implementation of ecological projects in Inner Mongolia in recent years [47,54,56]. In addition to anthropogenic factors, the compound dry and hot index constructed in this study only considered two types of climatic conditions, temperature and precipitation, using SPI and STI indices. In future studies, the SPEI index, which considers both precipitation and evapotranspiration meteorological factors, can be added to indicate drought conditions in compound dry and hot events to provide a more comprehensive overview of the driving mechanisms of vegetation growth in Inner Mongolia.

5. Conclusions

Inner Mongolia was selected as the study area, and the SDHI index was constructed to describe the compound dry and hot events. Taking the SDHI and NDVI as the research objects, starting from the climate–vegetation system, with the help of multi-source data theory and methods, we studied the spatial and temporal evolution characteristics of composite dry heat events and NDVI on long-term scales from the climate–vegetation system with the help of multi-source data theory and methods and explored the mechanisms of composite events affecting vegetation changes. The results showed:
  • In terms of spatial and temporal variation characteristics, in the past 39 years, Inner Mongolia was dominated by the occurrence of abnormal compound dry and hot events, and the overall compound dry and hot event severity increased. Among different grassland types, the SDHI value of typical grassland had the largest decrease rate of 0.03/year. The overall NDVI showed an increasing trend of 0.0013/year (p < 0.05), and the areas with significant increasing trend of NDVI values were mainly distributed in forest, meadow steppe, and typical steppe.
  • The overall positive correlation between SDHI and NDVI was observed in Inner Mongolia, and the mean value of partial correlation coefficient between SDHI and NDVI was 0.68, showing a spatial response characteristic of strong in the middle and gradually weakening to the east and west sides. SPI was positively correlated with NDVI values in 52.21% of Inner Mongolia, and temperature conditions both promoted and inhibited vegetation growth in Inner Mongolia.
  • In terms of different grassland types, different vegetation types showed different characteristics dependent on complex climatic conditions, with woodlands being more sensitive to changes in temperature conditions than grasslands, and desert steppe and typical steppe being the most dominant to changes in the SDHI. The combined contribution results show that temperature conditions contribute more to the vegetation change in Inner Mongolia Autonomous Region than precipitation and compound dry and hot conditions.

Author Contributions

Y.K.: conceptualization, methodology, and writing—original draft. E.G.: conceptualization, supervision, and inspection. Y.W.: review and editing. Y.B.: investigation and validation. S.Z.: investigation and validation. R.A.: investigation. We thank the community of the R statistical software for providing a wealth of functionality. The methods described in this article are available as R package “relaimpo” under the GNU General Public License on https://prof.bht−berlin.de/groemping/relaimpo/ (accessed on 15 January 2022). All authors have read and agreed to the published version of the manuscript.

Funding

The project was supported by the Program for Young Talents of Science and Technology in Universities of Inner Mongolia Autonomous Region (NJYT22028), the Natural Science Foundation of Inner Mongolia Autonomous Region of China (2021BS0408, 2020LH04003), The Key Program of National Natural Science Foundation of China (61631011), The International (Regional) Cooperation and Exchange Programs (41961144019), Research Program of science and technology at Universities of Inner Mongolia Autonomous Region (NJZY21542), The Science and Technology Planning Project in Inner Mongolia (2021GG0050), and The National Natural Science Foundation of China (41807507).

Institutional Review Board Statement

Not applicable.

Informed Consent Statement

Not applicable.

Data Availability Statement

Not applicable.

Acknowledgments

The authors would like to thank the anonymous reviewers for their crucial comments, which improved the quality of this paper.

Conflicts of Interest

The authors declare no conflict of interest.

References

  1. Guo, E.L.; Wang, Y.F.; Bao, Y.H.; Sun, Z.Y.; Bao, Y.L.; Lai, Q. Spatiotemporal variation of heat and cold waves and their potential relation with the large-scale atmospheric circulation across Inner Mongolia, China. Theor. Appl. Climatol. 2020, 142, 643–659. [Google Scholar] [CrossRef]
  2. Wang, Y.F.; Liu, G.X.; Guo, E.L. Spatial distribution and temporal variation of drought in Inner Mongolia during 1901–2014 using Standardized Precipitation Evapotranspiration Index. Sci. Total Environ. 2019, 654, 850–862. [Google Scholar] [CrossRef] [PubMed]
  3. Liu, X.; Tian, Z.; Zhang, A.; Zhao, A.; Liu, H. Impacts of Climate on Spatiotemporal Variations in Vegetation NDVI from 1982–2015 in Inner Mongolia, China. Sustain.-Basel 2019, 11, 768. [Google Scholar] [CrossRef]
  4. Li, X.F.; Wang, S. Recent increase in the occurrence of snow droughts followed by extreme heatwaves in a warmer world. Geophys. Res. Lett. 2022, 49, e2022GL099925. [Google Scholar] [CrossRef]
  5. Hao, Z.C.; Aghakouchak, A.; Phillips, T.J. Changes in concurrent monthly precipitation and temperature extremes. Environ. Res. Lett. 2013, 8, 034014. [Google Scholar] [CrossRef]
  6. Hao, Z.C.; Hao, F.H.; Singh, V.P.; Wei, O.Y.; Zhang, X.; Zhang, S.L. A joint extreme index for compound droughts and hot extremes. Theor. Appl. Climatol. 2020, 142, 321–328. [Google Scholar] [CrossRef]
  7. Hao, Z.C.; Hao, F.H.; Singh, V.P.; Xia, Y.L.; Shi, C.X.; Zhang, X. A multivariate approach for statistical assessments of compound extremes. J. Hydrol. 2018, 565, 87–94. [Google Scholar] [CrossRef]
  8. Parmesan, C.; Gary, Y.H. A globally coherent fingerprint of climate change impacts across natural systems. Nature 2003, 421, 37–42. [Google Scholar] [CrossRef]
  9. Forkel, M.; Carvalhais, N.; Verbesselt, J.; Mahecha, M.; Neigh, C.; Reichstein, M. Trend Change Detection in NDVI Time Series: Effects of Inter-Annual Variability and Methodology. Remote Sens. 2013, 5, 2113–2144. [Google Scholar] [CrossRef]
  10. Pan, N.Q.; Feng, X.M.; Fu, B.J.; Wang, S.A.; Ji, F.; Pan, S.F. Increasing global vegetation browning hidden in over-all vegetation greening: Insights from time-varying trends. Remote Sens. Environ. 2018, 214, 59–72. [Google Scholar] [CrossRef]
  11. Kennedy, R.E.; Yang, Z.; Cohen, W.B. Detecting trends in forest disturbance and recovery using yearly Landsat time series: 1. LandTrendr—Temporal segmentation algorithms. Remote Sens. Environ. 2010, 114, 2897–2910. [Google Scholar] [CrossRef]
  12. Baret, F.; Guyot, G. Potentials and limits of vegetation indices for LAI and APAR assessment. Remote Sens. Environ. 1991, 35, 161–173. [Google Scholar] [CrossRef]
  13. Kumari, N.; Srivastava, A.; Dumka, U.C. A Long-Term Spatiotemporal Analysis of Vegetation Greenness over the Himalayan Region Using Google Earth Engine. Climate 2021, 9, 109. [Google Scholar] [CrossRef]
  14. Shahzaman, M.; Zhu, W.; Bilal, M.; Habtemicheal, B.A.; Mustafa, F.; Arshad, M.; Ullah, I.; Ishfaq, S.; Iqbal, R. Remote Sensing Indices for Spatial Monitoring of Agricultural Drought in South Asian Countries. Remote Sens. 2021, 13, 2059. [Google Scholar] [CrossRef]
  15. Zhou, X.; Yamaguchi, Y.; Arjasakusuma, S. Distinguishing the vegetation dynamics induced by anthro-pogenic factors using vegetation optical depth and AVHRR NDVI: A cross-border study on the Mongolian Plateau. Sci. Total Environ. 2018, 616, 730–743. [Google Scholar] [CrossRef]
  16. Rivas-Tabares, D.A.; Saa-Requejo, A.; Martín-Sotoca, J.J.; Tarquis, A.M. Multiscaling NDVI Series Analysis of Rainfed Cereal in Central Spain. Remote. Sens. 2021, 13, 568. [Google Scholar] [CrossRef]
  17. Fensholt, R.; Proud, S.R. Evaluation of Earth Observation based global long term vegetation trends—Comparing GIMMS and MODIS global NDVI time series. Remote Sens. Environ. 2012, 119, 131–147. [Google Scholar] [CrossRef]
  18. Gottfried, M.; Pauli, H.; Futschik, A.; Akhalkatsi, M.; Baran, P.; Alonso, J.L.B.; Coldea, G.; Dick, J.; Erschbamer, B.; Calzado, M.R.F.; et al. Continent-wide response of mountain vegetation to climate change. Nat. Clim. Chang. 2012, 2, 111–115. [Google Scholar] [CrossRef]
  19. He, D.; Huang, X.L.; Tian, Q.J.; Zhang, Z.C. Changes in Vegetation Growth Dynamics and Relations with Climate in Inner Mongolia under More Strict Multiple Pre-Processing (2000–2018). Sustainability 2020, 12, 2534. [Google Scholar] [CrossRef]
  20. Ethan, D.C.; Bruce, K.; Corey, L.; Radley, M.; Horton, E.B.; Jonathan, L.; Justin, S. Mankin Future Hot and Dry Years Worsen Nile Basin Water Scarcity Despite Projected Precipitation Increases. Earth’s Future 2019, 7, 967–977. [Google Scholar]
  21. Doughty, C.E.; Metcalfe, D.B.; Girardin, C.A.J.; Amézquita, F.F.; Cabrera, D.G.; Huasco, W.H.; SilvaEspejo, J.E.; Araujo-Murakami, A.; Costa, M.C.D.; Rocha, W. Drought impact on forest carbon dynamics and fluxes in Amazonia. Nature 2015, 519, 78–82. [Google Scholar] [CrossRef] [PubMed]
  22. Allen, C.D.; Macalady, A.K.; Chenchouni, H. A global overview of drought and heat-induced tree mortality reveals emerging climate change risks for forests. For. Ecol. Manag. 2010, 259, 660–684. [Google Scholar] [CrossRef]
  23. Tian, H.; Cao, C.; Chen, W. Response of vegetation activity dynamic to climatic change and ecological restoration programs in Inner Mongolia from 2000 to 2012. Ecol. Eng. 2015, 82, 276–289. [Google Scholar] [CrossRef]
  24. Reichstein, M.; Bahn, M.; Ciais, P.; Frank, D.; Mahecha, M.D.; Seneviratne, S.I.; Zscheischler, J.; Beer, C.; Buchmann, N.; Frank, D.C. Climate extremes and the carbon cycle. Nature 2013, 500, 287–295. [Google Scholar] [CrossRef] [PubMed]
  25. Hao, Y.; Hao, Z.C.; Feng, S.F.; Zhang, X.; Fang, H. Response of vegetation to El Niño-Southern Oscillation (ENSO) via compound dry and hot events in southern Africa. Glob. Planet. Chang. 2020, 195, 103358. [Google Scholar] [CrossRef]
  26. Zscheischler, J.; Seneviratne, S.I. Dependence of drivers affects risks associated with compound events. Sci. Adv. 2017, 3, e1700263. [Google Scholar] [CrossRef]
  27. Wu, J.; Gao, X.; Giorgi, F.; Chen, D.L. Changes of effective temperature and cold/hot days in late decades over China based on a high resolution gridded observation dataset. Int. J. Climatol. 2017, 37, 788–800. [Google Scholar] [CrossRef]
  28. Wang, M.; Wang, S.; Zhao, J.; Ju, W.; Hao, Z. Global positive gross primary productivity extremes and climate contributions during 1982–2016. Sci. Total Environ. 2021, 774, 145703. [Google Scholar] [CrossRef]
  29. Hao, Z.C.; Hao, F.H.; Singh, V.P.; Zhang, X. Statistical prediction of the severity of compound dry-hot events based on El Niño-Southern Oscillation. J. Hydrol. 2019, 572, 243–250. [Google Scholar] [CrossRef]
  30. Hao, Z.C.; Hao, F.H.; Singh, V.P.; Zhang, X. Changes in the severity of compound drought and hot extremes over global land areas. Environ. Res. Lett. 2018, 13, 124022. [Google Scholar] [CrossRef]
  31. Seddon, A.; Macias, F.M.; Long, P.R.; Benz, D.; Willis, K.J. Sensitivity of global terrestrial ecosystems to climate variability. Nature 2016, 531, 229–232. [Google Scholar] [CrossRef] [PubMed]
  32. Hu, Q.; Pan, F.F.; Pan, X.B.; Zhang, D.; Li, Q.Y.; Pan, Z.H.; Wei, Y.R. Spatial analysis of climate change in Inner Mongolia during 1961–2012, China. Appl. Geogr. 2015, 60, 254–260. [Google Scholar] [CrossRef]
  33. Tong, S.Q.; Li, X.Q.; Zhang, J.Q.; Bao, Y.H.; Bao, Y.B.; Lai, Q. Spatial and temporal variability in extreme temperature and precipitation events in Inner Mongolia (China) during 1960–2017. Sci. Total Environ. 2019, 649, 75–89. [Google Scholar] [CrossRef] [PubMed]
  34. Keenan, T.F.; Riley, W.J. Greening of the land surface in the world’s cold regions consistent with recent warming. Nat. Clim. Chang. 2018, 8, 825–828. [Google Scholar] [CrossRef] [PubMed]
  35. Piao, S.L.; Mohammat, A.; Fang, J.Y.; Cai, Q.; Feng, J.M. NDVI-based increase in growth of temperate grasslands and its responses to climate changes in China. Glob. Environ. Chang.-Hum. Policy Dimens. 2006, 16, 340–348. [Google Scholar] [CrossRef]
  36. Pei, Z.F.; Fang, S.B.; Yang, W.N.; Wang, L.; Wu, M.Y.; Zhang, Q.F.; Han, W.; Khoi, D.N. The Relationship between NDVI and Climate Factors at Different Monthly Time Scales: A Case Study of Grasslands in Inner Mongolia, China (1982–2015). Sustainability 2019, 11, 7243. [Google Scholar] [CrossRef]
  37. Guo, L.H.; Zuo, L.Y.; Gao, J.B.; Jiang, Y.; Zhang, Y.L.; Ma, S.C.; Zou, Y.F.; Wu, S.H. Revealing the Fingerprint of Climate Change in Interannual NDVI Variability among Biomes in Inner Mongolia, China. Remote Sens. 2020, 12, 1332. [Google Scholar] [CrossRef]
  38. Pedelty, J.; Devadiga, S.; Masuoka, E.; Brown, M.; Pinzon, J.; Tucker, C. Generating a long-term land data record from the AVHRR and MODIS instruments. In Proceedings of the Geoscience and Remote Sensing Symposium, IGARSS 2007, Barcelona, Spain, 23–28 July 2007; pp. 1021–1025. [Google Scholar]
  39. Moreno, R.J.A.; Riaño, D.; Arbelo, M.; French, N.H.F.; Ustin, S.L.; Whiting, M.L. Burned area mapping time series in Canada (1984–1999) from NOAA-AVHRR LTDR: A comparison with other remote sensing products and fire perimeters. Remote Sens. Environ. 2012, 117, 407–414. [Google Scholar] [CrossRef]
  40. Steinemann, A.; Iacobellis, S.F.; Cayan, D.R. Developing and Evaluating Drought Indicators for Decision-Making. J. Hydrometeorol. 2015, 16, 1793–1803. [Google Scholar] [CrossRef]
  41. Zhang, X.B.; Alexander, L.; Gabriele, C.H.; Philip, J.; Albert, K.T.; Thomas, C.; Peterson, B.T.; Francis, W.Z. Indices for monitoring changes in extremes based on daily temperature and precipitation data. Wiley Interdiscip. Rev. Clim. Chang. 2011, 2, 851–870. [Google Scholar] [CrossRef]
  42. Gringorten, I.I. A plotting rule for extreme probability paper. J. Geophys. Res. 1963, 68, 813–814. [Google Scholar] [CrossRef]
  43. Hamed, K.H. Trend detection in hydrologic data: The Mann–Kendall trend test under the scaling hypothesis. J. Hydrol. 2008, 349, 350–363. [Google Scholar] [CrossRef]
  44. Groemping, U. Relative Importance for Linear Regression in R: The Package relaimpo. J. Stat. Softw. 2006, 1, 925–933. [Google Scholar]
  45. Huang, M.; Piao, S.L.; Ciais, P. Air temperature optima of vegetation productivity across global biomes. Nat. Ecol. Evol. 2019, 3, 772–779. [Google Scholar] [CrossRef] [PubMed]
  46. Xu, C.; Liu, H.; Anenkhonov, O.A.; Sandanov, D.V.; Korolyuk, A.Y.; Wu, X.; Shi, L.; Zhou, M.; Zhao, P. Increased drought frequency causes the extra-compensation of climate wetness on tree growth to fade across inner Asia. Agric. For. Meteorol. 2022, 315, 108829. [Google Scholar] [CrossRef]
  47. Chen, X.; Li, X.; Yang, J. The spatial and temporal dynamics of phytoplankton community and their correlation with environmental factors in Wuliangsuhai Lake, China. Arab. J. Geosci. 2021, 14, 713. [Google Scholar] [CrossRef]
  48. Wenli, Y.; Qiong, H. Wulanbateer. Impacts of climate change over last 50 years on net primary productivity in typical steppe of Inner Mongolia. Chin. J. Agrometeorol. 2008, 29, 294–297. [Google Scholar]
  49. Wang, Y.; Duan, L.; Liu, T.; Luo, Y.; Li, D.; Tong, X.; Li, W.; Lei, H.; Singh, V.P. Evaluation of non-stationarity in summer precipitation and the response of vegetation over the typical steppe in Inner Mongolia. Clim. Dyn. 2021, 58, 2227–2247. [Google Scholar] [CrossRef]
  50. Wei, Z.; Xiu, B.Y.; Jiao, C.C.; Xu, C.D.; Liu, Y.; Wu, G.A. Increased association between climate change and vegetation index variation promotes the coupling of dominant factors and vegetation growth. Sci. Total Environ. 2021, 767, 144669. [Google Scholar]
  51. Seneviratne, S.I.; Donat, M.G.; Mueller, B. No pause in the increase of hot temperature extremes. Nat. Clim. Chang. 2014, 4, 161–163. [Google Scholar] [CrossRef]
  52. Chen, K.; Ge, G.; Bao, G.; Bai, L.; Tong, S.; Bao, Y.; Chao, L. Impact of Extreme Climate on the NDVI of Different Steppe Areas in Inner Mongolia, China. Remote Sens. 2022, 14, 1530. [Google Scholar] [CrossRef]
  53. Meng, B.; Zhang, Y.; Yang, Z.; Lv, Y.; Chen, J.; Li, M.; Sun, Y.; Zhang, H.; Yu, H.; Zhang, J.; et al. Mapping Grassland Classes Using Unmanned Aerial V ehicle and MODIS NDVI Data for Temperate Grassland in Inner Mongolia, China. Remote Sens. 2022, 14, 2094. [Google Scholar] [CrossRef]
  54. Matsushita, B.; Yang, W.; Chen, J.; Onda, Y.; Qiu, G. Sensitivity of the enhanced vegetation index (EVI) and normalized difference vegetation index (NDVI) to topographic effects: A case study in high-density cypress forest. Sensors 2007, 7, 2636–2651. [Google Scholar] [CrossRef] [PubMed]
  55. Camps-Valls, G.; Campos-Taberner, M.; Moreno-Martínez, L.; Walther, S.; Duveiller, G.; Cescatti, A.; Mahecha, M.D.; Muoz-Marí, J.; García-Haro, F.J.; Guanter, L. A unified vegetation index for quantifying the terrestrial biosphere. Sci. Adv. 2021, 7, eabc7447. [Google Scholar] [CrossRef]
  56. Kang, Y.; Guo, E.L.; Wang, Y.F.; Bao, Y.L.; Bao, Y.H.; Naren, M.D.L. Monitoring Vegetation Change and Its Potential Drivers in Inner Mongolia from 2000 to 2019. Remote Sens. 2021, 13, 3357. [Google Scholar] [CrossRef]
Figure 1. The distribution of elevation, NDVI, grassland vegetation types, and meteorological stations in Inner Mongolia.
Remotesensing 14 03977 g001
Figure 2. Variation trends of SDHI mean value for overall and each grassland type in Inner Mongolia from 1982 to 2020.
Remotesensing 14 03977 g002
Figure 3. Mutation analysis of SDHI in Inner Mongolia from 1982 to 2020.
Remotesensing 14 03977 g003
Figure 4. Spatial distribution of SDHI trends in Inner Mongolia from 1982 to 2020. (a) SDHI trend value, (b) multi-year average SDHI trend levels.
Remotesensing 14 03977 g004
Figure 5. Frequency ratios of SDHI in different grassland types in Inner Mongolia from 1982 to 2020.
Remotesensing 14 03977 g005
Figure 6. Variation trend of NDVI mean value of overall and each grassland type in Inner Mongolia from 1982 to 2020.
Remotesensing 14 03977 g006
Figure 7. Mutation analysis of NDVI in Inner Mongolia from 1982 to 2020.
Remotesensing 14 03977 g007
Figure 8. Spatial distribution of NDVI trends in Inner Mongolia from 1982 to 2020. (a) NDVI trend value, (b) multi-year average NDVI trend levels.
Remotesensing 14 03977 g008
Figure 9. Spatial distribution of partial correlations between SPI, STI, SDHI, and NDVI in Inner Mongolia from 1982 to 2020. (a) SPI correlation with NDVI, (b) STI correlation with NDVI, (c) SDHI correlation with NDVI.
Remotesensing 14 03977 g009
Figure 10. Box plot of the correlation between different vegetation types and SPI, STI, and SDHI in Inner Mongolia.
Remotesensing 14 03977 g010
Figure 11. Analysis of the relative importance of SPI, STI, and SDHI to NDVI in Inner Mongolia.
Remotesensing 14 03977 g011
Figure 12. Temporal trends of SPI and STI in Inner Mongolia from 1982 to 2020.
Remotesensing 14 03977 g012
Table 1. Source of dataset.
DatasetTime ScaleSpatial ScaleSource of Data
Climate dataset1982–2020Meteorological Information Center of the Inner Mongolia Meteorological Bureau
NDVI1982–20205 kmhttp://ltdr.nascom.nasa.gov (accessed on 10 January 2022)
Publisher’s Note: MDPI stays neutral with regard to jurisdictional claims in published maps and institutional affiliations.

