Abstract
This paper investigates the feasibility of using a linear current sensing (LCS) technique integrated on an unmanned aerial system (UAS) for detecting and mapping underground infrastructure rapidly and cost-effectively. The LCS technique is based on data from a wide band of electromagnetic induction frequencies (50 kHz to 2 MHz) using a vector magnetic field gradiometer. This technique takes advantage of a slowly decaying secondary magnetic field in order to achieve greater standoff detection distance ( vs. for compact metallic targets during EMI sensing, where R is the distance from a target to the sensor). These secondary magnetic fields are produced by the excite current on long conductors, allowing detection at a distance of 10 meters or more. The system operates between tens of kHz to a few MHz and uses either an active EMI source or existing EM fields to excite this linear current on a long metallic subsurface target. Once excited, these linear currents produce a secondary magnetic field that is detected with an above ground triaxial magnetic field gradiometer. By moving and tracking its geolocation, the system outputs rich datasets sufficient to support high-fidelity forward and inverse EMI models for estimating the depth and orientation of deep underground long linear metallic infrastructure. The system’s hardware and its integration to a UAS system are outlined, along with the formulation of LCS theory, and numerical and experimental data are presented. The results illustrate that the LCS technique offers large standoff detection, is adaptable to UAS, and could be used effectively for detecting deep underground infrastructure such as wires and pipes.
1. Introduction
By estimations, there are over 35 million miles of utility pipes in the US alone [1]. Many of these pipes date back to the 1800s and have deteriorated, creating both an environmental and human safety concern [2]. Unfortunately, reliable ground truth maps are frequently absent or incomplete for this old infrastructure. Over the past several decades, many sensing modalities, such ground penetrating radar (GPR), low-frequency electromagnetic fields, and hydro-vacuum excavation [3,4,5], have been developed, each with its own benefits and drawbacks. For example, on one hand, GPR allows for non-invasive above-ground sensing of subsurface metallic and non-metallic structure detection, but it is limited by the geological environment and short penetration distance [6,7]. On the other hand, although low-frequency electromagnetic sensors are relatively immune to the geological noise, their detection depth is limited due to the secondary magnetic fields sharp decay. To overcome these mentioned limitations, currently, several techniques that require direct access to the utility, such as clamp induction and direct connection, are used in practice. While these techniques require access to the utilities, hydro-vacuum excavation has become increasingly popular. Invasive excavation methods are widely considered an extremely accurate technique for identification. However, it is also one of the least economical, with the hydro-vacuum rental alone costing over USD 2000/day [5]. Thus, there is need for a fast, cost-effective, non-invasive sensing technology that does not require direct access to utilities for detecting and mapping aging underground infrastructures.
Much of the technology discussed in this paper has been studied previously. The problem has been looked at theoretically, and, for a handheld sensor, has been shown to work experimentally through different approaches [2,8,9,10,11,12,13,14,15]. Most recently, in [2] a new, handheld, triaxial, magnetic field gradiometer was introduced. However, in this paper, we assess the feasibility and applicability of using a drone-based LCS to detect, locate, and map underground metallic utilities, such as thin wires and pipes. In this paper, the system’s hardware and its integration to a UAS system are outlined and supplemented with the formulation of LCS theory and numerical and experimental data, as well as forward and inverse EMI models used for estimating the depth and orientation of targets.
Our lightweight LCS system, with large standoff detection capabilities, is an ideal candidate to combine with a UAS for detecting and locating underground infrastructures. The LCS operates in the frequency range of 50 kHz–2 MHz, and uses an active transmitter current loop, i.e., a magnetic dipole, and/or signal of opportunity within our frequency of interest (such as AM radio stations) to produce a primary electric field parallel to the target’s main axis. As a result, the primary electric field excites a linear current on a target. This sensing technique has been proposed theoretically in [14] and showed that a small active transmitter current loops provide enough primary electric field for long linear conductors depth to 8 m [2]. There are many advantages to mounting the LCS gradiometer sensor to a UAS, such as reducing the time, cost, and effort needed to collect high-fidelity data over large areas compared to operating the system in a hand-carried mode; operating over challenging conditions such as topographic elevation changes, crevasses, and unstable, bumpy, or rocky terrain.
In the past, our group has demonstrated the ability to successfully develop lightweight EMI sensors capable of successfully detecting multiple targets while utilized on a UAS [16], most notably, a sensor that is used for detection and classification of unexploded ordnances (UXO) and a second sensor that was developed for sensing soil conductivity. Both of these systems are shown mid-flight in Figure 1.
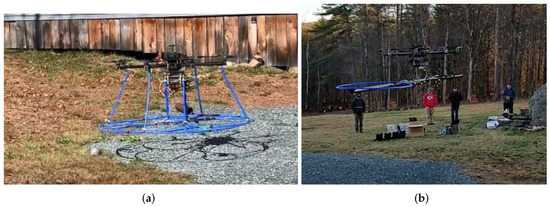
Figure 1.
Previous UAS-mounted remote sensing systems. (a) UXO detection system. (b) Soil conductivity detection system.
Originally, the LCS triaxial magnetic field gradiometer was designed, built, and tested for improving subsurface wire(s) detection and localization, as well as for estimating its depth and orientation. The gradiometer consists of a pair of triaxial sensors (that are three 15 cm diameter coils oriented along x, y, and z axes) placed 1.68 m apart along the y axis—see Figure 2. The setup can measure the Cartesian magnetic field components (). Together, the two sets of triaxial receivers measure the vector magnetic field gradients in the x, y, and z directions. The data are acquired using an eight-channel 4000 series picoscope at 10 MSps. Due to its lightweight and superior standoff detection depth, the system was adapted to a UAS. The sensor is mounted to the Harris Aerial HX8, which is an octorotor configuration UAS with a primarily carbon fiber and aluminum frame with a payload capacity of approximately 8 kg (17.6 lbs). The HX8 can be seen in Figure 3.
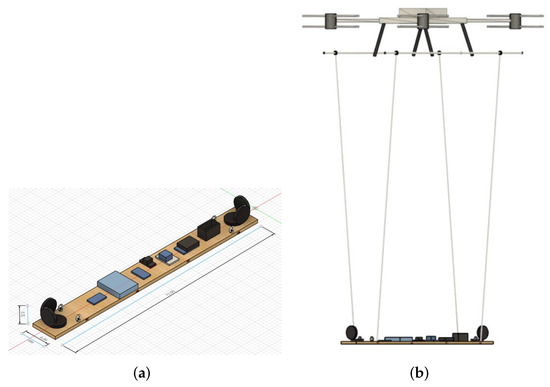
Figure 2.
UAS 3D rendering. (a) Gradiometer sensor. (b) Sensor mounted to UAS.

Figure 3.
UAS platform. (a) Harris Aerial HX8. (b) HX8 dimensions.
In the current configuration, all electronics are mounted on a single wooden board. A 3D rendering of the sensor with suspension hooks and dimensions measurements is shown in Figure 2. The sensor weight is approximately 14 lbs, which is well within the aircraft’s payload maximum. The electromagnetic signals due to the UAS motors and high currents are mitigated by separating a distance between the UAS and the sensor, as suggested in [17]. Namely, to eliminate noise the sensor is suspended beneath the UAS using tethers of 12 feet. The four individual tethers are used to minimize pendulum swinging effects. Custom-made crossbeams are fixed to the landing gear of the UAS. The crossbeams provide tether points between the sensor platform and UAS. The sensor is powered by its own six-cell lithium polymer battery, producing a nominal 24 V. The battery provides an approximate run time of 30 min. A 3D-rendered model of the LCS triaxial gradiometer sensor mounted on the UAS mounted is shown on Figure 2.
As discussed above, there are many advantages to mounting subsurface sensors onto a UAS. However, there are several drawbacks to be considered as well. The most obvious drawback is operating the system in an environment not well suited for flying, such as a heavily urbanized or wooded area. A hand-carried or an unmanned ground vehicle mounted sensor might be more appropriate for such an environment. A secondary drawback of a UAS-mounted sensor is the standoff distance. With a UAS there are serious limitations and considerations that must be accounted for when determining how close the sensor will be to the ground. These considerations often require the sensor to maintain a larger standoff distance from the ground than a system that is hand-carried or mounted to an unmanned ground vehicle.
Determining the standoff required by the UAS for safe maneuvering is difficult to pinpoint. Moving while maintaining a low altitude becomes complicated, especially when the surface elevation changes or there are obstructions such as rocks. In order to study this, we built a mock platform of our sensor made entirely of plywood and foam. The platform was used to test the drone’s ability to hover at low altitudes as the weight of the payload changed. Testing was completed with just the mock platform at 10 lbs, then an additional 2.5 lbs, and finally an additional 5 lbs. The testing is shown in Figure 4 and incorporated both maneuverability and low-altitude hovering. Based on this testing, we speculate that for ideal conditions (flat terrain), we should be able to fly around while maintaining a standoff of approximately 1.5 m. However, as a survey site becomes increasingly more complex, the more conservative our standoff distance will need to be.
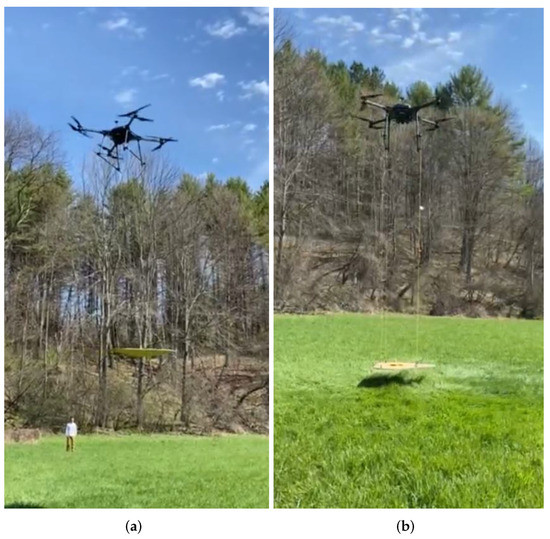
Figure 4.
Mock platform maneuverability testing. (a) Large standoff. (b) Minimal standoff.
2. Electromagnetic Induction Sensing Modalities
2.1. Low Frequency EMI Sensing
Low-frequency, 10 s of Hz to 10 s of kHz, electromagnetic induction has long been a cornerstone for subsurface conducting anomalies detection and classification. Recently developed advanced EMI sensing systems contain multi-transmitters and receivers coils. During EMI sensing, the transmitter coil produces a primary EM field, which penetrates inside a metallic target and induces volume/surface currents within it. In return, the induced currents produce secondary fields inside and outside the targets. The tangential components of the total inner and outer electromagnetic fields satisfy continuity conditions at the target’s boundary, as per [18,19],
where is the unit vector normal to the surface of the target, , , and , are total electric and magnetic fields outside and inside the target.
At low frequencies, the induced volume currents form closed loops such that:
In the low-frequency EMI sensing regime, the secondary magnetic field can be approximated as a field produced by a magnetic dipole:
where = observation point, = location of dipole along wire, , and the induced magnetic dipole moment that is proportional to the primary magnetic field. Similarly, the primary magnetic field from a radius loop transmitter I current can also be approximated as the field produced by for the magnetic when the distance from the current to the observation point is more than 2a. As a result, the secondary magnetic field produced by the target is proportional to . This rapid decay limits the depth of reliable detection for low-frequency induction systems [18] and limits their use on the UAS.
2.2. EMI at Middle Frequencies
At intermediate frequencies, 10 s of kHz to 100 s of kHz, the EM fields decay rapidly inside high-conducting and permeable metallic targets [20]. The inner and outer fields are coupled using the surface impedance boundary conditions:
where the surface impedance is a function of skin depth , circular frequency , and permeability :
2.3. High-Frequency EMI Sensing
At high frequencies, 100 s of kHz to 10 s of MHz, the total electromagnetic fields vanish inside the high conducting and permeable targets. As a result, the boundary conditions are reduced to the continuity conditions for tangential component of the outer total electric field, as:
The boundary conditions at low frequencies (see Equations (1) and (2)) as well as intermediate (5) and high frequencies (7), are solved using a combination of the method of auxiliary sources (MAS) and the method of moments (MOM) [21,22,23].
The electric field, produced by a loop transmitter current, increases linearly with frequency. Subsequently, the electric force, which exerts on charges, is significantly stronger than the magnetic field force. This leads to a distribution of electric charges on the surface of the conductor. The surface charge density is proportional to the normal component of the electric field:
The charge density produces is related to linear surface current density via the continuity equation, as:
The magnetic field created by the surface linear current density :
In Equation (10), is the excited linear current which is proportional to the electric field due to transmitter current loop, i.e., it is proportional to . Thus, the total secondary magnetic field produced by the inducted surface linear current is proportional to . This decay provides much deeper detection depth when compared to low-frequency induction systems [24].
We used the method of moments to illustrate excited charge and current density along a buried 100 m wire. The wire is excited by an above-ground TX coil. The charge and current densities are depicted in Figure 5a,b, respectively.
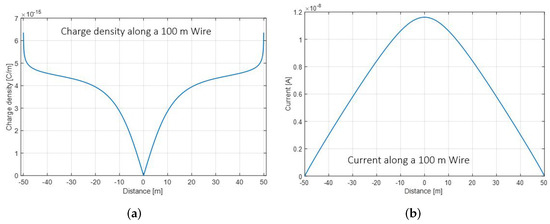
Figure 5.
Method of moments model of a buried 100 m wire excited by an above-ground TX coil. (a) Charge density along wire. (b) Current along wire.
Overall, the underground infrastructure detection and mapping can be divided into three (Figure 6) main steps: (1) collect data using the LCS system. (2) Process the measured data by applying forward and inverse EMI models. Forward—where the location, orientation, burial depth, and size of the target and electromagnetic parameters of the soil are all known. Inverse—the measured field from a buried infrastructure is fitted to the model and models parameters are extracted [13]. (3) The extracted parameters are used to map underground targets.
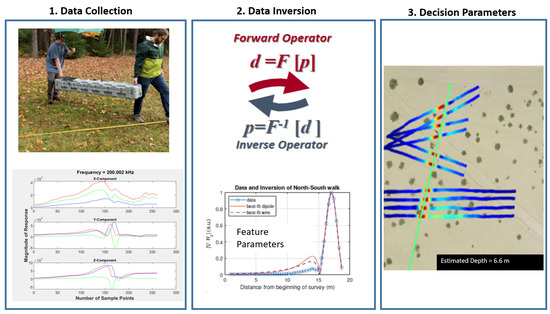
Figure 6.
Graphical representation of solving an inversion EM problem.
3. Materials and Methods
3.1. Linear Current Sensing
The LCS system uses a linear current on the target, such as a pipe, for detecting long, thin, subsurface metallic utilities. The linear current is excited with a primary electric field that is generated with an active above-ground source that is either a field portable vertical magnetic dipole or existing EM, such as an AM radio station. In brief, during this non-invasive sensing technique, the primary EM field penetrates inside the soil; it induces eddy current in the soil, impinges the target, and excites a linear current on it. In return, the linear current on the target and eddy currents in the soil produce secondary magnetic fields that are detected with an above-ground sensor [25]. The total received signal is:
A schematic diagram of the problem is summarized in Figure 7. A buried cable is illuminated with the electric field from an above-ground vertical magnetic dipole. A secondary magnetic field is produced by the wire and the soil. The gradiometer senses both secondary fields, along with the primary field.
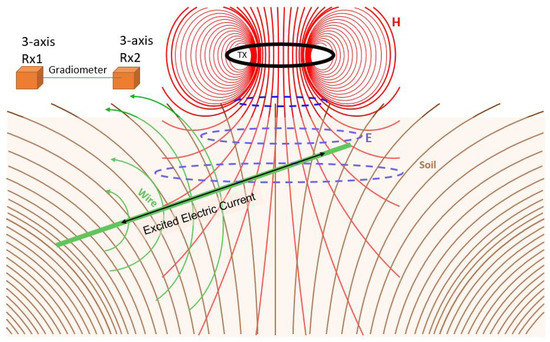
Figure 7.
Theoretical geometry of a buried wire.
Note that the primary field from the transmitter and the response from the soil are both unwanted signals. In order to reduce these signals, our system consists of two sets of triaxial receivers. One set is at the front of our system and the other set is at the back (Figure 7). When the gradiometer is sufficiently far away from the transmitter, the primary field is relatively uniform between the two sets of receivers. By subtracting signals between the two sets of receivers from each other, the primary, as well as secondary, signals for soil are greatly reduced. As a result, the measured gradiometer signals are almost entirely due to the target of interest [8,15]. This can be seen mathematically as:
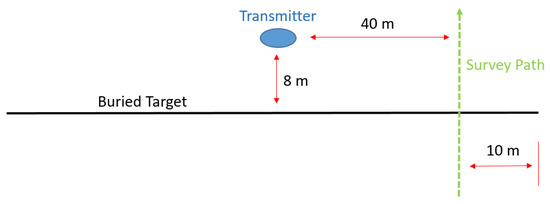
In addition, the triaxial gradiometer configuration minimizes any spatially distributed uniform environmental noise [13]. To illustrate applicability of triaxial gradiometer configuration for detection of deep linear conductors, we carry out numerical modeling for 100 m wire. Figure 8 shows calculated secondary magnetic fields at one receiver for different burial depths. Figure 9 illustrates received signal from the gradiometer configuration. The geometry for all of these simulations uses a survey path 10 m from the end of target, approximately 40 m from the transmitter, with a thin (wire) target at 8 m depth. This is shown graphically in Figure 10. By comparing signals between these two configurations, one could see that the primary field is greatly reduced for the gradiometer configuration [13].
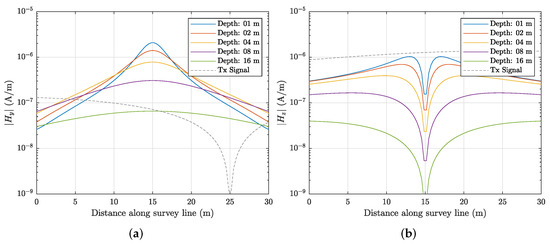
Figure 8.
Model of a single receiver signal as a function of depth. (a) response. (b) response.
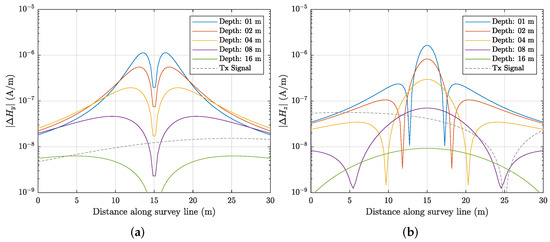
Figure 9.
Model of the gradient (difference) signal as a function of depth. (a) response. (b) response.
These numerical results were validated quantitatively with experimental data. A schematic diagram of data collection using the three-axis (triaxial) gradiometer is shown in Figure 11. The data were collected above a known buried pipe, by carrying a three-axis magnetic field gradiometer (sensor) above the ground along a survey path that crosses the subsurface pipe. Although each triaxial receiver sensor measures the flux of the total magnetic fields, i.e., the primary field and secondary fields from target and soil, the measured gradiometer signals clearly are related to secondary fields from the target.
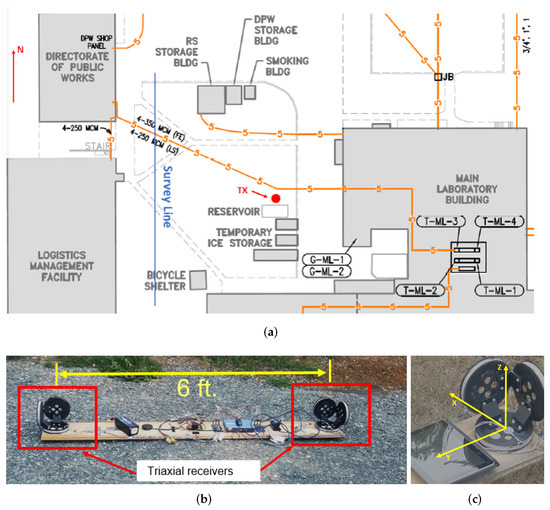
Figure 11.
A theoretical survey walk and our built triaxial gradiometer sensor. (a) Theoretical survey walk. (b) Gradiometer sensor. (c) Triaxial receiver.
3.2. Triaxial Gradiometer for LCS
The triaxial gradiometer for LCS consists of two sets of triaxial receivers for a total of six receiver coils. Each set of triaxial receivers measures the magnetic field in the x, y, and z directions. The triaxial receivers are fed into a two-stage amplifier before being read in by an analog-to-digital converter digitized at 10 MSps. The samples are converted to their in-phase and quadrature components, multiplied, and integrated against multiple frequencies of interest simultaneously. The received signals are displayed in real time. The system uses active transmitter Tx current loops and/or signals of opportunity to illuminate subsurface targets. The transmitter currents are generated simultaneously in three coils using FPGA boards. Each coil is tuned with bank capacitors and operates at specific frequencies (66.7 kHz, 158 kHz, and 258 kHz). The three separate coils are overlapped such that the inductive coupling between them is minimal. The signals of opportunity, such as AM radio stations, are selected through an algorithm that we developed and incorporated into the user interface GUI. The algorithm uses both sets of triaxial receivers to survey the EM spectrum for a given amount of time. The algorithm uses a weighted average to consider multiple variables such as frequency, signal strength, geometric layout, power output, and distance (AM radio stations). From this weighted average, signals that are likely to give decisive results are automatically selected. Results from all signals chosen are processed simultaneously and are available to the user in real time. A block diagram of the HFEMI gradiometer sensing system and a photograph of the simultaneous vertical magnetic dipole transmitter are provided in Figure 12.
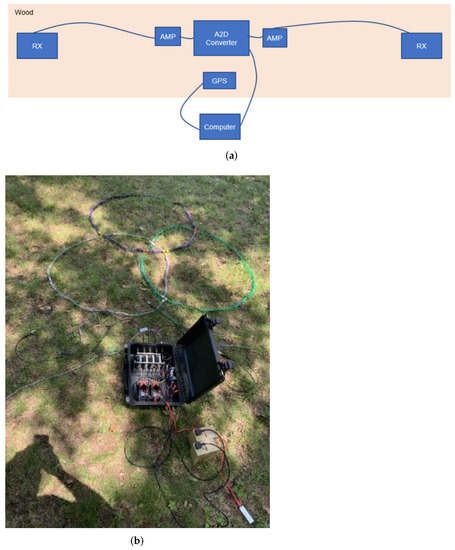
Figure 12.
Sensor and dipole transmitter. (a) Block diagram of gradiometer sensor. (b) Simultaneous vertical magnetic dipole transmitter.
4. Results
This section shows experimental and numerical data of the LCS for different linear conductors placed under different environmental conditions. It was proven to be able to reliably detect and invert for key parameters for these scenarios. Our first data collection, shown in Figure 13, was over the top of an environment that had both concrete and grass. The gradiometer sensor was hand-carried over a pair of buried power cables multiple times. An active transmitter current loop, operating at 200 kHz, was used to excite the targets. Figure 13a shows a heat map of the detection data collected as a function of the system’s GPS movements. With red correlating to a large increase in signal, a target is detected for each survey line. Although the system allows to estimate the target’s orientation by collecting data along multiple lines, collecting each additional survey line data increases time, effort, cost, and potential safety concerns, which, in return, makes the system impractical. Figure 13b shows a plot of the magnitude data for all six receivers, that is, one triaxial receiver, set one, with components (shown in red) and a second triaxial receiver, set two, with components (shown in blue). The green line plots the magnitude of the front RX subtracted by the magnitude of the back RX.
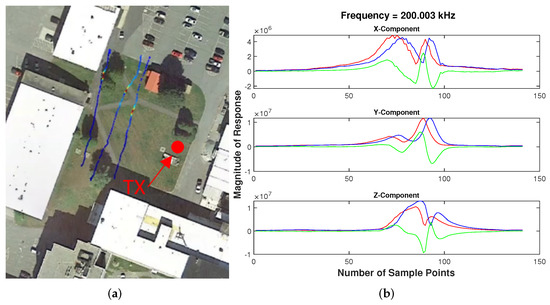
Figure 13.
Live time detection map and component plotting with target for a mixed grass and concrete environment. (a) Detection map—heat map where red correlates to a large increase in signal. (b) Survey—red and blue lines plot the response from the front and back gradiometer receivers, respectively. The green line plots the magnitude of the front RX subtracted by the magnitude of the back RX.
Shown in Figure 14 is our second data collection. This location was over the top of a wet grassy environment. Multiple thin 18 AWG wires were laid out parallel to each other approximately 2 m apart. Each wire was a different length. The simultaneous transmitter current loops from Figure 12b were used to excite the targets. Once again, the gradiometer sensor was hand-carried multiple times over the wires by two users. As can be seen from Figure 14b, the survey line crossed the wires at different angles. In order to take advantage of the live time data acquisition, a display was mounted on top of the system.
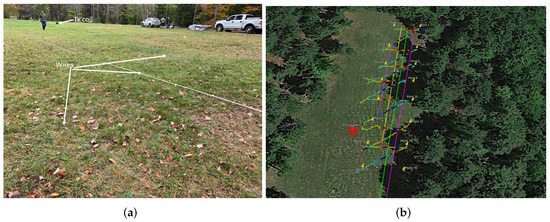
Figure 14.
Wet grassy environment testing. (a) Location of targets and TX. (b) Detection map—purple, yellow, and green lines show the approximate layout of the targets. Heat map response shows survey lines, where red correlates to a large increase in signal.
Our third data collection site was completed over the top of a concrete environment. Figure 15a shows an overhead view of the survey sight. For this figure, the blue line shows the survey line in which the sensor was carried. The red dot shows the approximate location of the 200 kHz TX coil. During this data collection, the gradiometer sensor was carried over a utility pipe that was buried in concrete. Similar to the system shown in Figure 12b, a single-coil field-portable magnetic dipole operating at 200 kHz was able to excite the target. Furthermore, in addition to the vertical magnetic dipole (transmitter current loop), the target was excited by existing EM fields. In this instance, two AM radio stations operated at 1390 kHz and 1270 kHz. The detection for both AM radio stations were extremely similar. Results for 1390 kHz are shown in Figure 15b. For this figure, red and blue lines show the response from the front and back RX, respectively. The green line plots the magnitude of the front RX subtracted by the magnitude of the back RX. Results for all three Cartesian coordinates are shown, with a clear detection of a utility pipe seen. Both AM radio towers were located within a radius of the target of approximately 10–12 miles. These EM fields were selected through the same algorithm that was discussed earlier in Section 3.2. It should be noted that the results plotted in Figure 15b do appear to be more noisy than results obtained via the active TX coil. However, a clear detection of a utility pipe can still be seen, and data were shown to be consistent with the active TX coil.
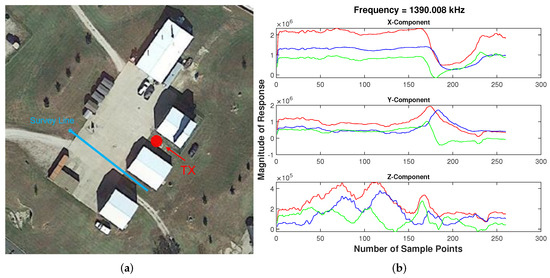
Figure 15.
Concrete environment testing. (a) Overhead view of survey site. (b) Results from existing EM field—red and blue lines plot the response from the front and back gradiometer receivers, respectively. The green line plots the magnitude of the front RX subtracted by the magnitude of the back RX.
The fourth collection site was a dry, grass-free environment. The gradiometer system was carried over two buried wires that were spaced several meters apart. Once again, the simultaneous vertical magnetic dipole transmitter, shown in Figure 12b, was used to excite the targets. Figure 16a shows an overhead view of the fourth survey site. In this figure, the real-time detection heat map shows the survey line where the sensor was carried. The data were inverted using single and multi-wire inversion algorithms described in [2]. Inverted estimated crossing angle of the buried wire using a single wire inversion code is shown with a green line in Figure 16a. Inverted estimated depth of the buried wire was 3 m and this is shown at the top of the photograph. Both the crossing angle and depth inversions were found to be consistent with known ground truth. Data for the three frequencies transmitted by our vertical magnetic dipole were collected during a single survey line. Detection plots for the three frequencies, 66.7 kHz, 158 kHz, and 258 kHz, look extremely similar. Results for 258 kHz are shown in Figure 16b. Results for all three Cartesian coordinates are shown with a clear detection of the target seen. Red and blue lines plot the response from the front and back RX, respectively. The green line plots the magnitude of the front RX subtracted by the magnitude of the back RX. For each frequency, the data were used to invert for an estimated depth and crossing angle. Both of these parameters were found to be consistent with known ground truth.
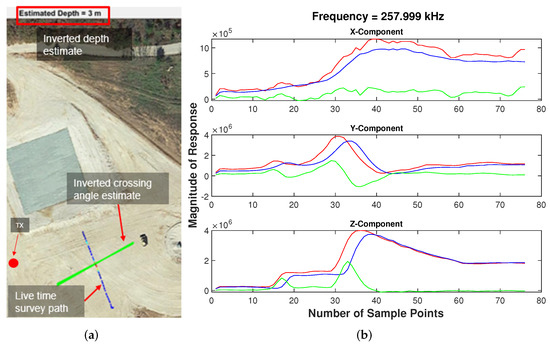
Figure 16.
Dry, grass-free environment testing. (a) Overhead view of survey site. (b) Results from vertical magnetic dipole TX—red and blue lines plot the response from the front and back gradiometer receivers, respectively. The green line plots the magnitude of the front RX subtracted by the magnitude of the back RX.
Testing was also completed in order to quantify how well the inversion was able to handle crossing a target at different angles. An extension cord was buried approximately 6–8 m deep. The gradiometer sensor was carried over the same target at multiple angles. That is, the survey line taken changed but the location of the target did not. The detection, inverted orientation, and inverted depth are shown in Figure 17 at both 45 and 80. By comparing the two figures, it can be seen that both survey lines produced similar inversion depth estimates and inversion orientation estimates. Both of these inversion estimates are within 10 of each other. Results were found to be consistent with known ground truth, which is approximately the average of the two inversion results.
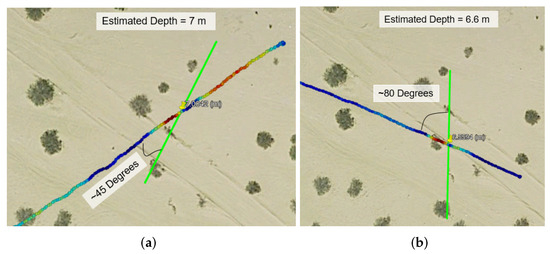
Figure 17.
Inversion testing for multiple survey line crossing angles. (a) Survey line 45 to the target. (b) Survey line 80 to the target.
The triaxial LCS gradiometer sensor was tested extensively in hand-carry modes. The results demonstrated feasibility of the LCS for detection and mapping deep targets without direct access to the target. The LCS data processing algorithms are able to invert key parameters such as depth and orientation targets. In order to further validate applicability of the system on UAS as a first step, the gradiometer sensor was mounted on a zip line and it conducted data collection. The zip line requires no human interaction to operate as intended. Photographs of the gradiometer sensor attached to a constructed zip line are shown in Figure 18. The placement and setup of the vertical magnetic dipole transmitter system are shown in the foreground of Figure 18b with the zip line in the background. The gradiometer system is attached to the zip line in this figure.
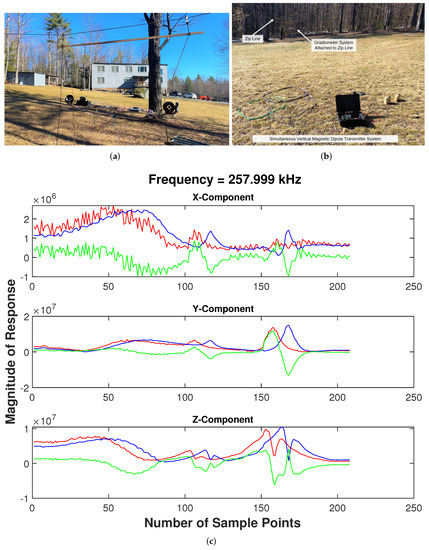
Figure 18.
Zip line testing. (a) Gradiometer sensor attached to a constructed zip line. (b) Transmitter system with gradiometer sensor attached to the zip line in the background. (c) Results from vertical magnetic dipole TX Survey—red and blue lines plot the response from the front and back gradiometer receivers, respectively. The green line plots the magnitude of the front RX subtracted by the magnitude of the back RX.
Representative data are shown in Figure 18c. Data for the three frequencies transmitted by our vertical magnetic dipole system were collected during a single survey line. Detection plots for the three frequencies, 66.7 kHz, 158 kHz, and 258 kHz, look extremely similar. Therefore, only results for 258 kHz are shown in Figure 18c. For this figure, red and blue lines show the response from the front and back RX, respectively. The green line plots the magnitude of the front RX subtracted by the magnitude of the back RX. Results for all three Cartesian coordinates are shown. These data show three distinct rises above the noise. The rise farthest to the right is an electrical power line buried in the soil. The rise seen in the middle of the data is a 230 ft extension cord lying on the ground.
5. Discussion
Preliminary studies demonstrated that the LCS can detect and map deeply buried underground infrastructures, and the system is adaptable to UAS. There are many advantages to mounting the system onto a drone as opposed to hand-carrying it. First, by adapting our sensor to be deployed via UAS, the time and effort needed to collect data over large areas is significantly lower than what is required for a hand-carried system. Second, the UAS-based system will reduce time, effort, and cost associated with data collection over large areas. Third, operating the hand-carried system over challenging terrain is difficult, and in some extreme situations, impossible. A UAS-deployed system allows traversing these areas to be not only possible, but significantly safer as well. Any safety concerns that would be associated with the rough terrain would pose virtually no threat to a UAS-mounted system. However, one potential factor that could limit the UAS-based LCS operation could be the standoff distance of the sensor.
Therefore, to better understand the impact that increased standoff distances have, modeled EM signals from a buried wire using the thin-wire MOM numerical model code were studied [24]. For analysis, we introduced the signal-to-transmitter ratio (STR), which is a similar metric to signal-to-noise ratio (SNR). As discussed in Section 3 and shown in Figure 7, the total measured signal is a sum of the primary field (transmitter), secondary field (target), and soil. For LCS application, our goal is to maximize the secondary field from the target and to minimize contribution from the primary field and response from soil.
We define the to be a ratio of signal power such that [13]:
where the signal measured from the secondary field (target) and the signal measured from the primary field (transmitter).
It might be assumed that STR can be changed by altering the gain of the transmitter or receiver coils. However, since the magnitude of the response from the secondary field (target) is proportional to the magnitude of the primary field (transmitter), this is an incorrect assumption. Therefore, although it is easy to change the gain of either the transmitter or receiver coils, the STR will remain the same and is dependent on other properties [13]. These properties include the geometric layout, such as target length, depth, and orientation, as well as excitation frequency, transmitter location, and soil conductivity.
The numerical calculations were performed for a target of 1 m deep, 100 m in length, an excitation frequency of 100 kHz, a soil conductivity of 1 mS/m, and a transmitter standoff of 10 m in both the x and y directions, with a survey line that is perpendicular to the target. This geometry is extremely close to what is shown in Figure 10. However, in this scenario, the target is buried 1 m deep as opposed to 8 m. Additionally, the distance in the z- between the survey path and buried target is varying. Figure 19 and Figure 20 plot the STR results of the and component as a function of sensor standoff distance. Figure 19 is the absolute signal, whereas Figure 20 is the gradiometer (difference) signal. The standoff distances range from 1 m to 8 m. The standoff distance refers to the height at which the sensor is above the ground. On the other hand, the depth of the target below the soil does not change and remains fixed at 1 m. The STR value that is needed such that a target can be detected is discussed in [13]. The analysis concludes that although the concept should be examined in more detail, it is reasonable to believe that an STR around 10 dB will equate to feasible detection of a target and 20 dB equates to very easy detection of a target. From Figure 20 we can see that our largest STR occurs for the component. A sufficiently large area of this STR signal occurs above 20 dB for three of the four standoff distances modeled. Standoff distances of 1 m, 2 m, and 4 m all fit this criteria. An 8 m standoff does not fit this criteria, although the signal level is well within the 10–20 dB range.
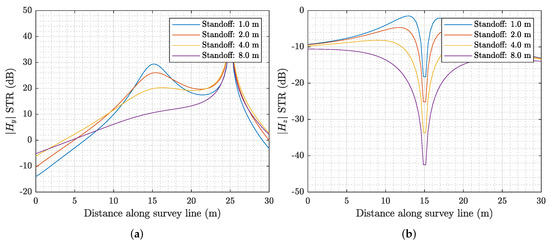
Figure 19.
Absolute STR signal as a function of standoff distance. (a) . (b) .
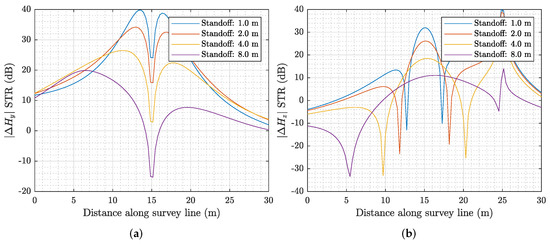
Figure 20.
Gradiometer (difference) STR signal as a function of standoff distance. (a) . (b) .
6. Conclusions
In this paper, we investigated the feasibility of using a linear current sensing (LCS) technique integrated on an unmanned aerial system (UAS) for detecting and mapping underground infrastructures fast and cost-effectively. The theoretical bases of EMI sensing modalities along with supporting data are presented. A surrogate LCS platform was built and attached to the drone. The system was tested to assess the drone’s ability to hover at low altitudes at different payload weight. The studies demonstrated that the drone can carry and hover the LCS at low altitude, and can provide high-fidelity data to fully characterize subsurface infrastructure.
The numerical studies were performed for a long buried wire. The gradients of the total magnetic fields were analyzed for different standoff distances. These numerical results, along with the carried drone’s maneuverability testing, illustrate the feasibility of using an LCS technique integrated on UAS for detecting and mapping underground infrastructures fast and cost-effectively.
There are many advantages to mounting the LCS gradiometer sensor to a UAS, such as reducing the time and effort needed to collect high-fidelity data over large areas compared to operating the system in a hand carried mode; operating over challenging conditions such as topographic elevation changes, crevasses, and unstable, bumpy, or rocky terrain. In order to fully uncover the pros and cons of the LCS gradiometer sensor mounted on a UAS, in the future work, we will collect and analyze actual LCS data over buried infrastructure at different elevations and different flight speeds.
Author Contributions
Authors listed are limited to those who contributed substantially to the work. Author specifications are as follows: Conceptualization, B.E.B., L.J.P. and F.S.; software, C.A.H., S.D.I., B.E.B. and F.S.; formal analysis, C.A.H., S.D.I., B.E.B. and F.S.; investigation, C.A.H., S.D.I., L.J.P. and D.L.; data curation, B.E.B. and L.J.P.; writing—original draft preparation, C.A.H.; writing—review and editing, S.D.I., B.E.B., L.J.P., D.L. and F.S.; supervision, B.E.B., L.J.P. and F.S. All authors have read and agreed to the published version of the manuscript.
Funding
This research was funded by the DoE under ARPA-E REPAIR program DE—AR0001334.
Data Availability Statement
Restrictions apply to the availability of these data. Please contact corresponding author (C.A.H.) with request.
Conflicts of Interest
The authors declare no conflict of interest. The funders had no role in the design of the study; in the collection, analyses, or interpretation of data; in the writing of the manuscript, or in the decision to publish the results.
Abbreviations
The following abbreviations are used in this manuscript:
| AH | Amp hours |
| AM | Amplitude modulation |
| ASCE | American Society of Civil Engineers |
| AWG | American wire gauge |
| DOAJ | Directory of open access journals |
| EM | Electromagnetic |
| GPR | Ground penetrating radar |
| GPS | Global Positioning System |
| GUI | Graphical user interface |
| Magnetic field produced by the target | |
| Magnetic field produced by the transmitter | |
| HFEMI | High-frequency electromagnetic induction |
| LLCS | Long linear current sensing |
| MAS | Method of auxiliary sources |
| MDPI | Multidisciplinary Digital Publishing Institute |
| MOM | Method of moments |
| SNR | Signal-to-noise ratio |
| STR | Signal-to-transmitter ratio |
| TX | Transmitter |
| UAS | Unmanned aerial vehicle |
| UXO | Unexploded ordnance |
References
- Anspach, J. ASCE Utility Standards. 2015. Available online: https://www.slideshare.net/asceoc/asce-utility-standards (accessed on 17 May 2022).
- Shubitidze, F.; Barrows, B.E.; Shubitidze, T.; Perren, L.J. Linear currents sensing for detecting and locating underground. structures. IEEE Trans. Geosci. Remote Sens. 2022, 60, 2005115. [Google Scholar] [CrossRef]
- Muggleton, J.; Papandreou, B. A shear wave ground surface vibration technique for the detection of buried pipes. J. Appl. Geophys. 2014, 106, 164–172. [Google Scholar] [CrossRef]
- Metje, N.; Atkins, P.; Brennan, M.; Chapman, D.; Lim, H.; Machell, J.; Muggleton, J.; Pennock, S.; Ratcliffe, J.; Redfern, M.; et al. Mapping the underworld–state-of-the-art review. Tunn. Undergr. Space Technol. 2007, 22, 568–586. [Google Scholar] [CrossRef]
- Hensley, K.; Bosscher, V.; Triantafyllidou, S.; Lytle, D.A. Lead service line identification: A review of strategies and approaches. AWWA Water Sci. 2021, 3, e1226. [Google Scholar] [CrossRef]
- Mertens, L.; Persico, R.; Matera, L.; Lambot, S. Automated detection of reflection hyperbolas in complex GPR images with no a priori knowledge on the medium. IEEE Trans. Geosci. Remote Sens. 2015, 54, 580–596. [Google Scholar] [CrossRef]
- Chen, H.; Cohn, A.G. Probabilistic conic mixture model and its applications to mining spatial ground penetrating radar data. In Proceedings of the SIAM Conference on Data Mining (SDM10), Columbus, OH, USA, 29 April–1 May 2010; Citeseer: Pennsylvania, PA, USA, 2010. [Google Scholar]
- McKenna, S.P.; Parkman, K.B.; Perren, L.J.; McKenna, J.R. Response of an electromagnetic gradiometer to a subsurface wire. IEEE Trans. Geosci. Remote Sens. 2011, 49, 4944–4953. [Google Scholar] [CrossRef]
- McKenna, S.P.; Parkman, K.B.; Perren, L.J.; McKenna, J.R. Automatic detection of a subsurface wire using an electromagnetic gradiometer. IEEE Trans. Geosci. Remote Sens. 2012, 51, 132–139. [Google Scholar] [CrossRef]
- Stolarczyk, L.G.; Troublefield, R.; Battis, J. Detection of underground tunnels with a synchronized electromagnetic wave gradiometer. In Proceedings of the Sensors, and Command, Control, Communications, and Intelligence (C3I) Technologies for Homeland Security and Homeland Defense IV, SPIE, Orlando, FL, USA, 28 March 2005; Volume 5778, pp. 994–1001. [Google Scholar]
- Mahrer, K.D.; List, D.F. Radio frequency electromagnetic tunnel detection and delineation at the Otay Mesa site. Geophysics 1995, 60, 413–422. [Google Scholar] [CrossRef]
- Cress, D.H.; Battel, L. Sensing of gradient electromagnetic fields from subsurface conducting targets. In Proceedings of the IGARSS’96 1996 International Geoscience and Remote Sensing Symposium IEEE, Lincoln, NE, USA, 31 May 1996; Volume 4, pp. 1935–1937. [Google Scholar]
- Isaacson, S. High-Frequency Electromagnetic Induction Sensing for Buried Utility Detection and Mapping. Master’s Thesis, Dartmouth College, Hanover, NH, USA, 2022. [Google Scholar]
- Hill, D.A. Gradiometer antennas for detection of long subsurface conductors. J. Electromagn. Waves Appl. 1994, 8, 237–248. [Google Scholar] [CrossRef]
- Bartel, L.; Cress, D.; Stolarczyk, L. Evaluation of the electromagnetic gradiometer concept for detection of underground structures—Theory and application. J. Environ. Eng. Geophys. 1997, 2, 127–136. [Google Scholar] [CrossRef]
- Reynolds, R.; Barrowes, B.E.; Shubitidze, T.; Hartshorn, C.; Quinn, B.; Shubitidze, F. Electromagnetic induction sensing of unexploded ordnance and soil properties from unmanned aerial systems. In Proceedings of the Detection and Sensing of Mines, Explosive Objects, and Obscured Targets XXVI, Florida, FL, USA, 12–17 April 2021; Isaacs, J.C., Bishop, S.S., Eds.; SPIE: Bellingham, WA USA, 2021; p. 1. [Google Scholar] [CrossRef]
- Barrowes, B.; Glaser, D.R.; Quinn, B.; Prishvin, M.; O’Neill, K.; Shubitidze, F. UAS noise in standoff EMI measurements. In Proceedings of the Detection and Sensing of Mines, Explosive Objects, and Obscured Targets XXIII, Symposium on the Application of Geophysics to Engineering and Environmental Problems, Portland, OR, USA, 17–21 March 2019; Volume 012019, pp. 101–105. [Google Scholar]
- O’Neill, K. Discrimination of Subsurface Unexploded Ordnance; Number Volume TT102 in Tutorial Texts in Optical Engineering; SPIE: Bellingham, WA, USA; OCLC: Dublin, OH, USA, 2016; p. ocn930295883. [Google Scholar]
- Barrowes, B.; Prishvin, M.; Jutras, G.; Shubitidze, F. High-Frequency electromagnetic induction (HFEMI) sensor results from IED constituent parts. Remote Sens. 2019, 11, 2355. [Google Scholar] [CrossRef]
- Sun, K.; O’Neill, K.; Shubitidze, F.; Haider, S.A.; Paulsen, K.D. Simulation of electromagnetic induction scattering from targets with negligible to moderate penetration by primary fields. IEEE Trans. Geosci. Remote Sens. 2002, 40, 910–927. [Google Scholar] [CrossRef]
- Shubitidze, F.; O’Neill, K.; Shamatava, I.; Sun, K.; Paulsen, K.D. Fast and accurate calculation of physically complete EMI response by a heterogeneous metallic object. IEEE Trans. Geosci. Remote Sens. 2005, 43, 1736–1750. [Google Scholar] [CrossRef]
- Shubitidze, F.; O’Neill, K.; Haider, S.A.; Sun, K.; Paulsen, K.D. Application of the method of auxiliary sources to the wide-band electromagnetic induction problem. IEEE Trans. Geosci. Remote. Sens. 2002, 40, 928–942. [Google Scholar] [CrossRef]
- Barrowes, B.; Glaser, D.R.; Prishvin, M.; O’Neill, K.; Shubitidze, F. Short and long wire detection using high-frequency electromagnetic induction techniques. In Proceedings of the Detection and Sensing of Mines, Explosive Objects, and Obscured Targets XXIII, International Society for Optics and Photonics, Orlando, FL, USA, 15–19 April 2018; Volume 10628, p. 106280K. [Google Scholar]
- Gibson, W.C. The Method of Moments in Electromagnetics; Chapman and Hall: Boca Raton, FL, USA; CRC Press: Boca Raton, FL, USA, 2021. [Google Scholar]
- Ward, S.H.; Hohmann, G.W. Electromagnetic theory for geophysical applications. In Electromagnetic Methods in Applied Geophysics; Society of Exploration Geophysicists: Huston, TX, USA, 1988; Volume 1, pp. 130–311. [Google Scholar]
Publisher’s Note: MDPI stays neutral with regard to jurisdictional claims in published maps and institutional affiliations. |
© 2022 by the authors. Licensee MDPI, Basel, Switzerland. This article is an open access article distributed under the terms and conditions of the Creative Commons Attribution (CC BY) license (https://creativecommons.org/licenses/by/4.0/).
