Article

Semantic Segmentation of Panoramic Images for Real-Time Parking Slot Detection

1
Faculty of Electronic and Information Engineering, Xi’an Jiaotong University, No. 28, West Xianning Road, Xi’an 710049, China
2
Xi’an UniIC Semiconductors Co., Ltd., F/4, Building A, 6th Road, High-Tech Development Zone, Xi’an 710075, China
*
Author to whom correspondence should be addressed.
Remote Sens. 2022, 14(16), 3874; https://doi.org/10.3390/rs14163874
Submission received: 6 July 2022 / Revised: 29 July 2022 / Accepted: 2 August 2022 / Published: 10 August 2022

Abstract

:
Autonomous parking is an active field of automatic driving in both industry and academia. Parking slot detection (PSD) based on a panoramic image can effectively improve the perception of a parking space and the surrounding environment, which enhances the convenience and safety of parking. The challenge of PSD implementation is identifying the parking slot in real-time based on images obtained from the around view monitoring (AVM) system, while maintaining high recognition accuracy. This paper proposes a real-time parking slot detection (RPSD) network based on semantic segmentation, which implements real-time parking slot detection on the panoramic surround view (PSV) dataset and avoids the constraint conditions of parking slots. The structural advantages of the proposed network achieve real-time semantic segmentation while effectively improving the detection accuracy of the PSV dataset. The cascade structure reduces the operating parameters of the whole network, ensuring real-time performance, and the fusion of coarse and detailed features extracted from the upper and lower layers improves segmentation accuracy. The experimental results show that the final mIoU of this work is 67.97% and the speed is up to 32.69 fps, which achieves state-of-the-art performance with the PSV dataset.

1. Introduction

During daily driving, an estimated 30% of cars traveling on city streets are actively looking for parking [1]. The parking task includes multiple backward and forward movements. For beginners who have not yet developed a sense of accurate environmental perception, parking is the most difficult of all driving tasks [2]. Consequently, about 40% of accidents with physical loss or damage occur during parking or maneuvering [3]. Autonomous driving has become the leading research trend in future transportation, with increasing demand for traffic safety and travel convenience. Undoubtedly, self-driving cars will revolutionize the global automotive industry by improving road safety, traffic efficiency, and the overall driving experience [4]. Following the definitions of driving automation systems as outlined by the society of automotive engineers (SAE), automatic valet parking (AVP) is a typical example of a Level 4 automated driving system (ADS) [5]. AVP will ease the tension of parking tasks by allowing drivers to leave their cars in the drop-off area [6,7] with the vehicle parking itself. To realize automatic parking, the first step is to identify parking slot accurately in vehicle movement [8,9].
In today’s complex driving environment, panoramic imaging systems are applied to vehicle systems and become part of the advanced driving assistance system (ADAS) [10,11,12]. With deep research on artificial intelligence and deep learning, significant progress has been made in recognizing parking slots efficiently in multiple scenarios with panoramic images. For parking slot detection applications, there are mainly two roadmaps based on deep learning. One is object detection and the other is semantic segmentation. Object detection-based parking slot detection networks often require more prior knowledge and learn features from specific calibration data. L. Zhang et al. [13] proposed a novel deep convolutional neural network (DCNN)-based parking slot detection approach, DeepPS, which introduces an object detection-based parking space detection dataset. They combined modified versions of AlexNet [14] and YoloV2 [15,16] to achieve DeepPS. Previous studies, [13,17], have formulated the parking slot detection problem as two sub-problems: marking-point detection and local image pattern classification. The marking-point detector is based on YoloV2 and a customized DCNN architecture, using AlexNet as a template, is designed to solve classification tasks. The network requires a large amount of prior data in testing and it is not robust enough to adapt to a variety of parking slots. The semantic segmentation algorithm, represented by the full convolutional networks (FCN) [18], provides end-to-end training for inputs of arbitrary size, reducing the reliance on a priori data [19]. This method makes the application scenario more flexible and eliminates prior data constraints in realistic environments.
Many current prototypical implementations of automated driving heavily build upon recent advances made in the field of visual semantic scene understanding from camera sensors [20,21]. Semantic segmentation-based parking slot recognition networks are not limited to information related to parking slot size and intersection position information. This method can fully utilize the characteristics of deep learning on image feature extraction, thus achieving better robustness. In [22,23], a semantic segmentation-based parking slot detection algorithm and the panoramic surround view (PSV) dataset are proposed, which provide an end-to-end detection method. To extract linear features of parking slots robustly and precisely, Wu et al. proposed a VH-HFCN [22] network which added a VH-stage to improve line segmentation of parking slots. To extract line features, the network contains independent horizontal and vertical convolution kernels. Jiang et al. [23] proposed a DFNet network which engaged dynamic loss weights and a residual fusion block (RFB) to improve the segmentation accuracy of parking spaces. It is well known that fewer computational parameters indicate faster calculation time under the same calculation capability. Calculation time is a crucial parameter for real-time systems. In DFNet, after the up-sampling layer of the feature extraction module, the feature maps are automatically configured to the same size as the input image. Through the subsequent RFB, the calculation parameters then increase significantly, also affecting calculation time. The balance of recognizing accuracy and processing frame rate is critical for practical applications of parking slot detection. The semantic segmentation-based parking slot detection methods are more robust than those based on object detection as mentioned above.
Compared with other detection applications, the diversity of parking slot shape and the complexity of scene light make semantic segmentation more suitable for parking slot detection. Moreover, its end-to-end feature effectively reduces unnecessary post-processing and makes the detection results easy to display intuitively. However, the increasing computational effort results in the time used by the algorithm increasing significantly. As a result, semantic segmentation poses a considerable challenge in real-time parking slot detection. The requirement for the detection algorithm is not only to detect the parking slot more accurately, but also to ensure excellent real-time performance.
There is still room for improvement in the existing technology used for parking slot detection in practical application scenarios. In parking applications, while ensuring recognition accuracy, real-time performance is also essential. There are various labeled parking slot datasets in existing works, and the PSV dataset is a kind of semantic segmentation dataset. The dataset is finely annotated with different marking lines in various parking scenes. However, the whole parking slot detection is a dynamic process and there is an urgent need for real-time parking slot detection, which is not well supported by the existing networks. Therefore, we propose a real-time parking slot detection (RPSD) network with the following contributions:
  • By cascading multi-scale image information, the number of parameters in the network is effectively reduced, thereby improving computational efficiency. Due to the multi-layers network structure, the upper-layer is responsible for rapid primary information extraction while the lower-layer extracts more details to ensure accuracy. Therefore, based on inheriting the previous advantages of semantic segmentation networks, the proposed network structure maintains recognition accuracy while achieving real-time parking slot detection.
  • Using the self-attention mechanism for channel domains, the ability to recognize small lines in the image is effectively improved. Pixel accuracy and the mIoU of the network are improved.
  • The adaptive weighted loss function based on weighted cross-entropy is proposed to solve the imbalance of data and classification effectively. The average improvement in mIoU is almost 2% for small proportion categories.
The RPSD network mainly addresses the demand for real-time performance in parking slot recognition and ensures the accuracy of the network. The rapid network ensures network detection speed, which is the design theme of the RPSD network. By optimizing the network structure, the multi-layers network structure proposed in this paper significantly improves the computational efficiency of the network to meet real-time requirements without losing detection accuracy. With the help of feature information extraction between channels, and small-scale category loss optimization, the network achieves the best mIoU for the PSV dataset. As a result of the above contributions, the overall detection accuracy of the RPSD network reaches state-of-the-art performance with the PSV dataset, with a mIoU of 67.97% in the test, while real-time detection is achieved at the same time with a frame rate of 32 fps.

2. Related Work

In automatic driving systems [24] based on visual perception, there are already various road marking detection works that can effectively extract ground information. Based on different usage scenarios, systems such as lane detection and parking slot detection have emerged. The goals of these two methods are quite different: lane detection focuses on extracting the lane in front of the vehicle, while parking slot detection focuses on detecting the information around the vehicle and the parking slot. The existing lane detection methods, which do not satisfy the target scenario of this work, are as follows: X. G. Pan et al. [25] proposed the SCNN network, enabling the information passing between pixels across rows and columns in a layer. The SCNN is more conducive to segmenting long continuous shapes in the images, but its running time has reached 42 ms (excluding the backbone network). Thus, this method cannot meet the requirement of real-time parking slot detection. S. Lee et al. [26] proposed VPGNet, which projects pixel-level annotation to the grid-level mask. This grid-level mask is not suitable for parking slot detection applications. LaneNet [27] proposed a real-time lane detection network for autonomous driving. LaneNet uses a lane edge proposal network to generate a binary lane edge proposal map indicating the position of the pixels that likely lie on the edge of lane segments. Hence, LaneNet is not suitable for semantic segmentation of parking slot datasets such as the PSV dataset used in this study. Self-attention distillation (SAD) [28] allows a model to learn from itself, obtains substantial improvements, and searches the corresponding probability map every 20 rows. In parking slot detection, this feature may significantly reduce detection accuracy. In [29], a traffic scene semantic segmentation method is proposed. Even with a lightweight backbone, MobileNet, the running time of their network is 0.428 s, which is far from the real-time performance requirement. Jingyu Li et al. [30] proposed the Lane-DeepLab model to obtain accurate lane detection results for high-definition maps. For high lane detection accuracy, their method has a low detection speed. Therefore, these proposed lane detection [31] methods may not suit parking slot detection applications, especially for the PSV datasets used in this study.
In order to obtain the complete image information around the vehicle and generate a panoramic image, the around view monitoring (AVM) system is introduced into the automatic driving system. With the AVM system [32,33,34], drivers can effectively observe the information around the vehicle to reduce collisions and improve driving safety. There are already several previous studies on AVM systems based on different hardware platforms. Y. C. Liu et al. [35] presented a bird’s-eye view system that provides a panoramic image [36,37] of the vehicle’s surroundings utilizing six fisheye cameras [38,39,40] mounted around the vehicle. The panoramic image allows the driver to observe parking slots under various lighting conditions effectively. Some previous parking slot detection algorithms are primarily based on traditional image processing methods. Suhr proposed a series of methods [41,42,43] based on the hierarchical tree structure of corner–junction–slot, which first detects corner points and then performs line detection and parking slot detection. When light in the application scene is variable, the accuracy of the traditional algorithms for corner detection decreases. Thus, the methods proposed in [41,42,43] are not robust enough and cannot be applied to various scenarios.
The rapid development of artificial intelligence and deep learning has brought computer vision to a new level. Convolutional networks are driving advances in recognition [28]. The application of deep neural networks in semantic segmentation has dramatically improved the accuracy of object recognition and the intersection ratio. Pioneering studies in this field are reviewed as follows: Jonathan Long et al. [18] proposed the FCN for image semantic segmentation and realized an end-to-end network. In 2015, Olaf Ronneberger et al. [44] proposed U-net, which is used for solving simple problems of small sample segmentation, such as medical film segmentation. PSPNet [45] is a pyramidally structured network that can capture multi-scale semantic information in an image. The Deeplab [46,47,48,49] series network uses the atrous spatial pyramid pooling (ASPP) structure and uses limited network parameters to achieve multi-scale image information collection. Segnet [50] uses unpooling, which needs the position parameters of the pool mask from the corresponding pooling. ENet [51] optimizes the model parameters and accelerates forward time while maintaining high accuracy. H. Zhao et al. [52] proposed a multi-layers cascade network called ICNet. HFCN [53] proposed a highly fused convolutional network based on multiple soft cost functions. In order to improve accuracy, an attention mechanism [54,55] was introduced in the deep learning methodology. Wang et al. [56] explored non-local operation in the spacetime dimension for videos and images with the help of a self-attention module. Another work [57] discussed the relationship between global context information and large kernels. Overall, various studies have been conducted, including studies related to high resolution representation learning [58], object-contextual recognition [59], and the speed performance of the network [60].

3. Proposed Method

Compared to the general dataset, the most challenging task of applying the semantic segmentation method to solve the parking slot recognition problem is the proportion of the background. In common semantic segmentation datasets, such as Cityscapes [61] and Pascal VOC2012 [62], the proportion of segmented objects in the image is relatively large. However, in the PSV dataset, the parking line width of the labeled image is represented by a few pixels. Therefore, the edge part in the general segmentation dataset becomes the main part of the parking slot segmentation, as shown in Figure 1. Due to the characteristics of the PSV dataset, the accuracy improvements in pixel recognition and mIoU indicate a significant improvement in pixel accuracy for all categories except the background. Accuracy is usually guaranteed at the cost of a complex network structure and huge network parameters, which imposes a considerable computational load and increases computation time. We propose a real-time network to address this challenge, significantly improving the processing frame rate while considering accuracy. Based on ensuring real-time performance, we propose the RPSD network.
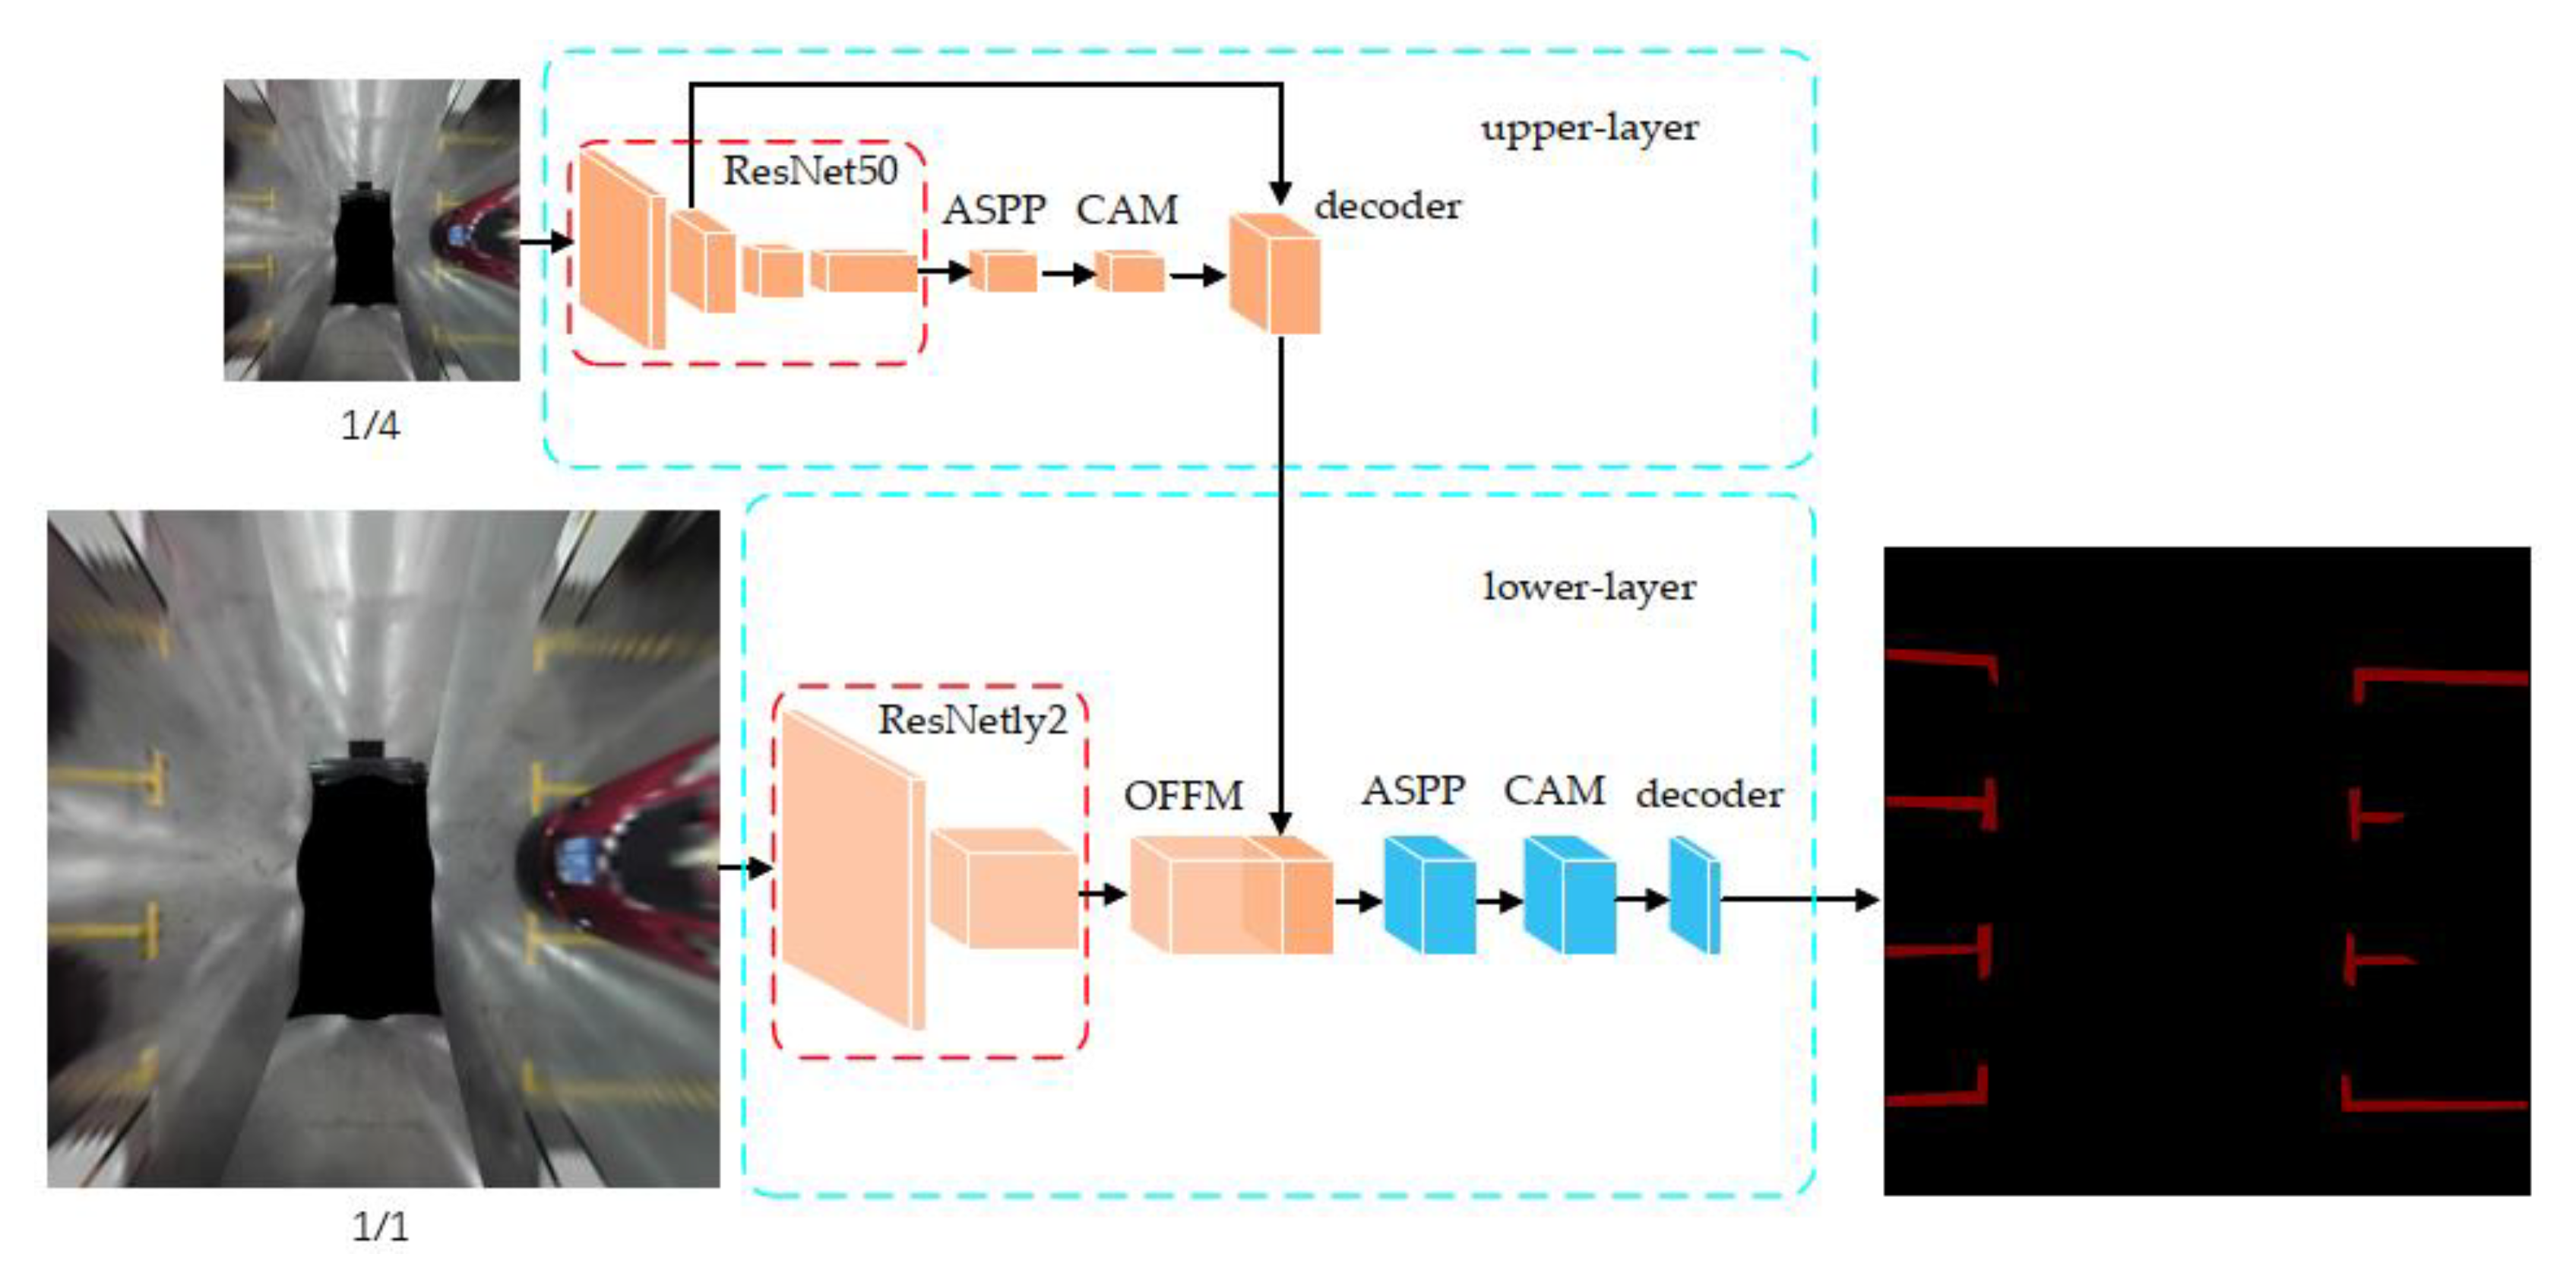
The overall structure of the RPSD network is shown in Figure 2. The main body of the network is composed of a two-layer network. Due to the real-time performance requirement, the ASPP module is used for multi-scale context sampling of the network. The backbone of RPSD is ResNet50 [63], and some modules are improved from the DeeplabV3+ network.
We resize the input image to 1/4 of the original dataset’s image size, send it to the upper network as input, and obtain the upper-layer feature map through the semantic segmentation process of the upper network. The input of the lower-layer network is the original image of the PSV dataset, and the feature map of the lower-layer output is obtained through processing of the lower-layer encoding network ResNetly2. ResNetly2 is the network that removes the conv4_x and conv5_x layers in the standard ResNet50 network, which contain many bottleneck architectures. The feature maps generated by the upper and lower networks are concatenated to generate the final decoding network’s input. The output image generated after decoding is interpolated to produce the final output image.
Compared to the original Deeplab V3+ network, the RPSD network adds channel attention module (CAM) [64] to the decoding part of the upper and lower layers. The CAM effectively improved the accuracy rate without adding much calculation. Therefore, the CAM is more suitable for real-time networks. In the lower network, the feature map generated by the decoding module of the upper network is used as a coarse segmentation input for the lower-layer network. The small size of the image input for the upper network dramatically reduces the time for image segmentation. Due to the limited image information, the accuracy of the feature map after segmentation is not sufficient, which is called coarse segmentation; nevertheless, when used as input to the object feature fusion module (OFFM), this information can guide the lower-layer network to work. The OFFM fuses the motioned coarse segmentation input with the detailed features extracted from the original size map by the lower ResNetly2 module and generates the lower ASPP module’s input. The two layers of the network have their own decoder modules which respectively deal with input features of different sizes and interpolate the output to the proper size. The properly sized output image of the upper network decoder is the coarse segmentation feature map, and the decoded result of the lower network is the final output segmentation result.
The double-layers architecture of the RPSD network effectively decomposes the segmentation problem that usually needs a further deep network. The entire network comprises two parts: a fast network with coarse segmentation and a detailed feature extraction network. Two delicate computational processes are merged in this structure which simplifies the complex problem. The double-layers architecture of the RPSD network is the crucial point which achieves better balance in speed and precision.

3.1. Multi-Layers Network Structure

For optimizing network speed, reducing the input image size, optimizing the network structure, and reducing network parameters are the most effective methods. Especially for deep networks, the network structure and computational requirements are highly correlated. The multi-layers cascading network structure has both advantages of the high speed of small networks and the accuracy of large networks, which is ideal for achieving high accuracy real-time applications. In this network, the upper network’s input image size is 1/4 of the original dataset, effectively reducing the input image’s size in the upper network and optimizing network processing speed. After the upper-layer segmentation, the output feature map is classified by image content, which is used as part of the lower-layer network’s decoding input to guide further segmentation. Although the input size used by the lower-layer network is the original image size of the PSV dataset, after chopping the backbone, the network parameters of the lower-layer network’s encoding part are significantly reduced and calculation time is saved. Based on retaining image details, the original size input of the lower network is combined with the coarse segmentation prediction part of the upper network as the lower decoding network’s input. On this basis, the final segmentation accuracy is guaranteed and the operation time is effectively reduced, making real-time performance of the network possible.
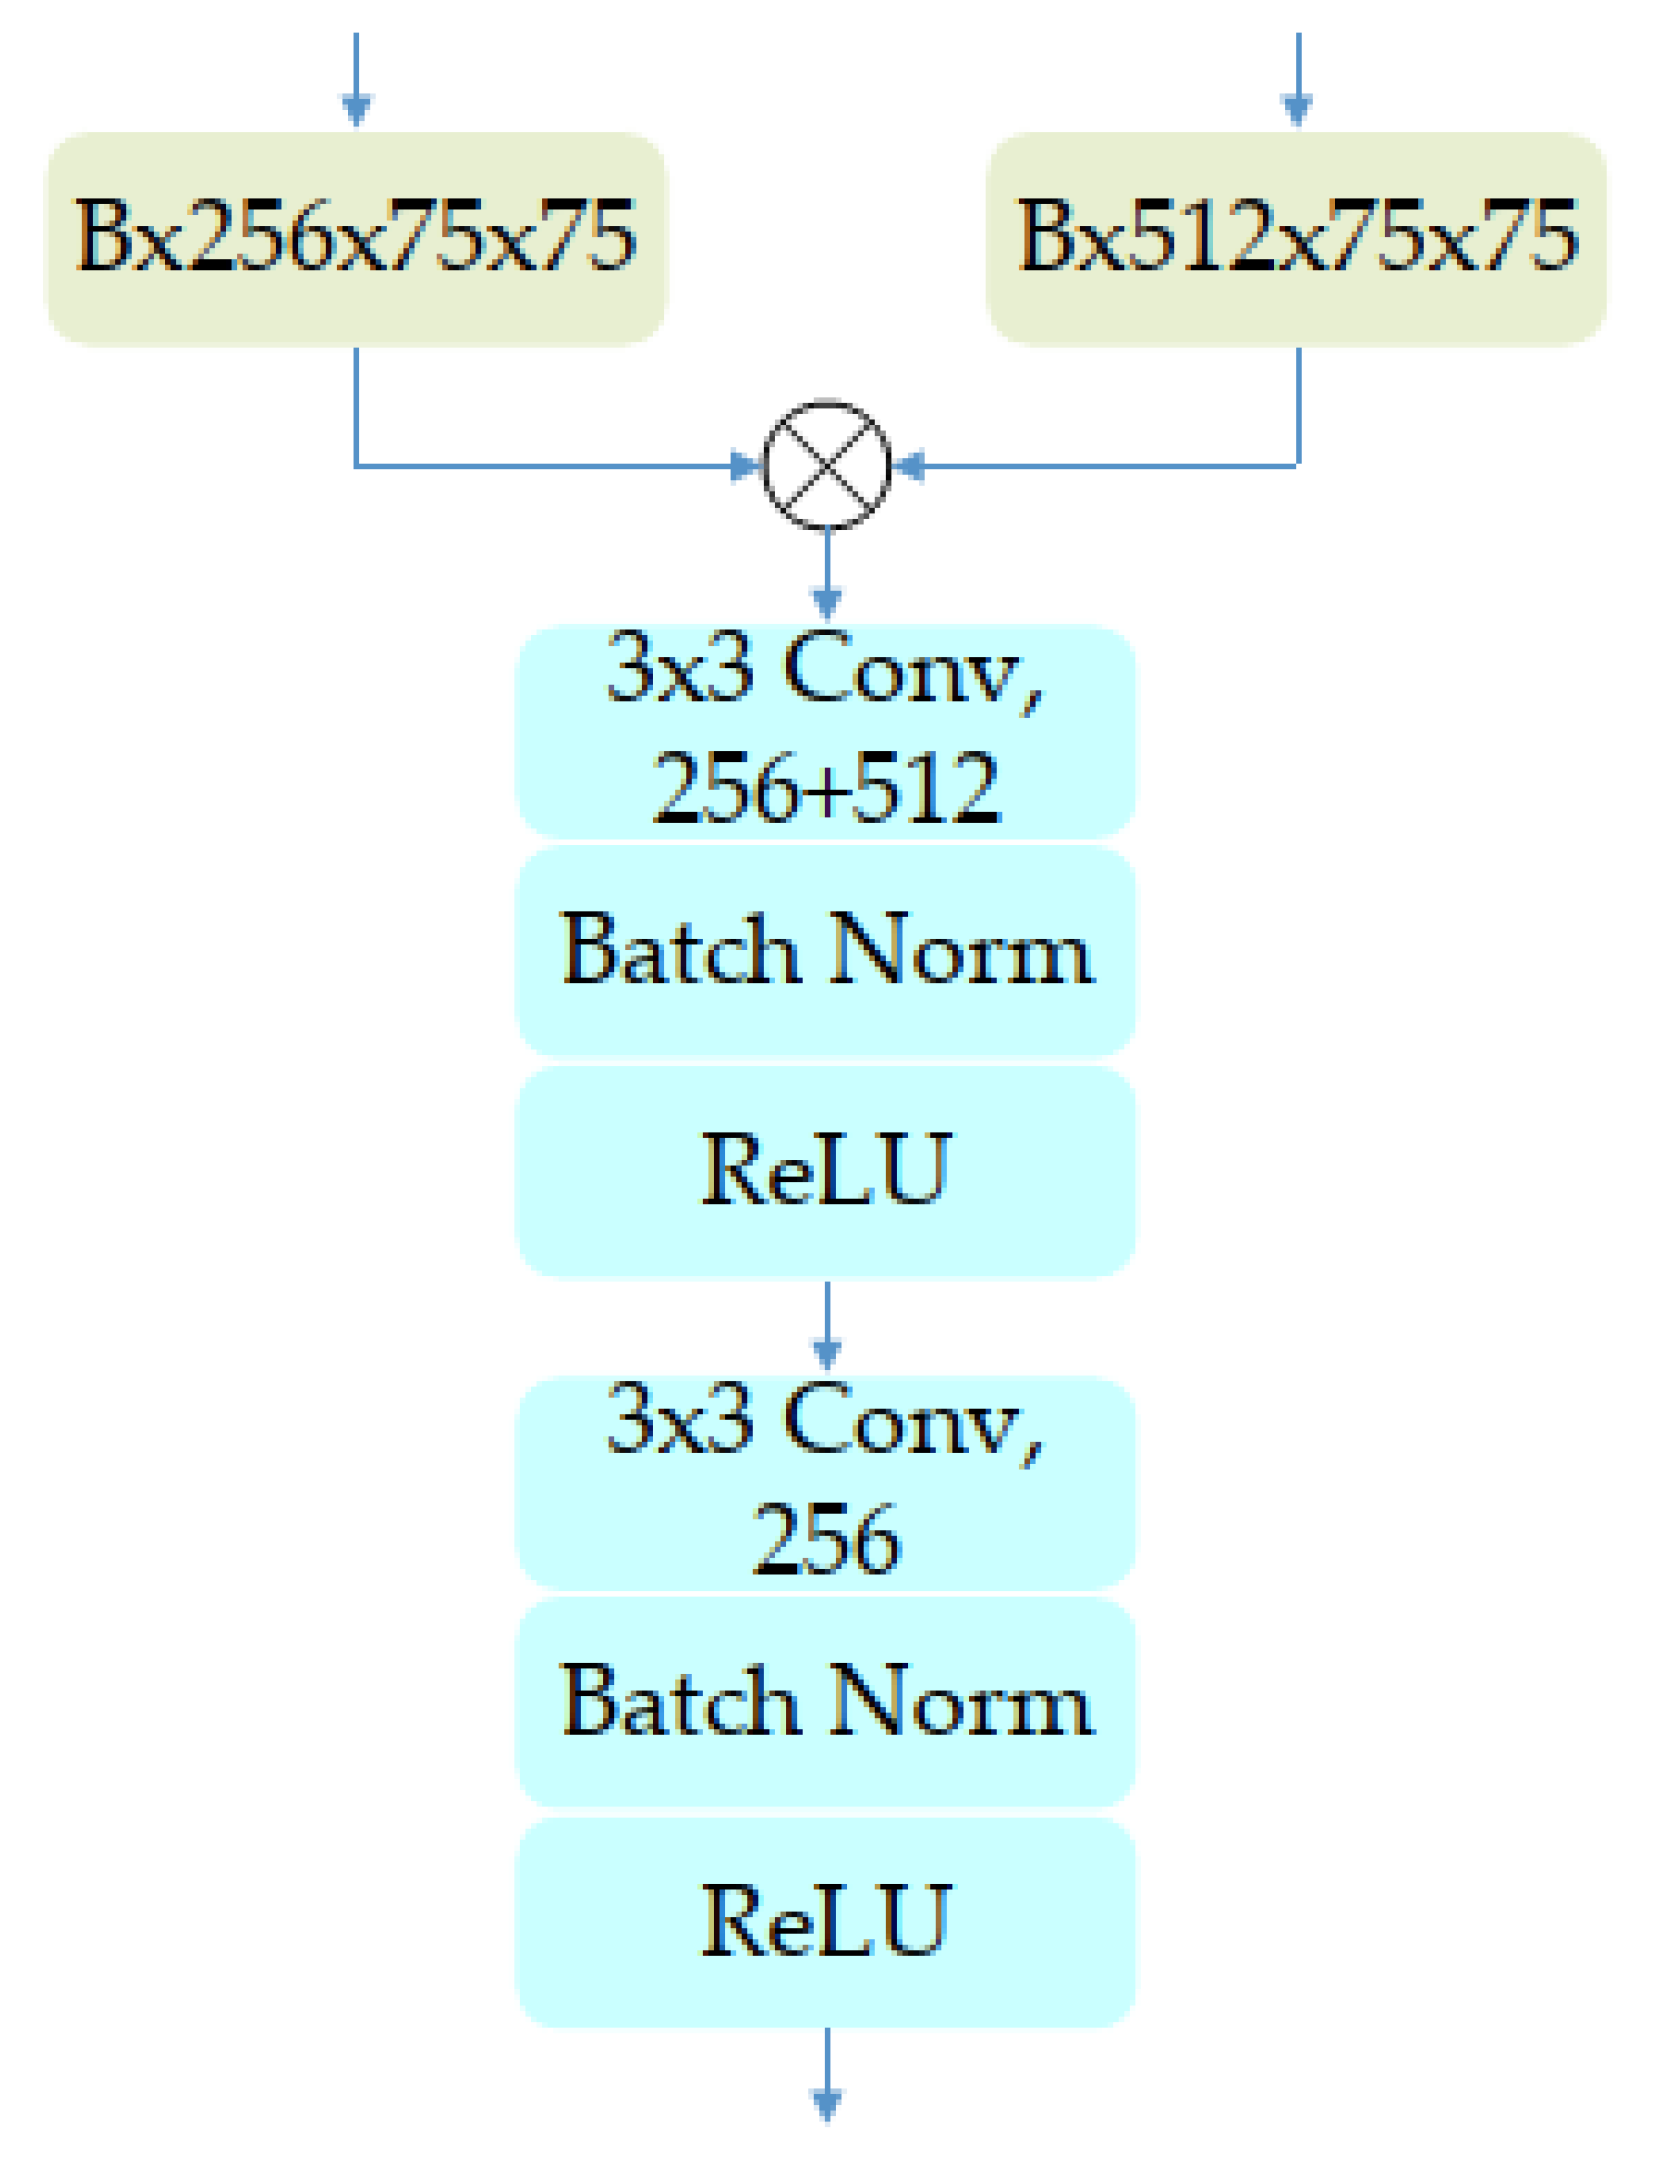
The OFFM effectively fuses feature information from both the upper and lower layers, as shown in Figure 3. The upper-layer network decoding result is established by the upper-layer network decoding module based on the 1/4 size image. The upper-layer result is further interpolated to 75 × 75 to facilitate combining the upper-layer result and the lower-layer result. The upper and lower layer results of the same size are fed into the OFFM module to obtain the fusion result. The fusion result has the classification marks after fast segmentation of the upper-layer network and maintains the details of the original size input image of the lower-layer, which plays a vital role in improving the final segmentation accuracy. After the concatenation, the fusion result consists of 256 + 512 channels which are convoluted by a 3 × 3 convolution core to generate the output feature map of 256 channels, then the feature is extracted and output by 3 × 3 convolution.
The multi-scale information overlay has greatly improved the pixel accuracy and the mIoU of the image. The atrous spatial pyramid pooling module’s application keeps the single kernel parameter at a size of 3 × 3 and collects image information at multiple scales through dilation. In the decoding part of each layer of the network, due to the use of the ASPP, the multi-scale context capture of a single image is effectively completed and the convolution parameters are reduced, which also improves detection efficiency. For specific calculation parameters, please refer to the Experiments and Results section.

3.2. Self-Attention Mechanism for Channel Domain

Based on application of the multi-layers network structure, the attention mechanism is introduced to improve inference accuracy further. An attention function can be described as mapping a Query (Q) and a set of Key (K)—Value (V) pairs to an output. For the self-attention of image application, the value of Q, K, and V are all from the input feature maps, as shown in Figure 4. The input shape of the module is B  ×  C  ×  H  ×  W. The CAM module only uses attention on the channel. Compared to the spatial attention mechanism, the calculation size of Q and V is changed from H  ×  W  ×  H  ×  W to use only C  ×  C, which not only maintains the correlation between channels but also reduces computational load. To calculate the attention between channels, we assign the input feature maps to K, Q, and V, respectively, and reshape them to B  ×  C  ×  HW. After transposing Q and multiplying it with K, the feature map shape of the output is B  ×  C  ×  C, and the attention map of each channel is obtained by softmax:
x j i = exp ( A i · A j ) i = 1 C e x p ( A i · A j )
where x i j measures the i t h channel’s impact on the j t h channel, A i represents the original features of channel I, and A j represents the original features of channel j.
Multiply the attention obtained by each channel with V, sum them, and reshape them to B  ×  C  ×  H  ×  W. Afterwards, multiplying the result by the weight and adding to the original features obtains the final output of the CAM, as shown in Equation (2). Compared to the none CAM structure, channel attention effectively digs out the correlation of channel information and improves the accuracy rate.
E j = α i = 1 C ( x j i A i ) + A j
where   α gradually learns a weight from 0 and x i j measures the i t h channel’s impact on the j t h channel.
After the attention mechanism is used on the channel, the entire accuracy can be improved through limited calculation and the CAM has little effect on the overall timeliness of the model.

3.3. Adaptive Weighted Cross-Entropy Loss Function

Generally, the labeled parts of the parking slot semantic segmentation dataset are the parking slot and the auxiliary lane lines in some scenes. The labeled classification with parking slot as a category is the classification with the highest proportion of removing the background. In the images collected in the actual dataset, the open road accounts for most of the entire image. Therefore, this category is marked as the background part with the largest proportion in the dataset. Due to the characteristics of the PSV dataset, parking slots and lines occupy a small proportion of the image and pixels in some images do not even exceed 10% of the image proportion, which has a significant negative impact on the final pixel accuracy and mIoU. The main reasons for this problem are the uneven distribution of the dataset and the large proportion of background. To solve the problem, an adaptive adjustment based on the weighted cross-entropy loss is introduced in this paper. Compared to the average value of each classification of the typical cross-entropy loss function, the loss function with adaptive weight can reasonably allocate each category proportion. The loss function can be given a higher weight for categories with low occupancy, ensuring better optimization of the final result. The proposed loss function pays attention to the imbalanced classes and ensures computational efficiency. Segmentation accuracy of a category is evaluated by the intersection/union metric and the accuracy can be obtained by the equation:
segmentation   accuracy = TP TP   +   FP   +   FN
where TP, FP, and FN represent true positives, false positives, and false negatives, respectively.
Focusing on the imbalanced weight distribution, the weight of each classification is represented by w i . After every five epochs, the entire network will be evaluated to obtain the IoU of each part. We use the reciprocal of each type of IoU as the latest w i . To prevent the proportion of some classifications being too small, which makes their reciprocal too large and affects the training. We set up the upper and lower thresholds for weight, which are 1 and 10, respectively. There are W (W = 2) layers and N (N = 7) categories. In layer i, the spatial size of the predicted feature map P is y i × x i , and the value at position (n, y, x) is p n , y , x . The corresponding ground truth label is p y , x . The loss function is represented by the following equation:
L = i = 1 W w i 1 y i x i y = 1 y i x = 1 x i l o g e p y , x n = 1 N e p n , y , x
With the help of threshold weights, the model can quickly converge. By adjusting the weight of each category, the loss function moves the final accuracy of each category towards the optimal result.
This section introduces improving network speed in principle and proposes the multi-layers network. While ensuring network speed, the channel attention module is utilized to improve accuracy without significantly increasing calculation. The application of the adaptive weighted loss function optimizes the impact of small proportion classifications on overall accuracy and further improves the final accuracy. The above theoretical benefits are fully demonstrated in the Experiments and Results section.

4. Experiments and Results

The dataset used in this experiment is the PSV dataset produced and published by the Tongji Intelligent Electric Vehicle (TiEV) team. The images were collected at Tongji University in two sizes, 600 × 600 and 1000 × 1000. There are 4249 panoramic RGB images with the labeled ground truth of six object classes: background, parking slot, white solid line, white dashed line, yellow solid line, and yellow dashed line. The annotated dataset is divided into 2550/425/1274 images for training, validation, and testing, respectively. The proposed method based on Pytorch is implemented and trained on an NVIDIA GeForce GTX TITAN Xp GPU. The input images are converted to a uniform size of 600 × 600. For training, we use the stochastic gradient descent (SGD) optimizer with an initial learning rate of 0.01, weight decay of 0.0005, and momentum of 0.9. Following the previous experimental setup, we employ the poly learning rate policy where the current learning rate is multiplied by 0.9 after each iteration. In our experiments, we use pixel accuracy and the mean of class-wise Intersection over Union (mIoU) as the evaluation metric.

4.1. Ablation Study

In order to verify the efficiency of the network and show the impacts on different inputs and network structures, we conducted a series of ablation studies. The studies are as follows: the influence of input parameters and network structure on computational efficiency; improvement in accuracy via the CAM module extracting inter-channel features; and improvement in the final accuracy value via use of the adaptive weighted loss function to balance the classification of small proportions.
In Section 3.1, the cascade structure is designed to optimize the number of calculations to achieve better real-time performance. This section analyzes the influence of the network structure and the number of network parameters on computational load. To guarantee Acc and mIoU, two ResNet50 networks are engaged as the backbone for each layer of the RPSD network. The backbone of the upper RPSD network is ResNet50, which uses 300 × 300, 3-channel RGB images. The 300 × 300 images are downsampled from the cropped 600 × 600 uniform size dataset. The backbone of the bottom RPSD network is the ResNetly2 network, which is the ResNet50 without the last two layers, and the input dataset uses the cropped 600 × 600 uniform size directly; for comparison, an original ResNet50 is introduced using the cropped 600 × 600 uniform size dataset as a benchmark. The statistical results of the three comparative items mentioned above are shown in Table 1. The total numbers of trainable parameters, the total number of integer floating-point numbers, and the total number of multiplication–addition operations are counted in Table 1. The units of the total number of integer floating-point numbers and the total number of multiplication–addition operations are Giga Floating-point Operations Per Second (GFlops) and Giga multiplication-addition Operations (GMAdd), respectively.
1.
The total amount of trainable parameters for ResNetly2 with 600 × 600 input size is 1,444,928, which is about 6% of the original ResNet50 with the same input size because the network structures of these two comparison items are different;
2.
The total amount of trainable parameters for those two entire ResNet50s, with either 600 × 600 or 300 × 300 input sizes, is 25,557,032 and the total number of integer floating-point calculations for the entire ResNet50 with 300 × 300 input size is about 23.2% of that with 600 × 600 input size because the input size is only 1/4 of the original input. This brings compression of all feature map sizes.
By comparing to the benchmark, it can be observed that both Flops for each layer are smaller than the original ResNet50. The total amount of computation for the two-layers network’s backbones is only 66.55% of that of a single-level network, which significantly reduces the amount of computation, effectively improves the running speed of the network, and makes the network available in real-time.
Based on the networks mentioned above, a test is performed on a dataset of 10,000 images with a batch size of 8. In Table 2, the actual consumption time and the network speed of each network are shown. We can also observe the time consumptions of the different network structures under the same input image size and the time consumptions of the same network structure under different input sizes. Under the same input image size of 600 × 600, the operating times of ResNet50 and ResNetly2 are 100.89 s and 63.66 s, respectively, indicating that simplification of the network structure contributes significantly to operating time; under different input image sizes of 600 × 600 and 300 × 300, the operating times of those two ResNet50s are 100.89 s and 31.39 s, indicating that reduction in network input size contributes significantly to operating time. Thus, network efficiency can be significantly improved by simplifying the network structure and reducing network input size. The RPSD network possesses both of the aforementioned advantages.
Table 1 and Table 2 explain the advantages of the two-layers network structure of RPSD:
  • This work decomposes a traditional single-layer network problem into two sub-problems. There is no causal relationship between the calculations of the upper-layer and the lower-layer, and these calculations can be processed in parallel; limited by the ResNetly2_600 branch, processing time is 64% of that of the single-layer network (Table 2);
  • Usually, the cost of splitting a complex problem into two simpler independent problems indicates an increment in total processing cost, which is the general cost of problem simplification. In contrast, the total amount of calculation of the two-layers network structure is 66.55% of that of the traditional method (Table 1), which contributes to a computationally efficient architecture.
From the above ablation studies, it can be observed that reducing the input size of the same network and reducing the network parameters by reducing the network structure can effectively improve calculation speed.
Due to the characteristics of the PSV dataset, learning annotation information is much more complex than that of the general dataset as, in the general dataset, object classifications are large-area labels; in contrast, the pixel points corresponding to the parking slot classifications of the PSV dataset are much fewer. In the PSV parking slot detection dataset, most background roads are marked as 0 and only a few parts of the image are marked as road parking slots. Therefore, improving the pixel accuracy, i.e., accurate recognition of limited information, is a challenge. In this paper, the channel attention mechanism is used to establish the relationships among the channels more closely, thus improving pixel accuracy and mIoU.
Deeper extraction of the correlation between channels can effectively improve the network’s recognition ability, thus improving pixel accuracy and the mIoU. Therefore, we extract the lower part of the network, remove the OFFM, and use only the remaining part to verify the validity of the CAM module. We conducted an ablation study on the channel attention module, and the results are shown in Table 3. In Table 3, w/o Att. and Channel-att. represent the networks without the CAM module and with the CAM module, respectively. Pixel Accu and mIoU represent the average pixel accuracy and the average intersection ratio. The experiment takes the original dataset as input and the ResNetly2 backbone is only a shallow network. As shown in Table 3, the CAM module plays a vital role in feature extraction. We can see the improvements in Pixel Accu and mIoU, after using the CAM module, from the experimental results. From the speed comparison in the last column of the table, the processing times are almost the same. As a result, the processing time is not affected by the CAM procedure.
The adaptive weighted loss function more effectively balances the uneven distribution of the data in the dataset. By adjusting the loss of each classification, the final pixel accuracy and mIoU are effectively guided. There is a considerable uneven distribution in the categories collected in the PSV dataset. To verify the effect of adaptive weighted loss on the final mIoU more clearly, we select IoU of Category 4 White Dashed and Category 5 Yellow Solid before and after using this method, as shown in Table 4. In the table, w/o apt weight loss and apt weight loss are the unused adaptive weighted loss and the used method, respectively. The results in the table show that these two relatively small categories can effectively improve their IoU with the aid of weight adjustment, thus improving the segmentation accuracy of the overall dataset. The data of these categories have a significant impact on the final average data.
With the ablation study of adaptive weighted loss function, the mIoU of the two smaller categories is improved, as shown in Table 4. The computational cost of the adaptive weighted loss function is negligible compared to the improvement in mIoU. Since the calculation part of adaptive weighted loss is only used in training, its implementation does not cause time consumption in the later inference step. This method has no calculation cost in actual processing and improves the mIoU.

4.2. Results with the PSV Dataset

In the comprehensive experiment, we apply various well-known semantic segmentation networks to the PSV dataset and collect their performance for comparison with this work. As shown in Table 5, FCN8 [28], U-Net [29], ENet [36], DeeplabV3+ [33], PSPNet [30], VH-HFCN [10], and DFNet [27] are introduced and used for comparison to the RPSD network of this study. The first line of Table 5 is the classification of the PSV dataset: pixel accuracy, mIoU, and operating speed. The data under the classifications are the corresponding IoUs. In summary, among all competitors, this work has the highest mIoU (67.97). In the Speed column, only ENet and this work achieve the requirement of real-time segmentation (24 fps). As a fast segmentation network, ENet’s speed advantage comes at the cost of losing accuracy (39.03 in mIoU). From the results in Table 5, the RPSD network achieves the best pixel accuracy and mIoU for the PSV dataset and the speed of the RPSD network reaches 32.69 fps; this achieves the best balance between precision and speed in all of the reference networks and meets the design requirements.
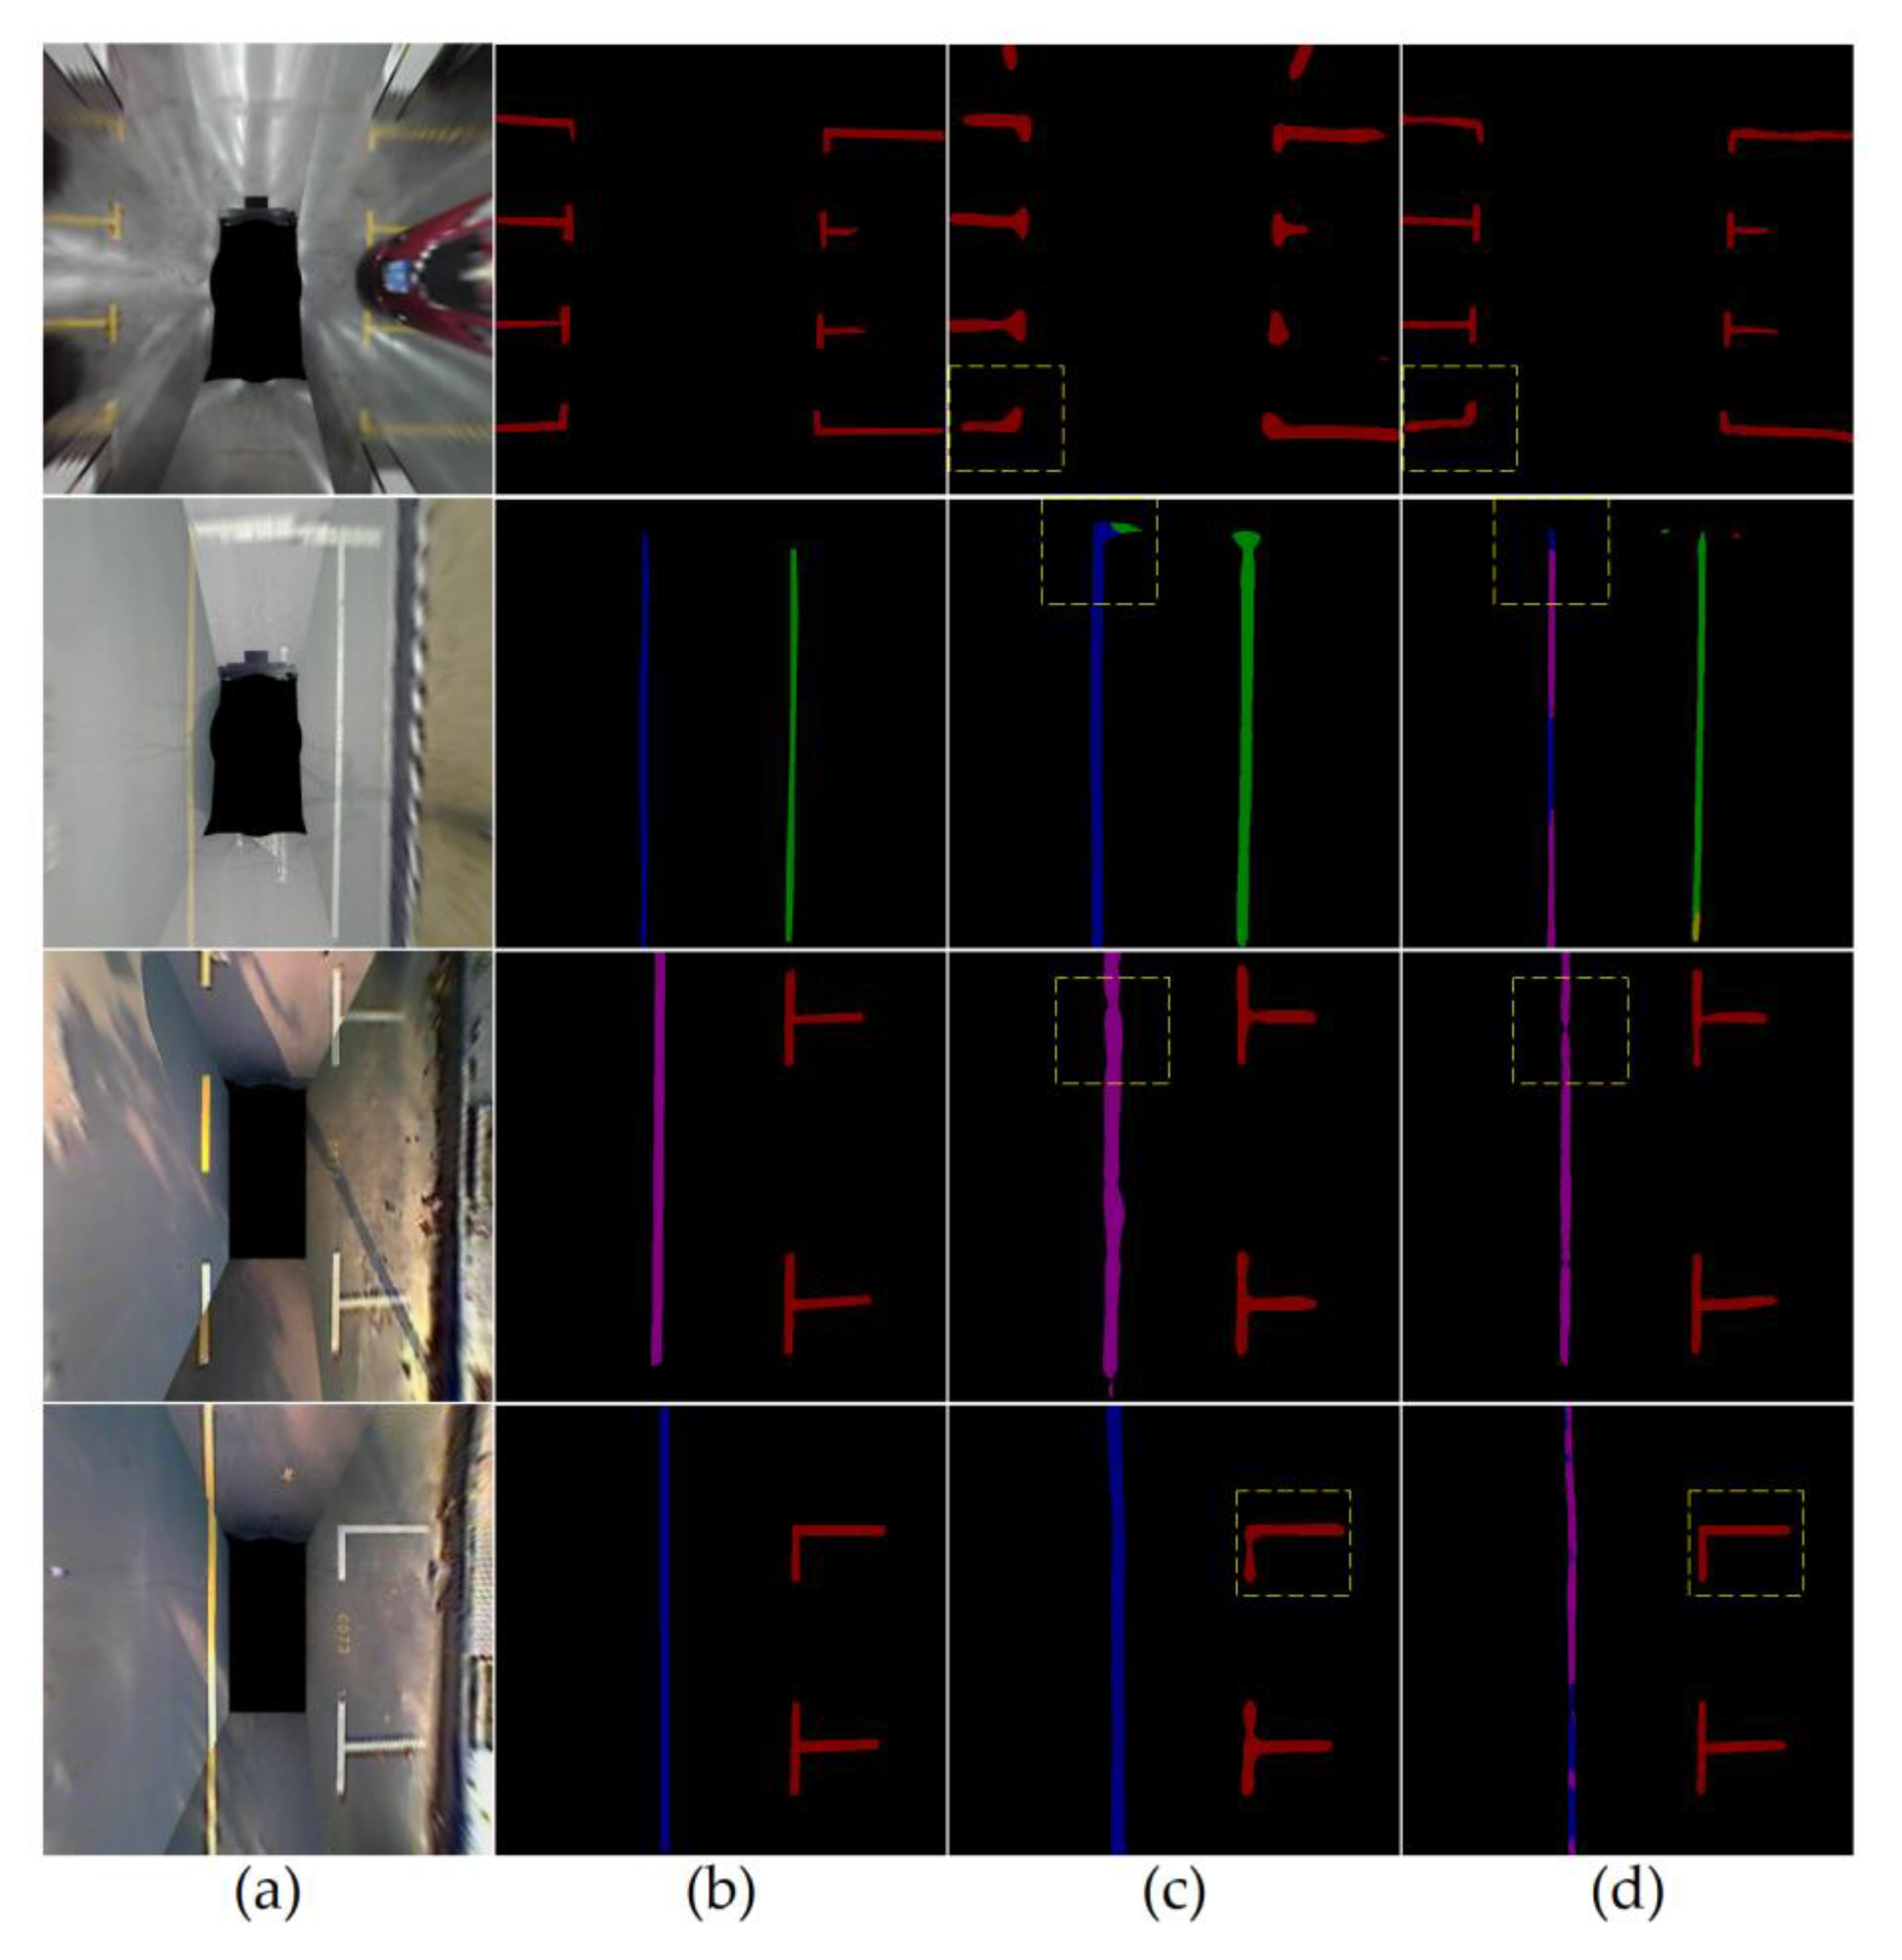
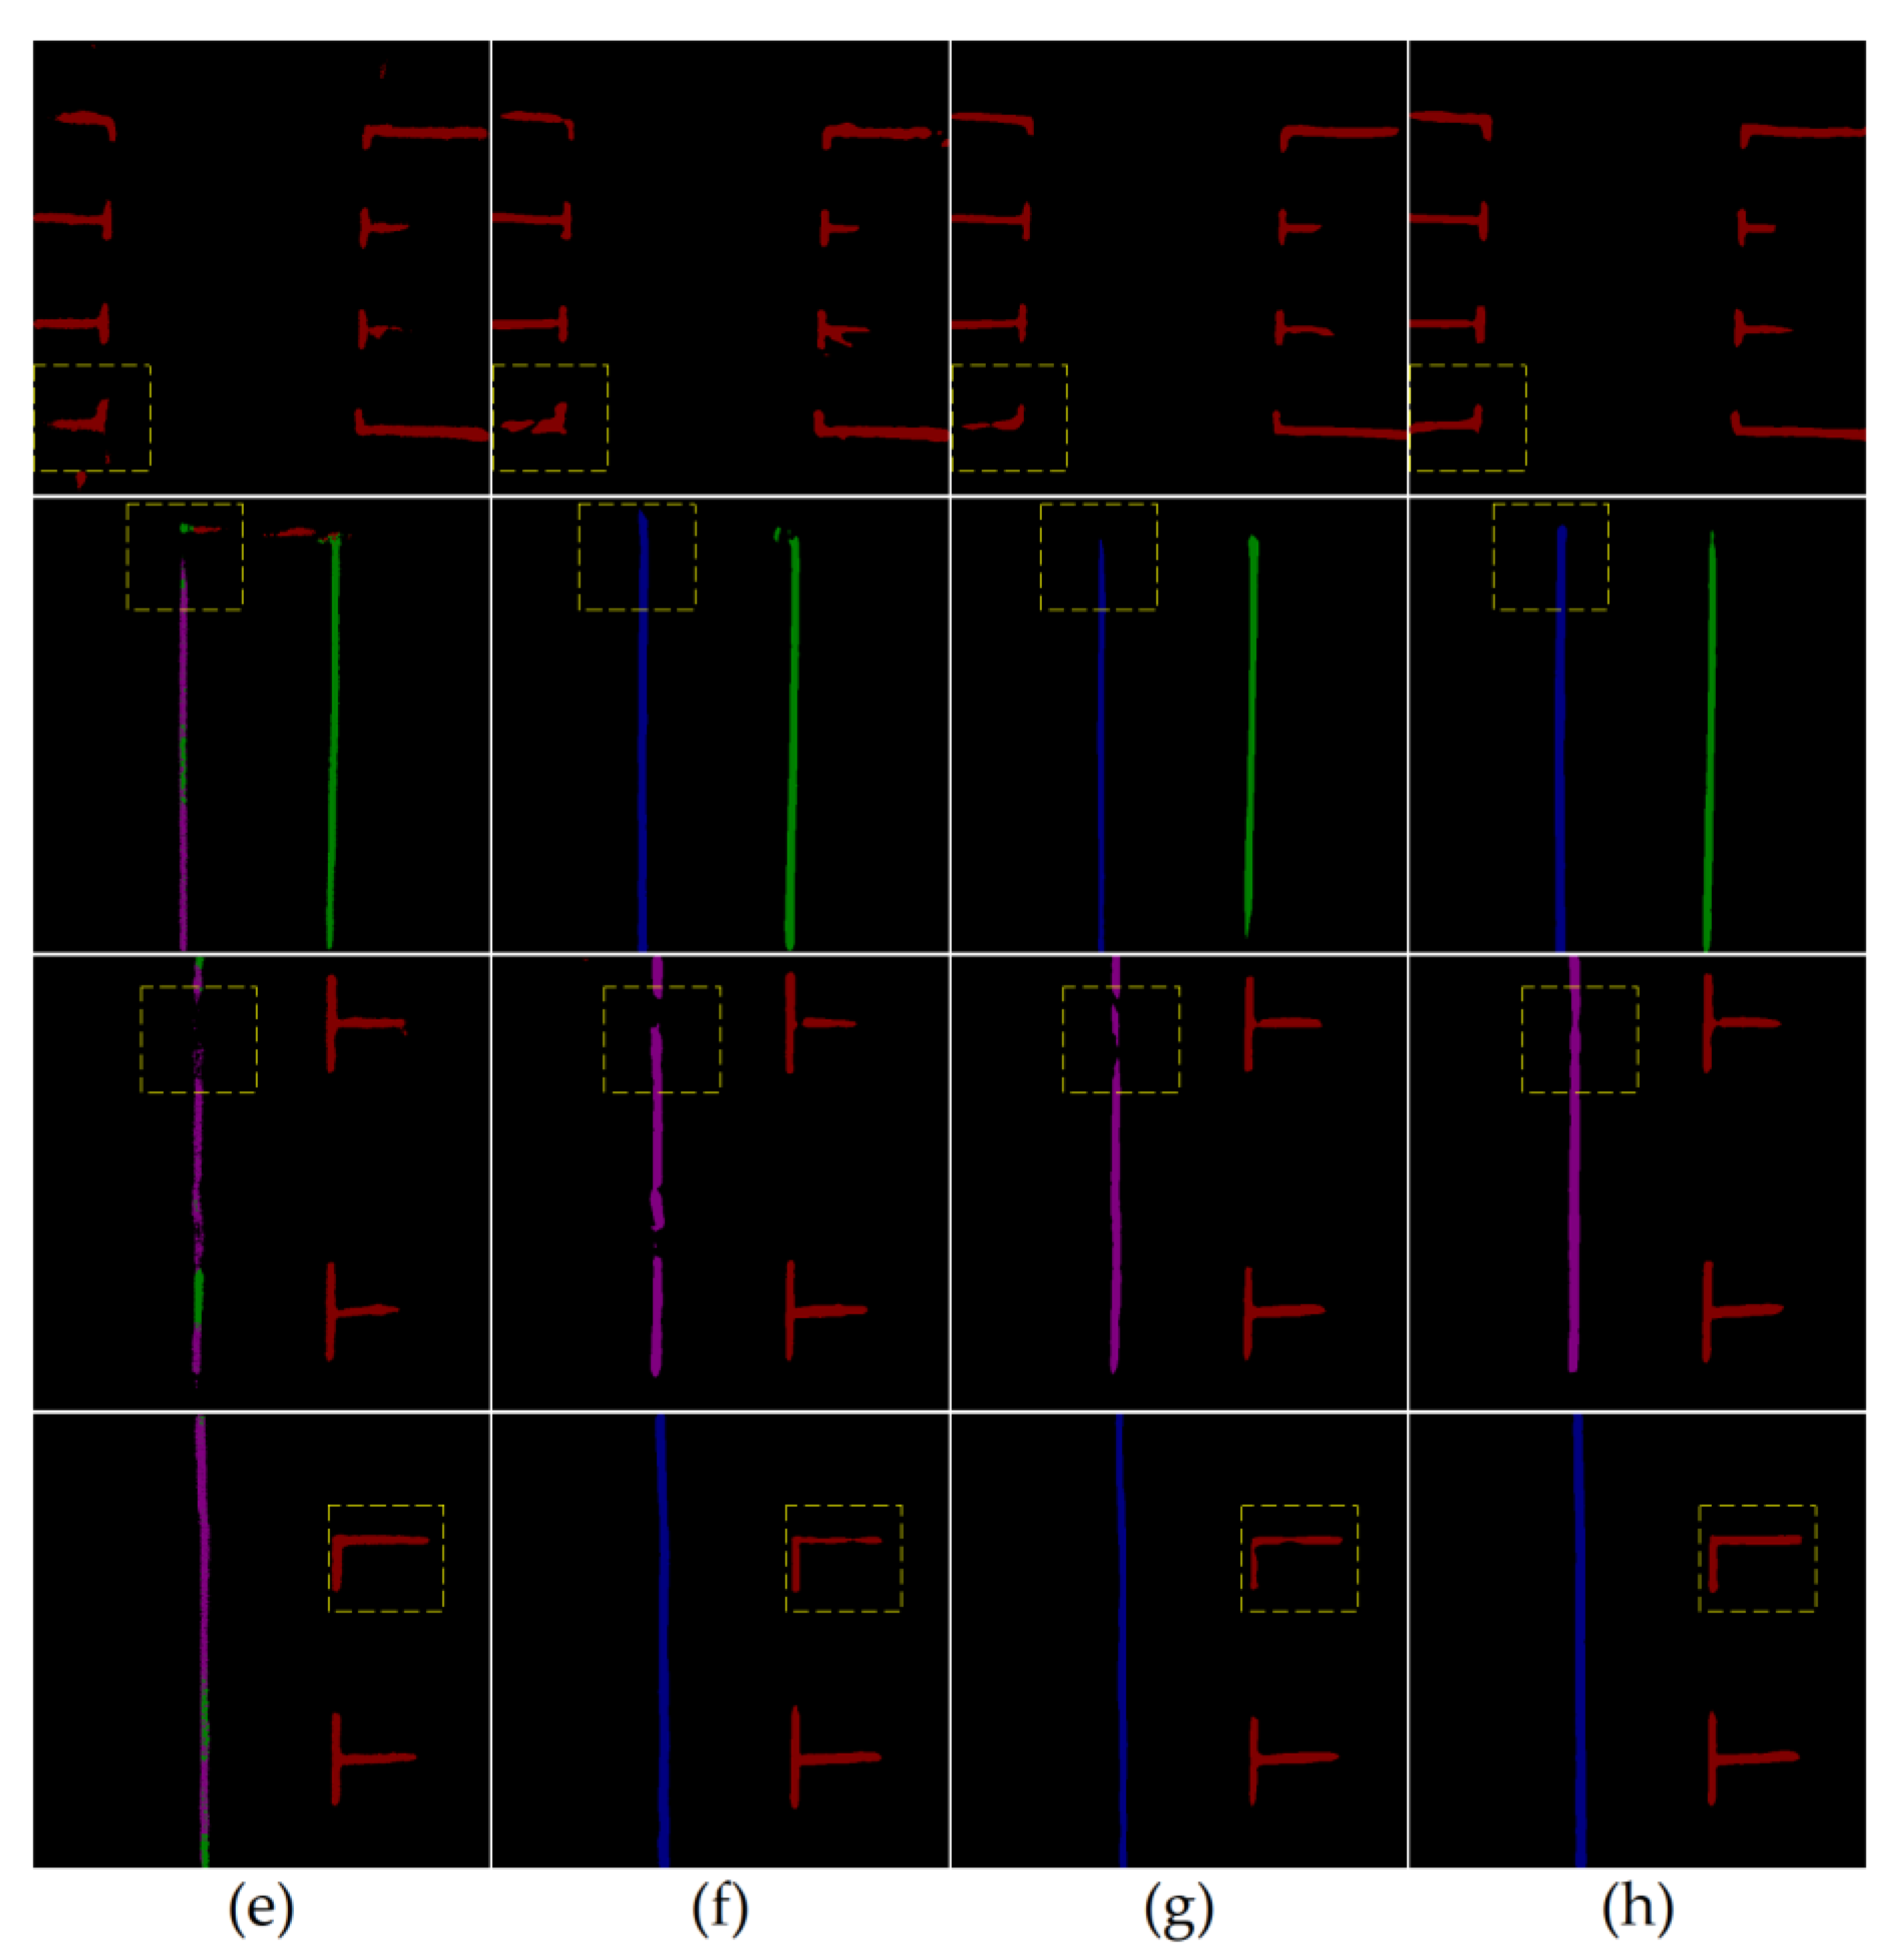
In the PSV dataset, the mIoU cannot be improved simply by increasing the scale of network parameters. In Table 5, the classification accuracies of ENet and U-Net are extremely uneven (more than a five-fold difference). As shown in Figure 5, these networks have insufficient distinguishing abilities in some specific small-scale classifications with the same input images. Increasing the scale of network parameters brings the limited incoming recognition accuracy expectation on specific classifications for these networks. Therefore, we cannot simply adjust the network parameters to achieve a balance between accuracy and speed. None of the comparison networks can achieve a practical balance between accuracy and speed, except for the RPSD which benefits from its two-layers network architecture.
On the one hand, the RPSD engages two network structures with fewer operating parameters than the standard network. The image features can be extracted through the coarse segmentation of the upper-layer network with a reduced size image input and the detailed image features can be extracted from the lower-layer network that is a part of the standard network. Those two methods contribute to the real-time performance of the overall network. On the other hand, fusion of the coarse and detailed features extracted from the upper and lower layers, respectively, significantly improves the segmentation accuracy of the whole network. In Table 3, the mIoU of the RPSD network without the upper-layer network is 48.15% and, in Table 5, the mIoU of the whole RPSD is 67.97%, with a significant increase in the accuracy of the whole network after the fusion. Therefore, the entire RPSD network achieves real-time segmentation while maintaining high accuracy.
Figure 5 shows the inference results comparison of the PSV dataset after the above network training. Columns (a) and (b) are input images and ground truth in the PSV dataset, respectively. The following columns are the contrast networks, including FCN8 [28], U-Net [29], ENet [36], DeeplabV3+ [33], and PSPNet [30], and the last column shows the results of this work. The colors are labeled according to the six classification orders in the PSV dataset. The sequence is black, maroon, green, light brown, navy blue, and purple. Except for the background classification, the inferred image of RPSD is the only one without misclassification, compared to the ground truth. The upper layer of the RPSD network effectively guides the final segmentation result by coarse segmentation of the resized image so that the network avoids misjudgments. Even for small-scale classifications, the application of adaptive weighted loss enables the Yellow Solid classification signed in navy blue to be effectively identified. Combined with the improvement in edge recognition by the CAM, the inference images of the RPSD network are also closer to the ground truth. As can be seen from the figure, the RPSD network’s output is the closest to the ground truth, with correct classification and a precise edge which achieves the best accuracy and mIoU.
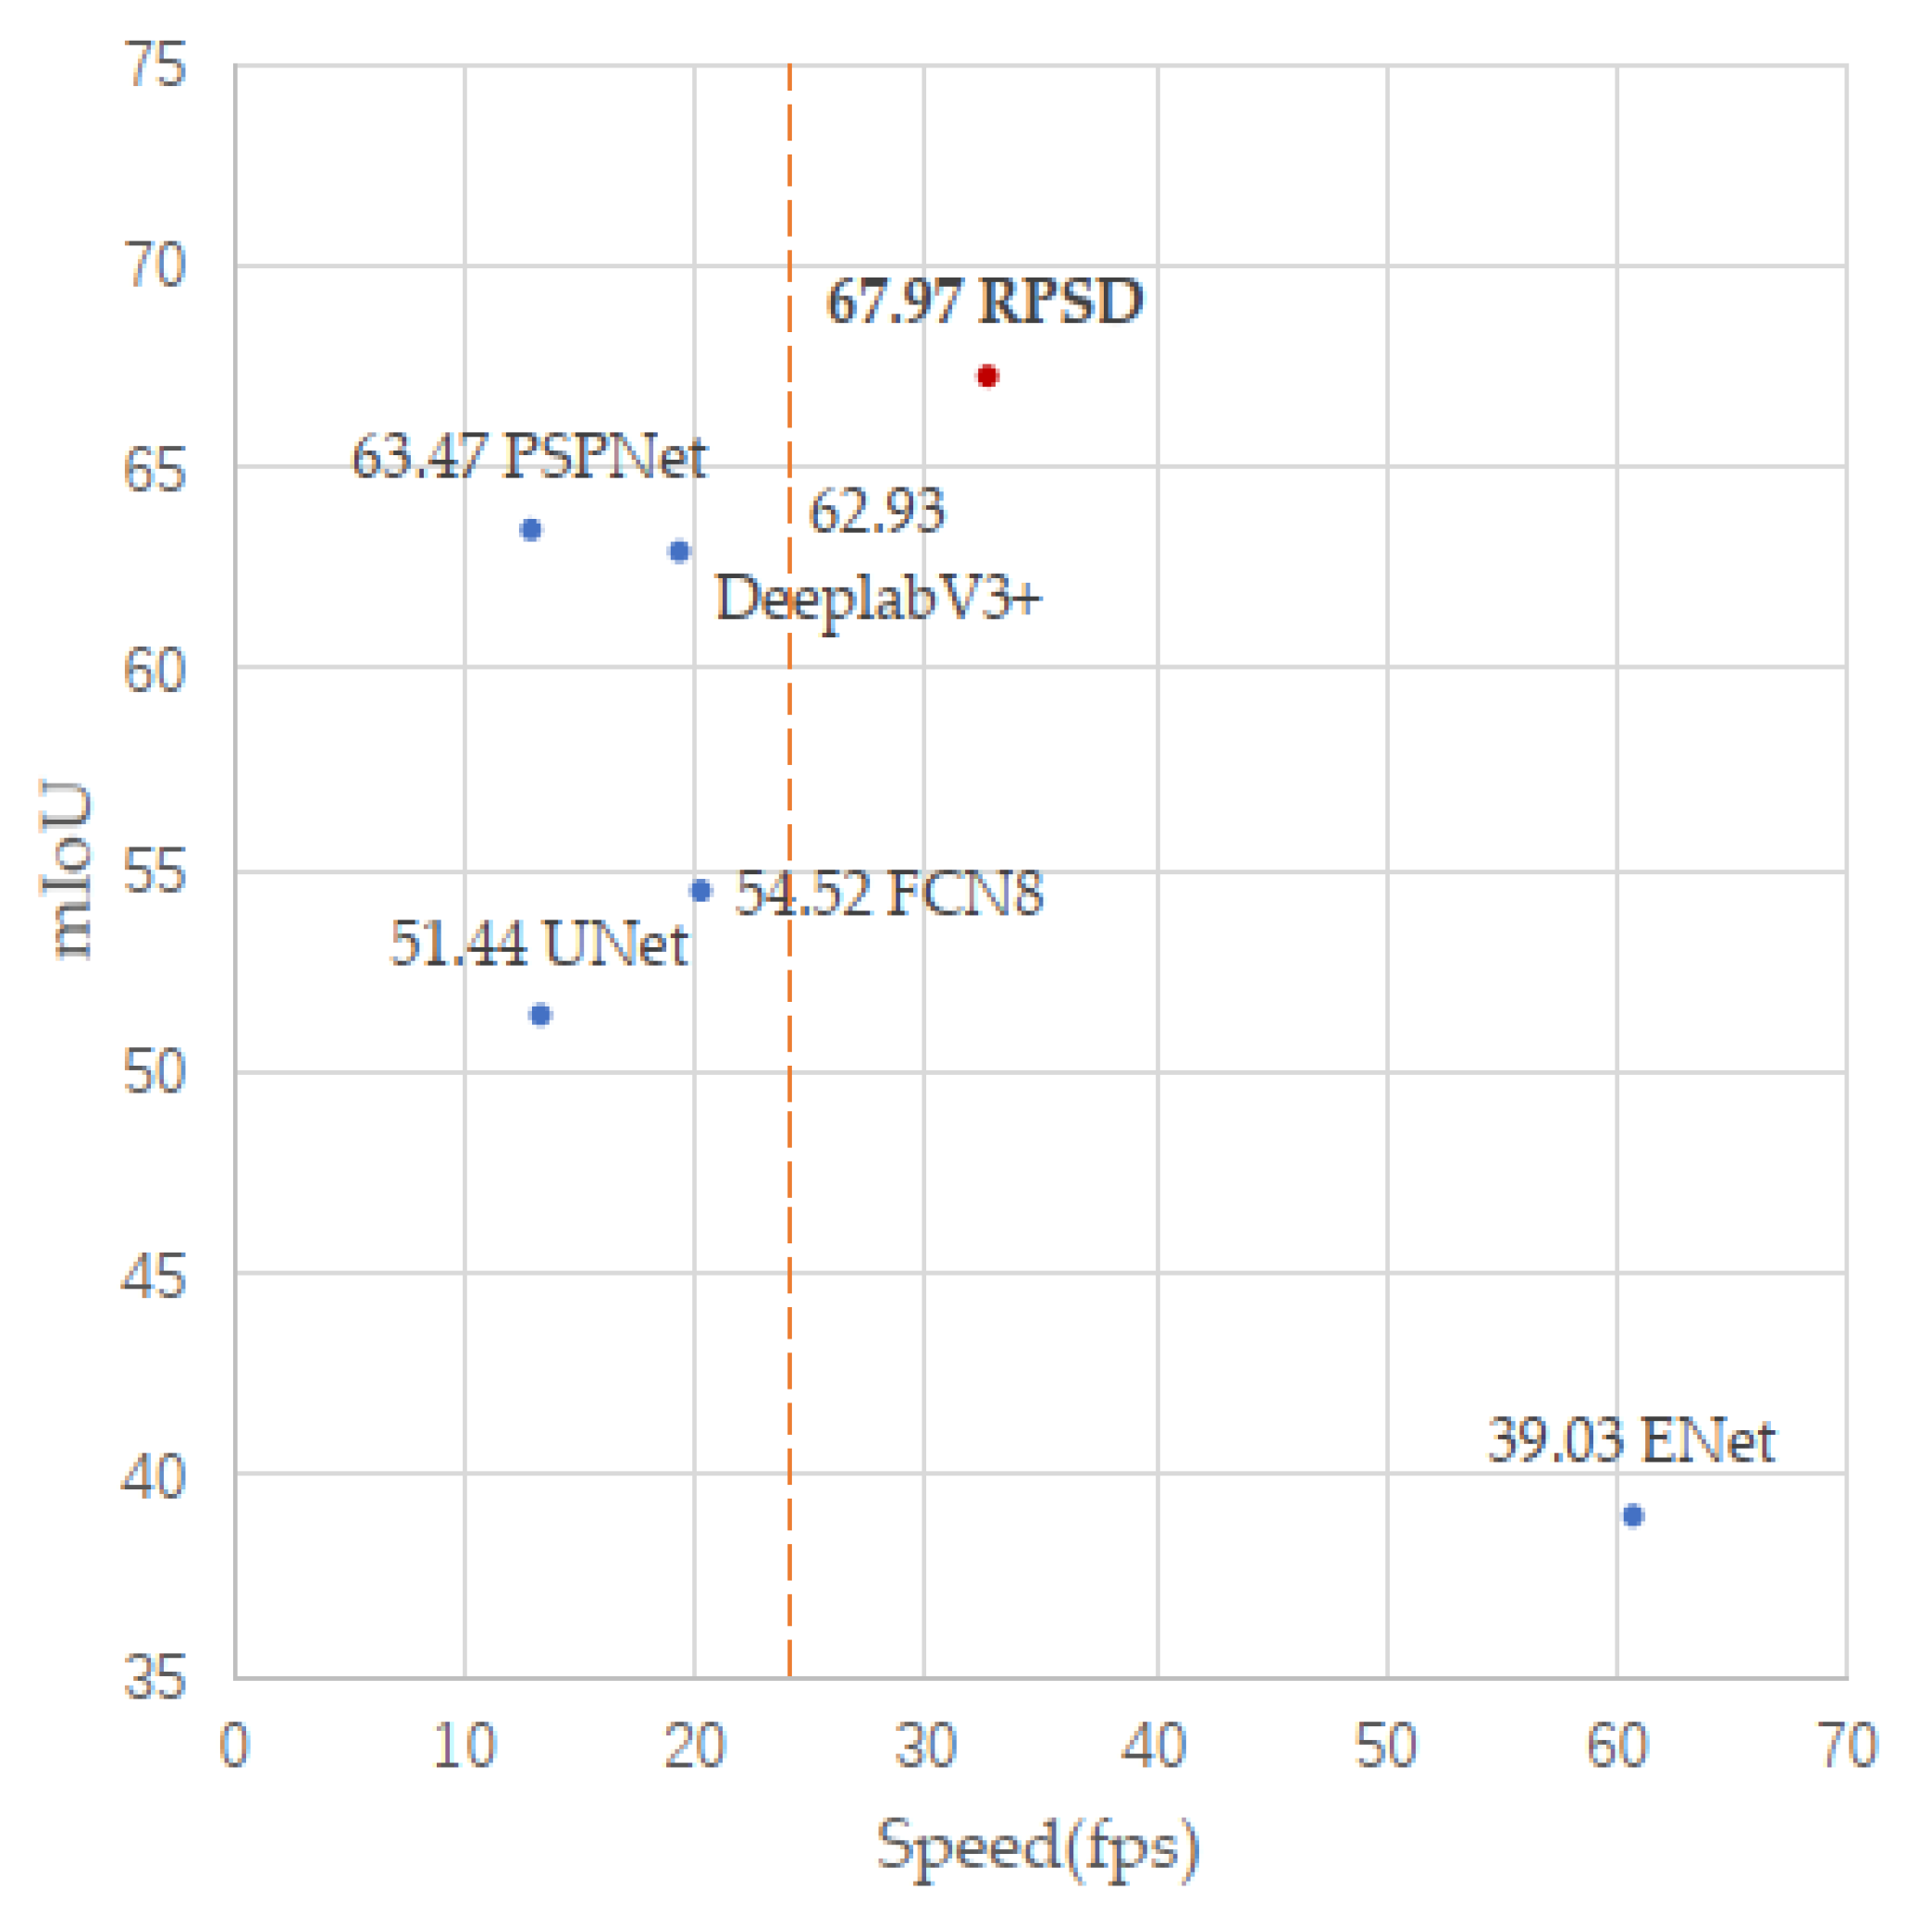
Figure 6 shows the relationship between the accuracy and the inference speed of the experimental networks more intuitively. The horizontal axis is the inference speed and the vertical axis is mIoU. The red dotted line in the figure is the real-time inference line, which performs at the speed of 24 fps. We mark the previous experimental data: the red dot marks the RPSD network result and the blue dots mark the others. From the figure, we can see that only the RPSD network and ENet completed the real-time recognition of parking slots, and the RPSD network is able to lead and achieve the best result in the mIoU ranking.
Finally, the mIoU of the RPSD network achieves 67.97% while guaranteeing real-time performance, which is attributed to the simplification of the upper and lower branches. The data in Table 3 show that the independent contribution of the lower network to accuracy is 48.15%, while the final performance of the entire RPSD network is 67.97% when the upper network is added. This indicates that the fusion of coarse segmentation information from the upper network plays a vital role in supporting the accuracy of the network. Combining the information with Table 1, the RPSD network does not bring more computational load due to the two-layers network branches. The frame rate of the RPSD network in Table 5 is much higher than networks with similar accuracy, directly reflecting the computational effort reduction. The experimental data show that the RPSD network extends the innovative architecture with fast speed and high accuracy, achieving state-of-the-art performance with the PSV dataset.

5. Discussion

The experimental results show that the RPSD network proposed in this paper achieves real-time semantic segmentation and effectively improves detection accuracy for the PSV dataset. The cascade structure effectively reduces the operating parameters of the whole network, realizing the real-time performance requirement. The fusion of the coarse and detailed features extracted from the upper and lower layers significantly improves the segmentation accuracy of the whole network. The channel attention mechanism is engaged in establishing the relationships among the channels, thus improving the mIoU. With the help of adaptive weighted cross-entropy loss, the imbalanced data distribution characteristic of the PSV dataset can also be effectively addressed, thus improving the overall detection accuracy of the network. Compared to the parking slot detection in [24,46], the RPSD network does not need to know the primary parking slot data and has no mandatory restrictions on the size and shape of the parking slot, which makes parking slot detection in different environments more robust as this work is based on a semantic segmentation network. Both the RPSD network and [23] are semantic segmentation methods and the accuracy of the RPSD network in the test set is 67.97%, which is higher than the existing network. The experimental result shows that the proposed network exhibits outstanding accuracy when inferring new input images and possesses good reliability. Compared to the existing methods, the upper-layer network determines the general content of the inferring image through the small input image. At the same time, this model takes advantage of the shallow network of the lower layer to extract the detailed features of the image, which ensures the overall detection accuracy of the network. On this basis, combined with the speed advantages of the two parts of the network, the detection speed is ensured. While improving segmentation accuracy, the RPSD network effectively addresses the practical real-time requirement by reaching 32.69 fps, which benefits from the presented cascade network.
The backbone ResNet50 extracts image features efficiently but the scale of the network parameters is still too large, which affects the network’s speed. Chopping backbone depth and feature map size in the cascade network structure of the RPSD network improves real-time performance. Reducing the network operating parameters by simple methods, such as chopping the network structure, leads to a loss of accuracy. The fusion of the coarse and detailed features extracted from the RPSD’s cascade network structure improves segmentation accuracy. Based on the PSV parking slot detection dataset, more compact backbones should further improve the frame rate while ensuring segmentation accuracy. The method’s effectiveness on the PSV dataset has been demonstrated, opening up a research idea that can be adapted to more application scenarios. For the extraction of small-scale lines in the image, the improvement in accuracy should pay more attention to the continuity of features. However, due to the particularity of the test object itself, the upper limit can be found by analyzing the dataset and improving speed on this basis holds more potential as a direction for development. The proposed network is based on semantic segmentation and the processed images are bird’s-eye view images. The acquisition of the bird’s-eye view image can not only come from the image stitching of the AVM system, but also high-altitude images from aircraft. Although this paper is currently used for extracting ground parking slot information, due to the robustness of the semantic segmentation method, it is believed that this method can also accurately identify other ground information when learning different datasets. The processing method of images and the detection of ground information are highly similar to the identification methods of high-definition remote sensing images in the professional remote sensing field. For example, the target classification is a strip shape with only a few pixels in the background and accounts for a small proportion of the image. Therefore, we believe that the problems solved by this work have a specific value in professional remote sensing.

6. Conclusions

Real-time parking slot detection provides the possibility of AVP, while vision-based panoramic image parking slot detection has better robustness in practical scenarios. This paper proposes a semantic segmentation-based RPSD network to solve real-time parking slot detection in various scenarios effectively. The RPSD network consists of a two-layers cascade network in which the upper-layer network extracts coarse segmentation information through a resized (1/4 of the original size) input image. A network-depth-reduced ResNet50 is engaged in the lower network of the cascade network, and the OFFM fuses the coarse segmentation information of the upper-layer network to achieve real-time parking slot detection with panoramic images. The CAM and an adaptive weighted loss function effectively improve the accuracy of edge detection and imbalanced classification. The analysis and discussion of the experimental data prove that: by chopping backbone depth and input image map size, the total computational load of the cascade network is less than that of the traditional complete network, guaranteeing the real-time performance; the fusion of the coarse and detailed features extracted from the upper and lower layers of the cascade network respectively, improves segmentation accuracy. The final mIoU of this work is 67.97% and the frame rate is up to 32.69 fps, which achieves state-of-the-art performance with the PSV dataset.

Author Contributions

Conceptualization, C.L. and H.S.; methodology, C.L. and Q.Y.; software, C.L.; validation, C.L. and Y.G.; formal analysis, C.L. and F.B.; investigation, C.L. and Y.G.; resources, C.L.; data curation, C.L.; writing—original draft preparation, C.L. and Y.G.; writing—review and editing, C.L., Y.G., H.S., Y.G. and F.B.; supervision, Q.Y. and H.S. All authors have read and agreed to the published version of the manuscript.

Funding

This research received no external funding.

Conflicts of Interest

The authors declare no conflict of interest. The funders had no role in the design of the study; in the collection, analyses, or interpretation of data; in the writing of the manuscript; or in the decision to publish the results.

References

  1. Arnott, R.; Williams, P. Cruising for parking around a circle. Transp. Res. Part B Methodol. 2017, 104, 357–375. [Google Scholar] [CrossRef] [Green Version]
  2. Wada, M.; Yoon, K.S.; Hashimoto, H. Development of advanced parking assistance system. IEEE Trans. Ind. Electron. 2003, 50, 4–17. [Google Scholar] [CrossRef]
  3. Allianz, S.E. A Sudden Bang When Parking. 2015. Available online: https://www.allianz.com/en/press/news/commitment/community/150505-a-sudden-bang-when-parking.html (accessed on 28 April 2020).
  4. Horgan, J.; Hughes, C.; McDonald, J.; Yogamani, S. Vision-Based Driver Assistance Systems: Survey, Taxonomy and Advances. In Proceedings of the 2015 IEEE 18th International Conference on Intelligent Transportation Systems, Gran Canaria, Spain, 15–18 September 2015; pp. 2032–2039. [Google Scholar]
  5. SAE. Taxonomy and Definitions for Terms Related to Driving Automation Systems for On-Road Motor Vehicles; SAE International: Warrendale, PA, USA, 2021. [Google Scholar]
  6. Kotb, A.O.; Shen, Y.-C.; Huang, Y. Smart Parking Guidance, Monitoring and Reservations: A Review. IEEE Intell. Transp. Syst. Mag. 2017, 9, 6–16. [Google Scholar] [CrossRef]
  7. Banzhaf, H.; Nienhüser, D.; Knoop, S.; Zöllner, J.M. The future of parking: A survey on automated valet parking with an outlook on high density parking. In Proceedings of the 2017 IEEE Intelligent Vehicles Symposium (IV), Los Angeles, CA, USA, 11–14 June 2017; pp. 1827–1834. [Google Scholar]
  8. Lin, T.; Rivano, H.; Le Mouel, F. A Survey of Smart Parking Solutions. IEEE Trans. Intell. Transp. Syst. 2017, 18, 3229–3253. [Google Scholar] [CrossRef] [Green Version]
  9. Wada, M.; Yoon, K.; Hashimoto, H.; Matsuda, S. Development of advanced parking assistance system using human guidance. In Proceedings of the 1999 IEEE/ASME International Conference on Advanced Intelligent Mechatronics (Cat. No. 99TH8399), Atlanta, GA, USA, 19–23 September 1999; pp. 997–1002. [Google Scholar]
  10. Zadobrischi, E. Analysis and Experiment of Wireless Optical Communications in Applications Dedicated to Mobile Devices with Applicability in the Field of Road and Pedestrian Safety. Sensors 2022, 22, 1023. [Google Scholar] [CrossRef] [PubMed]
  11. Zadobrischi, E.; Dimian, M. Inter-Urban Analysis of Pedestrian and Drivers through a Vehicular Network Based on Hybrid Communications Embedded in a Portable Car System and Advanced Image Processing Technologies. Remote Sens. 2021, 13, 1234. [Google Scholar] [CrossRef]
  12. Naudts, D.; Maglogiannis, V.; Hadiwardoyo, S.; van den Akker, D.; Vanneste, S.; Mercelis, S.; Hellinckx, P.; Lannoo, B.; Marquez-Barja, J.; Moerman, I. Vehicular Communication Management Framework: A Flexible Hybrid Connectivity Platform for CCAM Services. Future Internet 2021, 13, 81. [Google Scholar] [CrossRef]
  13. Zhang, L.; Huang, J.; Li, X.; Xiong, L. Vision-based Parking-slot Detection: A DCNN-based Approach and A Large-scale Benchmark Dataset. IEEE Trans. Image Process. 2018, 27, 5350–5364. [Google Scholar] [CrossRef]
  14. Krizhevsky, A.; Sutskever, I.; Hinton, G.E. Imagenet classification with deep convolutional neural networks. NIPS 2012, 25, 1097–1105. [Google Scholar] [CrossRef]
  15. Redmon, J.; Divvala, S.; Girshick, R.; Farhadi, A. You only Look Once: Unified, Real-Time Object Detection. In Proceedings of the 2016 IEEE Conference on Computer Vision and Pattern Recognition (CVPR), Las Vegas, NV, USA, 27–30 June 2016; pp. 779–788. [Google Scholar]
  16. Redmon, J.; Farhadi, A. YOLO9000: Better, Faster, Stronger. In Proceedings of the 2017 IEEE Conference on Computer Vision and Pattern Recognition (CVPR), Honolulu, HI, USA, 21–26 July 2017; pp. 6517–6525. [Google Scholar]
  17. Zhang, L.; Li, X.; Huang, J.; Shen, Y.; Wang, D. Vision-Based Parking-Slot Detection: A Benchmark and a Learning-Based Approach. Symmetry 2018, 10, 64. [Google Scholar] [CrossRef] [Green Version]
  18. Long, J.; Shelhamer, E.; Darrell, T. Fully convolutional networks for semantic segmentation. In Proceedings of the IEEE Conference on Computer Vision and Pattern Recognition, Boston, MA, USA, 8–10 June 2015; pp. 3431–3440. [Google Scholar]
  19. Li, W.; Cao, L.; Yan, L.; Li, C.; Feng, X.; Zhao, P. Vacant Parking Slot Detection in the Around View Image Based on Deep Learning. Sensors 2020, 20, 2138. [Google Scholar] [CrossRef] [PubMed] [Green Version]
  20. Schneider, L.; Cordts, M.; Rehfeld, T.; Pfeiffer, D.; Enzweiler, M.; Franke, U.; Pollefeys, M.; Roth, S. Semantic stixels: Depth is not enough. In Proceedings of the 2016 IEEE Intelligent Vehicles Symposium (IV), Gothenburg, Sweden, 19–22 June 2016; pp. 110–117. [Google Scholar]
  21. Wu, Z.; Sun, W.; Wang, M.; Wang, X.; Ding, L.; Wang, F. PSDet: Efficient and Universal Parking Slot Detection. In Proceedings of the 2020 IEEE Intelligent Vehicles Symposium (IV), Las Vegas, NV, USA, 19 October 2020–13 November 2020; pp. 290–297. [Google Scholar]
  22. Wu, Y.; Yang, T.; Zhao, J.; Guan, L.; Jiang, W. Vh-hfcn based parking slot and lane markings segmentation on panoramic surround view. In Proceedings of the 2018 IEEE Intelligent Vehicles Symposium (IV), Changshu, China, 26–30 June 2018; pp. 1767–1772. [Google Scholar]
  23. Jiang, W.; Wu, Y.; Guan, L.; Zhao, J. Dfnet: Semantic segmentation on panoramic images with dynamic loss weights and residual fusion block. In Proceedings of the 2019 International Conference on Robotics and Automation (ICRA), Montreal, QC, Canada, 20–24 May 2019; pp. 5887–5892. [Google Scholar]
  24. Zadobrischi, E.; Dimian, M.; Negru, M. The Utility of DSRC and V2X in Road Safety Applications and Intelligent Parking: Similarities, Differences, and the Future of Vehicular Communication. Sensors 2021, 21, 7237. [Google Scholar] [CrossRef] [PubMed]
  25. Pan, X.; Shi, J.; Luo, P.; Wang, X.; Tang, X. Spatial as deep: Spatial cnn for traffic scene understanding. In Proceedings of the Thirty-Second AAAI Conference on Artificial Intelligence, New Orleans, LA, USA, 2–7 February 2018. [Google Scholar]
  26. Lee, S.; Kim, J.; Shin Yoon, J.; Shin, S.; Bailo, O.; Kim, N.; Lee, T.-H.; Seok Hong, H.; Han, S.-H.; So Kweon, I. Vpgnet: Vanishing point guided network for lane and road marking detection and recognition. In Proceedings of the IEEE International Conference on Computer Vision, Venice, Italy, 22–29 October 2017; pp. 1947–1955. [Google Scholar]
  27. Wang, Z.; Ren, W.; Qiu, Q. Lanenet: Real-time lane detection networks for autonomous driving. arXiv 2018, arXiv:1807.01726. [Google Scholar]
  28. Hou, Y.; Ma, Z.; Liu, C.; Loy, C.C. Learning lightweight lane detection cnns by self attention distillation. In Proceedings of the IEEE/CVF International Conference on Computer Vision, Seoul, Korea, 27 October–2 November 2019; pp. 1013–1021. [Google Scholar]
  29. Yan, M.; Wang, J.; Li, J.; Zhang, K.; Yang, Z. Traffic scene semantic segmentation using self-attention mechanism and bi-directional GRU to correlate context. Neurocomputing 2020, 386, 293–304. [Google Scholar] [CrossRef]
  30. Li, J.; Jiang, F.; Yang, J.; Kong, B.; Gogate, M.; Dashtipour, K.; Hussain, A. Lane-DeepLab: Lane semantic segmentation in automatic driving scenarios for high-definition maps. Neurocomputing 2021, 465, 15–25. [Google Scholar] [CrossRef]
  31. Aznar-Poveda, J.; Egea-López, E.; García-Sánchez, A.-J. Cooperative Awareness Message Dissemination in EN 302 637-2: An Adaptation for Winding Roads. In Proceedings of the 2020 IEEE 91st Vehicular Technology Conference (VTC2020-Spring), Antwerp, Belgium, 25–28 May 2020; pp. 1–5. [Google Scholar]
  32. Jang, C.; Kim, C.; Lee, S.; Kim, S.; Lee, S.; Sunwoo, M. Re-Plannable Automated Parking System With a Standalone Around View Monitor for Narrow Parking Lots. IEEE Trans. Intell. Transp. Syst. 2020, 21, 777–790. [Google Scholar] [CrossRef]
  33. Kumar, V.R.; Hiremath, S.A.; Bach, M.; Milz, S.; Witt, C.; Pinard, C.; Yogamani, S.; Mäder, P. Fisheyedistancenet: Self-supervised scale-aware distance estimation using monocular fisheye camera for autonomous driving. In Proceedings of the 2020 IEEE International Conference on Robotics and Automation (ICRA), Paris, France, 31 May–31 August 2020; pp. 574–581. [Google Scholar]
  34. Lai, C.; Luo, W.; Chen, S.; Li, Q.; Yang, Q.; Sun, H.; Zheng, N. Zynq-based full HD around view monitor system for intelligent vehicle. In Proceedings of the 2017 Asia-Pacific Signal and Information Processing Association Annual Summit and Conference (APSIPA ASC), Kuala Lumpur, Malaysia, 12–15 December 2017; pp. 1079–1082. [Google Scholar]
  35. Liu, Y.-C.; Lin, K.-Y.; Chen, Y.-S. Bird’s-eye view vision system for vehicle surrounding monitoring. In Proceedings of the International Workshop on Robot Vision, Auckland, New Zealand, 18–20 February 2008; pp. 207–218. [Google Scholar]
  36. Andrew, A.M. Multiple view geometry in computer vision. Kybernetes 2001, 30, 1333–1341. [Google Scholar] [CrossRef]
  37. Liu, W.; Xu, Z. Some practical constraints and solutions for optical camera communication. Philos. Trans. A Math. Phys. Eng. Sci. 2020, 378, 20190191. [Google Scholar] [CrossRef] [Green Version]
  38. Hughes, C.; Jones, E.; Glavin, M.; Denny, P. Validation of polynomial-based equidistance fish-eye models. In Proceedings of the IET Irish Signals and Systems Conference (ISSC 2009), Dublin, Ireland, 10–11 June 2009. [Google Scholar]
  39. Zhang, Z. A flexible new technique for camera calibration. IEEE Trans. Pattern Anal. Mach. Intell. 2000, 22, 1330–1334. [Google Scholar] [CrossRef] [Green Version]
  40. Hughes, C.; Denny, P.; Jones, E.; Glavin, M. Accuracy of fish-eye lens models. Appl. Opt. 2010, 49, 3338–3347. [Google Scholar] [CrossRef] [Green Version]
  41. Suhr, J.K.; Jung, H.G. Fully-automatic recognition of various parking slot markings in Around View Monitor (AVM) image sequences. In Proceedings of the 2012 15th International IEEE Conference on Intelligent Transportation Systems, Anchorage, AK, USA, 16–19 September 2012; pp. 1294–1299. [Google Scholar]
  42. Suhr, J.K.; Jung, H.G. Sensor Fusion-Based Vacant Parking Slot Detection and Tracking. IEEE Trans. Intell. Transp. Syst. 2014, 15, 21–36. [Google Scholar] [CrossRef]
  43. Suhr, J.K.; Jung, H.G. Automatic Parking Space Detection and Tracking for Underground and Indoor Environments. IEEE Trans. Ind. Electron. 2016, 63, 5687–5698. [Google Scholar] [CrossRef]
  44. Ronneberger, O.; Fischer, P.; Brox, T. U-net: Convolutional networks for biomedical image segmentation. In Proceedings of the International Conference on Medical Image Computing and Computer-Assisted Intervention, Munich, Germany, 5–9 October 2015; pp. 234–241. [Google Scholar]
  45. Zhao, H.; Shi, J.; Qi, X.; Wang, X.; Jia, J. Pyramid Scene Parsing Network. In Proceedings of the 2017 IEEE Conference on Computer Vision and Pattern Recognition (CVPR), Honolulu, HI, USA, 21–26 July 2017; pp. 6230–6239. [Google Scholar]
  46. Chen, L.-C.; Papandreou, G.; Kokkinos, I.; Murphy, K.; Yuille, A.L. Semantic image segmentation with deep convolutional nets and fully connected crfs. arXiv 2014, arXiv:1412.7062. [Google Scholar]
  47. Chen, L.-C.; Papandreou, G.; Schroff, F.; Adam, H. Rethinking atrous convolution for semantic image segmentation. arXiv 2017, arXiv:1706.05587. [Google Scholar]
  48. Chen, L.-C.; Zhu, Y.; Papandreou, G.; Schroff, F.; Adam, H. Encoder-decoder with atrous separable convolution for semantic image segmentation. In Proceedings of the European Conference on Computer Vision (ECCV), Munich, Germany, 8–14 September 2018; pp. 801–818. [Google Scholar]
  49. Chen, L.C.; Papandreou, G.; Kokkinos, I.; Murphy, K.; Yuille, A.L. DeepLab: Semantic Image Segmentation with Deep Convolutional Nets, Atrous Convolution, and Fully Connected CRFs. IEEE Trans. Pattern Anal. Mach. Intell. 2018, 40, 834–848. [Google Scholar] [CrossRef] [PubMed] [Green Version]
  50. Badrinarayanan, V.; Kendall, A.; Cipolla, R. Segnet: A deep convolutional encoder-decoder architecture for image segmentation. IEEE Trans. Pattern Anal. Mach. Intell. 2017, 39, 2481–2495. [Google Scholar] [CrossRef] [PubMed]
  51. Paszke, A.; Chaurasia, A.; Kim, S.; Culurciello, E. Enet: A deep neural network architecture for real-time semantic segmentation. arXiv 2016, arXiv:1606.02147. [Google Scholar]
  52. Zhao, H.; Qi, X.; Shen, X.; Shi, J.; Jia, J. Icnet for real-time semantic segmentation on high-resolution images. In Proceedings of the European Conference on Computer Vision (ECCV), Munich, Germany, 8–14 September 2018; pp. 405–420. [Google Scholar]
  53. Yang, T.; Wu, Y.; Zhao, J.; Guan, L. Semantic Segmentation via Highly Fused Convolutional Network with Multiple Soft Cost Functions. Cogn. Syst. Res. 2018, 53, 20–30. [Google Scholar] [CrossRef] [Green Version]
  54. Vaswani, A.; Shazeer, N.; Parmar, N.; Uszkoreit, J.; Jones, L.; Gomez, A.N.; Kaiser, L.; Polosukhin, I. Attention is all you need. arXiv 2017, arXiv:1706.03762. [Google Scholar]
  55. Zhang, H.; Goodfellow, I.; Metaxas, D.; Odena, A. Self-attention generative adversarial networks. In Proceedings of the International Conference on Machine Learning, Long Beach, CA, USA, 9–15 June 2019; pp. 7354–7363. [Google Scholar]
  56. Wang, X.; Girshick, R.; Gupta, A.; He, K. Non-local neural networks. In Proceedings of the IEEE Conference on Computer Vision and Pattern Recognition, Salt Lake City, UT, USA, 18–22 June 2018; pp. 7794–7803. [Google Scholar]
  57. Peng, C.; Zhang, X.; Yu, G.; Luo, G.; Sun, J. Large Kernel Matters—Improve Semantic Segmentation by Global Convolutional Network. In Proceedings of the 2017 IEEE Conference on Computer Vision and Pattern Recognition (CVPR), Honolulu, HI, USA, 21–26 July 2017; pp. 1743–1751. [Google Scholar]
  58. Sun, K.; Zhao, Y.; Jiang, B.; Cheng, T.; Xiao, B.; Liu, D.; Mu, Y.; Wang, X.; Liu, W.; Wang, J. High-resolution representations for labeling pixels and regions. arXiv 2019, arXiv:1904.04514. [Google Scholar]
  59. Yuan, Y.; Chen, X.; Wang, J. Object-Contextual Representations for Semantic Segmentation; Springer: Cham, Switzerland, 2019. [Google Scholar]
  60. Hu, P.; Perazzi, F.; Heilbron, F.C.; Wang, O.; Lin, Z.; Saenko, K.; Sclaroff, S.; Letters, A. Real-time semantic segmentation with fast attention. IEEE Robot. Autom. Lett. 2020, 6, 263–270. [Google Scholar] [CrossRef]
  61. Cordts, M.; Omran, M.; Ramos, S.; Rehfeld, T.; Enzweiler, M.; Benenson, R.; Franke, U.; Roth, S.; Schiele, B. The Cityscapes Dataset for Semantic Urban Scene Understanding. In Proceedings of the 2016 IEEE Conference on Computer Vision and Pattern Recognition (CVPR), Las Vegas, NV, USA, 27–30 June 2016; pp. 3213–3223. [Google Scholar]
  62. Everingham, M.; Van Gool, L.; Williams, C.K.I.; Winn, J.; Zisserman, A. The Pascal Visual Object Classes (VOC) Challenge. Int. J. Comput. Vis. 2009, 88, 303–338. [Google Scholar] [CrossRef] [Green Version]
  63. He, K.; Zhang, X.; Ren, S.; Sun, J. Deep Residual Learning for Image Recognition. In Proceedings of the 2016 IEEE Conference on Computer Vision and Pattern Recognition (CVPR), Las Vegas, NV, USA, 27–30 June 2016; pp. 770–778. [Google Scholar]
  64. Fu, J.; Liu, J.; Tian, H.; Li, Y.; Bao, Y.; Fang, Z.; Lu, H. Dual Attention Network for Scene Segmentation. In Proceedings of the 2019 IEEE/CVF Conference on Computer Vision and Pattern Recognition (CVPR), Long Beach, CA, USA, 15–20 June 2019; pp. 3141–3149. [Google Scholar]
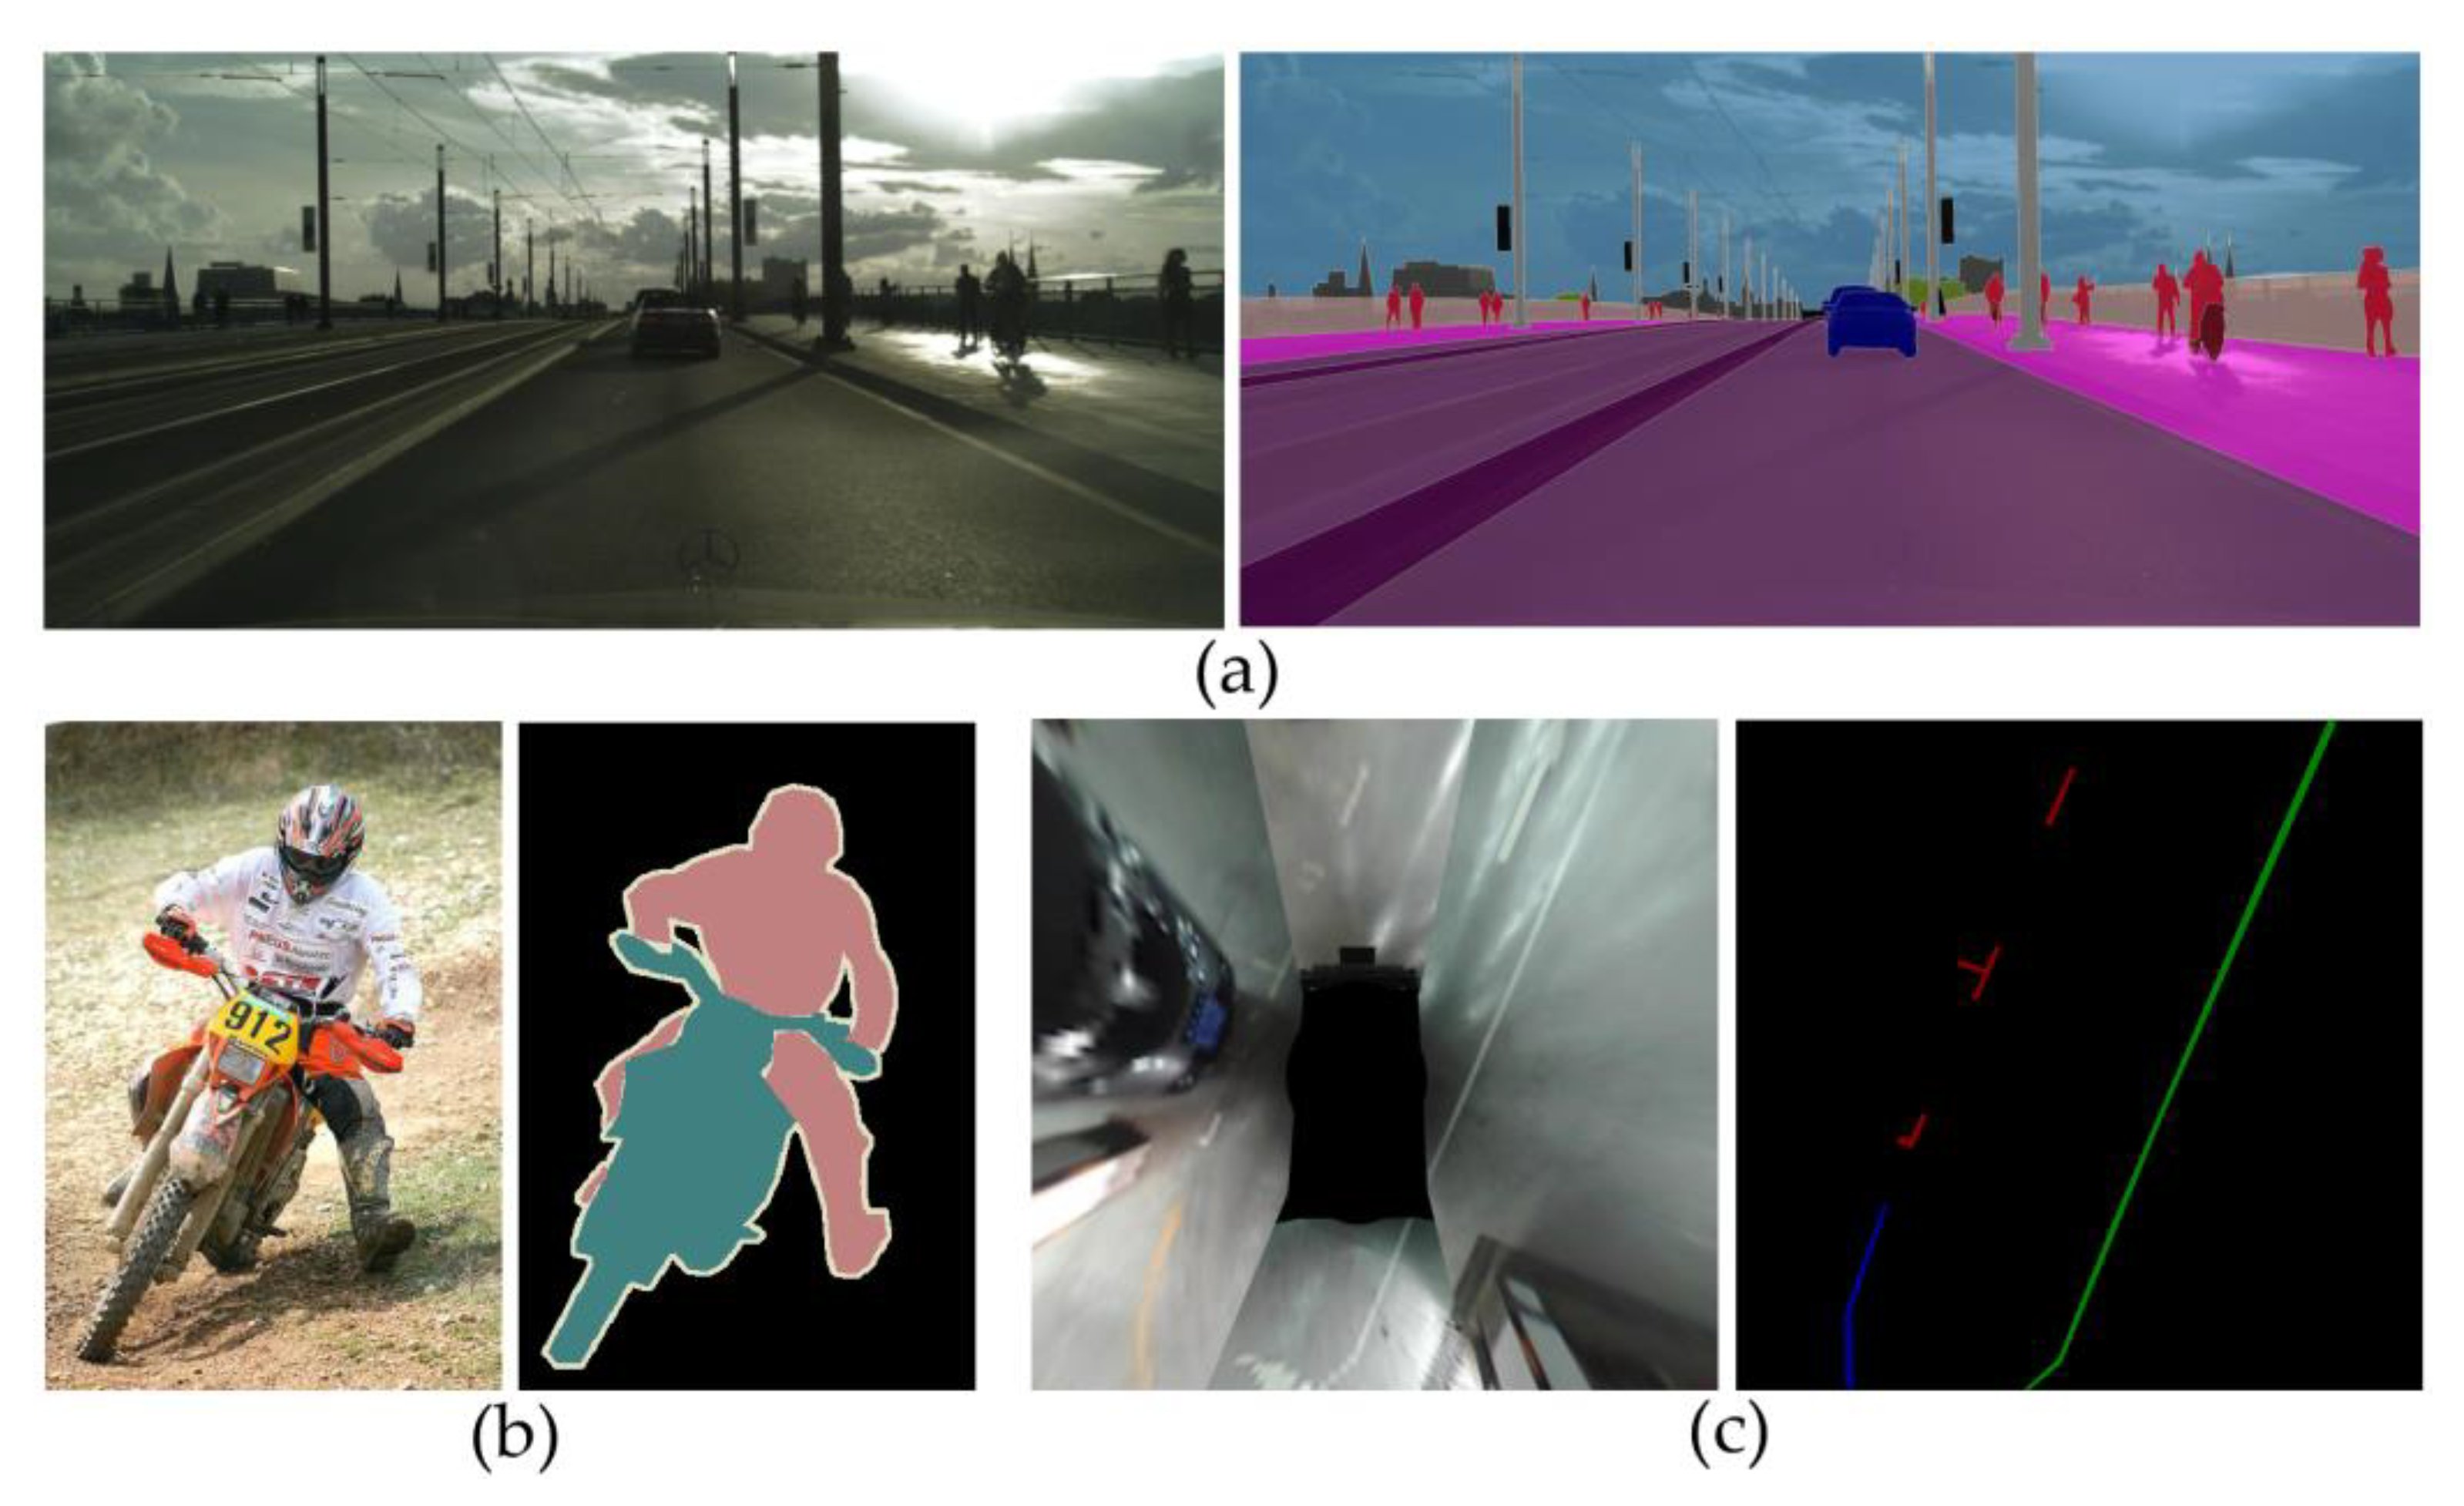
Figure 1. Multi-dataset image content comparison. In this figure, the general semantic segmentation datasets: (a) Cityscapes; (b) Pascal VOC2012; and (c) the PSV parking slot detection dataset used in this study are shown, respectively. In the Cityscapes and Pascal VOC2012 datasets, the labeled ground truth parts account for most of the entire image. However, in the PSV dataset, most of the images are background and only small parts are labeled.
Remotesensing 14 03874 g001
Figure 2. The overall structure of the RPSD network. The network is composed of two layers and the blue dashed boxes in the figure mark the respective parts of the two layers. The red wireframe represents the backbones, the ResNet50 and the ResNetly2 for the upper and lower layers, respectively. The figure shows the 1/4 input image and full-size input image for the upper and lower layers and the inferred full-size output image.
Remotesensing 14 03874 g002
Figure 3. The structure of the OFFM. The yellow parts are the size of the input feature map. The blue parts are the internal compositions of the OFFM. B is the batch size. The figure shows that the 256 input channels of the upper-layer and the 512 input channels of the lower-layer are convoluted by 3 × 3 kernels. Finally, a 256-channel output feature map is generated by 3 × 3 convolution.
Remotesensing 14 03874 g003
Figure 4. The structure of the CAM. Q, K, and V in the figure are Query (Q), Key (K), and Value (V), respectively, from the input feature maps. The blue fonts are the calculation process and the bold fonts indicate the feature map size in different stages.
Remotesensing 14 03874 g004
Figure 5. The final segmentation results of multiple algorithms. In the figure, (a) and (b) are the input image and ground truth in the PSV dataset, respectively, followed by inference images of FCN8 (c), U-Net (d), ENet (e), DeeplabV3+ (f), PSPNet (g), and our result (h) in the last column. In order to more clearly show the inference ability of each network for the PSV dataset and facilitate the observation for readers, we have marked the parts in the inference image that significantly differ from the ground truth with a yellow dotted box. The figure shows that the network’s accuracy in the front part is relatively low, and there is a mislabeling problem. The network in this paper has the highest accuracy and mIoU which is closest to the ground truth.
Remotesensing 14 03874 g005aRemotesensing 14 03874 g005b
Figure 6. The performance of each network’s Speed and mIoU. The x-axis is Speed, the y-axis is mIoU, and the red dotted line is the real-time dividing line (when the network inferred frame rate is 24). The red dot in the image is the output result of our network. The network has reached the highest mIoU for the PSV dataset and has real-time performance with an inferred frame rate of 32 frames.
Remotesensing 14 03874 g006
Table 1. Network calculations under different backbones and inputs.
MethodsTotal ParamsTotal Flops (GFlops)Total MAdd (GMAdd)
ResNet50_60025,557,03228.5857.04
ResNetly2_6001,444,92812.3924.7
ResNet50_30025,557,0326.6313.23
Table 2. Network time consumption under different backbones and inputs.
MethodsTotal Time (s)Speed (fps)
ResNet50_600100.8999.12
ResNetly2_60063.66157.08
ResNet50_30031.39318.57
Table 3. Influence of CAM on pixel accuracy and mIoU.
MethodsPixel_AccumIoUSpeed (ms)
w/o Att.98.34%47.06%20
Channel-att.98.41%48.15%21
Table 4. Improvement of small proportion category by adaptive weighted cross-entropy.
MethodsWhite DashedYellow Solid
w/o apt weight loss25.38%49.93%
apt weight loss27.19%51.25%
Table 5. Predicted mIoU and inference time for the PSV test set with the reference models.
MethodsBackgroundParkingWhite SolidWhite DashedYellow SolidYellow DashedPixel AccumIoUSpeed (fps)
FCN8 [28]98.0549.5949.1327.7550.4352.1598.0754.5220.24
U-Net [29]98.9162.3061.2811.0125.8749.2498.8751.4413.28
ENet [36]98.5650.2645.970.000.0039.4598.4239.0360.71
DeeplabV3+ [33]98.8260.5160.7232.0070.2955.2098.8462.9319.31
PSPNet [30]98.9263.5662.3835.0268.1652.7798.9363.4712.87
VH-HFCN [10]96.2236.1639.5621.4647.6438.0396.2546.51<2.78 1
DFNet [27]98.4558.4059.8049.9068.3264.3298.4766.539.09 2
RPSD (this work)99.0065.3664.9536.3771.5970.5799.0167.9732.69
1 The inference time or frame rate of VH-HFCN was not mentioned in [10]. VH-HFCN is based on HFCN and divides the up-sampling operation on the feature maps into five steps. HFCN extends FCCN with a highly fused network. Each image takes about 0.36 s to process when evaluated in FCCN. Therefore, as an extension of FCCN, the parameters of VH-HFCN are much larger than FCCN, and the running time should also be longer than 0.36 s. 2 The inference time or frame rate of DFNet was not mentioned in [27]. According to the description in [27], we implemented the network structure of DFNet and tested the inference time.
Publisher’s Note: MDPI stays neutral with regard to jurisdictional claims in published maps and institutional affiliations.