Article

Remote Estimation of the Particulate Phosphorus Concentrations in Inland Water Bodies: A Case Study in Hongze Lake

1
Jiangsu Collaborative Innovation Center of Regional Modern Agriculture & Environmental Protection, Huaiyin Normal University, Huai’an 223300, China
2
Jiangsu Key Laboratory for Eco-Agricultural Biotechnology around Hongze Lake, Huaiyin Normal University, Huai’an 223300, China
3
Jiangsu Engineering Research Center for Cyanophytes Forecast and Ecological Restoration of Hongze Lake, Huaiyin Normal University, Huai’an 223300, China
4
Nanjing Institute of Geography and Limnology, Chinese Academy of Sciences, Nanjing 210008, China
5
Key Laboratory of Virtual Geographic Environment of Education Ministry, Nanjing Normal University, Nanjing 210046, China
*
Author to whom correspondence should be addressed.
Remote Sens. 2022, 14(16), 3863; https://doi.org/10.3390/rs14163863
Submission received: 12 July 2022 / Revised: 31 July 2022 / Accepted: 7 August 2022 / Published: 9 August 2022
(This article belongs to the Special Issue Remote Sensing of Wetlands and Biodiversity)

Abstract

:
Phosphorus is the most important nutrient associated with lake eutrophication and changes in cyanobacterial blooms, and particulate phosphorus (PP) is the main form of phosphorus found in highly turbid inland waters. Therefore, it is urgent to monitor PP concentrations in inland water bodies. In this study, we take Hongze Lake as the research area and establish a semianalytical model to estimate PP concentrations based on the total particle absorption coefficient (ap); the mean absolute percentage error (MAPE) and root-mean-square error (RMSE) values, which indicate the model accuracy, were 14.90% and 0.009 mg/L, respectively. In addition, the construction process and parameter selection criteria of the remote sensing-based PP concentration estimation model were derived using remote sensing data obtained at different spectral resolutions. Sentinel 3 Ocean and Land Color Instrument (OLCI) and Landsat 9 Operational Land Imager version 2 (OLI-2) data were selected as representatives to verify the accuracy of the model; compared to these two datasets, the MAPE values of the models were 16.32% and 26.84%, respectively, while the RMSE values were 0.010 mg/L and 0.014 mg/L, respectively. Finally, the models were applied to Sentinel 3 OLCI and Landsat 9 OLI-2 images obtained on 16 January 2022. The results show that the spatiotemporal distributions of PP concentrations in Hongze Lake estimated from these two images were relatively consistent, but the OLI data reflected overestimations and underestimations in some areas. These research results provide a new methodology for estimating PP concentrations through remote sensing methods and help to further improve the accuracy of remotely sensed PP concentration estimations in inland water bodies.

1. Introduction

The 2018 China Ecological Environment Status Bulletin published by the Ministry of Ecology and Environment of China (http://www.mee.gov.cn/, accessed on 22 May 2019) shows that among the 107 lakes (reservoirs) monitored across the country, 97 are moderately eutrophic lakes, accounting for 90.7%. Most of the lakes in the middle and lower reaches of the Yangtze River have been eutrophicated or are in the process of eutrophication. It is generally believed that phosphorus plays a key role in the process of lake eutrophication [1]. Phosphorus can be found in lake water in two forms: dissolved and particulate phosphorus, between which particulate phosphorus (PP) is the main form. Especially in highly turbid water bodies, the PP proportion can reach 80–90% [2]. PP is an important reservoir of bioavailable phosphorus, and the degradation and cyclic transformation of PP are key processes in the regulation of phosphorus bioavailability and biological growth in water bodies, factors that eventually lead to the eutrophication of lakes. Therefore, studying the temporal and spatial variation characteristics of PP concentrations in lakes is of great scientific and practical significance for revealing information regarding the migration and transformation of phosphorus as well as for exploring lake eutrophication control measures. Obtaining rapid, accurate, high-spatial-resolution, and high-temporal-resolution acquisitions of PP concentrations and variations in water bodies is the key to controlling cyanobacterial blooms, regulating lake eutrophication, and restoring water ecosystems.
The development of satellite remote sensing technologies has provided very effective alternative PP monitoring methods with high spatial and temporal accuracies. Based on large amounts of multisource remotely sensed data, long-time-series and high-spatial-resolution PP concentration changes can be obtained, and these data are helpful for facilitating in-depth discussions about the coupling relationships among lake eutrophication, phosphorus cycle transformations, and cyanobacterial blooms. To date, some studies have focused on estimating the total phosphorus (TP) content in lakes, though the methods used to do so are still in their infancy. The optical properties of phosphorus are not obvious, so few related research results have been obtained in China or elsewhere. Methods developed for monitoring phosphorus concentrations in water bodies can be mainly divided into indirect and direct methods. Indirect methods refer to approaches in which water quality parameters are estimated by analyzing the relationships between phosphorus concentrations and water quality parameters. In phosphorus concentration inversion methods, water quality parameters such as the sea surface temperature, suspended solids concentration, and chlorophyll a (Chl-a) concentration are generally used [3]. There are also some estimation models that use direct methods. According to the characteristics of the utilized sensor band, the empirical model construction method can be used to establish a relationship model between the remotely sensed reflectance characteristics and phosphorus concentration to realize remotely sensed TP concentration estimations. The utilized sensors include the Landsat, IKONOS, Huan Jing charge-coupled device (HJ CCD), and Moderate-Resolution Imaging Spectroradiometer (MODIS) sensors [4,5,6]. Junfeng Xiong (2019) compared and analyzed the empirical algorithms associated with these sensors to directly and indirectly estimate TP concentrations from remotely sensed data based on MODIS images, taking Hongze Lake as the study area. The results showed that the direct algorithms had higher accuracies compared to the indirect algorithms [7]. In addition to conventional empirical models, some scholars have used machine learning methods to estimate TP concentrations in water bodies. Commonly used machine learning methods include artificial neural network estimation models, support vector machine models, and genetic algorithms [8,9,10]. Regarding PP concentration inversion models, Zeng (2021) constructed a semianalytical model to obtain remotely sensed PP estimations based on the absorption coefficient of nonpigmented particulate matter in lakes in the lower reaches of the Yangtze River [11]. However, pigmented particulate matter types such as algae also contain large amounts of phosphorus, so this model results in the loss of some PP information. In summary, most of the currently available methods for estimating phosphorus concentrations in water with remote sensing-based methods have been developed to target TP estimations. Because dissolved phosphorus does not have optical activity characteristics, it easily causes large errors when included, so the existence of PP in water is often not considered. In addition, most of the existing studies used empirical, semiempirical, or machine learning models, all of which are greatly influenced by the specific research area considered, and their application potential for highly turbid inland water bodies such as lakes or other water bodies must be further evaluated.
Hongze Lake is located in the lower reaches of the Huai River; as the fourth-largest freshwater lake in China, this lake has a unique geographical location and obvious location-specific advantages. At the same time, Hongze Lake is an important water transportation hub in the Huai River Basin and has national wetland nature protection status. This lake is also a transit platform and an important storage lake for the eastern route of the South-to-North Water Diversion Project. Thus, the water quality in this lake directly affects the supply of water to northern China. However, in recent years, the water quality in this lake has deteriorated. The main reason for this is that due to the development of agriculture and urbanization, large amounts of nutrients, such as nitrogen and phosphorus, have been discharged into the lake. At the same time, the sediment resuspension effect caused by sand-mining activities has also introduced nutrients to the lake. Increased eutrophication processes eventually lead to increasingly serious water eutrophication conditions [12]. As a highly turbid inland water body, Hongze Lake contains high concentrations of suspended sediments, and these pollutants are dominated by PP [13]. However, there is no study on the spatiotemporal variation of particulate phosphorus concentration in Hongze Lake that has used remote sensing data, only TP in Hongze Lake has been studied. The results show that the TP concentration in Lake Hongze is low in spring and summer and high in autumn and winter. The spatial distribution of TP in the four seasons is similar. The concentration in the northern region is low, and that in the central region is high [7]. Then, it is critical to rapidly and accurately monitor the temporal and spatial distributions and variation characteristics of PP in Hongze Lake to ensure water quality protection and management.
Therefore, in this study, PP, the main nutrient in inland lakes, was taken as the research object, and Hongze Lake was taken as the research area. We comprehensively considered the phosphorus contents in pigmented and nonpigmented particles and attempted to construct semianalytical PP models to estimate PP concentrations through remote sensing-based methods. In addition, the applicability of the constructed empirical models to broadband sensor-derived data was assessed. Finally, according to the sensor band-setting characteristics, the selection criteria of the remote sensing-based PP concentration estimation models were constructed, and the models were applied to remotely sensed images to analyze the spatial distribution characteristics of PP concentrations in Hongze Lake.

2. Materials and Methods

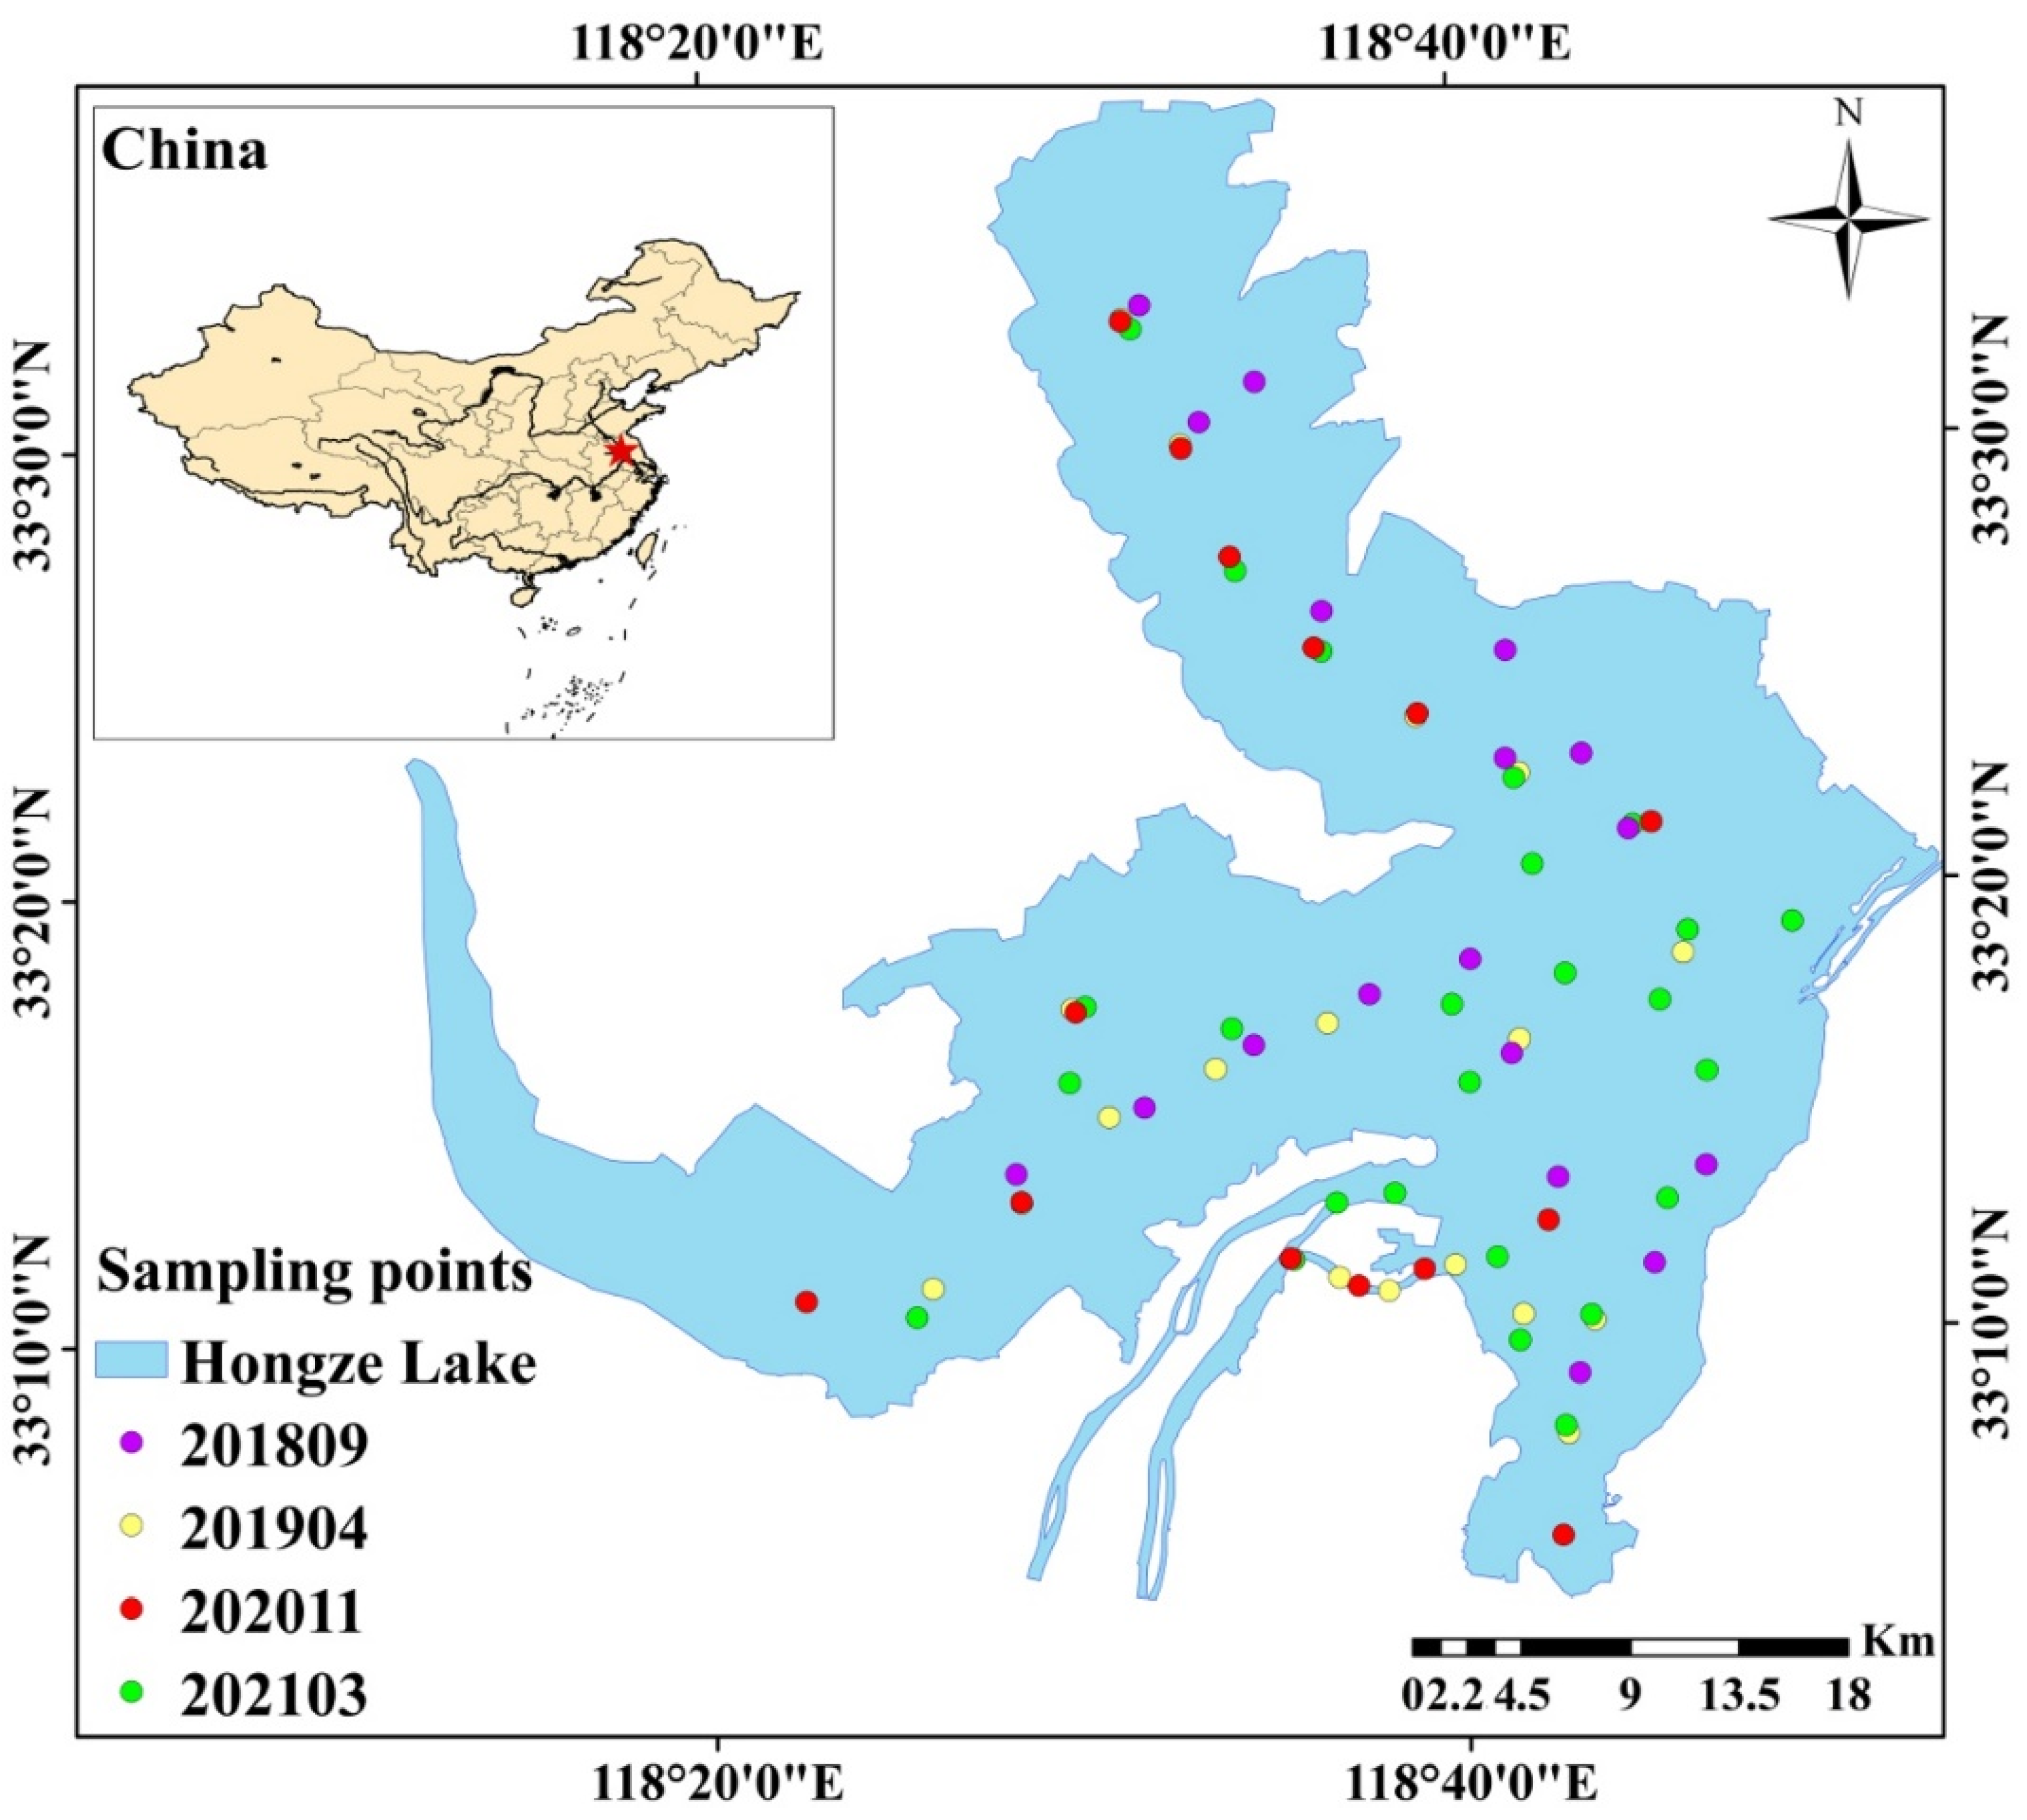
2.1. Study Area and Sampling Points

Hongze Lake is located between the 33°06′ and 33°40′N latitude lines and the 118°10′ and 118°52′E longitude lines. This lake is shallow and is located in the lower reaches of the Huai River in western Jiangsu Province, Huai’an, and Suqian. This area receives 158,000 km2 of water from the upper and middle reaches of the Huai River and accounts for 83.6% of the Huai River Basin. It represents the junction point of the middle reaches of the Huai River, connecting the tributaries with the downstream river. Rivers mainly enter the lake from the west and south directions, and the water input by the Huai River accounts for more than 70% of the total lake volume. Hongze Lake plays important roles in flood storage and regulation processes in the lower reaches of the Huai River. According to the hydrological characteristics of different areas of the lake, Hongze Lake could be divided into three lake bays. Chengzi Bay is relatively closed and is the main purse seining area in Hongze Lake. The water exchange process is relatively slow in this region, while the eutrophication degree is relatively high. Huaihe Bay is the main area through which water passes in Hongze Lake. This water body is turbid, the lake disturbance is severe, and the suspended sediment content is high. Lihe Bay in the western area is the main lake region. In the river distribution area, the water body has a strong self-purification ability and is mainly distributed with aquatic plants and aquaculture. The eutrophication degree in this region is lower than that in Chengzi Bay. Data were collected from a total of 77 points in the lake on 17 (8), 18 (8) September of 2018; 15 (10), 16 (9) April of 2019; 20 (8), 21(6) November of 2021 and 12 (7), 13 (10), 14 (8) March of 2021. During the sampling period, the weather was clear and cloudless with light winds. The exact locations of these sampling points are shown in Figure 1.

2.2. In Situ Data

2.2.1. Water Quality Tests

Water samples were collected from the lake surface and taken back to the laboratory to measure the water quality, water component absorption coefficient (total particle absorption (ap)), absorption coefficient of pigmented particles (aph), absorption coefficient of nonpigmented particles (anap), and colored dissolved organic matter (CDOM). These analyses were conducted within 12 h from the sampling times. The water samples were filtered on Whatman GF/F glass fiber filters. The PP was measured using an ultraviolet–visible spectrophotometer (Shimadzu, Kyoto, Japan, V-3600) [14]. Chl-a and TSM were determined spectrophotometrically using the method described by Lorenzen and Chen et al. [15,16]. The methods used to measure ap, aph, anap, and CDOM corresponded to the quantitative filter technique (QFT) [17,18].

2.2.2. Spectral Data Collection

The water surface spectral data were acquired using an Analytical Spectral Device (ASD) Field Spec Pro portable spectrometer with a range of 350 to 1050 nm. The entire process involved measuring the radiation information of a standard gray board, the water body, and light from the sky; for each parameter, 10 spectra were measured. The Rrs(sr−1) value was calculated using the following equation [19]:
R r s ( λ ) = ( L t - r L s k y ) / ( L p π / ρ p )
where Lt is the total radiance of the water surface; r is the sky-light reflectance at the air–water interface (set to 2.2% for calm weather, 2.5% for <5 m∙s−1 wind speeds, and 2.6–2.8% for approximately 10 m∙s−1 wind speeds); Lsky is the radiance measured from the sky; Lp is the measured radiance of the gray reference panel; ρp is the reflectance of the gray diffuse panel (30%).

2.2.3. Image Acquisition and Preprocessing Steps

Sentinel 3 OLCI and Landsat 9 OLI-2 data were chosen to verify the accuracy of the models constructed according to different band settings. The atmospheric correction method was applied to the Sentinel 3 data using a previously published method (Bi et al., 2018). This method includes two main steps: (1) water turbidity classification performed with the GRAindex (GRAdient of the spectrum index) and (2) atmospheric correction performed through the synergistic use of OLCI and Sea and Land Surface Temperature Radiometer (SLSTR) images. The Fast Line-of-sight Atmospheric Analysis of Hypercubes (FLAASH) atmospheric correction module was developed using Moderate Resolution Atmospheric Transmission (MODTRAN5) and has been widely applied to various satellite sensors (e.g., the Landsat TM, Enhanced Thermal Mapper Plus (ETM+), OLI, and Gaofen-1 sensors) over marine, coastal, and inland water bodies [5,20,21]. Therefore, in this work, FLAASH was used to perform the atmospheric correction of the Landsat 9 OLI-2 images. The image data of the same day could be used to analyze the estimation results of Landsat 9 OLI-2 and Sentinel 3 OLCI sensors. But Landsat 9 OLI-2 data will not be available from NASA until 2022, so the day of 16 January 2022, which was cloudless and has data from both sensors, was chosen. The specific collection times of the utilized images are listed in Table 1.

2.3. Performance Evaluation

The accuracy of the inverse model was measured using the mean absolute percentage error (MAPE) and the root-mean-square error (RMSE). The two parameters were calculated as follows:
MAPE = 1 n i = 1 n | y i y i y i | × 100 %
RMSE = 1 n i = 1 n ( y i y i ) 2
where y i and y i are measured and retrieved PP, respectively.

3. Construction of the PP Model

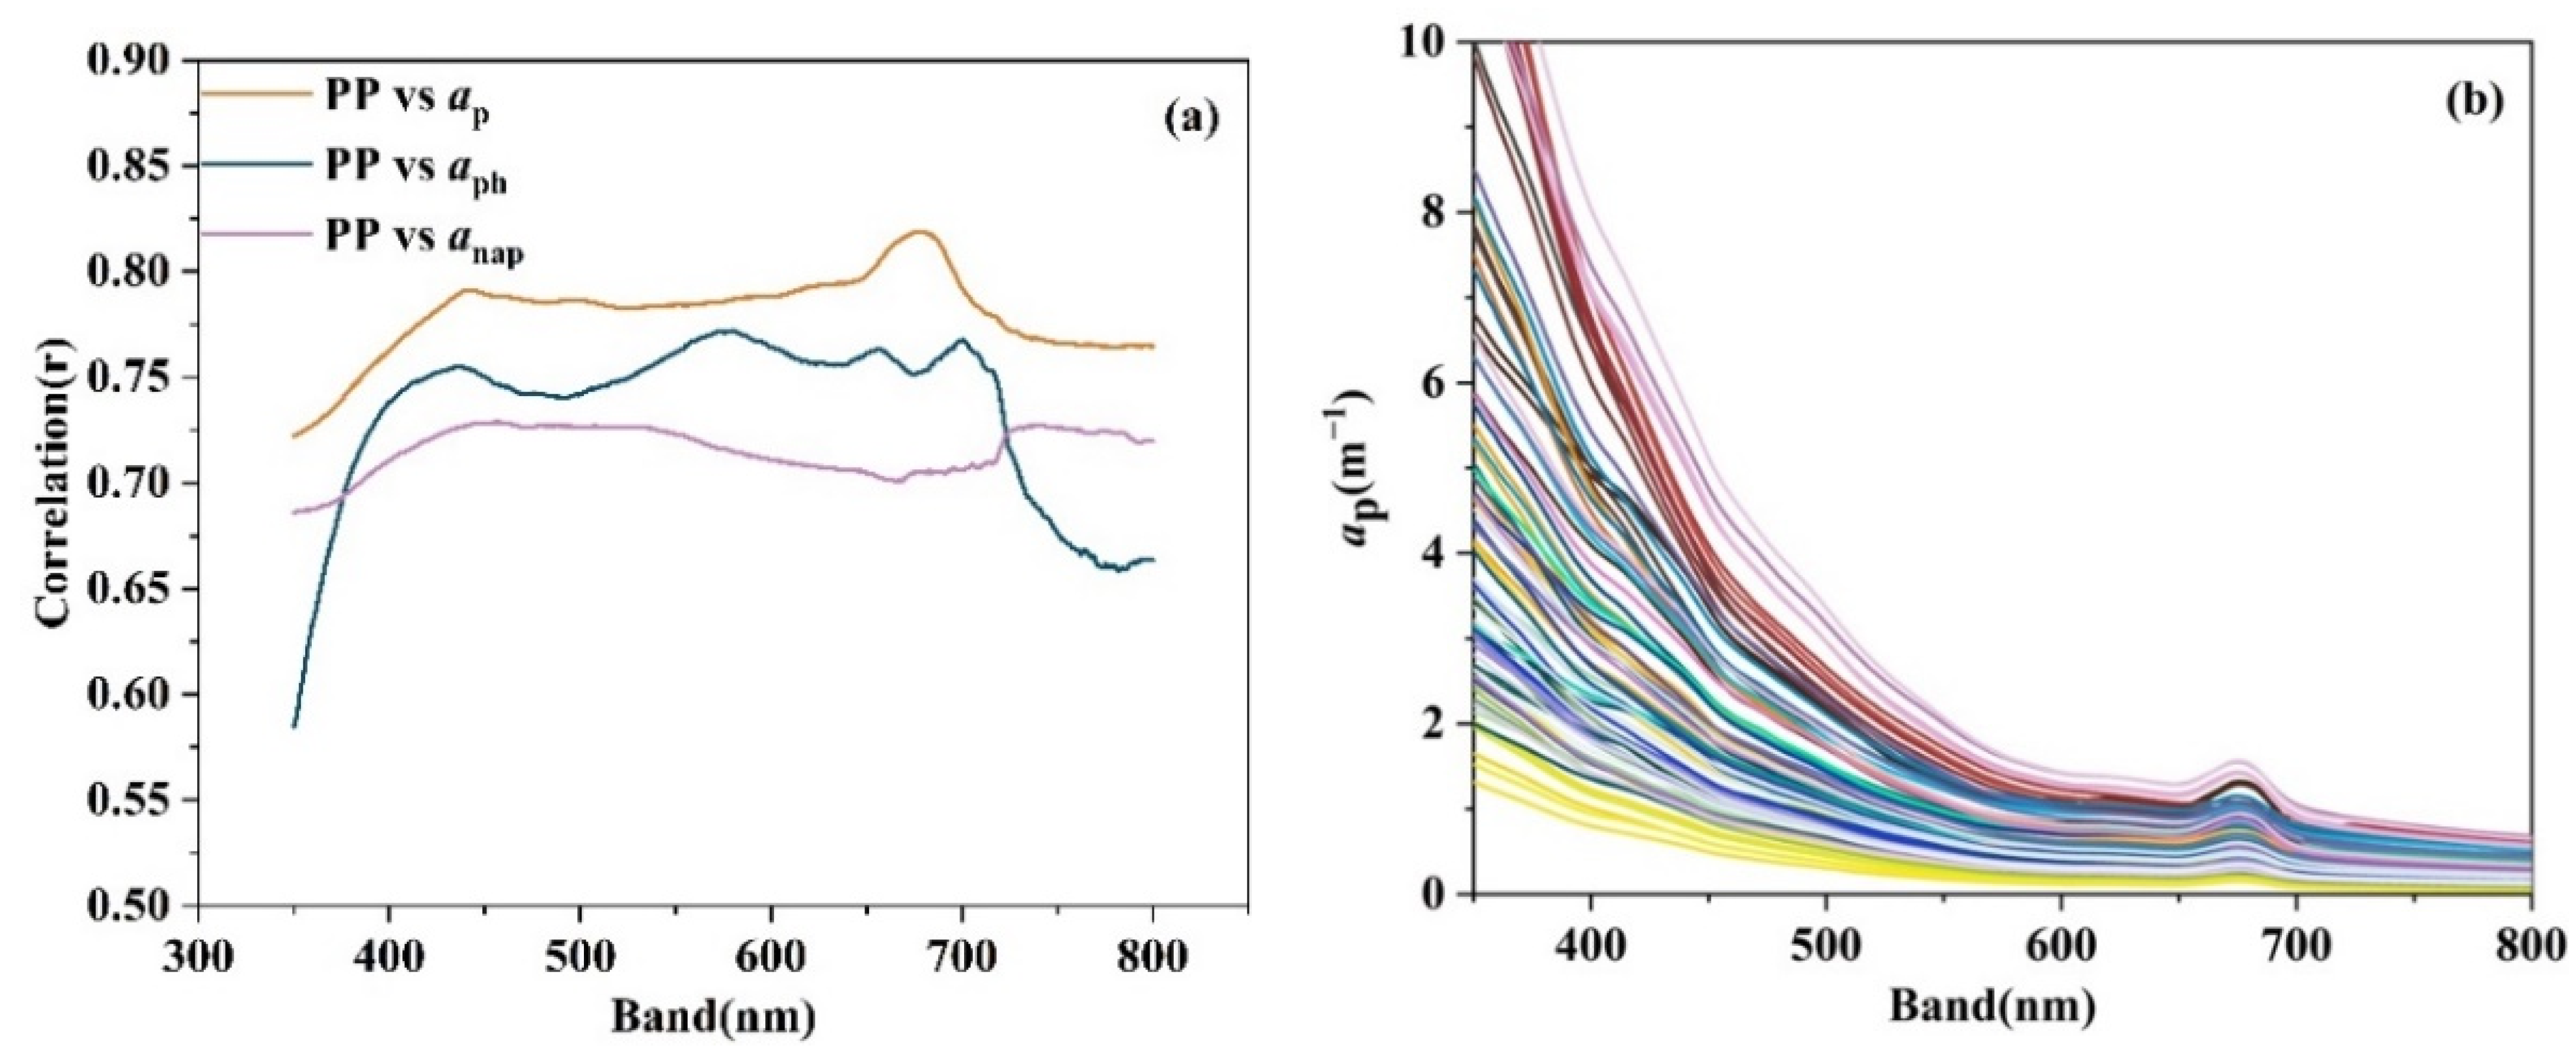
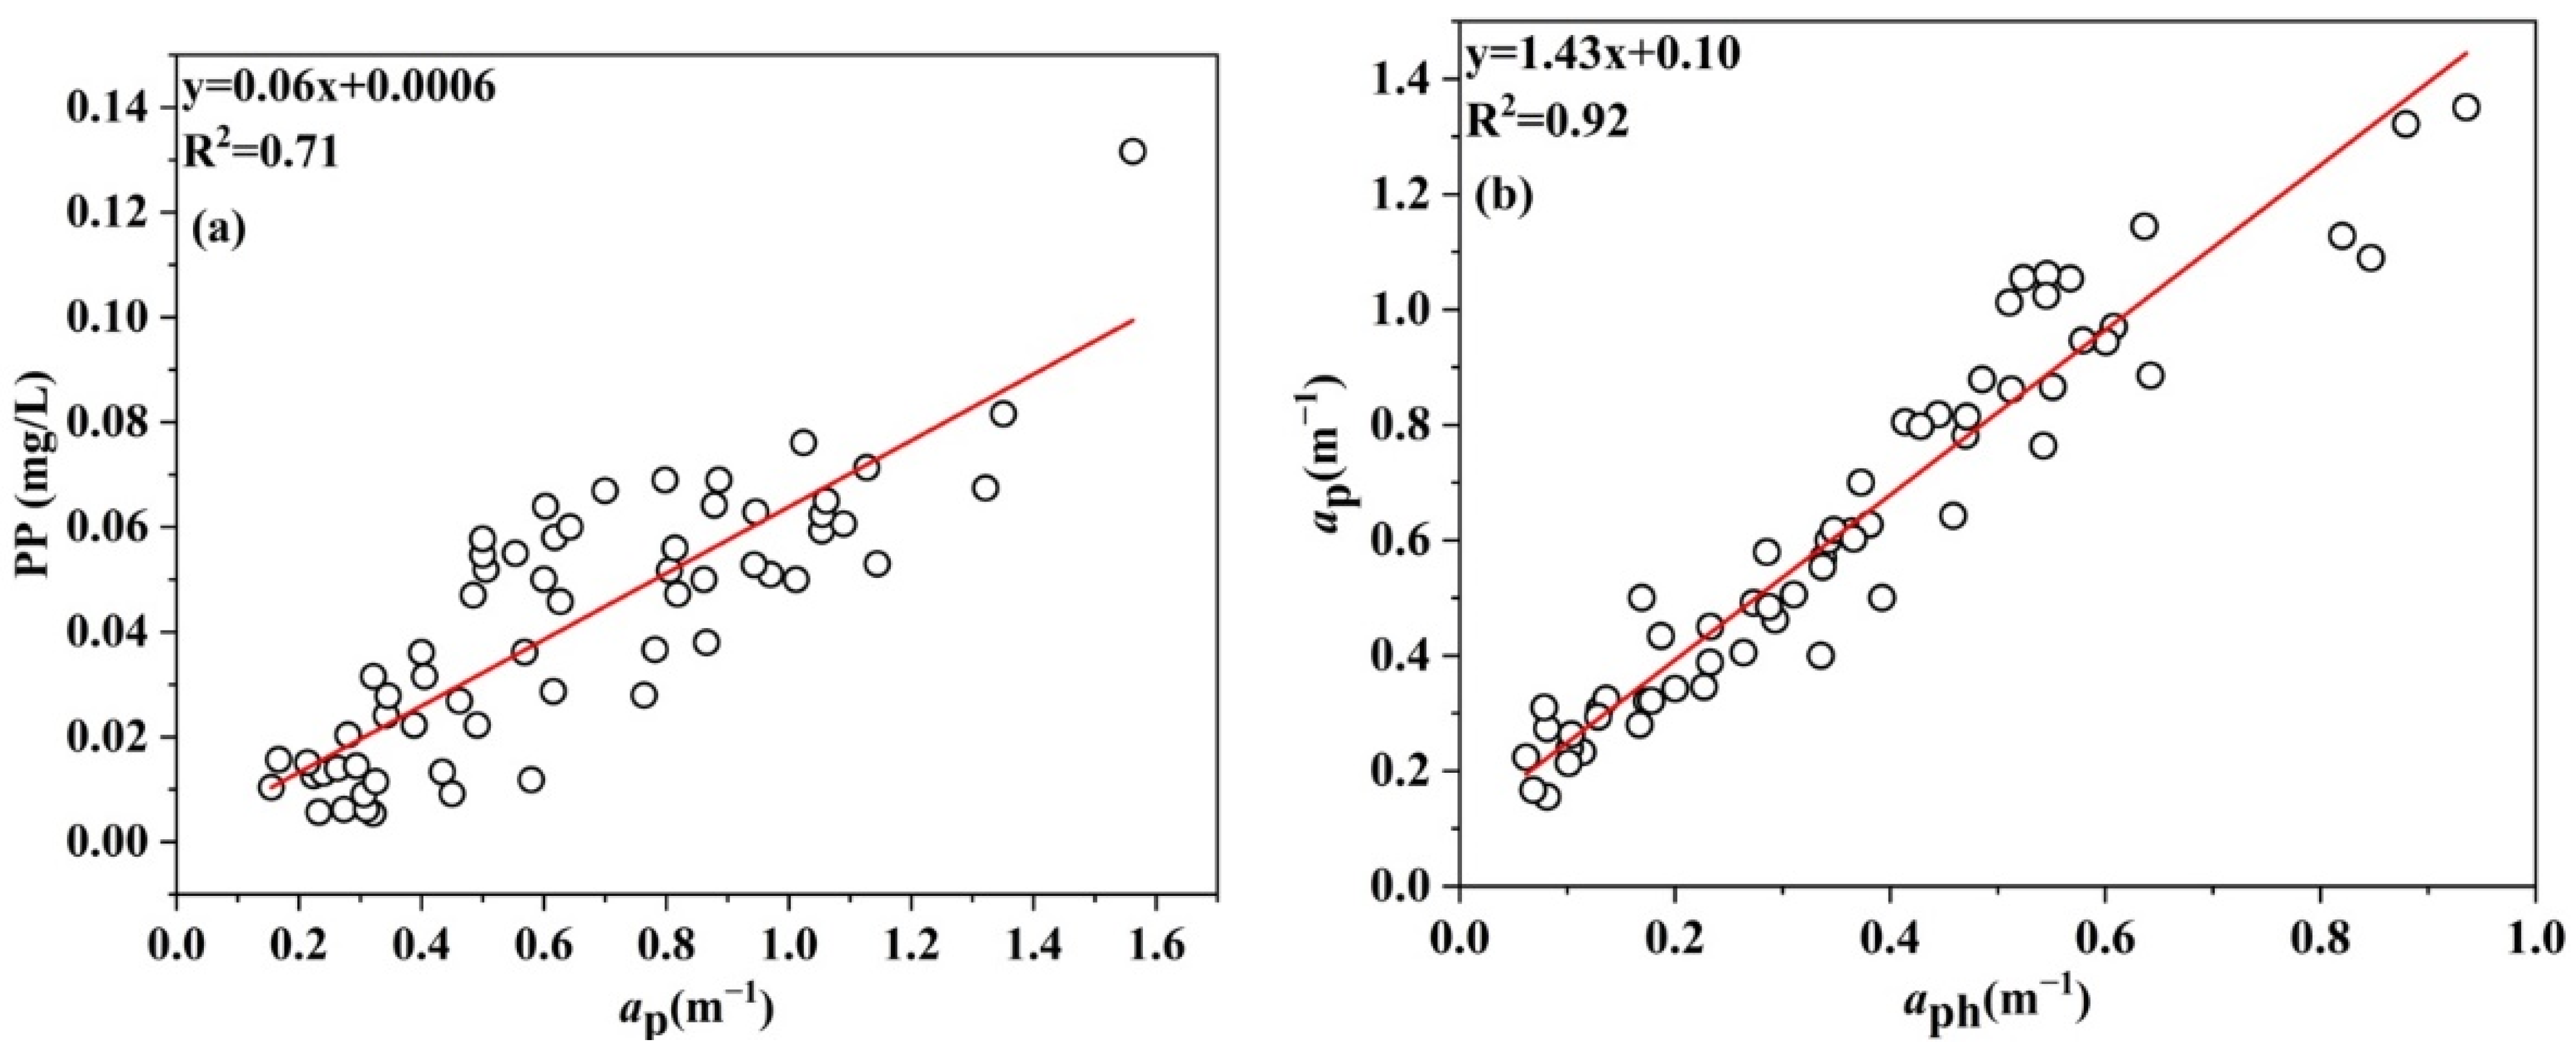
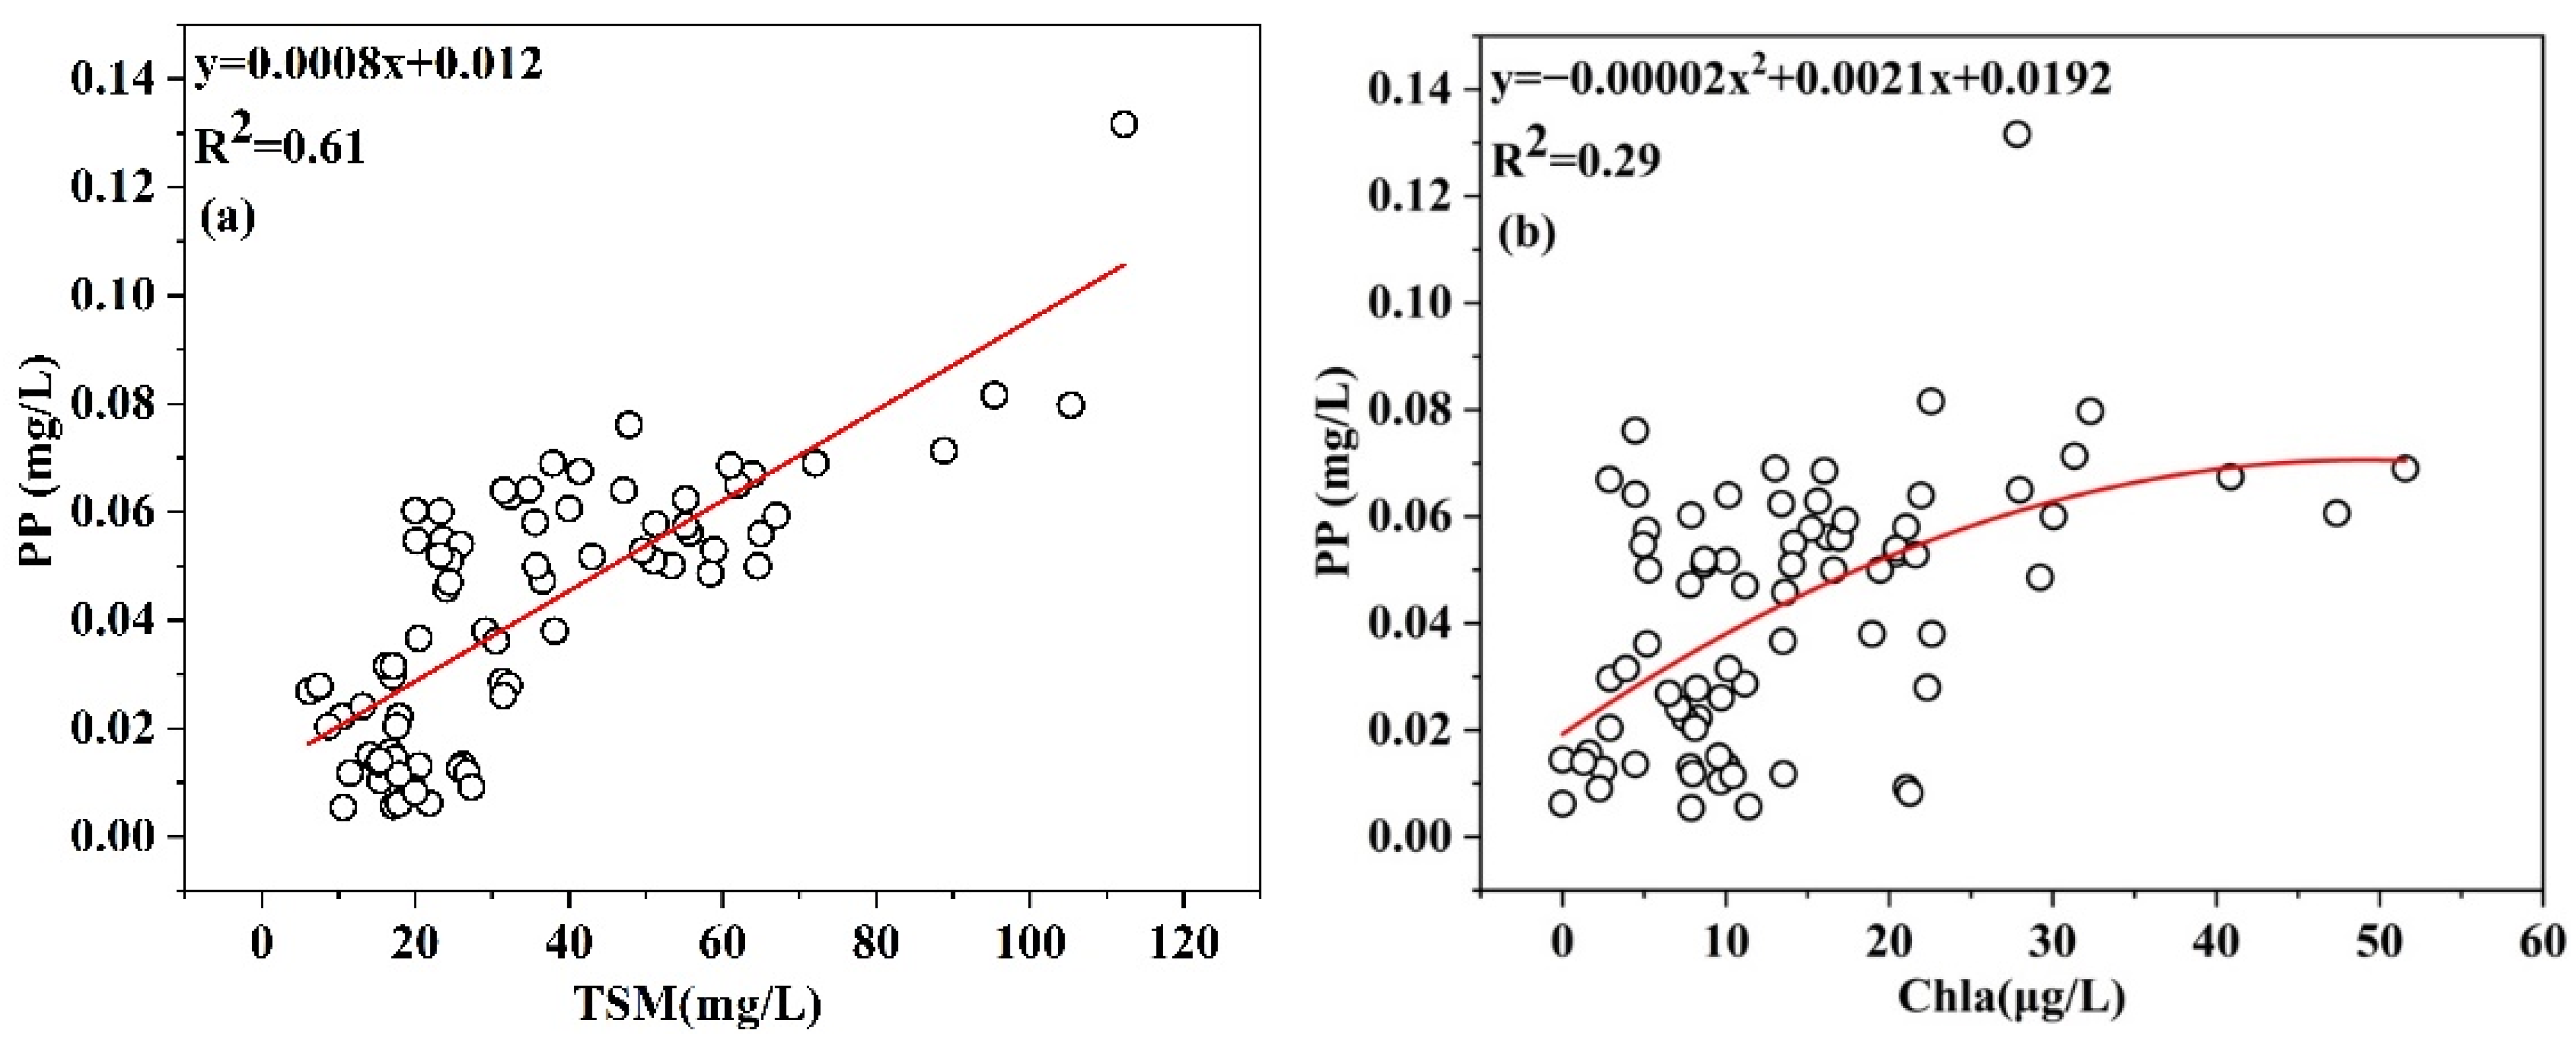
3.1. Relationship between the PP Concentration and Particulate Matter Absorption Coefficient

The particulate matter types found in water bodies mainly include organic particulate matter and inorganic particulate matter; organic particulate matter comprises algae particles and other organic matter types. This particulate matter can become an important PP source in lakes. Among the optical properties of water bodies, the inherent optical quantity characterizing particulate matter is generally the total particulate matter absorption coefficient, which includes the absorption coefficients of both pigmented particulate matter and nonpigmented particulate matter. The absorption coefficient of pigmented particles is mainly used to characterize colored particles, which mainly include algae. Algae particles contain phosphorus, though some inorganic particles also adsorb phosphorus. Therefore, the absorption coefficient of nonpigmented particles can be used to characterize this phosphorus content portion. Therefore, to measure the PP content in water as accurately as possible, one must consider the contents of both colored and colorless particulates. In this work, the correlations between PP and the total particulate matter absorption coefficient, the pigmented particulate matter absorption coefficient, and the nonpigmented particulate matter absorption coefficient were calculated, and the results are shown in Figure 2a. The correlation between PP and ap was significantly higher than that between PP and aph and between PP and anap; the maximum correlation coefficient was 0.84 at 677 nm. Figure 2b shows the overall particle absorption curve, exhibiting a peak at 677 nm, where each color represents each sampling point. This figure indicates that the total particulate matter absorption coefficient can best characterize the PP concentration in the studied lake and that the most suitable wavelength band is 677 nm.

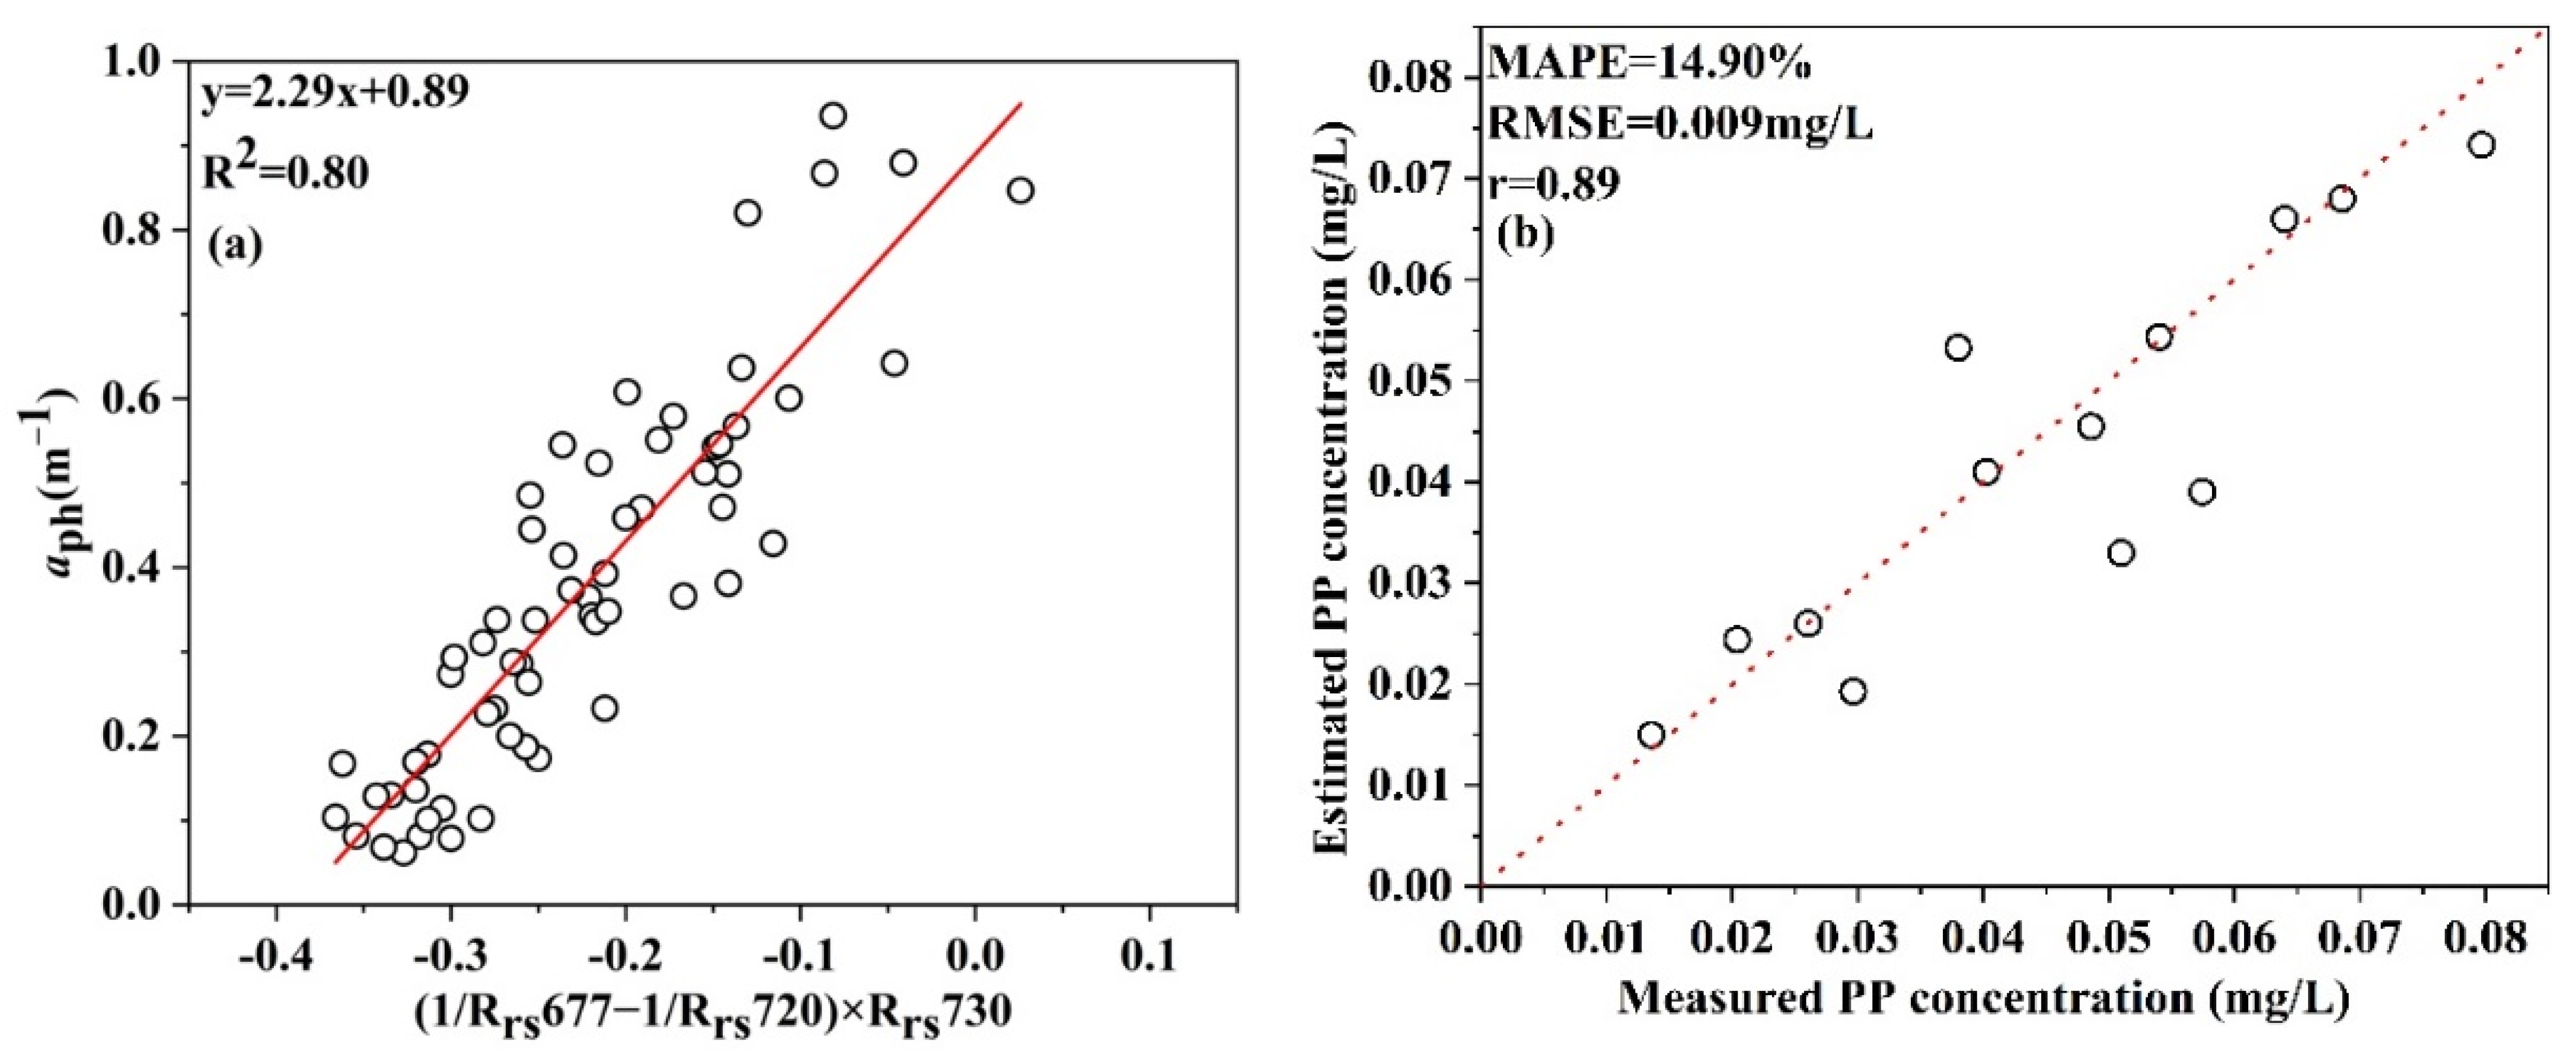
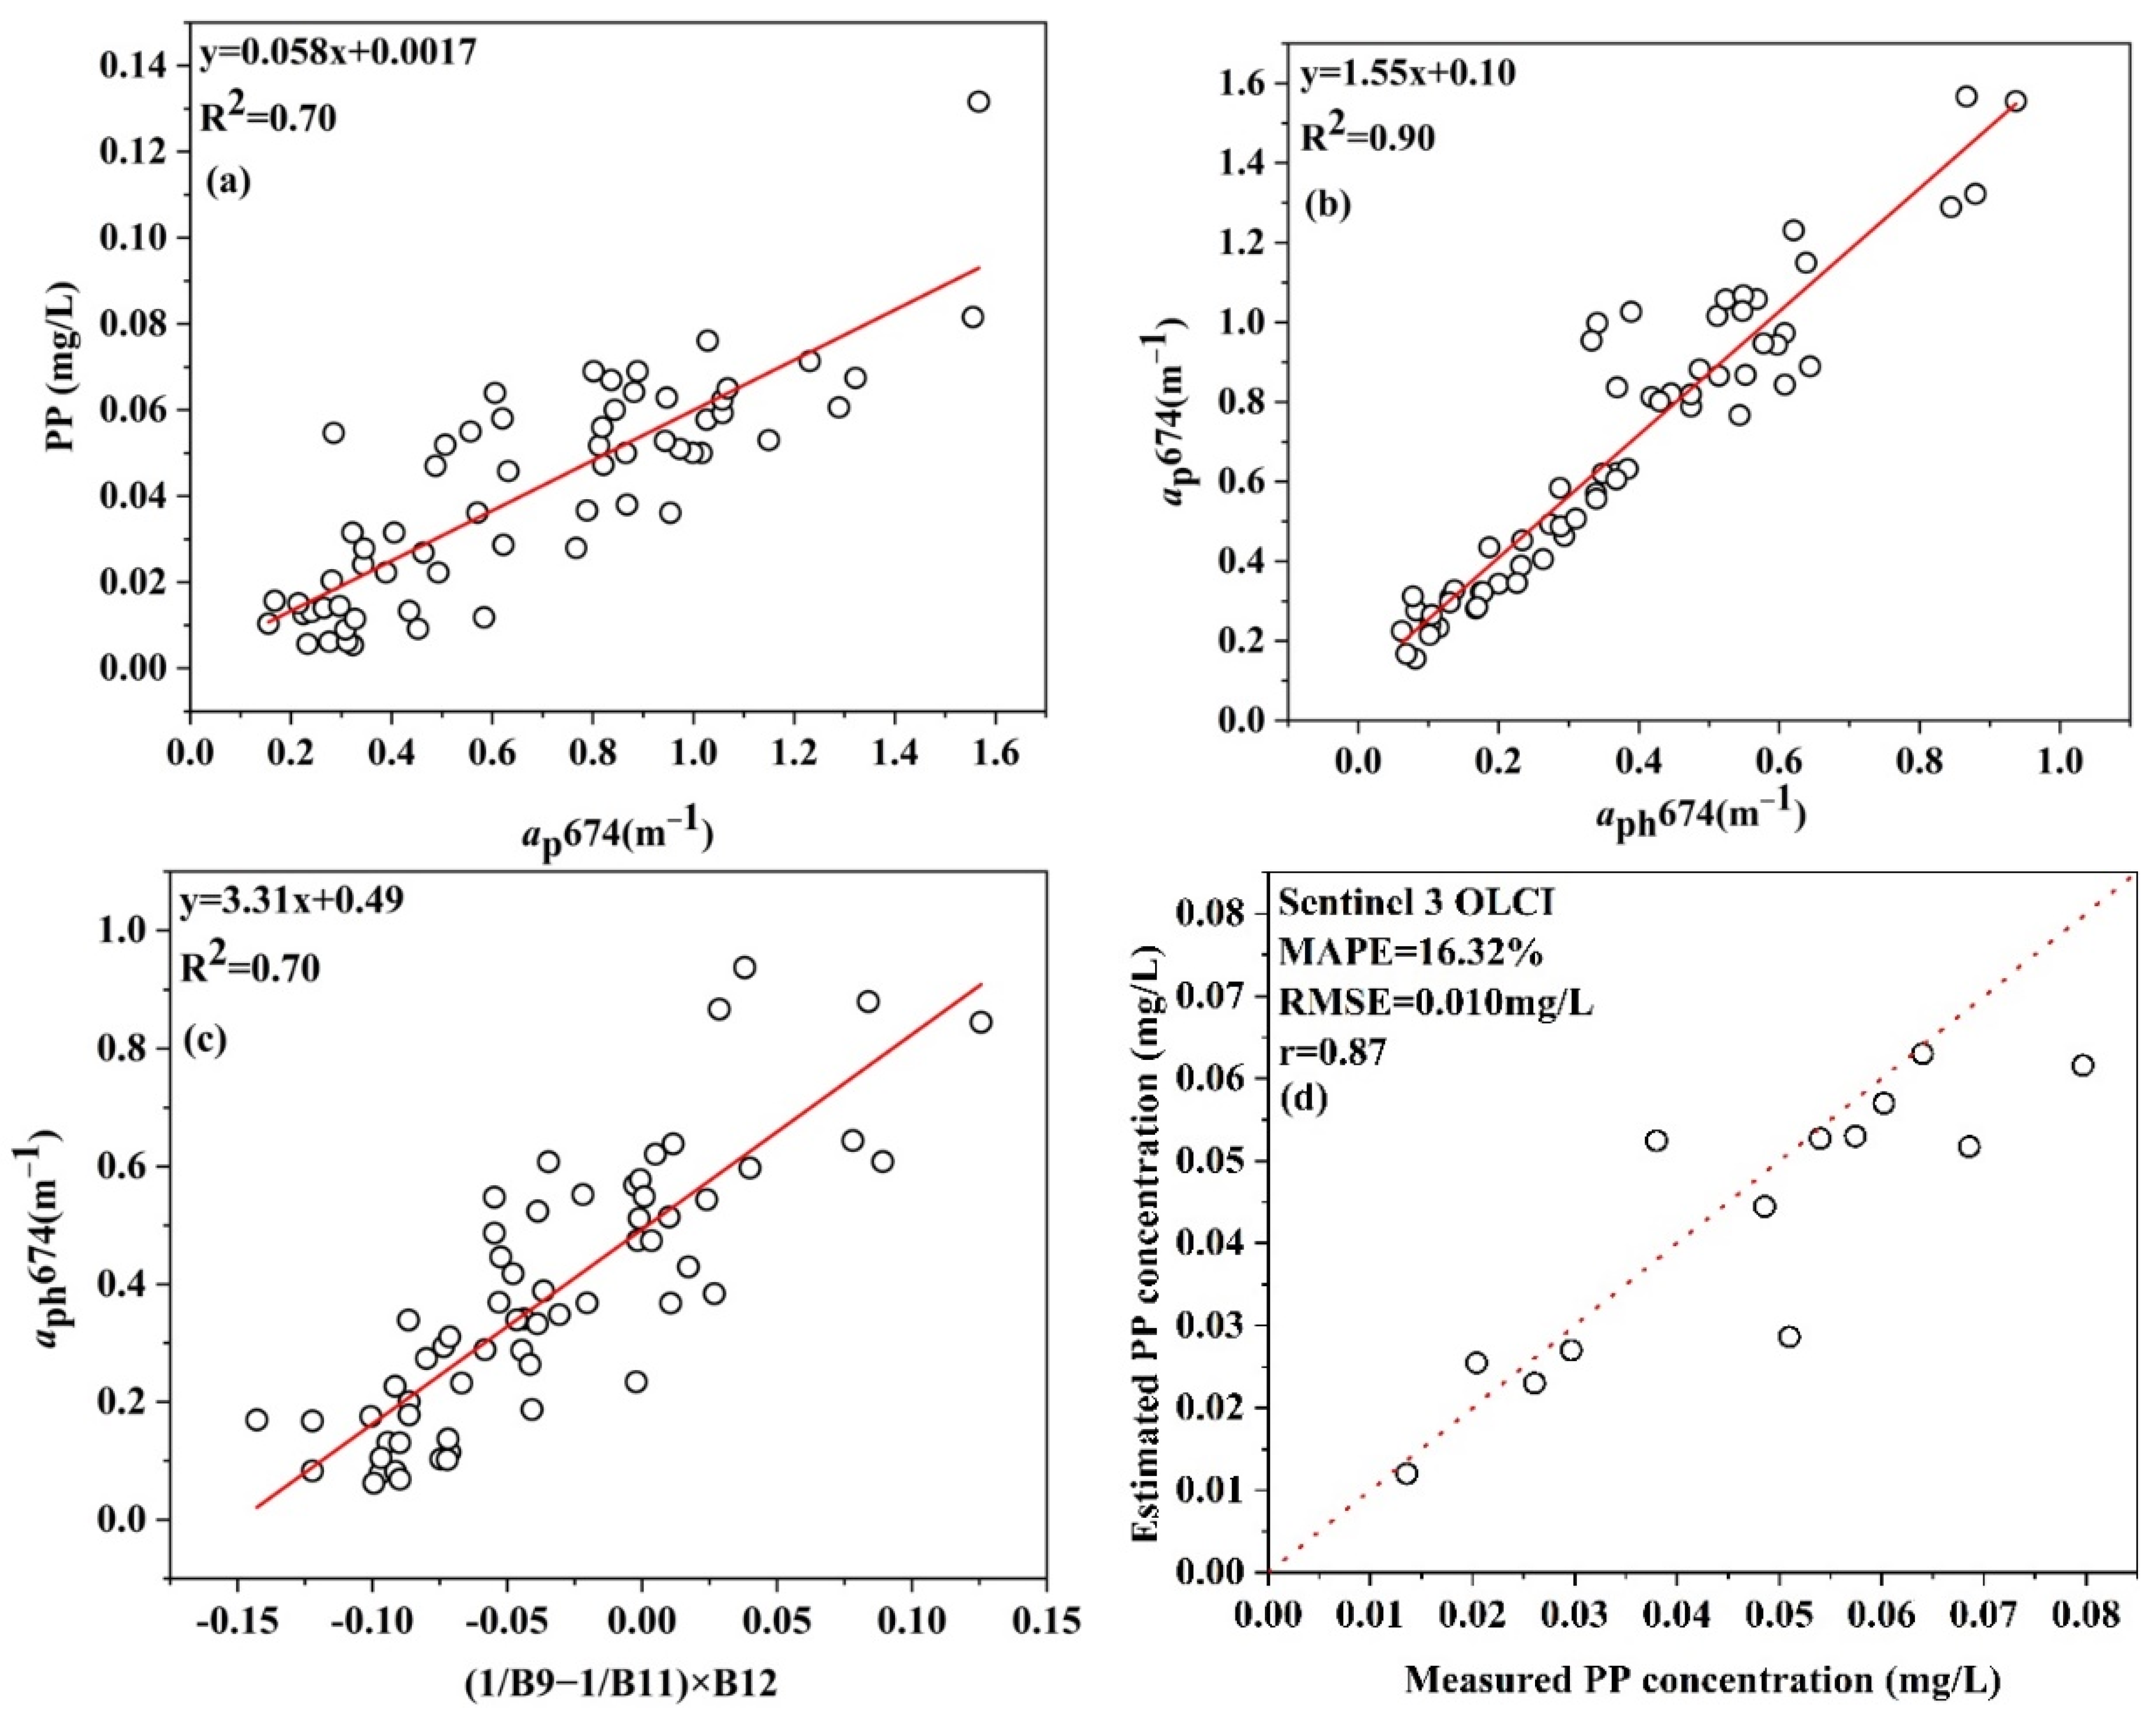
3.2. Development of a Semianalytical PP Algorithm

Based on the strong correlation between the total particulate absorption coefficient and PP, in this work, the particulate absorption coefficient was fitted to the PP concentration, and the fitting accuracy (R2) reached 0.71. The results are shown in Figure 3a. Therefore, in the remaining work, it was necessary to accurately estimate only ap to obtain the PP concentration. For highly turbid inland water bodies, the existing algorithms for estimating intrinsic optical quantities through remote sensing methods are not yet mature, and there is no unified or universal algorithm, let alone an algorithm suited for determining the intrinsic optical quantities of Hongze Lake. However, the three-band aph estimation algorithm is widely used to estimate the water color parameters of inland lakes; thus, in this study, we attempted to estimate ap using aph as a medium. As shown in Figure 3b, aph is highly correlated with ap, with an R2 value of 0.92, indicating that aph can be estimated first, and then ap can be estimated according to the relationship established between aph and ap.
y = 0.06x + 0.0006
where y is PP and x is ap;
y = 1.43x + 0.10
where y is ap and x is aph.
According to the above analysis, the aph estimation model should be built first. The main principle of this method involves separating the contribution of phytoplankton pigments by using three Rrs bands in order to isolate the aph concentration required in this study [22,23]. Therefore, aph(677) was first characterized by referring to the three-band principle. The Rrs value of a water body could be approximated from parameters such as the absorption coefficient of the water body, the backscattering coefficient, and the light field distribution. The specific three-band calculation process is expressed as follows:
R r s ( λ ) = f ( λ ) t 2 Q ( λ ) n 2 × b b ( λ ) a ( λ ) + b b ( λ )  
R r s 1 ( 677 ) Q f n 2 t 2 a w ( 677 ) + a ph ( 677 ) + a CDOM ( 677 ) + a nap ( 677 ) + b b ( 677 ) b b ( 677 )    
R r s 1 ( 677 ) R r s 1 ( λ 2 ) Q f n 2 t 2 a w ( 677 ) a w ( λ 2 ) + a ph ( 677 ) b b ( 677 )
(1) aph(λ2) << aph(λ1); (2) acdom(λ2) ≈ acdom(λ1); (3) anap(λ2) ≈ anap(λ1); (4) bb2) ≈ bb(λ1)
R r s ( λ 3 ) f Q t 2 n 2 b b ( λ 3 ) a w ( λ 3 )
where (1) aph(λ3), acdom(λ3), and anap(λ3) are all approximately 0, and the absorption characteristics of water are mainly dominated by water itself; (2) bb3) ≈ bb2) ≈ bb1), and (3) aw3) >> bb3). In addition, the following equations were employed:
[ R r s 1 ( 677 ) R r s 1 ( λ 2 ) ] R r s ( λ 3 ) a w ( 677 ) a w ( λ 2 ) + a ph ( 677 ) a w ( λ 3 )
[ R r s 1 ( 677 ) R r s 1 ( λ 2 ) ] R r s ( λ 3 ) a ph ( 677 )
where a(λ) is the total absorption of water, bb(λ) is the backscattering coefficient, f is a parameter related to the light field and ranges from 0.32 to 0.33, Q is the light field distribution parameter and ranges from 1.7 to 7.0, t is the gas–water interface transmittance, and n is the water body refractive index, which is set to 1.34.
According to the assumptions of Band 2 and Band 3, combined with the actual sampled data, the Band 2 and Band 3 ranges were set to 690–720 nm and 720–800 nm, respectively, in this work to determine the optimal positions of these two bands through a loop iteration method. By iterating the calculation process with the modeling data, we found that the best positions of Band 2 and Band 3 were at 720 nm and 730 nm, respectively. Taking the three-band factor of these bands as the independent variable, the corresponding aph value (677) can be taken as the dependent variable to establish the aph (677) inversion model, as shown in Figure 4a. This constructed model had an R2 value of 0.80, indicating that aph could be estimated with a high precision with the three-band algorithm. Equations (4), (5), and (12) were combined to yield the PP inversion model. The verification points were then used to verify the accuracy of the model; the verification results are shown in Figure 4b. The verification points are closely distributed near the 1:1 line, showing that the predicted value of the model is in good agreement with the measured value, and the MAPE and RMSE values are 14.90% and 0.009 mg/L, respectively, indicating that the model has a high precision and stability and is suitable for facilitating remote sensing-based PP concentration estimations in Hongze Lake.
y = 2.29x + 0.89 R2 = 0.80
where y is aph (677) and x is [1/Rrs(677) − 1/Rrs(720)] × Rrs(730).
Combining Equations (4), (5) and (12) yields the following expression:
y = 0.2x + 0.161
where y is the TP concentration and x is [1/Rrs(677) − 1/Rrs(720)] × Rrs(730).
The Sentinel 3 OLCI sensor collects data on 21 bands, and the center wavelength of Band 9 is 674 nm, which is similar to the 677 nm wavelength. The positions of Band 11 and 12 are similar to those of the hyperspectral data, thus providing the possibility to estimate TP concentrations using the algorithm established in this paper. Thus, Band 9 was set as λ1, and Bands 11, 12, and 13 were iterated to determine the positions of λ2 and λ3. The validation results are shown in Figure 5b. The verification points were closely distributed around the 1:1 line, and the MAPE and RMSE values were 16.32% and 0.010 mg/L, respectively. Therefore, this model could be applied to assess OLCI data with a high precision while meeting the application requirements.
y = −0.091x + 0.165
where y is PP and x is Rrs(1/B9 − 1/B11) × B12.

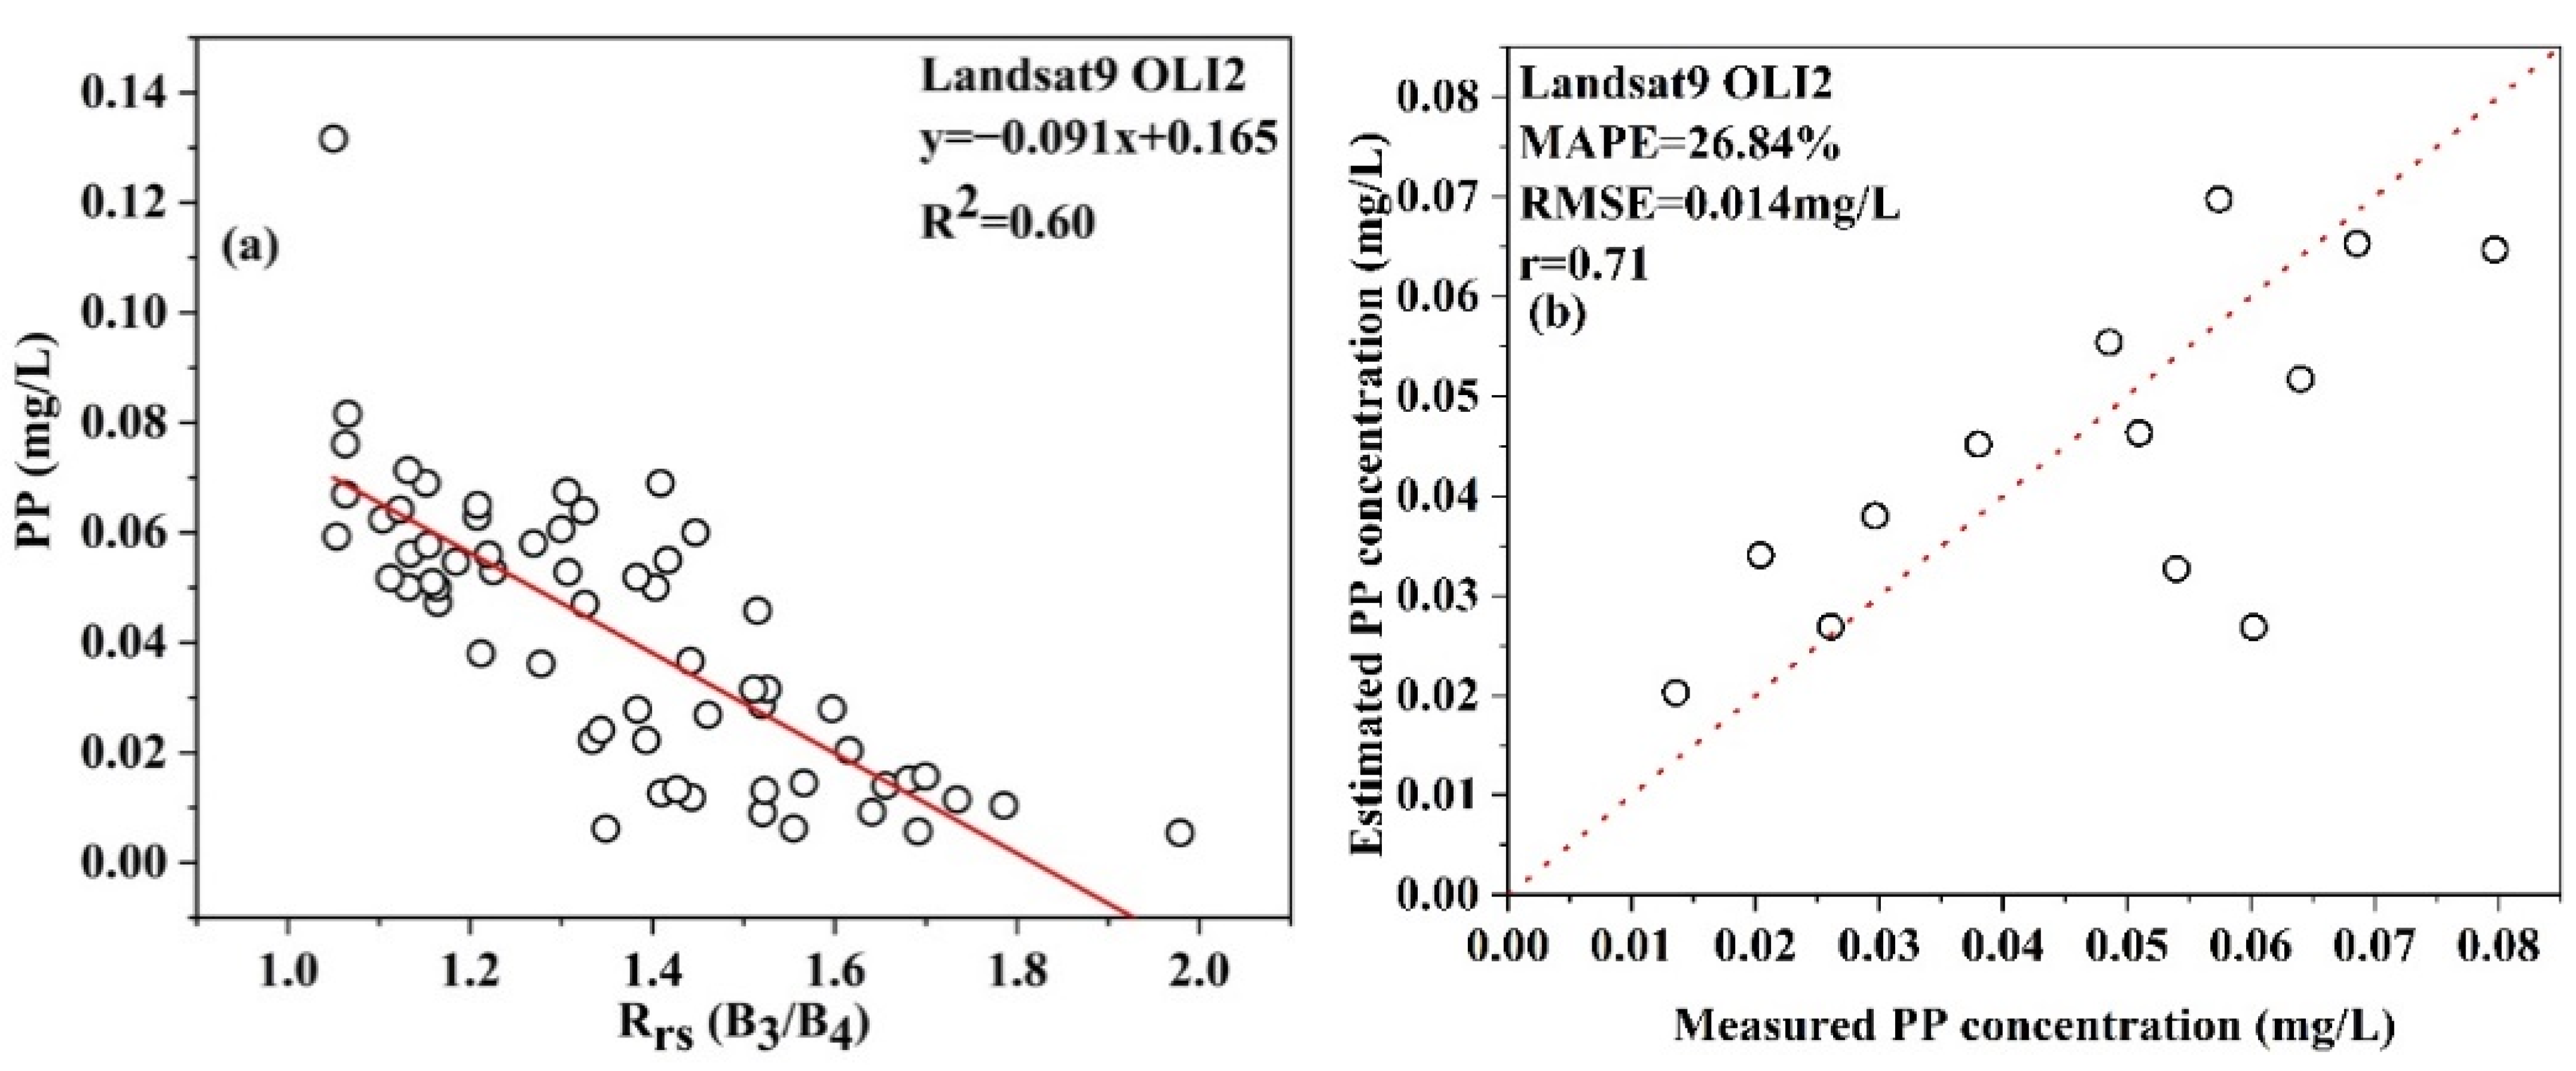
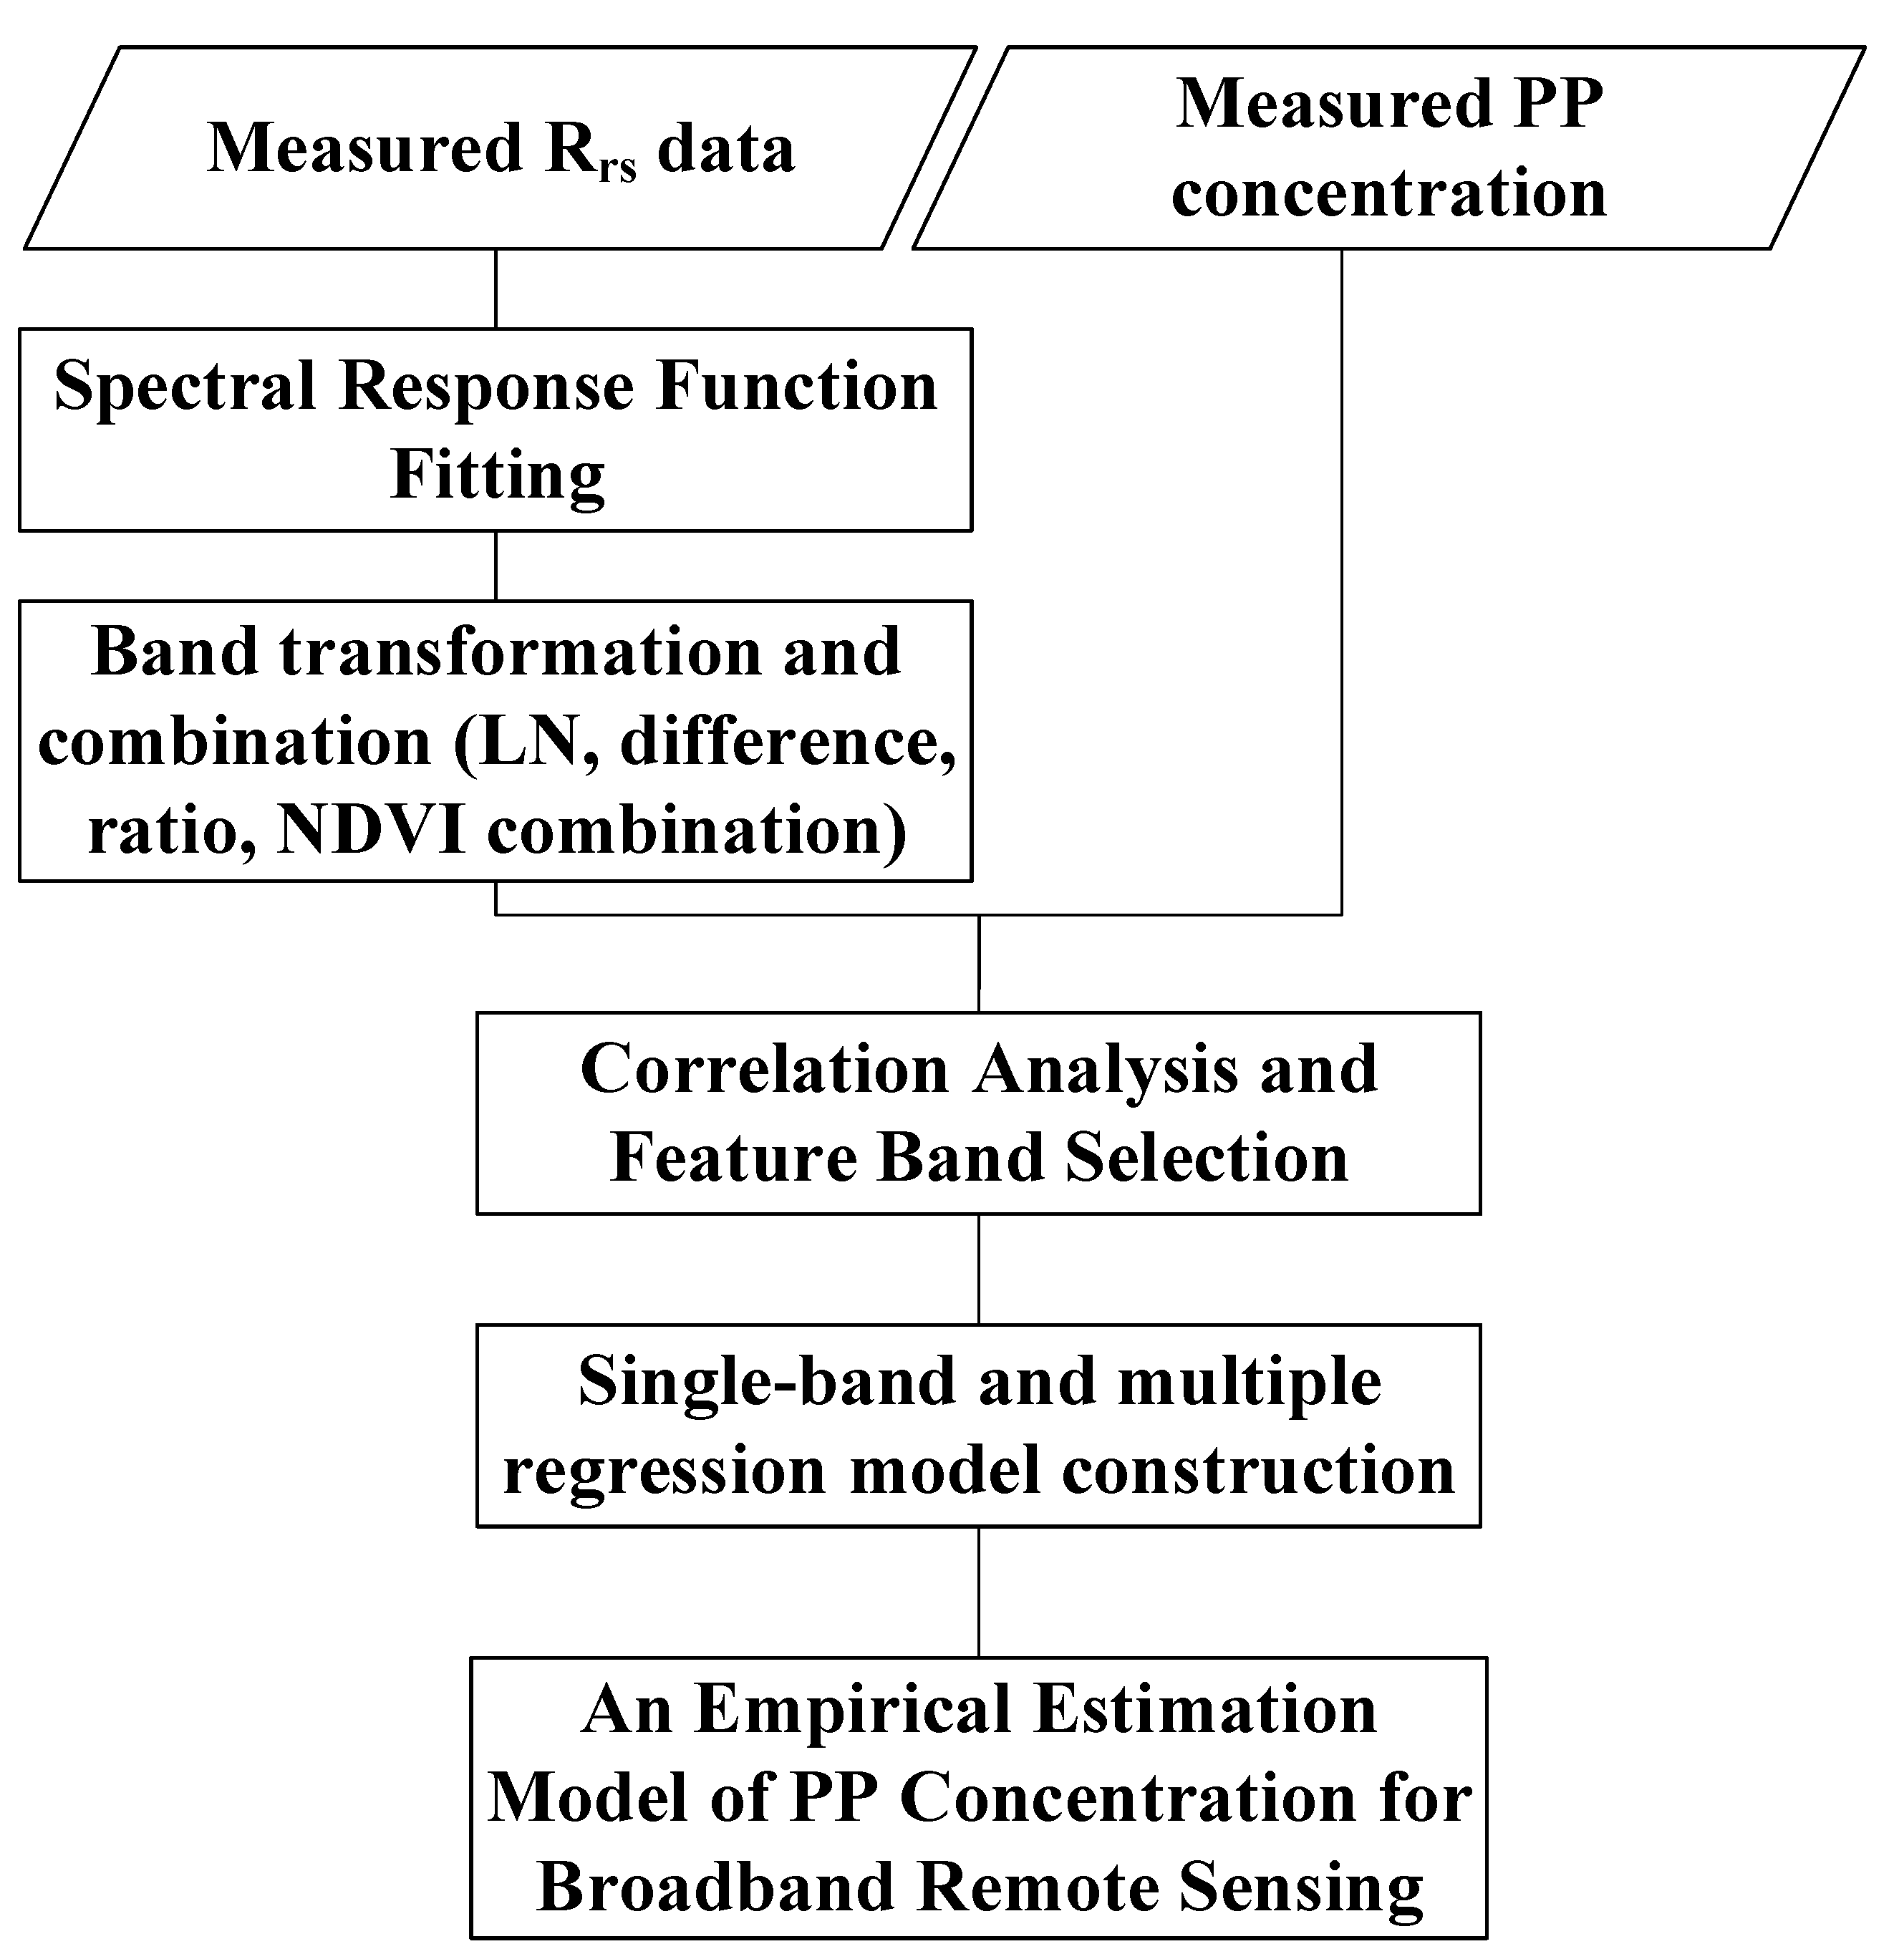
3.3. Development of an Empirical PP Algorithm for Use with Broadband Imagery

At present, the band settings of medium- and high-spatial-resolution sensors are wide, while the data bands are small. For example, the Thermal Mapper (TM) data, OLI data, and HJ1A data obtained from the Landsat satellite at a moderate spatial resolution have only four, five, and four bands corresponding to the visible-light-to-near-infrared wavelength range, respectively. Remotely sensed data such as those recorded by Gaofen-1, QuickBird, and IKONOS at high spatial resolutions also contain only four bands: blue light, green light, red light, and near-infrared bands. Figure 6 shows the technical route used to build a TP concentration estimation model for such broadband remotely sensed data. First, it is necessary to use the spectral response function to simulate the response of the measured spectral data to the band corresponding to the satellite data according to the band setting of the specific sensor. The simulated bands are then transformed and combined (through Ln transformation, difference, ratio, normalized difference vegetation index (NDVI) form combination processes, etc.), a correlation analysis is conducted between the PP concentration and the band, and a band combination transformation is carried out; then, the factor with the highest correlation is selected to establish the TP model (band combination transformation methods include the linear, exponential, power function, and binary linear function methods). Finally, multiple regression analyses are performed on all factors and the TP concentration to construct a multiple regression model, the verification accuracies of all models are compared, and the model with the highest accuracy is selected to estimate the PP concentrations.
For example, Landsat satellite data span the longest time scale, and these data are thus convenient for analyzing the laws of long-term water quality changes. The OLI-1/2 and TM data have the highest spatial resolutions, reaching 30 m. At the same time, the spectral resolutions of these datasets are relatively low, with five and four bands, respectively, failing to meet the band requirements for the PP concentration estimation model constructed for hyperspectral remotely sensed data in Section 3.2. Therefore, the traditional empirical model was used herein to construct the remote sensing-based PP concentration estimation model. In this study, the Landsat 9 OLI-2 sensor was selected for further research and analysis. First, according to the OLI-2 band-setting characteristics, the band combination comprising the remotely sensed reflectance data collected at Band 3 (the green band) and Band 4 (the near-infrared band) had the best correlation with the PP concentration. The constructed estimation model is shown in Figure 7. The R2 value reached 0.60; the verification results are shown in the right panel of the figure, with MAPE and RMSE values of 26.84% and 0.014 mg/L, respectively.
y = −0.091x + 0.165.  R2 = 0.60
where y is PP and x is Rrs(B3/B4).

4. Results and Discussion

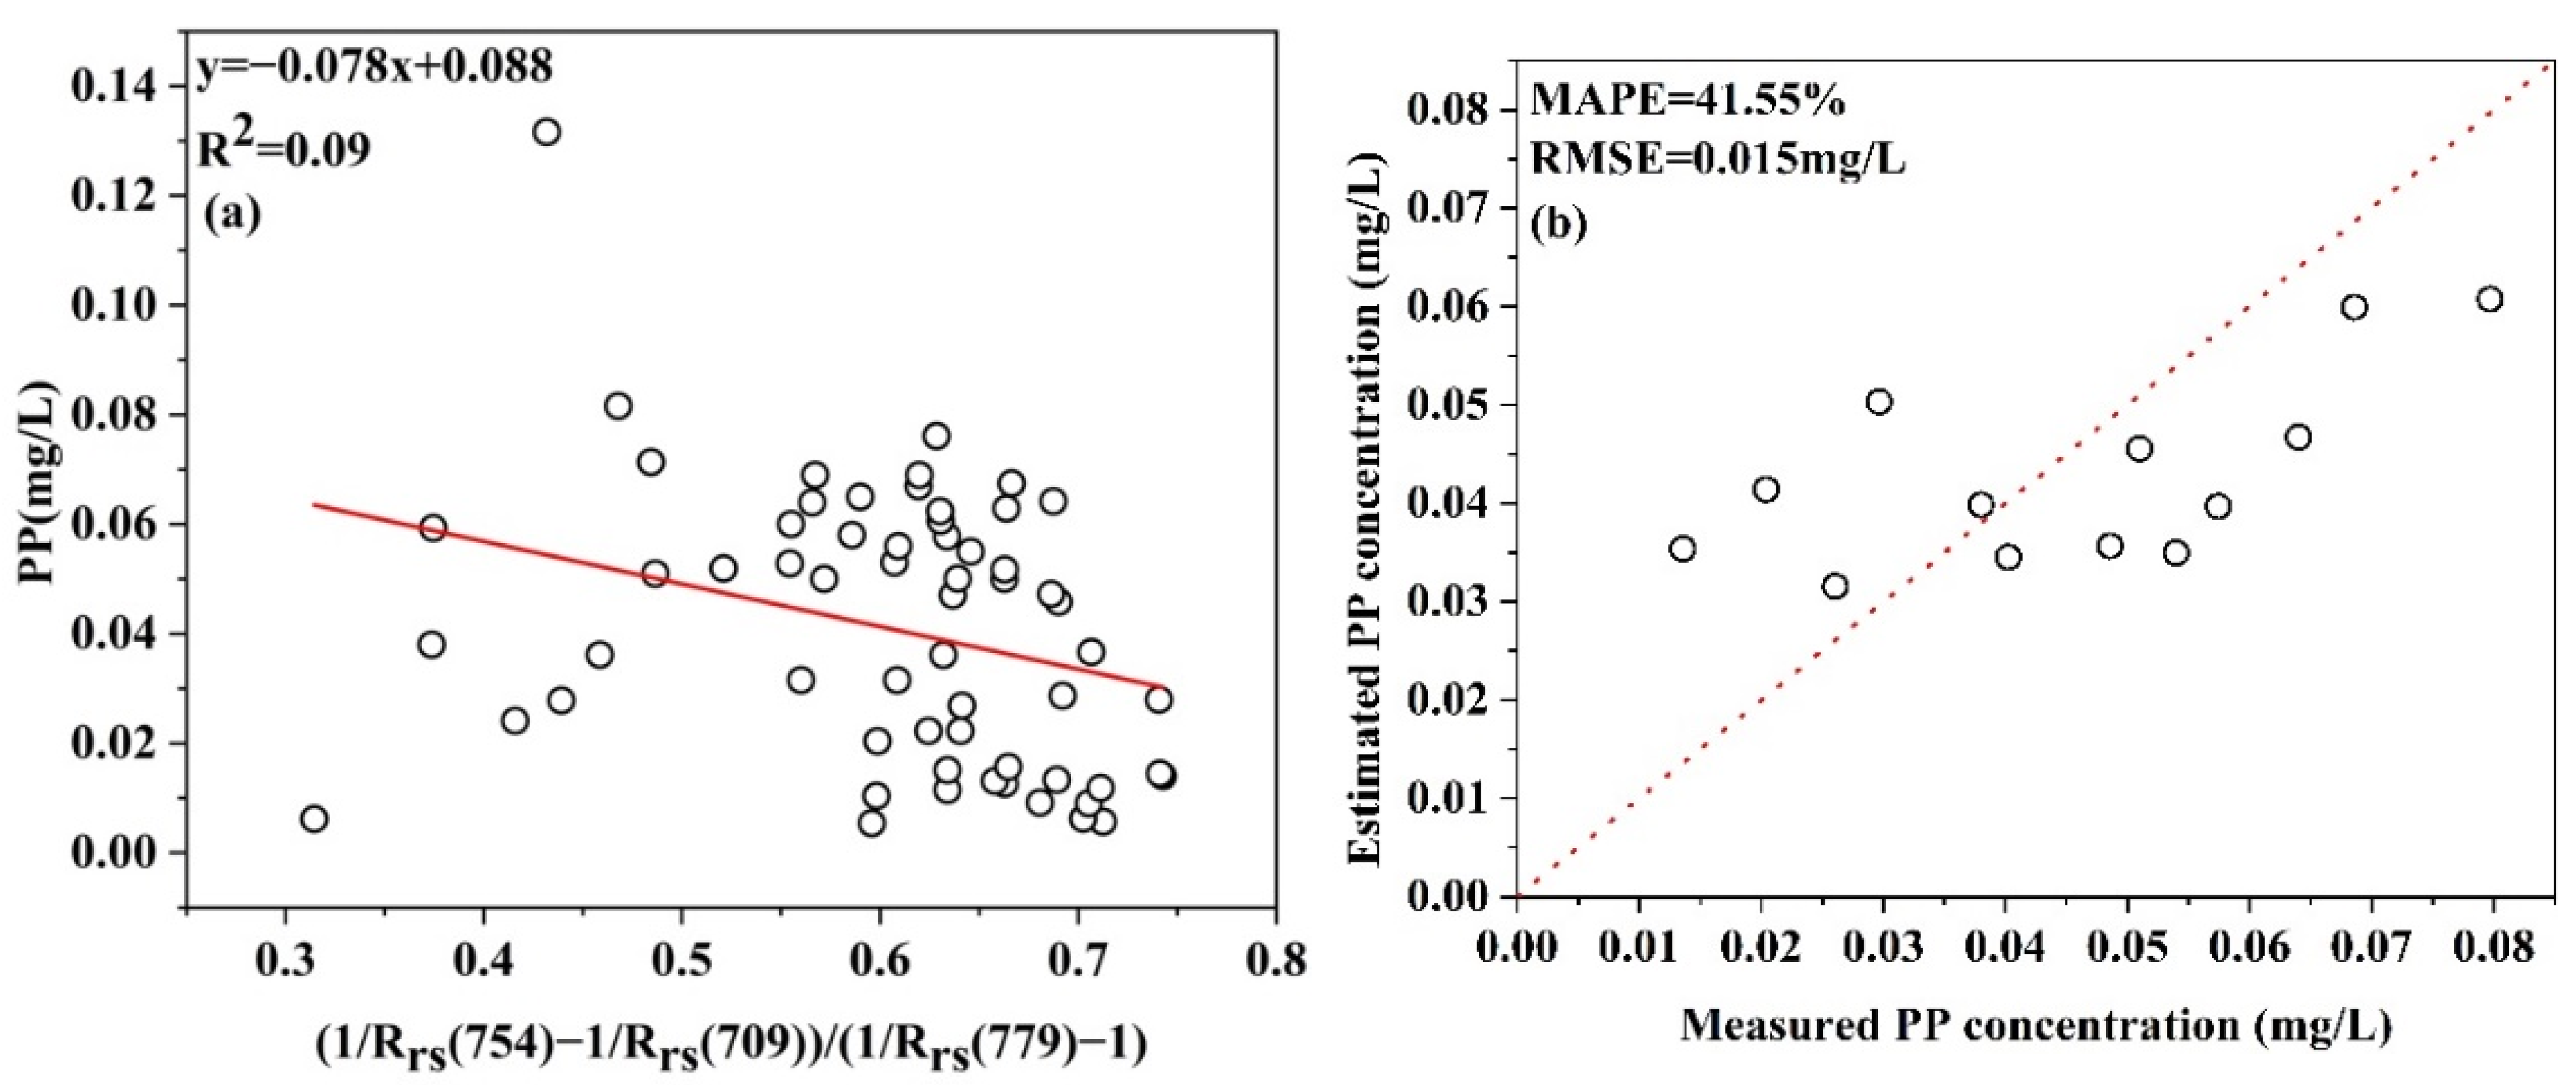
4.1. Feasibility Analysis of Estimating the PP Concentration through Remote Sensing Methods

The forms of phosphorus found in lakes can be mainly divided into granular phosphorus and dissolved phosphorus. PP accounts for more than 50% of TP in coastal waters and shallow lakes in China [1]. In areas with severe algal blooms, phosphorus is adsorbed and absorbed by algal particles and converted into granular phosphorus, so good correlations can be found between the granular phosphorus concentration and Chl-a concentration. In estuary areas dominated by nonalgal particulate matter, phosphorus is more easily adsorbed on suspended matter due to the input of water from rivers into lakes. At the same time, due to the vigorous agitation associated with water flows in such areas, the phosphorus contents in the water also increase. Therefore, there is a good correlation between the PP concentration and the concentration of inorganic suspended solids. These characteristics provide the potential for estimating PP concentrations using remotely sensed data.
In lakes with high correlations between the PP and Chl-a concentrations, the spectral curves reflect typical eutrophication characteristics, indicating that these water bodies are dominated by planktonic algae [24]. In Dongting Lake, Hongze Lake, and Jiajiang River, where the inorganic suspended concentrations are well-correlated with the PP concentrations, although the overall reflectivity value is relatively high, the peak and trough changes are not obvious, and the change trend is relatively gentle, reflecting the characteristics of the main water body. These areas are dominated by nonpigmented suspended solids [1,7]. As can be seen from Figure 8, the PP concentration in Hongze Lake has a high correlation with total suspended matter (TSM), and the fitting accuracy R2 reaches 0.61, while the correlation with chlorophyll is weak, and the fitting accuracy reaches 0.29. The results show that the phosphorus in TSM and algae particles are important sources of PP in Hongze Lake, and the phosphorus in TSM for the main part. The optical characteristics of TSM and Chl-a provide the basis for the remote sensing estimation of PP. Therefore, because the Chl-a and TSM concentrations both greatly influence the remotely sensed reflectance characteristics of water surfaces, it is possible to estimate the PP concentration in water particles by analyzing the changes in the water surface spectrum.

4.2. Advantages and Applicability Analysis of the Constructed Semianalytical Model

Aiming to obtain a semianalytical remote sensing-based PP concentration estimation model, we selected existing remote sensing-based PP concentration estimation models for a comparative analysis. Zeng (2021) used the nonpigmented particulate matter absorption coefficient to build a semianalytical PP estimation model, with (1/Rrs(754) − 1/Rrs(709))/(1/Rrs(705) − 1) characterizing the absorption coefficient of nonpigmented particulate matter, thus establishing the relationship between this parameter and the PP concentration, allowing the subsequent estimation of PP concentrations. The model and estimation results are shown in Figure 9. The R2 value of the constructed model was 0.09, the MAPE was 41.55%, and the RMSE was 0.016 mg/L. Therefore, for inland lakes, the semianalytical model constructed based on the total particulate matter absorption coefficient is more advantageous compared to this model. The main reason for this difference is that the phosphorus content in nonpigmented particles cannot be ignored in inland water bodies. The total particle absorption coefficient was used to build a model that considers both pigmented and nonpigmented particles in lakes together, thus creating a model with advantages over other existing models.

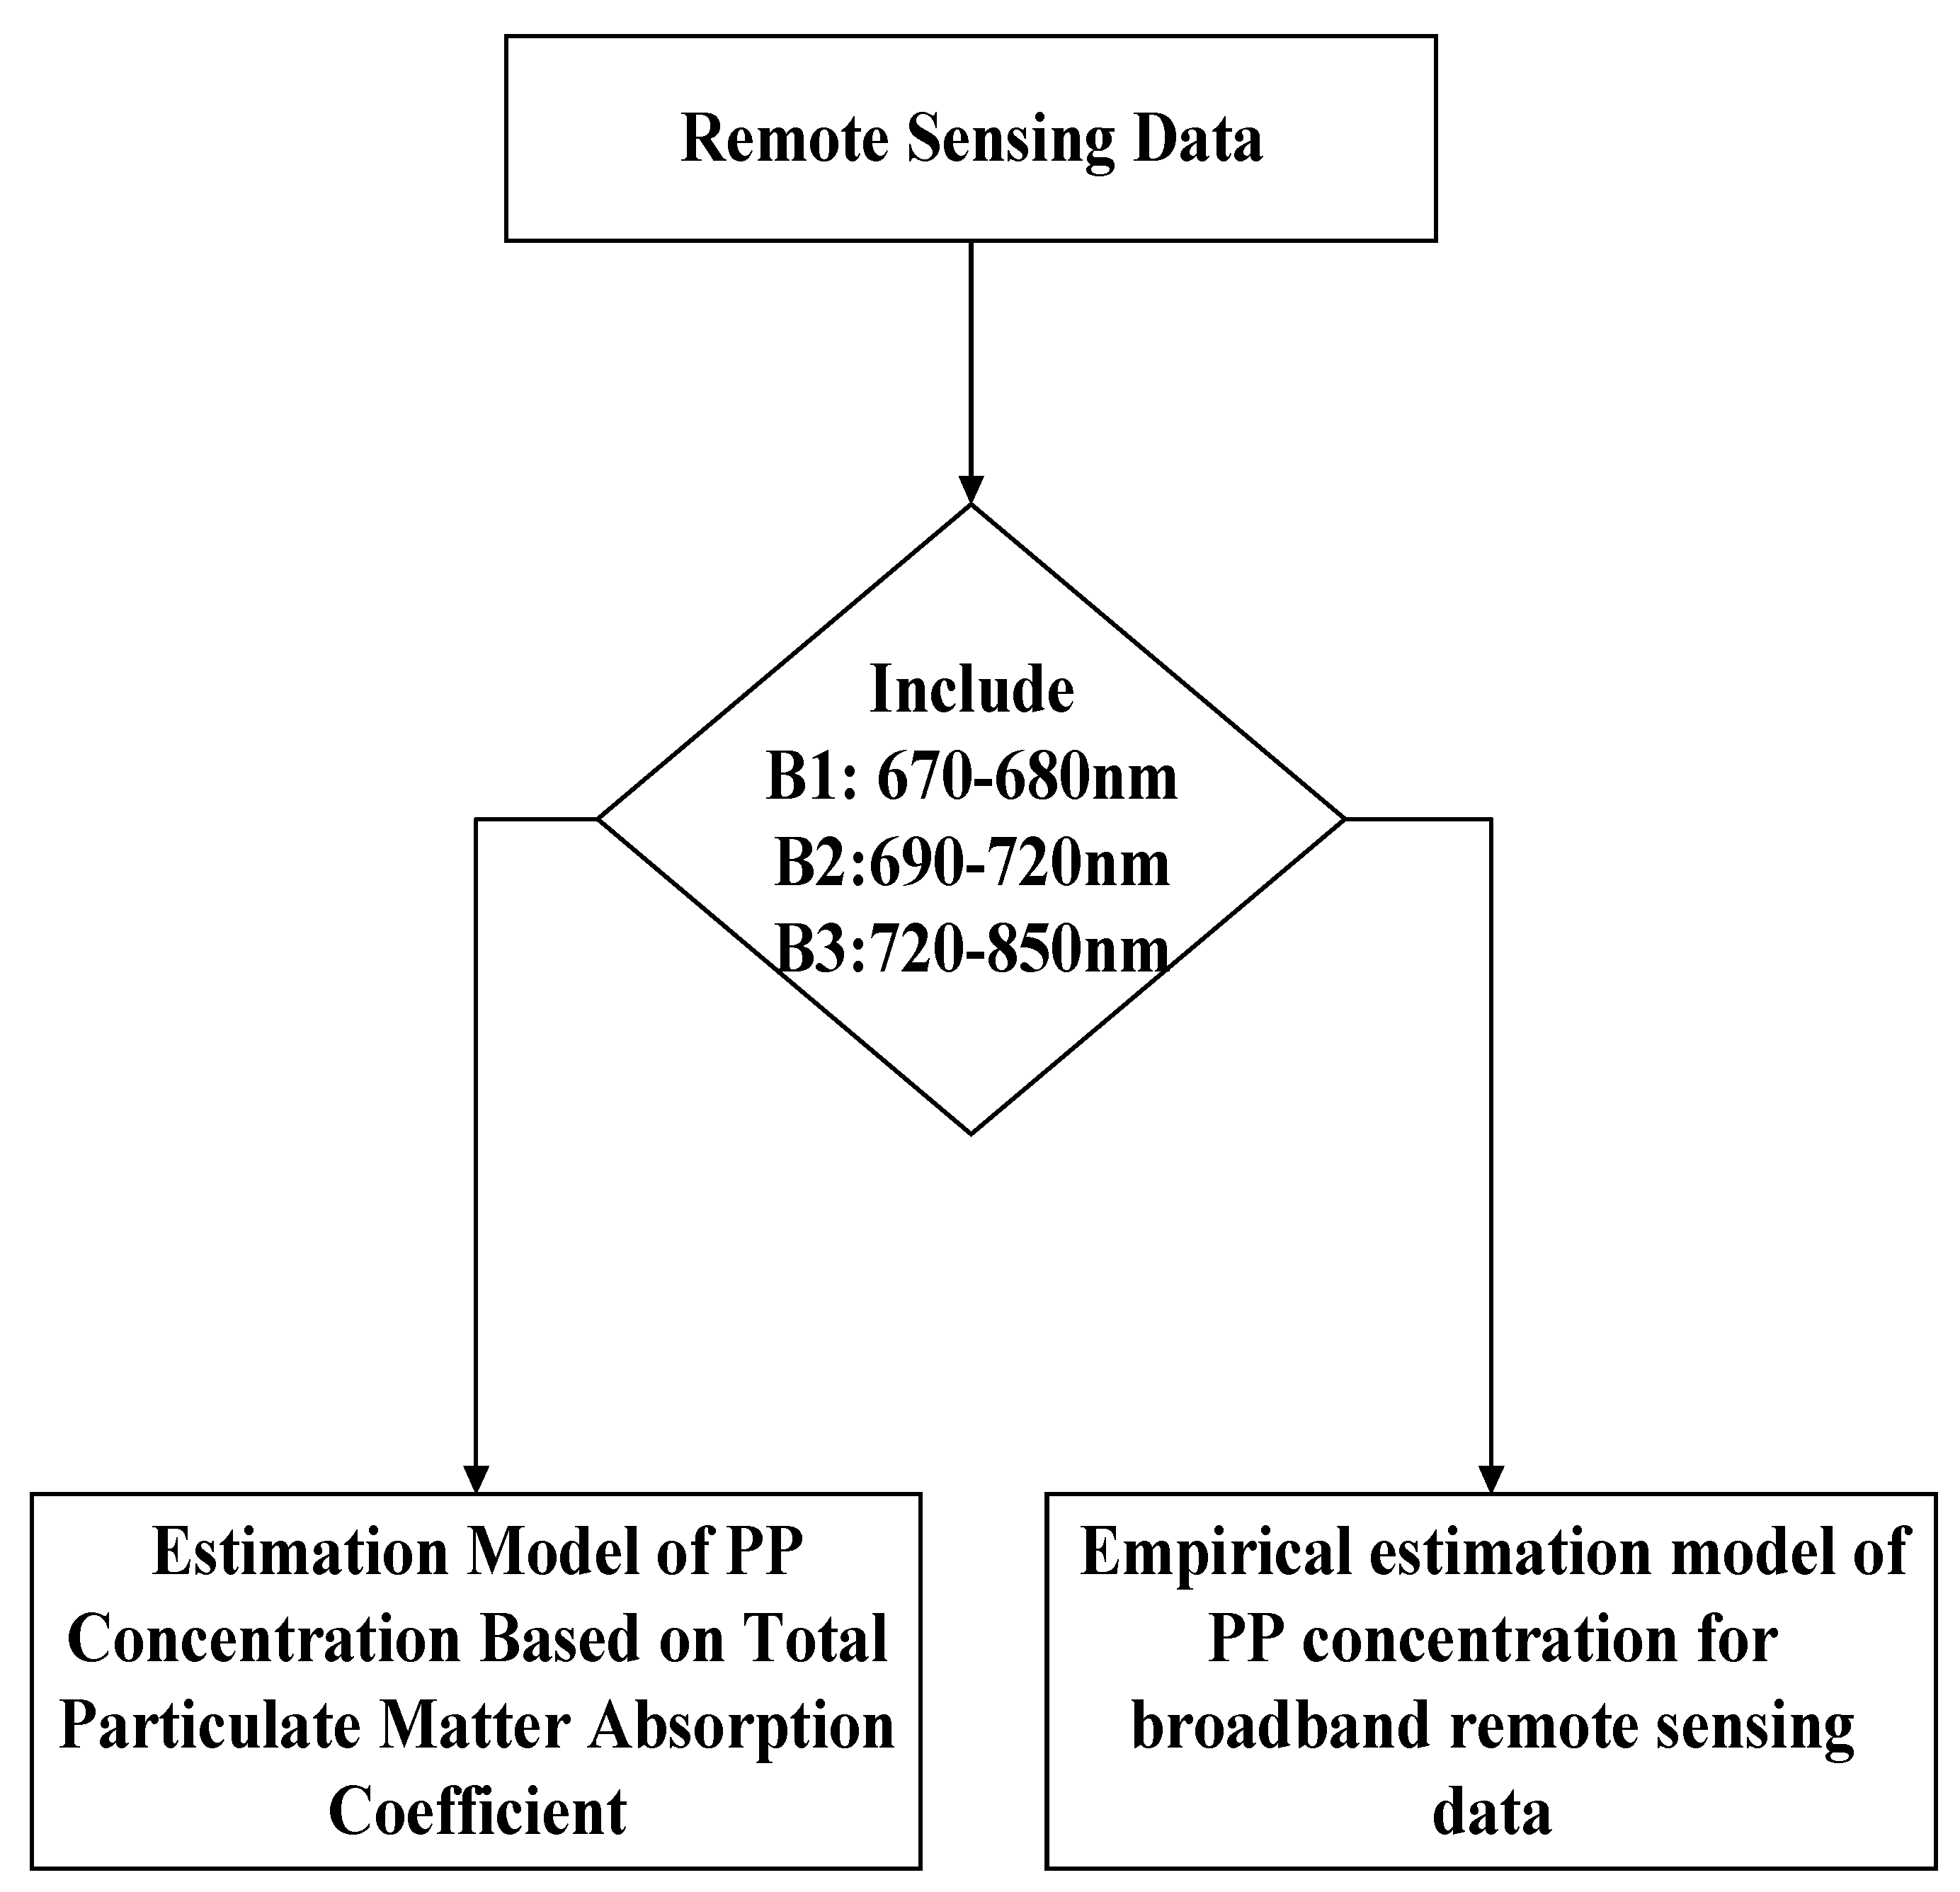
4.3. Models Selected for PP Concentration Estimations Based on Different Remotely Sensed Data Sources

In inland water quality monitoring research, a variety of remotely sensed images need to be used, though the band settings and band widths of these sensors differ extensively. Therefore, to apply the algorithm model constructed in this study to satellite-derived remotely sensed data, it was necessary to combine specific remotely sensed data sources. The correspondingly appropriate PP remote sensing-based estimation model was then selected to match the band characteristics of each data source. The specific selection process is shown in Figure 10. First, when the sensor band is set to include three bands similar to those of the semianalytical model, it is recommended that the absorption coefficient-based model be used, while the PP concentration semianalytical model is used to estimate the PP concentration. When the three-band requirement of the semianalytical model is not met, the PP concentration empirical estimation model derived for broadband remotely sensed data is used to estimate the PP concentration.
At present, the water color sensors commonly used to estimate water quality parameters mainly include MODIS, Sentinel 3 OLCI, and MERIS. In addition, data from the TM, OLI, HJ1A/B sensors and other data are often used in inland water environment monitoring research. In this study, MODIS, Sentinel 3 OLCI, and Landsat 9 OLI-2 data were used for the example analyses. Based on the models constructed from these data, some model-selection suggestions for estimating PP concentrations in inland lakes using data from different sensors were proposed. The commonly available PP concentration estimation models are listed in Table 2.

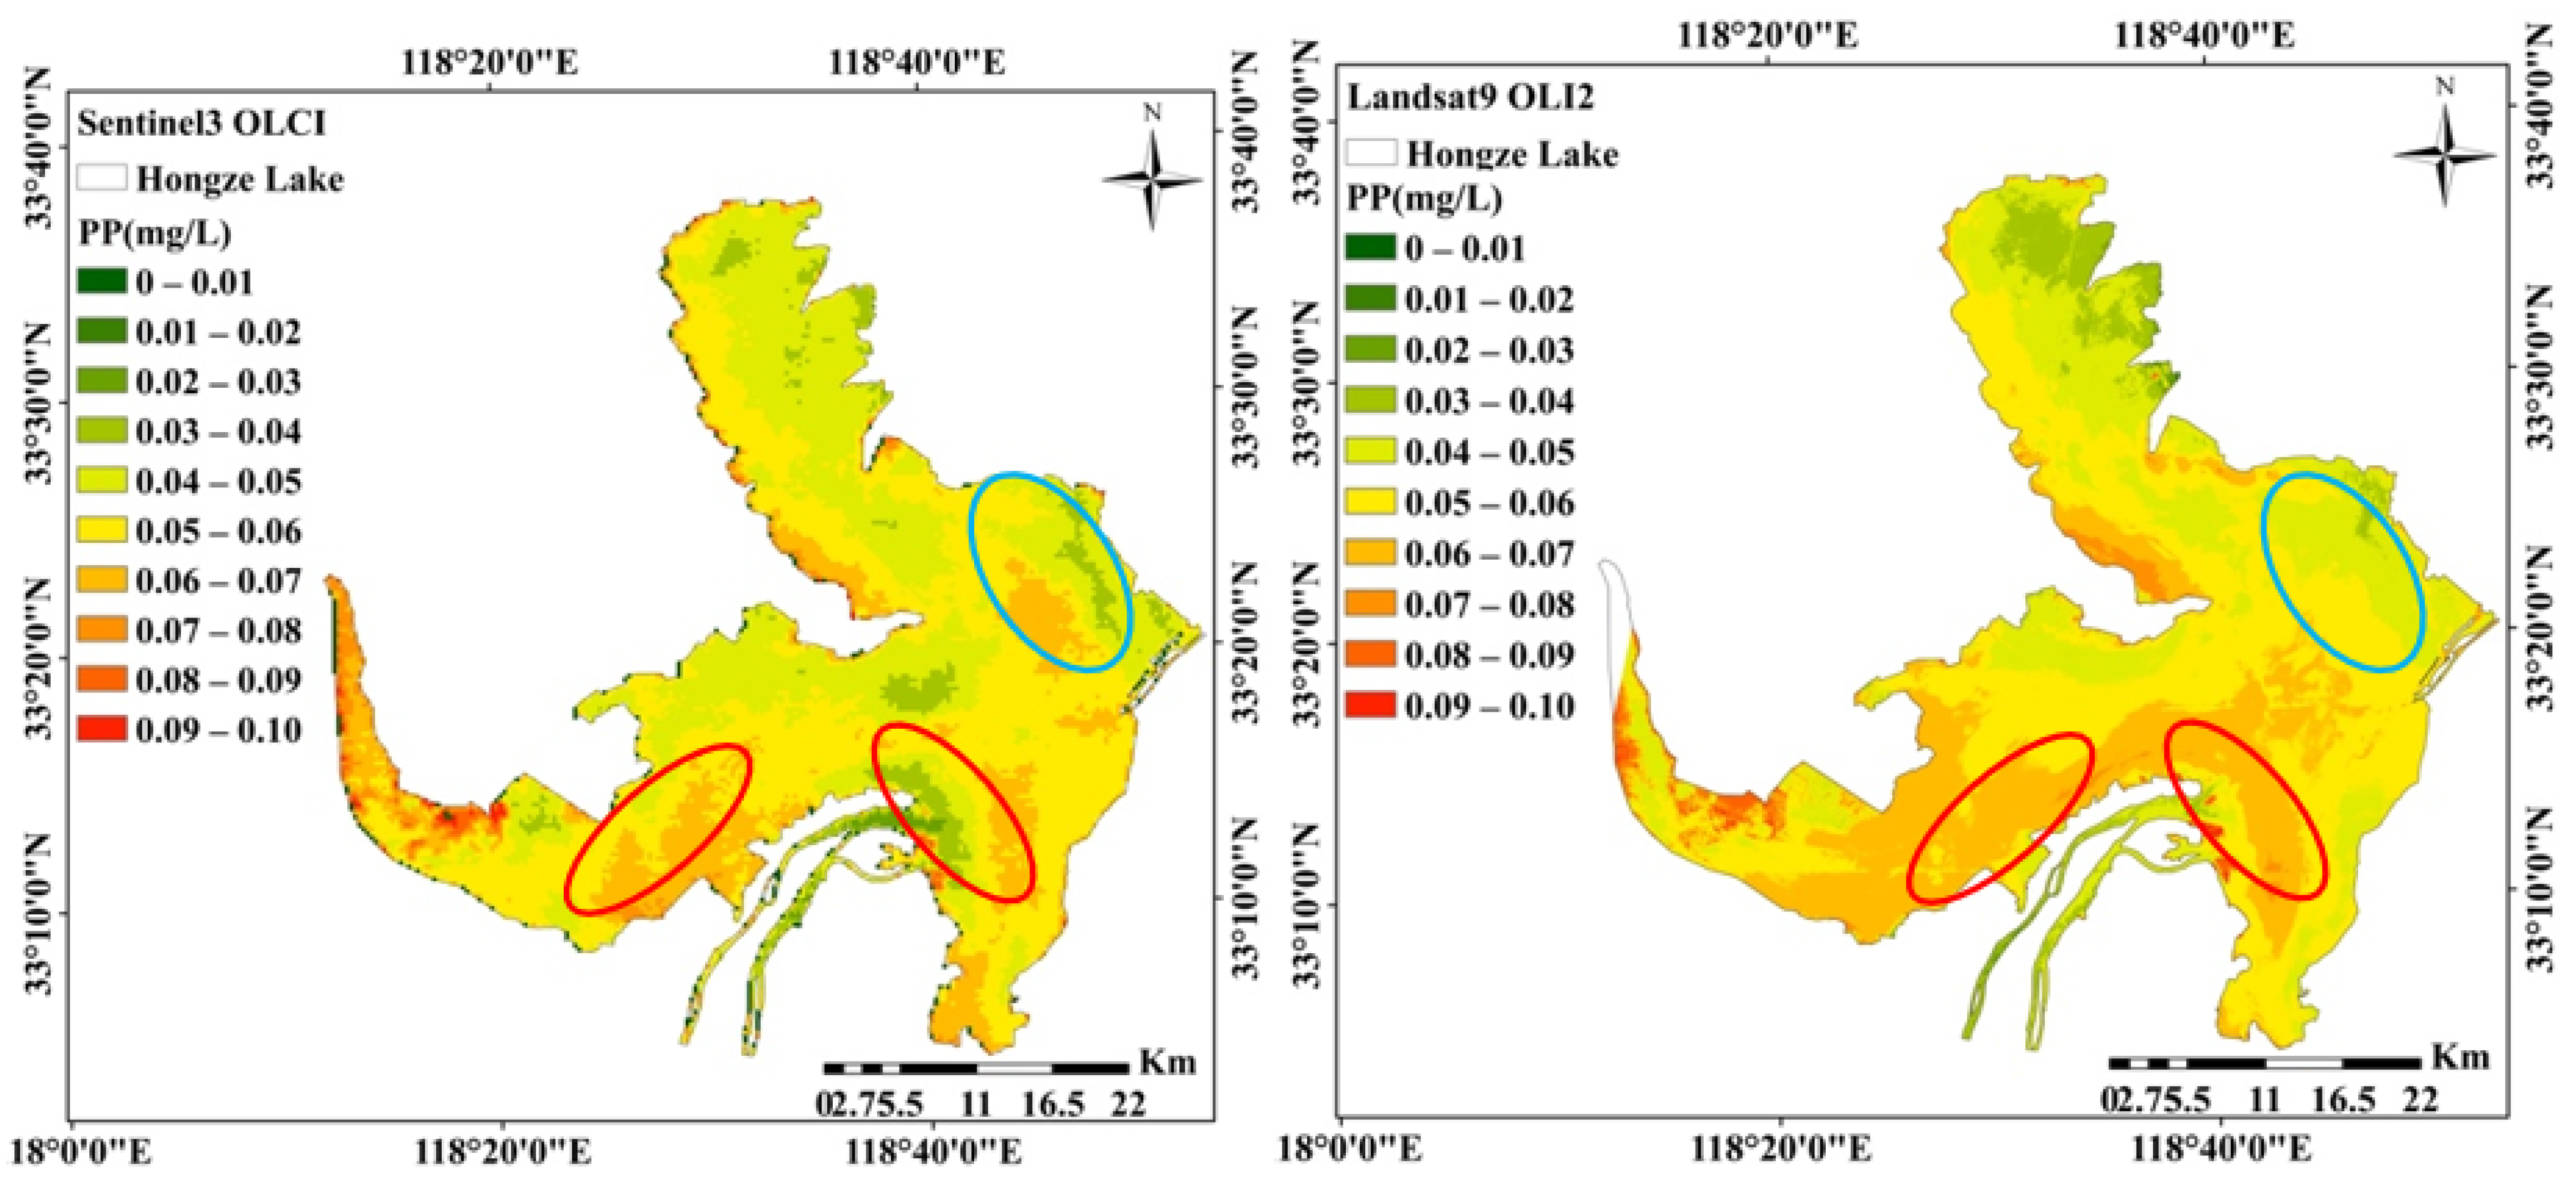
4.4. Validation of the Constructed Models Using Image Data of Hongze Lake

The semianalytical model constructed to obtain PP estimations using Sentinel 3 OLCI data and the empirical model constructed to obtain PP estimation using Landsat 9 OLI-2 data were applied to the corresponding images on 16 January 2022. Figure 11 shows that the trend changes in the PP concentrations of Hongze Lake estimated by these two data sources on the same day were relatively consistent. The PP concentrations were lower in Chengzi Bay and higher in Huaihe Bay and in the southern coastal areas of Lihe Bay. The volume of incoming water sourced from the upstream Huai River decreases in winter, and the resuspension of sediments caused by wind leads to increased PP concentrations. According to historical weather records, on 16 January 2022, level-3 east winds prevailed in Hongze Lake. Huaihe Lake Bay has a large water surface and experiences strong sediment resuspension. In addition, due to the prevailing east winds, Lihe Bay and Huaihe Lake Bay were connected from east to west, and Lihe Bay was thus also easily affected by water agitation; thus, the PP concentrations in these two areas were relatively high.
It is worth mentioning that although the two images were collected on the same day, we still observed some differences between the PP estimation results obtained from the imagery. In the places circled in red in Figure 11 below, the OLI-derived estimation results were significantly higher than those obtained from OLCI data, while in the places circled in blue, the OLI estimation results were lower than the OLCI-derived estimations. According to the model verification results of the two datasets shown in Figure 5 and Figure 7, the PP concentration estimation model constructed using OLI data is more prone to overestimations and underestimations than that built using OLCI data, and the verification points were more dispersed from the 1:1 line. Although using Sentinel 3 OLCI data to estimate the PP concentrations in Hongze Lake resulted in more accurate findings, due to the low spatial resolution of these data, the distribution of PP concentrations could not be displayed in a more detailed manner than that reflected by the OLI data, especially in the estuary area. Therefore, according to different research purposes, suitable data sources can be chosen to analyze the distribution of PP concentrations in inland lakes.

5. Conclusions

In this study, we constructed a new semianalytical algorithm to estimate PP concentrations in Hongze Lake. By analyzing the PP estimation mechanism, the relationship between the PP concentration and Rrs was established through the use of at. The method by which at was separated using Rrs was then studied, and finally, a semianalytical PP estimation model was constructed, the MAPE and RMSE values of which were 16.80% and 0.04 mg/L, respectively. Compared to other existing algorithms, the algorithm constructed in this paper had a higher precision and a better fitting accuracy in low-value regions. Moreover, the constructed model was applied to Sentinel 3 OLCI data, and the resulting MAPE and RMSE values were 16.32% and 0.010 mg/L, respectively. Additionally, a PP concentration modeling process was established for use with broadband image data. Taking a Landsat 9 OLI-2 image as an example, the accuracy of the constructed model was reflected in the MAPE and RMSE values of 26.84% and 0.014 mg/L, respectively. Then, for remotely sensed data with different spectral resolutions, selection criteria were established for the remote sensing-based PP concentration estimation models. Last, the derived method was applied to Sentinel 3 OLCI and Landsat 9 OLI-2 data, and the results show that the PP concentrations estimated in Hongze Lake were consistent between the two same-day images. On 16 January 2022, the PP concentration was lower in Chengzi Bay and higher in Huaihe Bay and in the southern coastal areas of Lihe Bay, mainly due to wind-induced sediment resuspension.
In general, the semianalytical algorithm and the standard of building a remote sensing-based PP concentration monitoring model demonstrated herein could be extended to other similar environments and ecological locations to document and explore the spatiotemporal distribution of PP concentrations.

Author Contributions

C.D. and K.S. conceived and designed the method and the experiments. C.D., N.L., C.Y. and J.P. conducted the field experiments and investigations. C.D. and K.S. performed data processing and analysis. C.D. wrote the original manuscript. K.S., Y.L. and H.L. revised the manuscript. C.D. conducted the project administration and funding acquisition. All authors have read and agreed to the published version of the manuscript.

Funding

This research was funded by the National Natural Science Foundation of China [41922005], [42001296], and [42071299], the Natural Science Foundation of Jiangsu Province [BK20191058], the Natural Science Research Project of Jiangsu Higher Education Institution [19KJB170001], [18KJA180002], the Scientific Instrument Developing Project of the Chinese Academy of Sciences (YJKYYQ20200071), the Tibetan Plateau Scientific Expedition and Research Program [2019QZKK0202], the NIGLAS foundation [E1SL002] and Jiangsu forestry science and technology innovation and promotion project [LYKJ [2019]32].

Institutional Review Board Statement

Not applicable.

Informed Consent Statement

Not applicable.

Data Availability Statement

Not applicable.

Acknowledgments

We thank the ESA and NASA for providing the Sentinel and Landsat data.

Conflicts of Interest

The authors declare no conflict of interest.

References

  1. Du, C.; Wang, Q.; Li, Y.; Lyu, H.; Zhu, L.; Zheng, Z.; Wen, S.; Liu, G.; Guo, Y. Estimation of total phosphorus concentration using a water classification method in inland water. Int. J. Appl. Earth Obs. 2018, 71, 29–42. [Google Scholar] [CrossRef]
  2. Wang, M.; Wu, X.; Li, D.; Li, X.; Huang, Y. Annual variation of different phosphorus forms and response of algae growth in Meiliang bay of Taihu lake. Huan Jing Ke Xue Huanjing Kexue 2015, 36, 80–86. [Google Scholar] [PubMed]
  3. Silió-Calzada, A.; Bricaud, A.; Uitz, J.; Gentili, B. Estimation of new primary production in the Benguela upwelling area, using ENVISAT satellite data and a model dependent on the phytoplankton community size structure. J. Geophys. Res. Ocean. 2008, 113. [Google Scholar] [CrossRef]
  4. Isenstein, E.; Park, M.-H. AssessmentofnutrientdistributionsinLakeChamplainusingsatelliteremotesensing. J. Environ. Sci. 2014, 26, 1831–1836. [Google Scholar] [CrossRef] [PubMed]
  5. Wu, C.F.; Wu, J.P.; Qi, J.G.; Zhang, L.; Huang, H.Q.; Lou, L.P.; Chen, Y.X. Empirical estimation of total phosphorus concentration in the mainstream of the Qiantang River in China using Landsat TM data. Int. J. Remote Sens. 2010, 31, 2309–2324. [Google Scholar] [CrossRef]
  6. Liu, J.; Zhang, Y.; Yuan, D.; Song, X. Empirical Estimation of Total Nitrogen and Total Phosphorus Concentration of Urban Water Bodies in China Using High Resolution IKONOS Multispectral Imagery. Water 2015, 7, 6551–6573. [Google Scholar] [CrossRef]
  7. Xiong, J.; Lin, C.; Ma, R.; Cao, Z. Remote sensing estimation of lake total phosphorus concentration based on MODIS: A case study of Lake Hongze. Remote Sens. 2019, 11, 2068. [Google Scholar] [CrossRef]
  8. Sun, D.; Qiu, Z.; Li, Y.; Shi, K.; Gong, S. Detection of Total Phosphorus Concentrations of Turbid Inland Waters Using a Remote Sensing Method. Water Air Soil Pollut. 2014, 225, 1953. [Google Scholar] [CrossRef]
  9. Song, K.; Li, L.; Tedesco, L.; Li, S.; Shi, K.; Hall, B. Remote Estimation of Nutrients for a Drinking Water Source Through Adaptive Modeling. Water Resour. Manag. 2014, 28, 2563–2581. [Google Scholar] [CrossRef]
  10. Chang, N.B.; Xuan, Z.; Yang, Y.J. Exploring spatiotemporal patterns of phosphorus concentrations in a coastal bay with MODIS images and machine learning models. Remote Sens. Environ. 2013, 134, 100–110. [Google Scholar] [CrossRef]
  11. Zeng, S.; Du, C.; Li, Y.; Lyu, H.; Dong, X.; Lei, S.; Li, J.; Wang, H. Monitoring the particulate phosphorus concentration of inland waters on the Yangtze Plain and understanding its relationship with driving factors based on OLCI data. Sci. Total Environ. 2022, 809, 151992. [Google Scholar] [CrossRef] [PubMed]
  12. Cao, Z.; Duan, H.; Feng, L.; Ma, R.; Xue, K. Climate- and human-induced changes in suspended particulate matter over Lake Hongze on short and long timescales. Remote Sens. Environ. 2017, 192, 98–113. [Google Scholar] [CrossRef]
  13. Zhang, Y.; Shi, K.; Zhang, Y.; Moreno-Madrinan, M.J.; Li, Y.; Li, N. A semi-analytical model for estimating total suspended matter in highly turbid waters. Opt. Express 2018, 26, 34094–34112. [Google Scholar] [CrossRef] [PubMed]
  14. Huang, C.; Guo, Y.; Yang, H.; Li, Y.; Zou, J.; Zhang, M.; Lyu, H.; Zhu, A.; Huang, T. Using remote sensing to track variation in phosphorus and its interaction with chlorophyll-a and suspended sediment. IEEE J. Sel. Top. Appl. Earth Obs. Remote Sens. 2015, 8, 4171–4180. [Google Scholar] [CrossRef]
  15. Lorenzen, C.J. Determination of chlorophyll and pheo-pigments: Spectrophotometric equations. Limnol. Oceanogr. 1967, 12, 343–346. [Google Scholar] [CrossRef]
  16. Chen, W. Discussion on possible error for phytoplankton chlorophyll-α concentration analysis using hot-ethanol extraction method. J. Lake Sci. 2006, 18, 550–552. [Google Scholar]
  17. Mitchell, B.G. Algorithms for determining the absorption coefficient for aquatic particulates using the quantitative filter technique. In Proceedings of the SPIE, Ocean Optics X, Orlando, IL, USA, 16–20 April 1990; pp. 137–149. [Google Scholar]
  18. Mitchell, B.G.; Kahru, M.; Wieland, J.; Stramska, M.; Mueller, J. Determination of spectral absorption coefficients of particles, dissolved material and phytoplankton for discrete water samples. Ocean. Opt. Protoc. Satell. Ocean. Color Sens. Valid. Revis. 2002, 3, 231. [Google Scholar]
  19. Morel, A.; Mueller, J.L. Normalized water-leaving radiance and remote sensing reflectance: Bidirectional reflectance and other factors. Ocean. Opt. Protoc. Satell. Ocean. Color Sens. Valid. Revis. 2002, 2, 183–210. [Google Scholar]
  20. Zhang, Y.; Shi, K.; Zhang, Y.; Moreno-Madriñán, M.J.; Zhu, G.; Zhou, Y.; Yao, X. Long-term change of total suspended matter in a deep-valley reservoir with HJ-1A/B: Implications for reservoir management. Environ. Sci. Pollut. Res. 2019, 26, 3041–3054. [Google Scholar] [CrossRef]
  21. Zheng, Z.; Li, Y.; Guo, Y.; Xu, Y.; Liu, G.; Du, C. Landsat-Based Long-Term Monitoring of Total Suspended Matter Concentration Pattern Change in the Wet Season for Dongting Lake, China. Remote Sens. 2015, 7, 13975–13999. [Google Scholar] [CrossRef]
  22. Dall’Olmo, G.; Gitelson, A.A. Effect of bio-optical parameter variability on the remote estimation of chlorophyll-a concentration in turbid productive waters: Experimental results. Appl. Optics 2005, 44, 412–422. [Google Scholar] [CrossRef] [PubMed]
  23. Gitelson, A.A.; Dall’Olmo, G.; Moses, W.; Rundquist, D.C.; Barrow, T.; Fisher, T.R.; Gurlin, D.; Holz, J. A simple semi-analytical model for remote estimation of chlorophyll-a in turbid waters: Validation. Remote Sens. Environ. 2008, 112, 3582–3593. [Google Scholar] [CrossRef]
  24. Du, C.; Li, Y.; Lyu, H.; Liu, N.; Zheng, Z.; Li, Y. Remote estimation of total phosphorus concentration in the Taihu Lake using a semi-analytical model. Int. J. Remote Sens. 2020, 41, 7993–8013. [Google Scholar] [CrossRef]
Figure 1. The study area and the distribution of sampling points.
Remotesensing 14 03863 g001
Figure 2. (a) The correlation between TP and ap; (b) the ap absorption curve.
Remotesensing 14 03863 g002
Figure 3. (a) The TP concentration and ap fitting curve at 677 nm; (b) the aph and ap fitting curve at 677 nm.
Remotesensing 14 03863 g003
Figure 4. (a) The aph and Rrs fitting curve at 677 nm; (b) comparison between the measured PP values and those estimated based on measured hyperspectral data.
Remotesensing 14 03863 g004
Figure 5. Panels (ad) provide comparisons of the measured PP values and those estimated based on Sentinel 3 OLCI data.
Remotesensing 14 03863 g005
Figure 6. Flow chart of the construction process of an empirical PP concentration estimation model for broadband remotely sensed data.
Remotesensing 14 03863 g006
Figure 7. (a) The PP and Rrs fitting curve; (b) comparison of the measured PP values and those estimated based on measured hyperspectral data.
Remotesensing 14 03863 g007
Figure 8. (a) The PP and TSM fitting curve; (b) the PP and Chl-a fitting curve.
Remotesensing 14 03863 g008
Figure 9. (a) The PP and Rrs fitting curve; (b) comparison of the measured and estimated PP values.
Remotesensing 14 03863 g009
Figure 10. Flow chart of the remote sensing-based model workflow used in this study to estimate PP concentrations.
Remotesensing 14 03863 g010
Figure 11. PP concentration estimations obtained from remotely sensed data obtained on 16 January 2022.
Remotesensing 14 03863 g011
Table 1. Remotely sensed image acquisition dates.
NameDateSpatial Resolution (m)
Sentinel 3 OLCI16 January 2022500
Landsat 9 OLI-216 January 202230
Table 2. Selection of common sensors for estimating PP concentrations in Hongze Lake.
SensorModel for Estimating PP Concentrations
MODISSemianalytical model based on at
Sentinel 3 OLCISemianalytical model based on at
MERISSemianalytical model based on at
TMEmpirical model
OLI-1/2Empirical model
HJ1A/B CCDEmpirical model
Gaofen 1Empirical model
Publisher’s Note: MDPI stays neutral with regard to jurisdictional claims in published maps and institutional affiliations.

