Communication

Laboratory Evaluation of the (355, 532) nm Particle Depolarization Ratio of Pure Pollen at 180.0° Lidar Backscattering Angle

Institut Lumière Matière, Université Claude Bernard Lyon 1, University of Lyon, CNRS, 69622 Villeurbanne, France
*
Author to whom correspondence should be addressed.
Remote Sens. 2022, 14(15), 3767; https://doi.org/10.3390/rs14153767
Submission received: 29 June 2022 / Revised: 29 July 2022 / Accepted: 1 August 2022 / Published: 5 August 2022
(This article belongs to the Special Issue Selected Papers of the European Lidar Conference)

Abstract

:
While pollen is expected to impact public human health and the Earth’s climate more and more in the coming decades, lidar remote sensing of pollen has become an important developing research field. To differentiate among the pollen taxa, a polarization lidar is an interesting tool since pollen exhibit non-spherical complex shapes. A key attribute is thus the lidar particle depolarization ratio (PDR) of pollen, which is however difficult to quantify as pollen are large and complex-shaped particles, far beyond the reach of light scattering numerical simulations. In this paper, a laboratory π-polarimeter is used to accurately evaluate the PDR of pure pollen, for the first time at the lidar exact backscattering angle of 180.0°. We hence reveal the lidar PDR of pure ragweed, ash, birch, pine, cypress and spruce pollens at 355 and 532 nm lidar wavelengths, as presented at the ELC 2021 conference. A striking result is the spectral dependence of the lidar PDR, highlighting the importance of dual-wavelength (or more) polarization lidars to identify pollen taxa. These spectral and polarimetric fingerprints of pure pollen, as they are accurate, can be used by the lidar community to invert multi-wavelength lidar polarization measurements involving pollen.

Graphical Abstract

1. Introduction

Pollens are biological aerosols which impact public health [1] by inducing strong allergies. The associated economical cost of such allergies is impressive, reaching up to EUR 150 billion in Europe in 2014 [2]. This economical cost is furthermore expected to increase in the coming decades due to global warming, which extends the length of the pollen season and the geographical repartition of pollen plants. Indeed, pollen likewise impacts the Earth’s climate [3] through light scattering and absorption processes by increasing the IR downwelling flux [4] and also by acting as cloud condensation nuclei [5]. Quantifying these health and climatic impacts is however challenging, firstly because of the number of involved pollen species, which is around 4000 [6]. In addition, each pollen taxon exhibits a large size, in the range of several tens of micrometers, and a complex nonspherical shape, with small-scale morphological features such as spikes, holes and apertures [7]. Consequently, no analytical solutions to the Maxwell’s equations exists for such large size and complex-shaped particles. Hence, light scattering and absorption by pollen is still to be quantified, which is key for radiative transfer applications involving pollens [8]. Furthermore, the health and climatic impacts of pollen are difficult to manage as pollen grains can be transported over large distances, far from the source regions [9,10], up to a continental scale [11]. If atmospheric transport models have been developed to forecast pollen concentrations [12,13], such models rely on several assumptions, which should be carefully checked.
To face such a complexity, lidar remote sensing instruments are coveted as they can provide time-altitude maps of pollen particle backscattering under atmospheric conditions. The literature on lidar remote sensing of pollen however remains sparse. After pioneering work by Sassen et al. (2008) [14] and then Noh et al. (2013) [15], lidar remote sensing of pollen recently regained interest, possibly due to the emerging urgency of this topic. To detect and identify the involved pollen species, two main approaches have hence recently been developed: (i) the fluorescence technique, based on UV-light absorption by pollen [16], where pollens are identified through their fluorescence spectra [17], and (ii), the polarization technique, based on the nonspherical shape of pollen grains, where pollens are identified through their ability to depolarize laser light, quantified by the so-called particle depolarization ratio (PDR). The downside of such polarization lidar field measurements however is that the measured atmospheric depolarization is nevertheless that of a particles mixture, which may lead to discrepancies in the retrieved lidar depolarization ratio [18]. Hence, detection of the involved pollen species from polarization lidar instruments remains limited to strong pollen events, occurring in the absence of other light depolarizing particles, such as mineral dust, as present during strong pollen events, involving ragweed [14], pine [19,20], birch or spruce [21]. Still, the lidar PDR can be used to separate pollen backscattering from background aerosol backscattering, as widely applied for mineral dust [18,22,23,24]. However, to be applied to pollen, such a partitioning algorithm requires prior knowledge of the intrinsic lidar PDR of pollen. Basically, the pollen lidar PDR depends on the size, on the shape and on the complex refractive index of the pollen grains [25,26]. Due to their large size and their complex shape, pollen are however beyond the reach of light scattering numerical simulations, which prevent accurate numerical simulations of the pollen lidar PDR. Approaching light scattering simulations may be applied but their inherent assumptions should then be carefully checked, and for that, laboratory measurements of the pollen lidar PDR are coveted. Likewise, the intrinsic lidar PDR of pollen cannot be directly revealed from lidar field measurements due to particle mixtures, as explained above. Hence, and as a result, to reveal the intrinsic lidar PDR of pollen, as required for polarization lidar remote sensing involving pollen, a laboratory experiment at lidar backscattering angle of 180.0° is coveted. Indeed, in the laboratory, the retrieved pollen lidar PDR is, by construction, that of pure pollen. Otherwise, laboratory light scattering experiments operating at near but not exact backscattering angle can actually only provide approximate values of the pollen lidar PDR. Indeed, if laboratory measurements at 177.5° can be helpful to classify pollens [27], the PDR at 177.5° clearly differs from what we measured at 180.0° specific lidar angle. Extrapolations to 180.0° may be proposed, but, as they rely on simplifying numerical assumptions ignoring the complexity in shape of pollen, they must be carefully discussed and for that, a laboratory measurement of the pollen lidar PDR at 180.0° is mandatory.
In this paper, on account of the above considerations, the lidar PDR of pure pollen is revealed at 355 and 532 nm wavelengths by a unique laboratory π-polarimeter operating at lidar exact backscattering angle of 180.0°, which is a world first [28]. Hence, and as presented at the ELC 2021 Conference, our laboratory π-polarimeter reveals the intrinsic lidar PDR of pure pollen at 355 and 532 nm wavelengths for the set of pollen taxa: ragweed, ash, birch, pine, cypress and spruce, chosen for their diversity in size and shape, to explore a range of pollen lidar PDR and for their impact on health and on the Earth’s climate. These spectral and polarimetric fingerprints reveal the wavelength dependence of the pollen lidar PDR, which can be used to help identifying pollen taxa, thus highlighting the importance of dual wavelength polarization lidar instruments. Section 2 is dedicated to our material and methods. There, after briefly presenting the pollen samples, focus is set on our laboratory methodology to quantify the intrinsic pollen lidar PDR at 355 and 532 nm wavelengths. Section 3 presents our light backscattering acquisition curves and provides our laboratory findings. This section ends with a discussion before concluding this work by proposing outlooks.

2. Materials and Methods

2.1. Lidar Particle Depolarization Ratio as Derived from Scattering Matrix Formalism
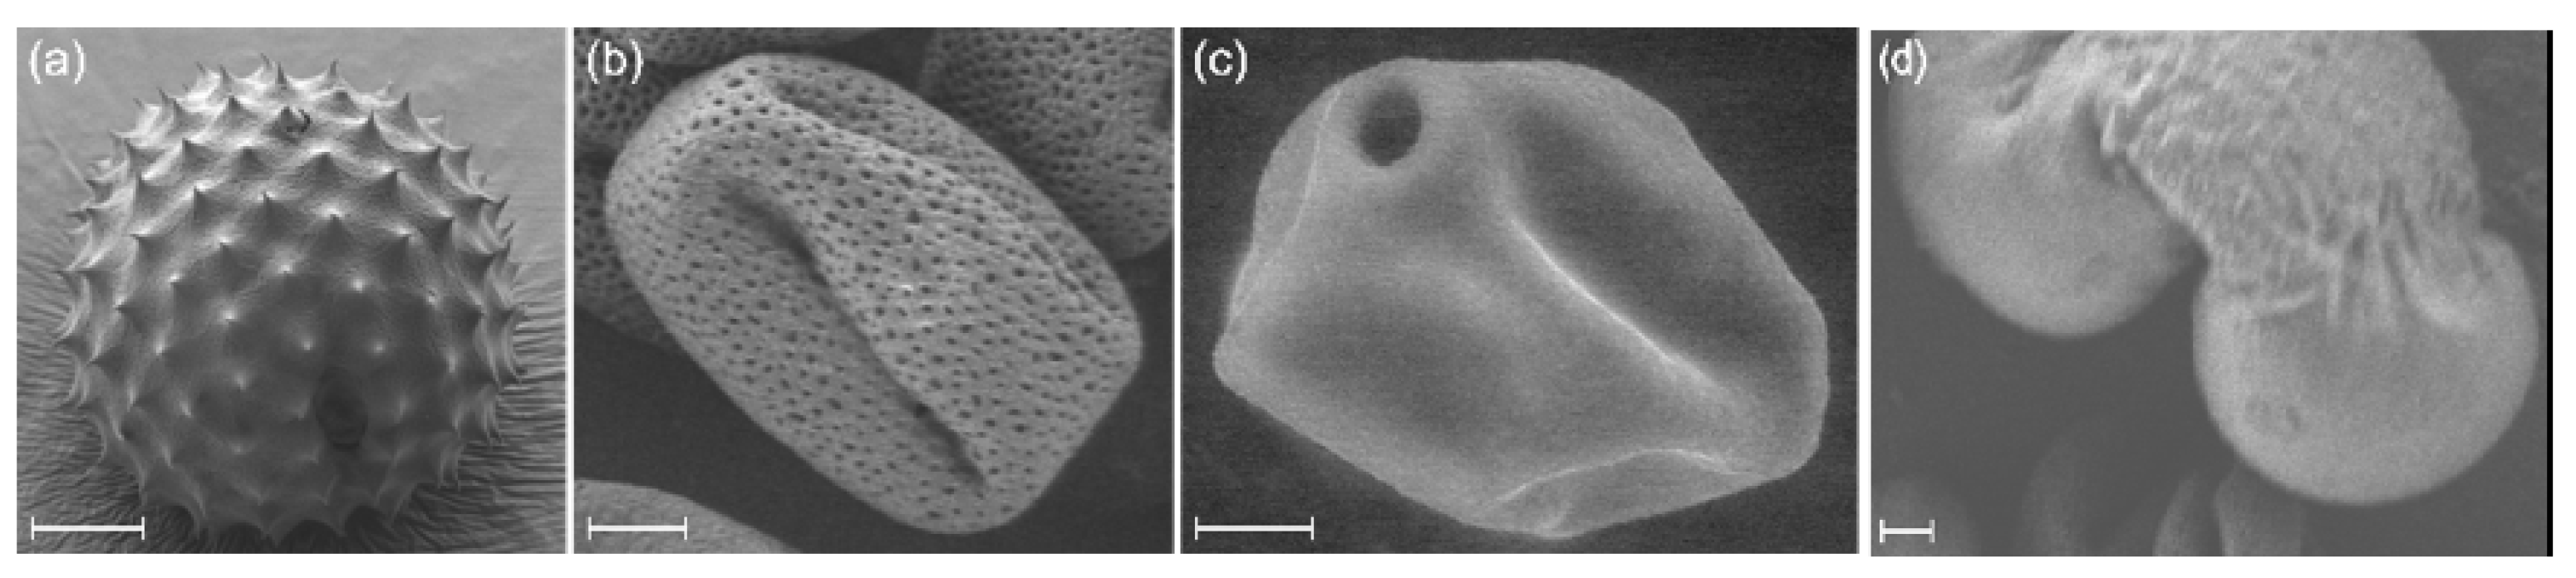
In polarization lidar instruments, the lidar particle depolarization ratio (PDR) is evaluated from the ratio of the backscattered light intensities I and I / / measured in the cross- and co-polarized lidar channels, after accurate calibration [29]. Basically, light polarization is described in the framework of the Stokes vectors and Mueller matrices [25,26]. In this formalism, the polarization state of the incident and backscattered radiations is described by their respective Stokes vector S t i = [ I i ,   Q i ,   U i ,   V i ] T and S t = [ I ,   Q ,   U ,   V ] T, where I corresponds to the light intensity, Q and U describe linear polarization, while V accounts for circular polarization. S t i and S t are related by a matrix, called the scattering matrix, which is block-diagonal only at the specific lidar exact backscattering angle of 180.0°:
( I Q U V ) = 1 k 2 d 2 [ F 11 , λ 0 0 0 0 F 22 , λ 0 0 0 0 F 22 , λ 0 0 0 0 F 11 , λ 2 F 22 , λ ] ( I i Q i U i V i )  
where k = 2 π / λ   is the wave-vector of the radiation with wavelength λ specified as a subscript, while d is the distance from the pollen particles to the detector. The scattering matrix elements F 11 , λ and F 22 , λ   hence describe the modification of the polarization state of the light during the backscattering process and are comprised of the information on the pollen taxa, as they depend on the size and shape of the considered pollen taxon. The scattering matrix elements also depend on the scattering angle, which are fixed at 180.0° exact backscattering angle here for lidar purposes. Then, noting that I / / = ( I + Q ) / 2   while I = ( I Q ) / 2 , the lidar PDR is equal to ( I Q ) / ( I + Q ) , thus the lidar P D R is expressed as follows:
P D R λ = ( 1 F 22 , λ / F 11 , λ ) / ( 1 + F 22 , λ / F 11 , λ )
Note that the lidar PDR defined in Equation (2) is then the particle linear depolarization ratio or PLDR. As pollen taxa are non-spherical, F 11 , λ   and F 22 , λ   are different, which results in light depolarization. In contrast, a hypothetical spherical pollen taxon would lead to equal values of F 11 , λ and F 22 , λ , leading to zero depolarization. The lidar PDR of pollen is then a key quantity to reveal the deviations of each taxon from particles’ isotropy. Moreover, as for the scattering matrix elements, the pollen lidar PDR depends on the size of the pollen grains, on their complex shape and also on the pollen complex refractive index. Likewise, the lidar PDR of pollen is also wavelength-dependent.

2.2. Pollen Samples

According to [6], over 4000 pollen taxa exist, which underscores their wide variety. The pollen taxa considered in this paper were chosen by following two selection criteria. First of all, for the pollen lidar, PDR actually depends on the size and on the complex shape of pollen grains; our main selection criterion is to consider pollen taxa differing in size and shape, to explore a range of pollen lidar PDR. As a second criteria, pollen taxa were selected for their impact on public health and on the Earth’s climate. As a result, the following pollen taxa are considered in this paper:
  • Ragweed (Ambrosia artemisiifolia)
  • Ash (Fraxinus americana)
  • Birch (Betula pendula)
  • Pine (Pinus strobus)
  • Cypress (Cupressus sempervirens)
  • Spruce (Picea abies)
Appendix A specifies the above two selection criteria for each considered pollen taxon. To specify the size and the shape of our pollen samples, scanning electron microscopic images (SEM) were taken, as can be seen in Figure 1. Such electron microscope images reveal the complexity in size and shape of each pollen taxon, with sizes ranging from 10 to 100 µm, alongside a smaller scale, sub micrometer structure. This small-scale morphological structure is itself very complex, as it is composed of spikes, holes and apertures, for example, for ragweed [30]. Each pollen taxon then exhibits its own size and its own complex nonspherical shape. These ornamentation elements, which add complexity to the shape of the pollen grains, modify the pollen lidar P D R . The size distribution of our ragweed pollen grains was measured with an aerodynamic particle sizer for consistency and was found to be equal to that specified by the supplier and also in agreement with that derived from SEM images issued from the state-of-the-art literature from palynological databases [6]. Our laboratory conditions (T = 22 °C, RH = 50%, stable over the whole experiment) are similar to observed atmospheric conditions in pollen lidar studies [21]. Pollen grains recently released into the atmosphere are dehydrated and undergo a folding and surface collapse process [31,32]. We hence used dried pollen grains. The pollen PDR may also vary with hygroscopicity, but studying this effect is far beyond the scope of this study.

2.3. Lidar PDR Retrieval with a Laboratory π-Polarimeter at Lidar Backscattering Angle of 180.0°

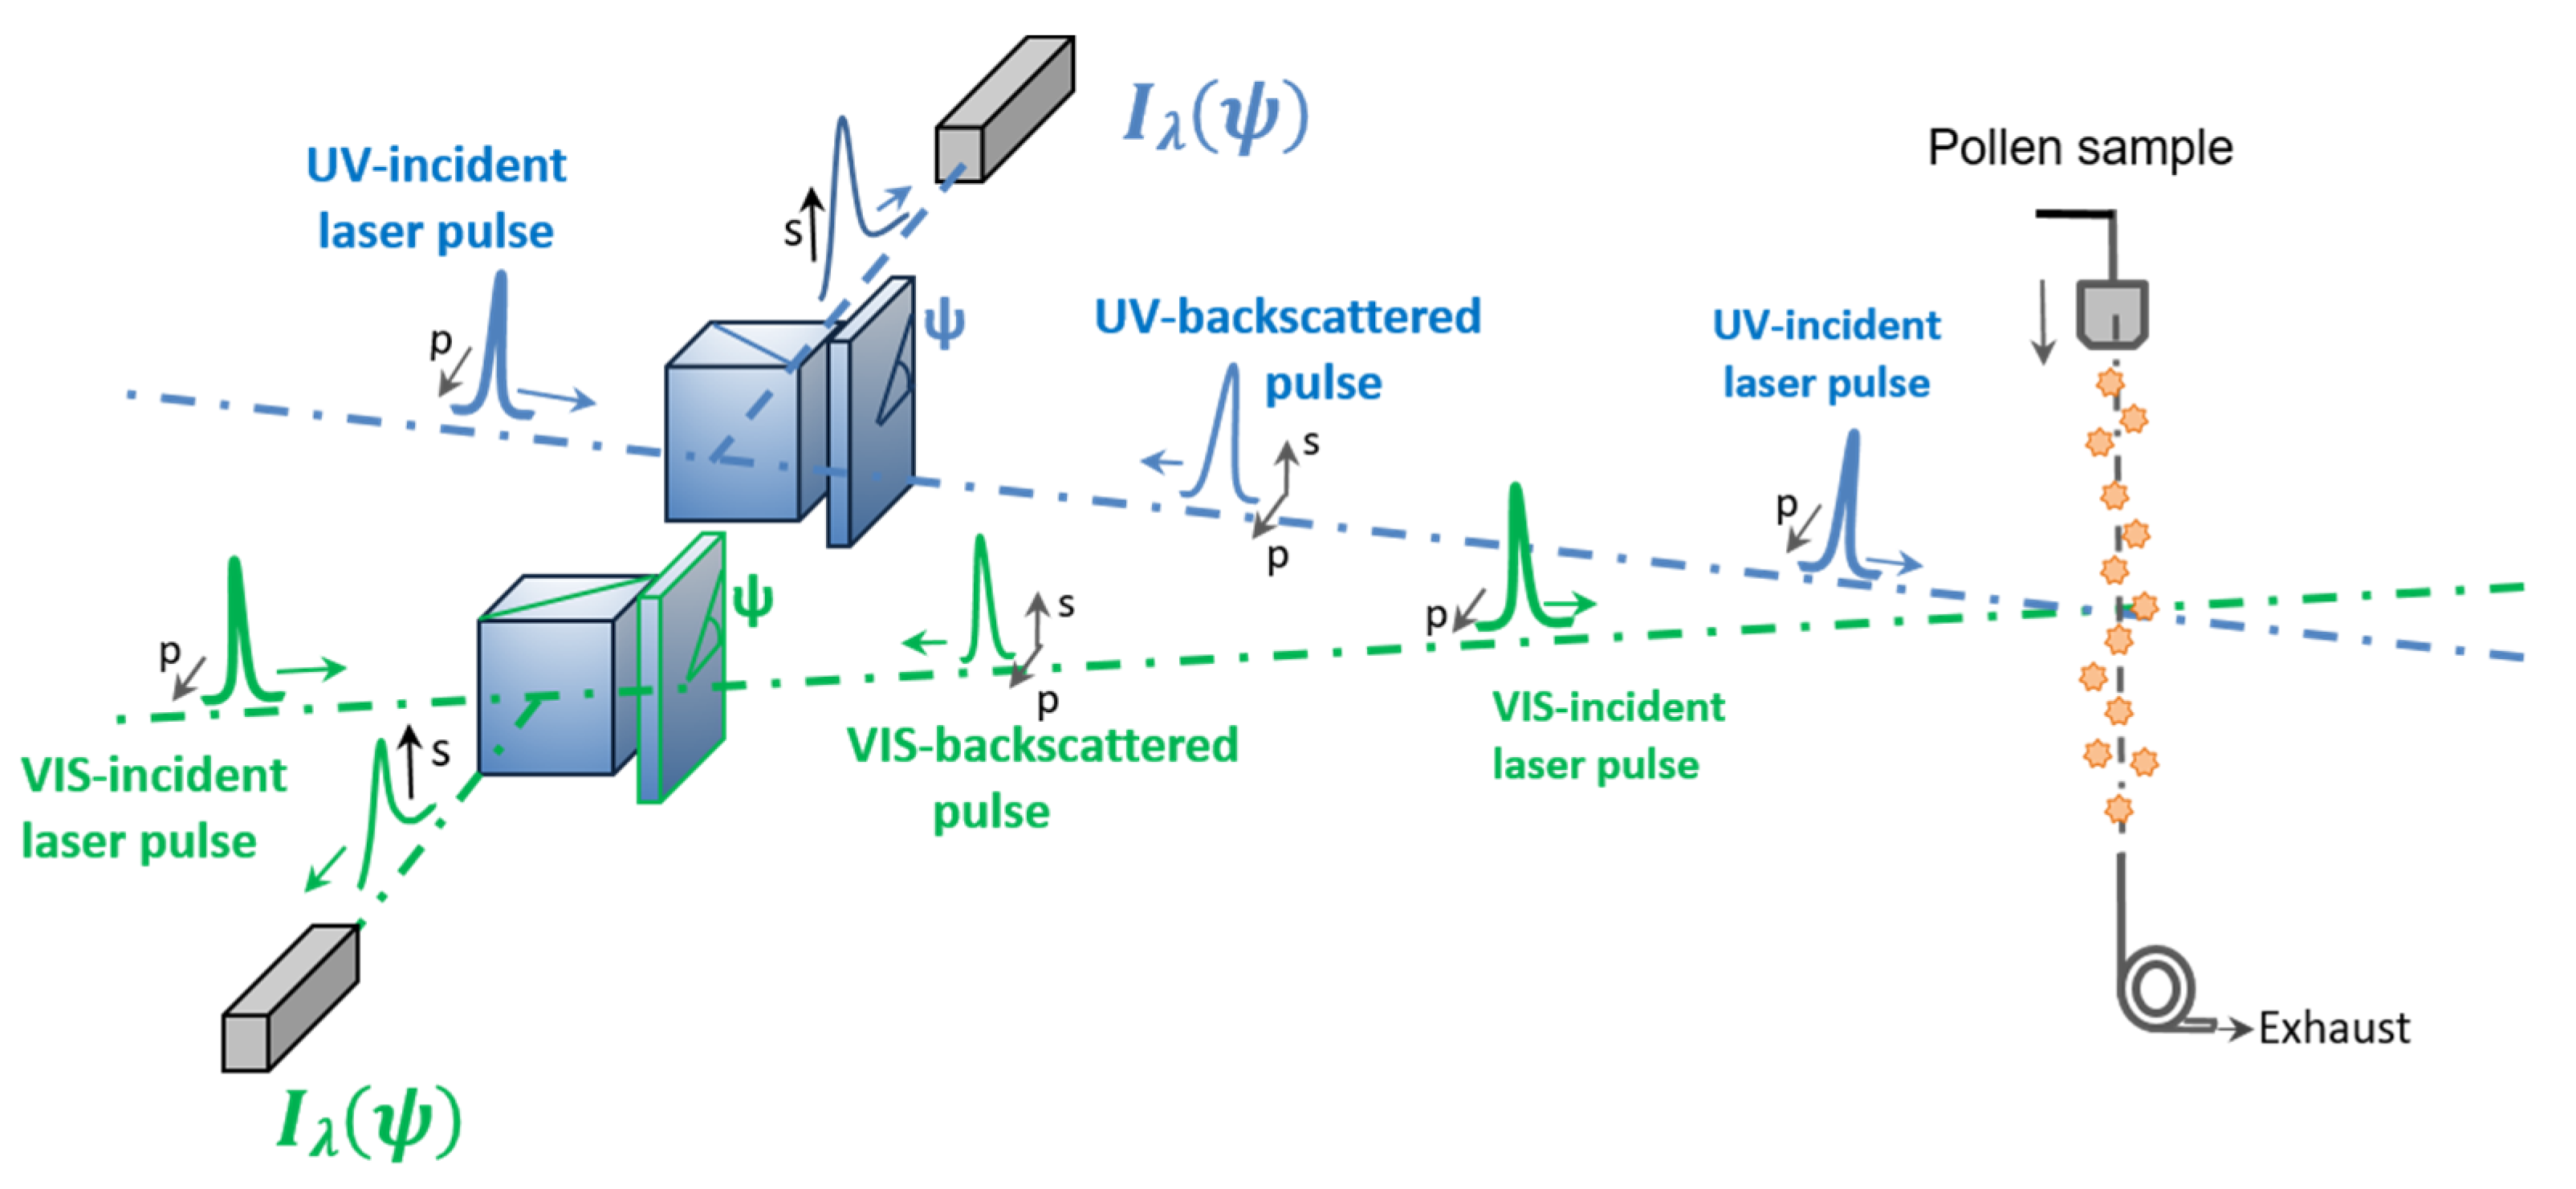
2.3.1. Laboratory π-Polarimeter at Lidar Exact Backscattering Angle of 180.0°

Following Equation (2), accurate values of the lidar   P D R can be retrieved from accurate evaluations of F 22 , λ / F 11 , λ . To evaluate the F 22 , λ / F 11 , λ ratio of pure pollen, the laboratory π-polarimeter scheme in Figure 2 is operated. This laboratory π-polarimeter is unique as it accurately measures the light intensity backscattered by pollen particles in laboratory ambient air at the specific lidar backscattering angle of 180.0°. The backward scattering direction is indeed covered by accuracy, at 180.0 ± 0.2° scattering angle, after precise alignment of a well-specified polarizing beam-splitter cube (PBC), with a precision of 1 mm per 10 m. As in dual-wavelength lidar applications, the π-polarimeter relies on a ns-pulsed laser source (not represented in Figure 1) and is actually composed of two π-polarimeters, one per wavelength, to evaluate the (355, 532) nm wavelength dependence of the lidar PDR of pure pollen. Special care has been taken to ensure that polarization and wavelength cross-talks are negligible in the π-polarimeter. Furthermore, to gain accuracy in the lidar P D R -retrievals, a quarter-wave plate (QWP) was added to each π-polarimeter, to analyze the polarization state of the backscattered radiation for a set of incident polarization states, as explained below.

2.3.2. Detected Backscattered Light Intensity and Lidar PDR Retrieval Methodology

The π-polarimeter can be described in the framework of the scattering matrix formalism, which allows quantifying of the lidar PDR of pollen. Indeed, by accounting for the successive Mueller matrices encountered by the laser pulse when following Figure 2, the detected backscattered light intensity is expressed as follows:
I λ ( ψ ) = η λ P λ d 2 [ 1 ,   0 ,   0 ,   0 ] T [ PBC ] [ QWP ( ψ ) ] [ F λ ] [ QWP ( ψ ) ] [ PBC ] ( S t i )  
where [PBC] and [QWP] represent the Mueller matrices of the PBC and the QWP, as given in polarization textbooks, while [ F λ ]   is the backscattering matrix given in Equation (1).   η λ and P λ designate the optoelectronics efficiency of the light detector and the laser power density, while ( S t i ) is [1, 1, 0, 0]—the Stokes vector of the incident radiation. After a few calculations, the detected backscattered light intensity is expressed as a function of the rotation angle ψ   of the QWP:
I λ ( ψ ) = I 0 × [ a λ b λ cos ( 4 ψ ) ]
where I 0 depends on η λ , P λ and  d , while the coefficients a λ   and b λ are equal to a λ = F 11 , λ + F 22 , λ   and b λ = 3 F 22 , λ F 11 , λ . As a consequence, the ratio F 22 , λ / F 11 , λ can be determined from the ratio b λ / a λ since F 22 , λ / F 11 , λ = ( 1 + b λ / a λ ) / ( 3 b λ / a λ ) . By recording the variations of the backscattered light intensity I λ   with the ψ -rotation angle, then adjusting our experimental data points with Equation (4), we could accurately measure I 0 b λ and I 0 a λ to evaluate b λ / a λ , and then the F 22 , λ / F 11 , λ ratio. The lidar PDR of pollen is then finally obtained by applying Equation (2) to obtain:
P D R λ = ( 1 b λ / a λ ) / 2
To render the link between the light backscattering curve I λ / I 0 = f ( ψ ) and the lidar P D R more explicit, we may note that the pollen lidar P D R actually depends on the minimum I λ , m and maximum I λ , M   of the I λ / I 0 = f ( ψ ) curve. Indeed, by combining Equations (2) and (4), we arrive at P D R λ = I λ , m / ( I λ , m + I λ , M ) . As a result, the lidar P D R of pollen becomes closer to zero when I λ , m becomes closer to zero while the maxima I λ , M become larger (see Section 3.1). The curve minimum I λ , m   is particularly interesting: proportional to F 11 , λ F 22 , λ , it reveals the nonspherical specific shape of the considered pollen taxon.

3. Results and Discussion

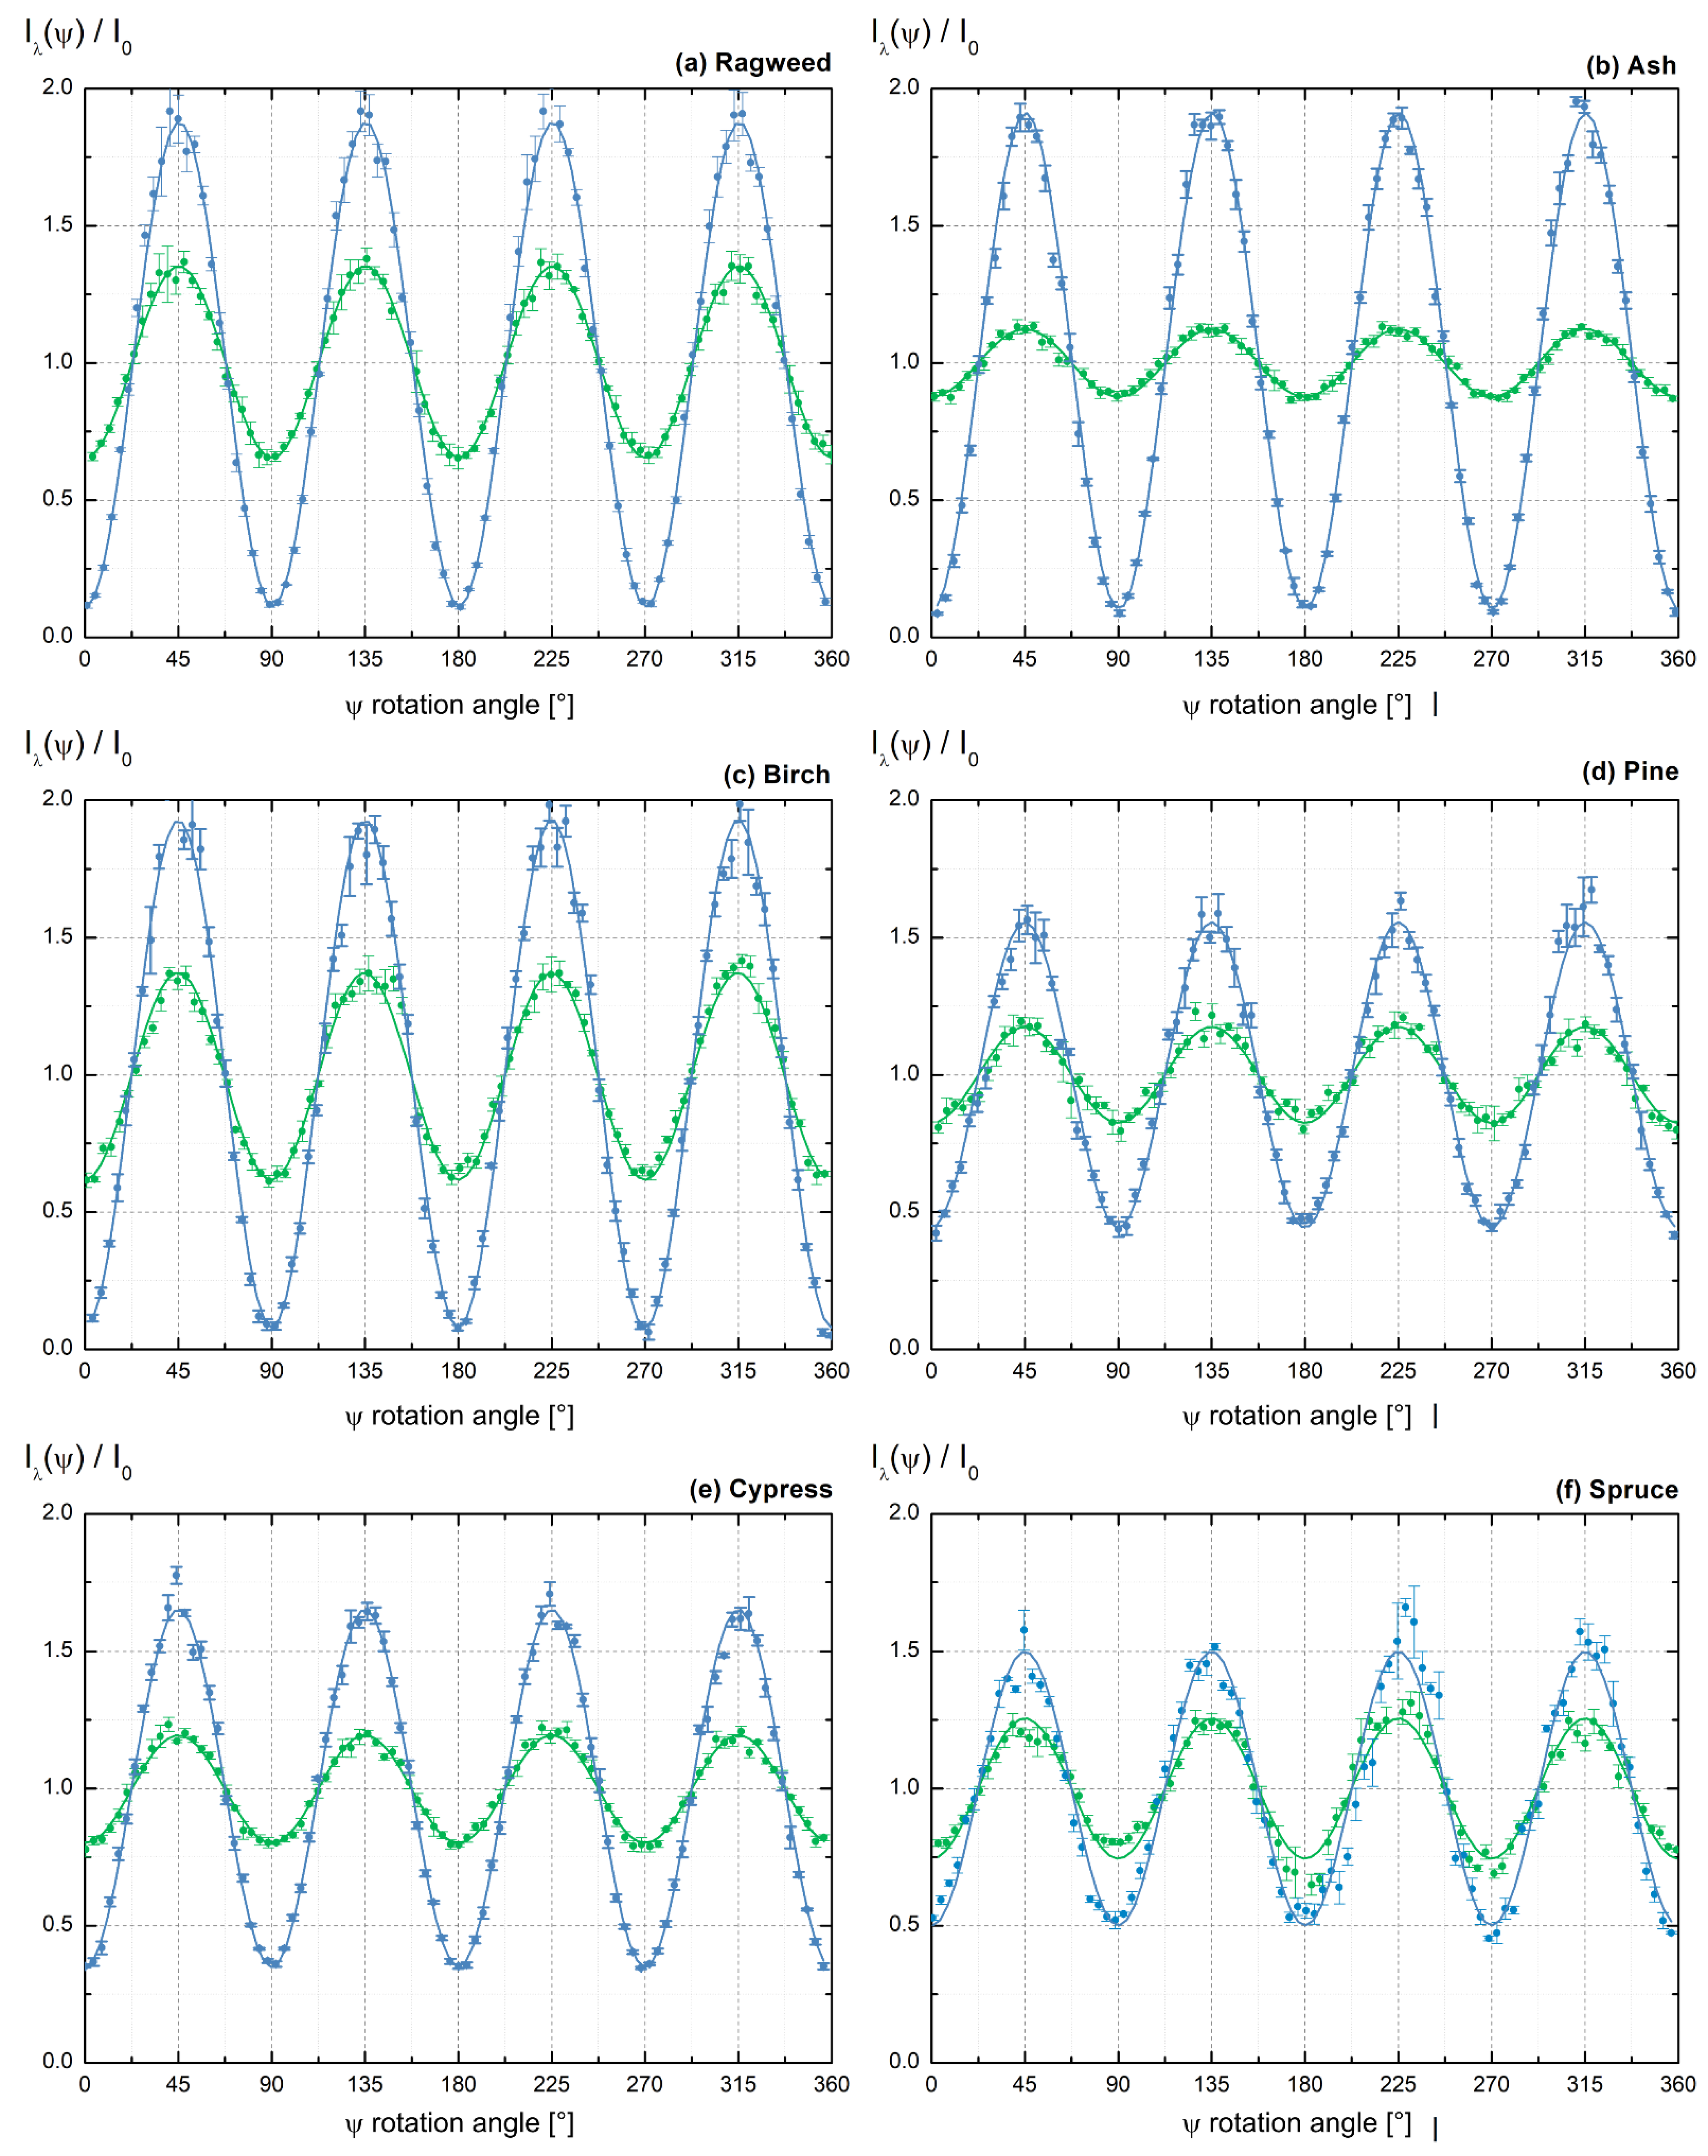
3.1. Light Backscattering Acquisition Curves

To validate our laboratory π-polarimeter, we applied the above methodology to spherical sulfate particles and retrieved an F 22 , λ / F 11 , λ ratio equal to unity at both (355, 532) nm wavelengths, leading to zero particle depolarization, in agreement with the Mie theory, as we previously published (see Figure 4 from Miffre et al. (2016) [33] or Figure 3 from Dubois et al. (2021) [34]). The π-polarimeter was then operated on each pollen taxon to record the variations of the backscattered light intensity as a function of the ψ -rotation angle, as displayed in Figure 3.
Let us first consider ragweed pollen as a case study (see Figure 3a). To improve accuracy in the retrieved lidar PDR, each experimental data point results from an average over four acquisition files with corresponding mean and standard deviation plotted in Figure 3a. Moreover, the backscattered light intensity is recorded over a complete ψ -angle rotation with a 4° angular step to record 90 experimental data points. As explained above, the minima of the backscattered light intensity reveal the non-spherical shape of the ragweed pollen taxon. These minima are constant, highlighting that the shape of the ragweed pollen sample did not change during our acquisition. As a result, the variations displayed in Figure 3a can be safely interpreted as a polarimetric signature of ragweed pollen. These conclusions likewise hold for other pollen taxa: as displayed in Figure 3b–f, where, to emphasize the differences in lidar PDR among the pollen taxa, the backscattering curves were normalized with I 0 . Considering the relationship between the lidar P D R and the curve extrema I λ , m and I λ , M , we conclude that, at 355 nm wavelength, the lidar PDR of ragweed, ash and birch are lower than that of pine, cypress and spruce. At 532 nm wavelength, these differences are less pronounced. Moreover, whatever the pollen taxon, the curve amplitude (i.e., I λ , M I λ , m )   is larger at 355 nm wavelength than at 532 nm, thus all pollen taxa exhibit a lower lidar PDR at 355 nm wavelength, compared with 532 nm.

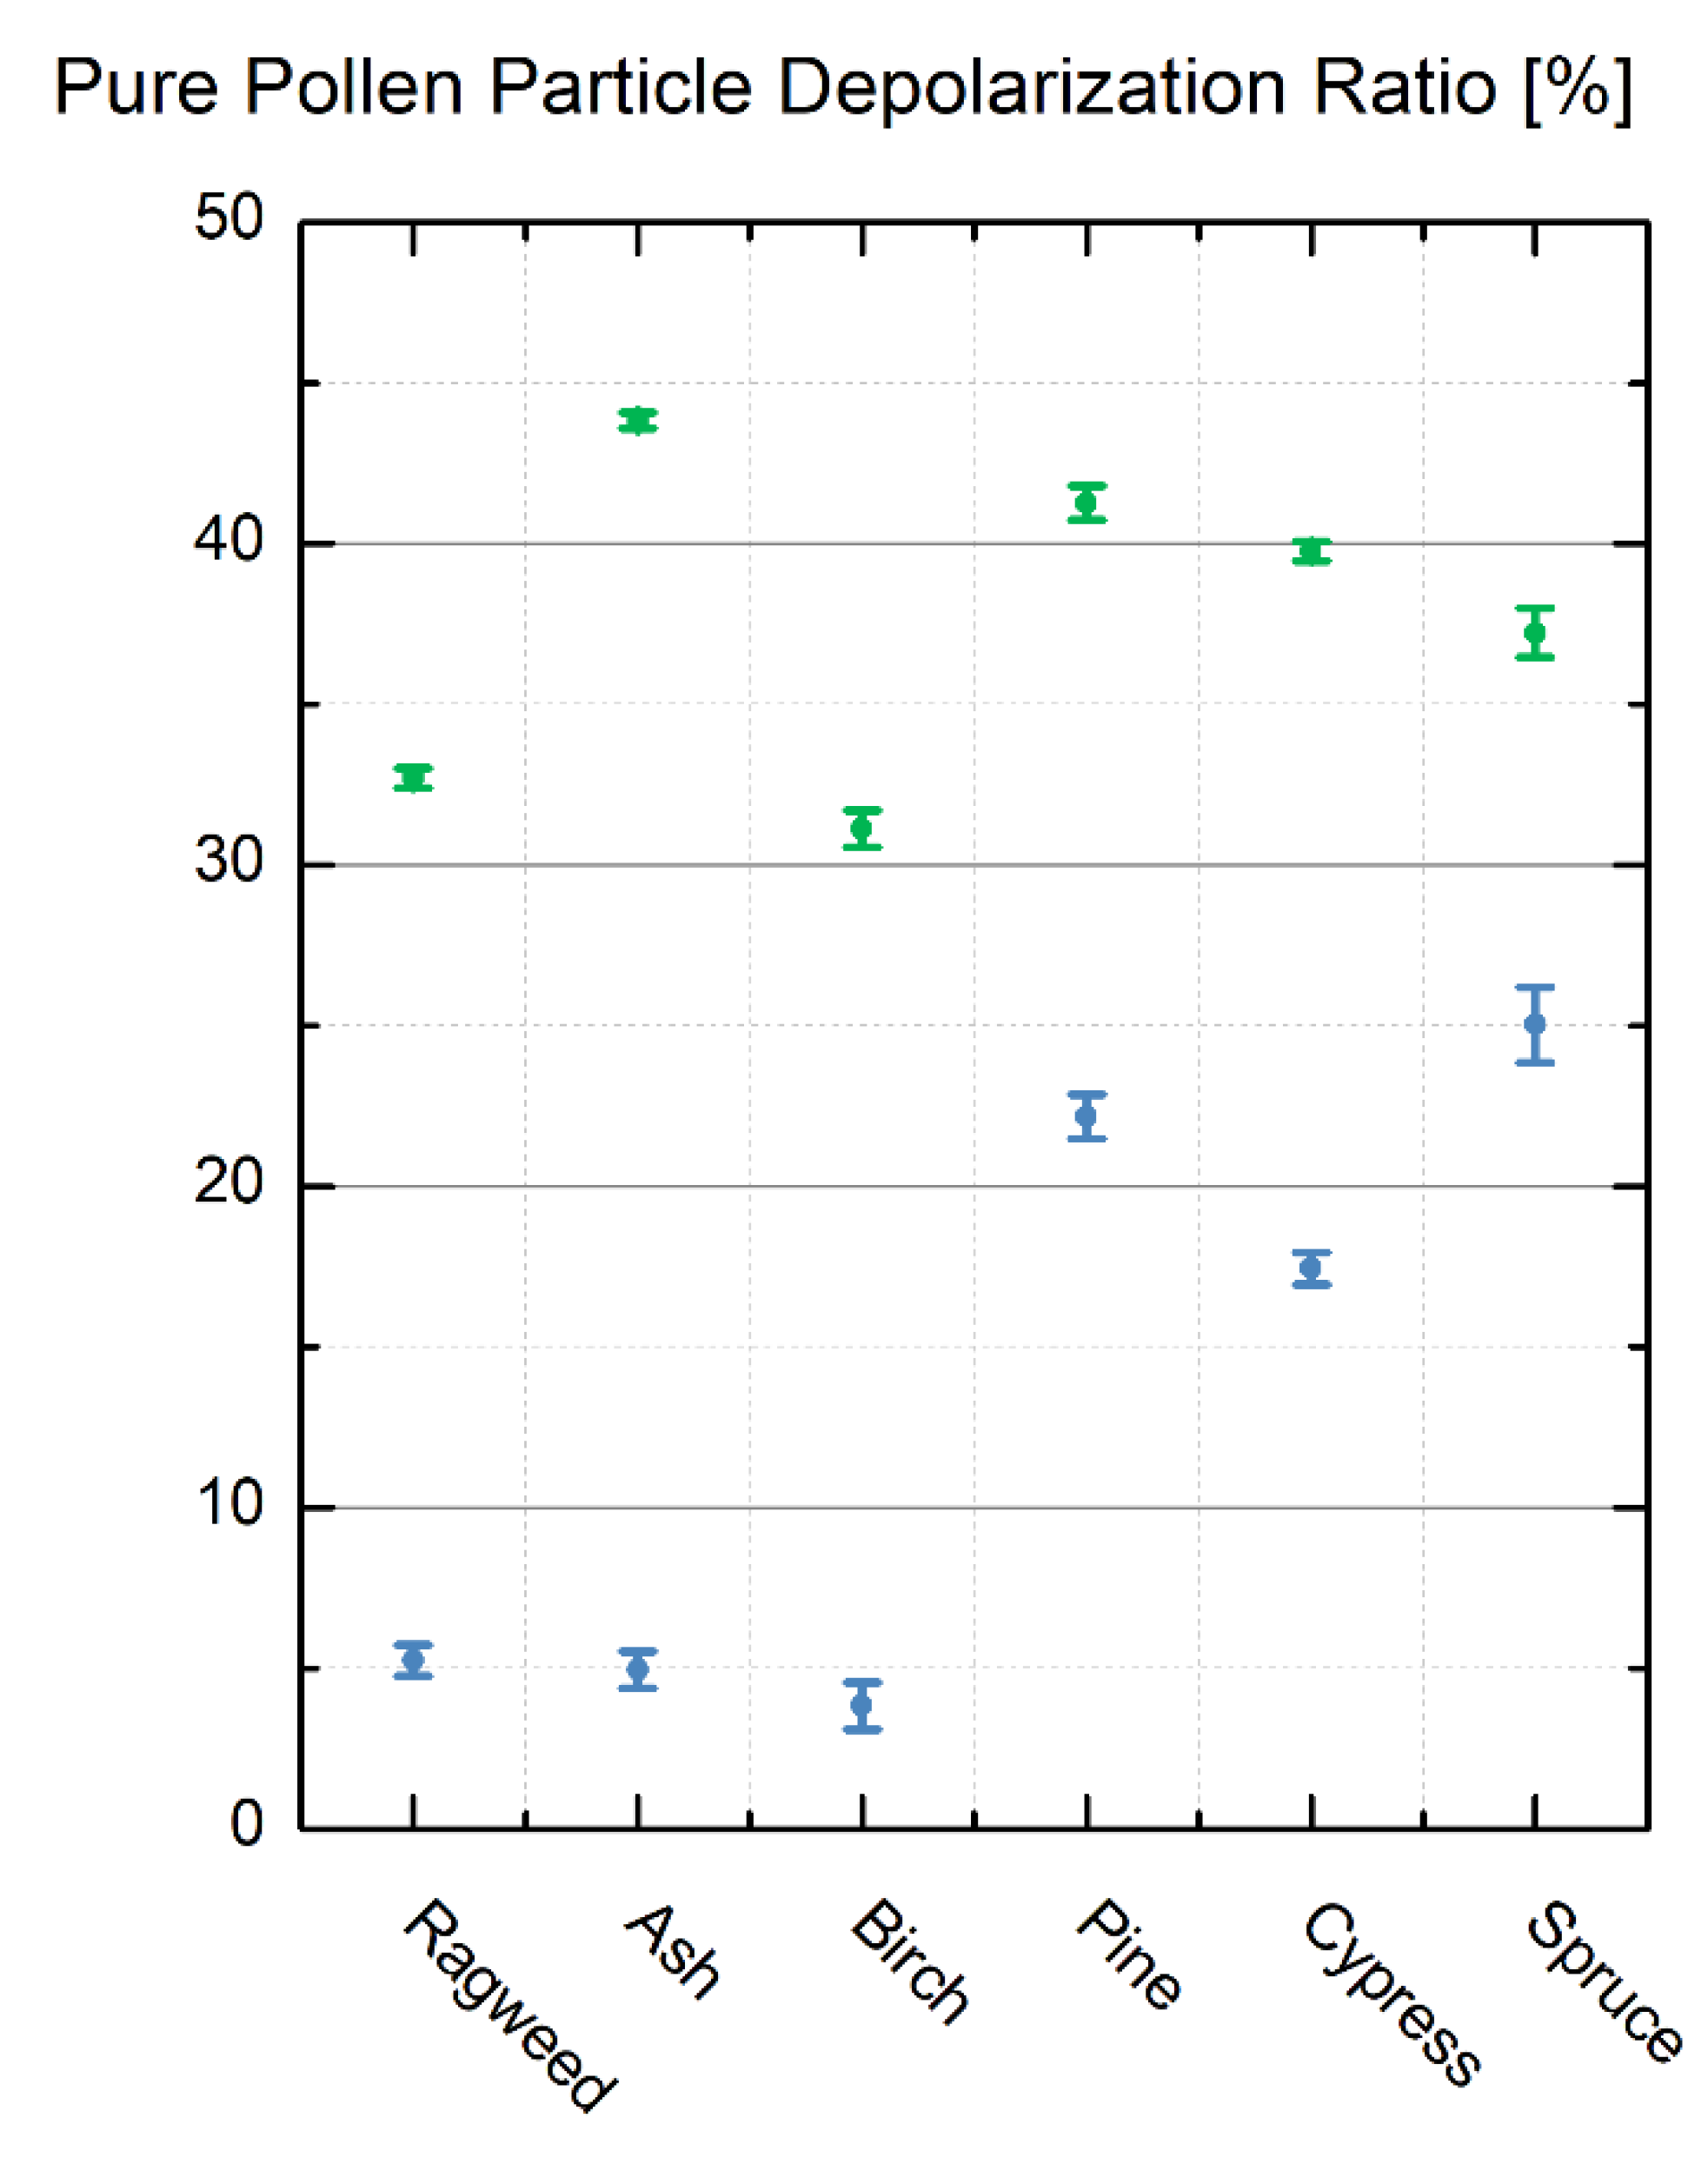
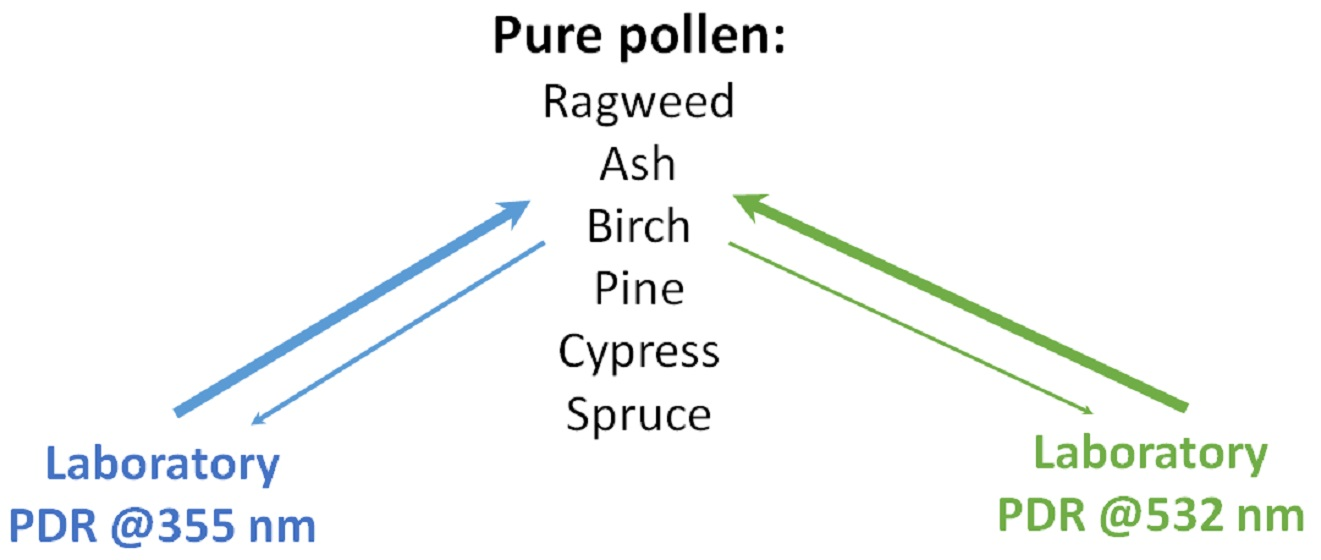
3.2. Lidar PDR-Retrieval for Pure Pollen at 355 and 532 nm Wavelength

To be quantitative, the lidar P D R of each pollen taxon was retrieved at 355 and 532 nm wavelengths from the F 22 , λ / F 11 , λ ratio obtained by adjusting our experimental data points with Equation (4). Table 1 summarizes our laboratory findings, which are also displayed in Figure 4 for the sake of clarity.

3.3. Discussion

In our laboratory π-polarimeter, since the polarization and wavelength cross-talks are negligible, the uncertainty on F 22 , λ / F 11 , λ and on the corresponding pollen lidar P D R is mainly due to statistical uncertainty, which we minimized as explained in Section 3.1. Hence, the lidar PDR values provided in Table 1 represent unequivocal spectral and polarimetric fingerprints of light backscattering by pollen. As a result, the lidar PDR of pollen is precisely revealed, for the first time to our knowledge at 180.0° lidar exact backscattering angle. Comparison of our laboratory findings with the literature is thus not straightforward. Since the scattering matrix elements vary with the scattering angle [25,26], retrieving the lidar PDR from scattering matrix elements at non-backscattering angles may indeed induce discrepancies in the retrieved lidar PDR. For correction, at 177.5° scattering angle, Cholleton et al. [27] measured the following values for F 22 , λ / F 11 , λ for ragweed (resp. ash, birch and pine) in the laboratory: 0.38 ± 0.03 (resp. 0.30 ± 0.02, 0.44 ± 0.03, 0.24 ± 0.02) at 532 nm. Hence, varying the scattering angle by 2.5° induces a substantial relative error ranging from 20 to 40% for the retrieved pollen lidar PDR, while precision is required in lidar remote sensing applications. The experimental setup closest to the backscatter angle is therefore the one for which the comparison with our π-polarimeter is most appropriate. Using an off-axis short-range lidar, Cao et al. [35] evaluated the PDR of ragweed (9% at 355 nm and 33% at 532 nm), birch (8% at 355 nm and 33% at 532 nm) and pine (20% at 355 nm and 41% at 532 nm), which is in good agreement with our laboratory findings at 180.0° lidar angle. The few percent difference can be explained by the difference in the scattering angle. Other explanations may concern possible different pollen origins or subspecies. In addition, we also evaluate the lidar PDR of spruce pollen here, as studied with a polarization lidar by [14,20]. Furthermore, in the literature, algorithms exist to retrieve the lidar PDR of pure pollen [36], however based on several working hypotheses such as a null Ångström exponent for pure pollen. The accuracy of our laboratory π-polarimeter allows discussing the applicability of this work hypothesis. Within this hypothesis, Shang et al. estimated a 24% depolarization for birch, 36% for pine [20] and even larger for spruce at 532 nm wavelength as discussed at the ELC 2020 Conference. At 355 nm wavelength, the discrepancy compared with our Table 1 laboratory findings is even larger with 17% depolarization ratio for birch and 30% for pine. These discrepancies may be partly linked to pollen hygroscopicity as stated in Section 2.2. Likewise, providing the Ångström exponent of pure pollen will help to better understand these discrepancies. The backscattering Ångström exponent is indeed sensitive to the particle size but also to the complex refractive index [37]. Indeed, pollen are more efficient light absorbers at 355 nm wavelength compared with 532 nm and their fluorescence can be detected in the UV spectral range. Note that the dependence of fluorescence on absorption can be complicated, as many particles, that have weak spectral dependence of absorption, have much higher fluorescence cross section in the UV spectral range. Likewise, the wavelength dependence of the pollen lidar PDR is also interesting to study. Our laboratory π-polarimeter indeed reveals, within our experimental error bars, the wavelength dependence of the lidar PDR—whatever the considered pollen taxon, the lidar PDR is lower at wavelength 355 nm compared with 532 nm. As explained in Section 2.1, the size, the shape and the pollen complex refractive index play a role in this wavelength dependence, and the latter in particular since all pollens are efficient light absorbers at 355 nm wavelength. Lower depolarization ratios at 355 nm wavelength were likewise observed for hematite iron oxide, which is an efficient light absorber at this wavelength [38]. Finally, Figure 4 highlights the required precision of the lidar PDR to identify pollen taxa. If one uses a single wavelength polarization lidar instrument, either based on 355 or 532 nm light depolarization, some pollen taxa may be confounded with others. In contrast, knowledge of the lidar PDR at both 355 and 532 nm wavelengths can provide additional information to help identify pollen, thus highlighting the importance of dual-wavelength polarization lidar instruments.

4. Conclusions

In this paper, a laboratory π-polarimeter at 180.0° lidar backscattering angle is operated for the first time to quantify the intrinsic lidar PDR of pure pollen at two wavelengths (355 nm, 532 nm). The pollen taxa, ragweed, ash, birch, pine, cypress and spruce, were mainly selected for their diversity in size and shape, to allow for exploring a large range of pollen lidar PDR. This laboratory π-polarimeter is unique as it addresses the 180.0° lidar backscattering angle, which is key for precise pollen lidar PDR retrieval. Laboratory evaluations of the pollen lidar PDR approaching backscattering angle [27,35] can indeed only provide approximate values of the pollen lidar PDR. Likewise, the precision of our laboratory-retrieved pollen lidar PDR, which is based on the scattering matrix formalism, allows us to discuss the applicability of retrieval algorithms [20], which rely on the assumption of a null pollen backscattering Ångström exponent. Our laboratory findings are given in Table 1 and can also be visualized in Figure 4 for clarity. Interestingly, the spectral dependence of the pollen lidar PDR is particularly marked, which in turn highlights the need for dual-wavelength (or more) polarization remote sensing measurements to identify the different pollen taxa. Outlooks of this work thus concern the extension of this work to other wavelengths, such as 1064 nm, and to other pollen taxa and their subspecies. Furthermore, while pollens are beyond the reach of light scattering numerical simulations, the precision achieved in the pollen lidar PDR retrievals may allow for discussing of the applicability of pollen light scattering numerical simulations.

Author Contributions

D.C.: Formal analysis, investigation, software, visualization, writing—original draft, writing—review and editing; P.R.: writing—review and editing, project administration, supervision; A.M.: conceptualization, formal analysis, investigation, methodology, writing—original draft, writing—review and editing, project administration, supervision. All authors have read and agreed to the published version of the manuscript.

Funding

This research received no external funding.

Acknowledgments

CNRS is acknowledged for financial support and the Lyon Centre Technologique des Microstructures for their help in electronic microscopy.

Conflicts of Interest

The authors declare no conflict of interest.

Appendix A

The goal of this appendix is to present the size and complex nonspherical shape of each pollen taxon, by outlining their health and climatic impact, thus following the two criteria chosen to select the pollen taxa, as presented in Section 2.2.

Appendix A.1. Ragweed Pollen

Ragweed pollen grains (see Figure 1a) exhibit a nonspherical characteristic shape, nearly but not quite spherical. Its membrane exhibits a high degree of complexity with three apertures (2 µm long), regular spikes (of about 1 µm length) and a perforated structure (covered with holes of about 100 nm diameter). Its mean volume-equivalent diameter, equal to 21 µm, is the lowest of our pollen taxa. With 15.8 million persons affected in Europe [1], the ragweed plant, Ambrosia artemisiifolia, is amongst the most allergenic pollen in Europe and North America [39], which induces allergic reactions twice as often as other pollens [40] for an annual economic cost of EUR 7 billion in Europe [1]. The length of the ragweed season, usually from August to October, is expected to increase with global warming. Therefore, ragweed pollen has been extensively studied in the literature [13,39,41], and extensive efforts have been made to observe and forecast its concentration [42], yet to our knowledge, it has never been studied through lidar remote sensing.

Appendix A.2. Ash Pollen

Ash pollen grains (see Figure 1b) present an irregular shape, with ornamental elements arranged as a network of ridges with gaps at the micron scale and three to four thin elongated apertures regularly distributed along its equatorial region. Its volume equivalent diameter is about 31 µm. With a blooming season lasting from March to May, ash, or Fraxinus americana, pollen is a large source of allergenic reactions in North America and Europe, where it has been underestimated for a long time as its blooming season overlaps that of birch [43].

Appendix A.3. Birch Pollen

Birch pollen grains (see Figure 1c) are irregularly shaped, with sunken interpectoral areas. They present three protruding pores, i.e., three 2 µm holes on their polar view. Their mean volume-equivalent diameter is about 28–29 µm. Along with ragweed, birch, or Betula pendula, pollen is one of the most impactful pollens in central and northern Europe [44]. Birch pollen was rapidly integrated into global pollen dispersion models [45]. Moreover, lidar remote sensing experiments have been carried out recently during strong birch pollen events [20].

Appendix A.4. Pine Pollen

Pine pollen (see Figure 1d) is amongst the largest pollen considered here, with a mean volume-equivalent diameter of 69 µm. Its shape differs largely from that of other pollens, as two sacci, i.e., two large air-filled bladders, are attached to the center part [46]. Optical diffraction tomography, [47] highlighted its structure and morphological features and evaluated its refractive index, which was estimated between 1.5 and 1.54 at 532 nm. Pine, or Pinus strobus, pollen rarely causes allergies, but is one of the most extensively studied in the context of light scattering. The authors of [4] evaluated its surface contribution to radiative forcing in the range of 1–2 W.m−2 at average concentrations. Its vertical distribution in the atmosphere was recently studied by Sicard et al. [19,48] with a lidar remote sensing instrument.

Appendix A.5. Cypress Pollen

Cypress pollen (see Figure 1) presents an almost spheroidal shape, with a mean volume-equivalent diameter between 30 and 40 µm. Its exine exhibits a granular structure and is covered with many adhering sub-micrometer particles [6]. Cypress, or Cupressus sempervirens, pollen is one of the most pollinating species in Europe, incriminated for allergies. The prevalence of cypress pollen allergies is correlated with the increased use of cypress trees as ornamental plants [49]. It blooms in winter and the pollen season can last up to April. Due to global warming, the pollination period tends to last longer and to migrate to the north [50].

Appendix A.6. Spruce Pollen

Spruce pollen (see Figure 1) is the largest studied sample, with a mean volume-equivalent diameter in the range of 80–130 µm. Its shape is similar to that of pine pollen with two sacci, i.e., two large air-filled bladders attached to the center part [51]. Spruce, or Picea abies, pollen is mostly abundant in northern temperate and boreal regions, and no allergies to this pollen have been reported. The authors of [14,20] interestingly reported polarization lidar profiles measured during strong spruce pollen events.

References

  1. Schaffner, U.; Steinbach, S.; Sun, Y.; Skjøth, C.A.; de Weger, L.A.; Lommen, S.T.; Augustinus, B.A.; Bonini, M.; Karrer, G.; Šikoparija, B.; et al. Biological weed control to relieve millions from Ambrosia allergies in Europe. Nat. Commun. 2020, 11, 1745. [Google Scholar] [CrossRef] [PubMed] [Green Version]
  2. Lake, I.R.; Jones, N.R.; Agnew, M.; Goodess, C.M.; Giorgi, F.; Hamaoui-Laguel, L.; Semenov, M.A.; Solomon, F.; Storkey, J.; Vautard, R.; et al. Climate Change and Future Pollen Allergy in Europe. Environ. Health Perspect. 2017, 125, 385–391. [Google Scholar] [CrossRef] [PubMed]
  3. Li, Y.; Steiner, A.; Solmon, F. Investigating the direct climatic forcing of pollen and subpollen particles. NASA/ADS 2013, 2013, A11B-0020. [Google Scholar]
  4. Spänkuch, D.; Döhler, W.; Güldner, J. Effect of coarse biogenic aerosol on downwelling infrared flux at the surface. J. Geophys. Res. Atmos. 2000, 105, 17341–17350. [Google Scholar] [CrossRef]
  5. Pope, F.D. Pollen grains are efficient cloud condensation nuclei. Environ. Res. Lett. 2010, 5, 044015. [Google Scholar] [CrossRef]
  6. Sam, S.; Halbritter, H.; Heigl, H. PalDat-A Palynological Database. Available online: https://www.paldat.org/pub/Ambrosia_artemisiifolia/304617 (accessed on 21 July 2021).
  7. Halbritter, H.; Ulrich, S.; Grímsson, F.; Weber, M.; Zetter, R.; Hesse, M.; Buchner, R.; Svojtka, M.; Frosch-Radivo, A. Illustrated Pollen Terminology; Springer International Publishing: Cham, Switzerland, 2018; ISBN 978-3-319-71364-9. [Google Scholar]
  8. Liu, C.; Yin, Y. Inherent optical properties of pollen particles: A case study for the morning glory pollen. Opt. Express 2016, 24, A104. [Google Scholar] [CrossRef]
  9. Thibaudon, M.; Šikoparija, B.; Oliver, G.; Smith, M.; Skjøth, C.A. Ragweed pollen source inventory for France–The second largest centre of Ambrosia in Europe. Atmos. Environ. 2014, 83, 62–71. [Google Scholar] [CrossRef]
  10. Szczepanek, K.; Myszkowska, D.; Worobiec, E.; Piotrowicz, K.; Ziemianin, M.; Bielec-Bąkowska, Z. The long-range transport of Pinaceae pollen: An example in Kraków (Southern Poland). Aerobiologia 2017, 33, 109–125. [Google Scholar] [CrossRef] [Green Version]
  11. Sofiev, M.; Belmonte, J.; Gehrig, R.; Izquierdo, R.; Smith, M.; Dahl, Å.; Siljamo, P. Airborne Pollen Transport. In Allergenic Pollen; Sofiev, M., Bergmann, K.-C., Eds.; Springer: Dordrecht, The Netherlands, 2013; pp. 127–159. ISBN 978-94-007-4880-4. [Google Scholar]
  12. Makra, L.; Matyasovszky, I.; Thibaudon, M.; Bonini, M. Forecasting ragweed pollen characteristics with nonparametric regression methods over the most polluted areas in Europe. Int. J. Biometeorol. 2011, 55, 361–371. [Google Scholar] [CrossRef]
  13. Zink, K.; Kaufmann, P.; Petitpierre, B.; Broennimann, O.; Guisan, A.; Gentilini, E.; Rotach, M.W. Numerical ragweed pollen forecasts using different source maps: A comparison for France. Int. J. Biometeorol. 2017, 61, 23–33. [Google Scholar] [CrossRef] [Green Version]
  14. Sassen, K. Boreal tree pollen sensed by polarization lidar: Depolarizing biogenic chaff. Geophys. Res. Lett. 2008, 35, 18. [Google Scholar] [CrossRef]
  15. Noh, Y.M.; Müller, D.; Lee, H.; Choi, T.J. Influence of biogenic pollen on optical properties of atmospheric aerosols observed by lidar over Gwangju, South Korea. Atmos. Environ. 2013, 69, 139–147. [Google Scholar] [CrossRef]
  16. Veselovskii, I.; Hu, Q.; Goloub, P.; Podvin, T.; Choël, M.; Visez, N.; Korenskiy, M. Mie–Raman–fluorescence lidar observations of aerosols during pollen season in the north of France. Atmos. Meas. Tech. 2021, 14, 4773–4786. [Google Scholar] [CrossRef]
  17. Kiselev, D.; Bonacina, L.; Wolf, J.-P. A flash-lamp based device for fluorescence detection and identification of individual pollen grains. Rev. Sci. Instrum. 2013, 84, 033302. [Google Scholar] [CrossRef] [PubMed] [Green Version]
  18. Miffre, A.; David, G.; Thomas, B.; Rairoux, P. Atmospheric non-spherical particles optical properties from UV-polarization lidar and scattering matrix. Geophys. Res. Lett. 2011, 38, L16804. [Google Scholar] [CrossRef]
  19. Sicard, M.; Izquierdo, R.; Alarcón, M.; Belmonte, J.; Comerón, A.; Baldasano, J.M. Near-surface and columnar measurements with a micro pulse lidar of atmospheric pollen in Barcelona, Spain. Atmos. Chem. Phys. 2016, 16, 6805–6821. [Google Scholar] [CrossRef] [Green Version]
  20. Shang, X.; Giannakaki, E.; Bohlmann, S.; Filioglou, M.; Saarto, A.; Ruuskanen, A.; Leskinen, A.; Romakkaniemi, S.; Komppula, M. Optical characterization of pure pollen types using a multi-wavelength Raman polarization lidar. Atmos. Chem. Phys. 2020, 20, 15323–15339. [Google Scholar] [CrossRef]
  21. Bohlmann, S.; Shang, X.; Giannakaki, E.; Filioglou, M.; Saarto, A.; Romakkaniemi, S.; Komppula, M. Detection and characterization of birch pollen in the atmosphere using multi-wavelength Raman lidar in Finland. Atmos. Chem. Phys. Discuss. 2019, 19, 14559–14569. [Google Scholar] [CrossRef] [Green Version]
  22. Tesche, M.; Ansmann, A.; Müller, D.; Althausen, D.; Engelmann, R.; Freudenthaler, V.; Groß, S. Vertically resolved separation of dust and smoke over Cape Verde using multiwavelength Raman and polarization lidars during Saharan Mineral Dust Experiment 2008. J. Geophys. Res. 2009, 114, 13. [Google Scholar] [CrossRef]
  23. David, G.; Thomas, B.; Nousiainen, T.; Miffre, A.; Rairoux, P. Retrieving simulated volcanic, desert dust and sea-salt particle properties from two/three-component particle mixtures using UV-VIS polarization lidar and T matrix. Atmos. Chem. Phys. 2013, 13, 6757–6776. [Google Scholar] [CrossRef] [Green Version]
  24. Haarig, M.; Ansmann, A.; Engelmann, R.; Baars, H.; Toledano, C.; Torres, B.; Althausen, D.; Radenz, M.; Wandinger, U. First triple-wavelength lidar observations of depolarization and extinction-to-backscatter ratios of Saharan dust. Atmos. Chem. Phys. 2022, 22, 355–369. [Google Scholar] [CrossRef]
  25. Bohren, C.F.; Huffman, D.R. Absorption and Scattering of Light by Small Particles; Wiley-VCH: Weinheim, German, 1983; ISBN 978-0-471-29340-8. [Google Scholar]
  26. Mishchenko, M.I.; Travis, L.D.; Lacis, A.A. Scattering, Absorption, and Emission of Light by Small Particles; Cambridge University Press: Cambridge, UK, 2002; ISBN 978-0-521-78252-4. [Google Scholar]
  27. Cholleton, D.; Bialic, É.; Dumas, A.; Kaluzny, P.; Rairoux, P.; Miffre, A. Laboratory evaluation of the scattering matrix of ragweed, ash, birch and pine pollen towards pollen classification. Atmos. Meas. Tech. 2022, 15, 1021–1032. [Google Scholar] [CrossRef]
  28. David, G.; Thomas, B.; Coillet, E.; Miffre, A.; Rairoux, P. Polarization-resolved exact light backscattering by an ensemble of particles in air. Opt. Express 2013, 21, 18624. [Google Scholar] [CrossRef] [PubMed]
  29. Miffre, A.; Cholleton, D.; Mehri, T.; Rairoux, P. Remote Sensing Observation of New Particle Formation Events with a (UV, VIS) Polarization Lidar. Remote Sens. 2019, 11, 1761. [Google Scholar] [CrossRef] [Green Version]
  30. Cholleton, D.; Bialic, E.; Dumas, A.; Kaluzny, P.; Rairoux, P.; Miffre, A. Laboratory evaluation of the (VIS, IR) scattering matrix of complex-shaped ragweed pollen particles. J. Quant. Spectrosc. Radiat. Transf. 2020, 254, 107223. [Google Scholar] [CrossRef]
  31. Heslop-Harrison, J. An Interpretation of the Hydrodynamics of Pollen. Am. J. Bot. 1979, 66, 737–743. [Google Scholar] [CrossRef]
  32. Katifori, E.; Alben, S.; Cerda, E.; Nelson, D.R.; Dumais, J. Foldable structures and the natural design of pollen grains. Proc. Natl. Acad. Sci. USA 2010, 107, 7635–7639. [Google Scholar] [CrossRef] [Green Version]
  33. Miffre, A.; Mehri, T.; Francis, M.; Rairoux, P. UV–VIS depolarization from Arizona Test Dust particles at exact backscattering angle. J. Quant. Spectrosc. Radiat. Transf. 2016, 169, 79–90. [Google Scholar] [CrossRef]
  34. Dubois, C.; Cholleton, D.; Gemayel, R.; Chen, Y.; Surratt, J.D.; George, C.; Rairoux, P.; Miffre, A.; Riva, M. Decrease in sulfate aerosol light backscattering by reactive uptake of isoprene epoxydiols. Phys. Chem. Chem. Phys. 2021, 23, 5927–5935. [Google Scholar] [CrossRef]
  35. Cao, X.; Roy, G.A.; Bernier, R. Lidar polarization discrimination of bioaerosols. Opt. Eng. 2010, 49, 116201. [Google Scholar] [CrossRef]
  36. Bohlmann, S.; Shang, X.; Vakkari, V.; Giannakaki, E.; Leskinen, A.; Lehtinen, K.E.J.; Pätsi, S.; Komppula, M. Lidar depolarization ratio of atmospheric pollen at multiple wavelengths. Atmos. Chem. Phys. 2021, 21, 7083–7097. [Google Scholar] [CrossRef]
  37. Veselovskii, I.; Goloub, P.; Podvin, T.; Bovchaliuk, V.; Derimian, Y.; Augustin, P.; Fourmentin, M.; Tanre, D.; Korenskiy, M.; Whiteman, D.N.; et al. Retrieval of optical and physical properties of African dust from multiwavelength Raman lidar measurements during the SHADOW campaign in Senegal. Atmos. Chem. Phys. 2016, 16, 7013–7028. [Google Scholar] [CrossRef] [Green Version]
  38. Miffre, A.; Cholleton, D.; Noël, C.; Rairoux, P. Investigating the dependence of mineral dust depolarization on complex refractive index and size with a laboratory polarimeter at 180.0° lidar backscattering angle. Atmos. Meas. Tech. 2022. submitted. [Google Scholar]
  39. Smith, M.; Cecchi, L.; Skjøth, C.A.; Karrer, G.; Šikoparija, B. Common ragweed: A threat to environmental health in Europe. Environ. Int. 2013, 61, 115–126. [Google Scholar] [CrossRef] [PubMed]
  40. Dahl, Å.; Strandhede, S.-O.; Wihl, J.-Å. Ragweed–An allergy risk in Sweden? Aerobiologia 1999, 15, 293–297. [Google Scholar] [CrossRef]
  41. Hamaoui-Laguel, L.; Vautard, R.; Liu, L.; Solmon, F.; Viovy, N.; Khvorostyanov, D.; Essl, F.; Chuine, I.; Colette, A.; Semenov, M.A.; et al. Effects of climate change and seed dispersal on airborne ragweed pollen loads in Europe. Nat. Clim. Chang. 2015, 5, 766–771. [Google Scholar] [CrossRef]
  42. Prank, M.; Chapman, D.S.; Bullock, J.M.; Belmonte, J.; Berger, U.; Dahl, A.; Jäger, S.; Kovtunenko, I.; Magyar, D.; Niemelä, S.; et al. An operational model for forecasting ragweed pollen release and dispersion in Europe. Agric. For. Meteorol. 2013, 182–183, 43–53. [Google Scholar] [CrossRef]
  43. Imhof, K.; Probst, E.; Seifert, B.; Regenass, S.; Schmid-Grendelmeier, P. Ash pollen allergy: Reliable detection of sensitization on the basis of IgE to Ole e 1. Allergo J. Int. 2014, 23, 78–83. [Google Scholar] [CrossRef] [Green Version]
  44. Biedermann, T.; Winther, L.; Till, S.J.; Panzner, P.; Knulst, A.; Valovirta, E. Birch pollen allergy in Europe. Allergy 2019, 74, 1237–1248. [Google Scholar] [CrossRef] [Green Version]
  45. Siljamo, P.; Sofiev, M.; Filatova, E.; Grewling, Ł.; Jäger, S.; Khoreva, E.; Linkosalo, T.; Ortega Jimenez, S.; Ranta, H.; Rantio-Lehtimäki, A.; et al. A numerical model of birch pollen emission and dispersion in the atmosphere. Model evaluation and sensitivity analysis. Int. J. Biometeorol. 2013, 57, 125–136. [Google Scholar] [CrossRef] [Green Version]
  46. Schwendemann, A.B.; Wang, G.; Mertz, M.L.; McWilliams, R.T.; Thatcher, S.L.; Osborn, J.M. Aerodynamics of saccate pollen and its implications for wind pollination. Am. J. Bot. 2007, 94, 1371–1381. [Google Scholar] [CrossRef] [PubMed] [Green Version]
  47. Kim, G.; Lee, S.; Shin, S.; Park, Y. Three-dimensional label-free imaging and analysis of Pinus pollen grains using optical diffraction tomography. Sci. Rep. 2018, 8, 1782. [Google Scholar] [CrossRef] [PubMed] [Green Version]
  48. Sicard, M.; Jorba, O.; Ho, J.J.; Izquierdo, R.; De Linares, C.; Alarcón, M.; Comerón, A.; Belmonte, J. Measurement report: Characterization of the vertical distribution of airborne Pinus pollen in the atmosphere with lidar-derived profiles: A modelling case study in the region of Barcelona, NE Spain. Atmos. Chem. Phys. 2021, 21, 17807–17832. [Google Scholar] [CrossRef]
  49. Charpin, D.; Calleja, M.; Lahoz, C.; Pichot, C.; Waisel, Y. Allergy to cypress pollen. Allergy 2005, 60, 293–301. [Google Scholar] [CrossRef] [PubMed]
  50. Charpin, D.; Pichot, C.; Belmonte, J.; Sutra, J.-P.; Zidkova, J.; Chanez, P.; Shahali, Y.; Sénéchal, H.; Poncet, P. Cypress pollinosis: From tree to clinic. Clin. Rev. Allergy Immunol. 2019, 56, 174–195. [Google Scholar] [CrossRef] [PubMed]
  51. Hesse, M. (Ed.) Pollen Terminology: An Illustrated Handbook; Springer: Wien, NY, USA, 2009; ISBN 978-3-211-79893-5. [Google Scholar]
Figure 1. Scanning electron microscopy (SEM) images of the studied pollen grains, respectively, (a) ragweed, (b) ash, (c) birch, (d) pine obtained at the CTµ at Lyon University. For cypress and spruce, please refer to [7]. Ragweed, ash, birch and pine pollen samples were provided by Stallergenes Greer while cypress and spruce were provided by Pharmallerga.
Remotesensing 14 03767 g001
Figure 2. Scheme of the pollen laboratory π -polarimeter operating at 180.0° lidar backscattering angle derived from [33] to accurately retrieve the lidar PDR of pure pollen at 355 and 532 nm wavelengths, using the methodology described in Section 2.1.
Remotesensing 14 03767 g002
Figure 3. Recorded variations of the backscattered light intensity I λ / I 0   with the ψ -rotation angle at 355 (in blue) and 532 nm (in green) wavelengths for the following pollen taxa: (a) ragweed, (b) ash, (c) birch, (d) pine, (e) cypress and (f) spruce. The experimental data points are adjusted with Equation (4) to evaluate b λ / a λ , then F 22 , λ / F 11 , λ to obtain the lidar PDR from Equation (5).
Remotesensing 14 03767 g003
Figure 4. Lidar PDR of pure pollen at 355 and 532 nm wavelengths measured for the first time in the laboratory at lidar exact backscattering angle of 180.0° by applying the Section 2.3 methodology.
Remotesensing 14 03767 g004
Table 1. Laboratory evaluation of the lidar PDR of pure pollen at wavelengths λ = 355 and 532 nm measured for the first time in laboratory at lidar exact backscattering angle of 180.0°.
Pollenλ (nm) F 22 , λ / F 11 , λ P D R λ
Ragweed3550.90 ± 0.015.3 ± 0.5
5320.51 ± 0.0132.7 ± 0.3
Ash3550.91 ± 0.015.0 ± 0.6
5320.39 ± 0.0143.8 ± 0.3
Birch3550.93 ± 0.023.8 ± 0.8
5320.39 ± 0.0131.1 ± 0.6
Pine3550.64 ± 0.0122.2 ± 0.7
5320.42 ± 0.0141.3 ± 0.5
Cypress3550.70 ± 0.0117.5 ± 0.6
5320.43 ± 0.0139.8 ± 0.3
Spruce3550.60 ± 0.0225.0 ± 1.2
5320.46 ± 0.0137.2 ± 0.8
Publisher’s Note: MDPI stays neutral with regard to jurisdictional claims in published maps and institutional affiliations.

