Article

Estimating Emissions from Crop Residue Open Burning in Central China from 2012 to 2020 Using Statistical Models Combined with Satellite Observations

1
Faculty of Resources and Environmental Science, Hubei University, Wuhan 430062, China
2
Hubei Key Laboratory of Regional Development and Environmental Response, Hubei University, Wuhan 430062, China
3
State Key Laboratory of Atmospheric Boundary Layer Physics and Atmospheric Chemistry, Institute of Atmospheric Physics, Chinese Academy of Sciences, Beijing 100029, China
4
School of Geography and Information Engineering, China University of Geosciences, Wuhan 430074, China
5
State Key Laboratory of Remote Sensing Science, Aerospace Information Research Institute, Chinese Academy of Sciences, Beijing 100101, China
*
Author to whom correspondence should be addressed.
Remote Sens. 2022, 14(15), 3682; https://doi.org/10.3390/rs14153682
Submission received: 28 June 2022 / Revised: 22 July 2022 / Accepted: 28 July 2022 / Published: 1 August 2022

Abstract

:
Crop residue open burning has significant adverse effects on regional air quality, climate change, and human health. Emissions from crop residue open burning estimated by satellites are underestimated in central China due to long-term cloud cover and the limitation of spatial-temporal resolution of satellites. In this study, we used a statistical-based method to investigate the crop residue open burning emissions in central China from 2012 to 2020. The open burning proportion (OBP) of residue, updated annually by the Visible Infrared Imaging Radiometer Suite (VIIRS) 375 m active fire product (VNP14IMG), and the latest observed emission factors (EFS) were used to improve the accuracy of the estimated emissions. Annual emissions of pollutants were allocated into 0.1° × 0.1° spatial grid cells using fire counts and land cover data. The results showed that the total emissions of black carbon (BC), organic carbon (OC), sulfur dioxide (SO2), nitric oxide (NOX), carbon monoxide (CO), carbon dioxide (CO2), fine particles (PM2.5), coarse particles (PM10), ammonia (NH3), methane (CH4) and non-methane volatile organic compound (NMVOC) were 34.84, 149.72, 41.06, 90.11, 2640.97, 78,094.91, 485.17, 481.05, 35.21, 246.38 and 499.59 Gg, respectively. The largest contributor of crop residue open burning was rice, followed by wheat, rapeseed and corn, with the contribution rates of 35.34–64.07%, 15.78–34.71%, 9.12–25.56%, and 5.69–14.06%, respectively. The pollutants emissions exhibit large annual variation, with the highest emissions in 2013 and a remarkable decrease from 2013 to 2015 under strict control measures. Since 2015, the emissions remained at a low level, which shows that air quality control policies play a role in recent years. The result indicates that using OBP updated by satellite active fire product in a statistical-based method can help to get more accurate and reliable multi-year emissions.

1. Introduction

Crop residue open burning is a common method of treating surplus straw after crop harvest [1,2]. As a traditional agricultural country, China directly burns about 100 million tons of residue every year, which released a large number of gaseous and solid atmospheric pollutants [3]; it has a significant impact on regional air quality, global climate change, as well as human health [4,5]. Previous studies have shown that from 2003 to 2015, crop residue open burning was the largest contributor to biomass burning emissions in central and eastern China, reaching 84–96%, and showing a steady increase by year, which directly aggravated regional air pollution [6]. In recent years, due to the implementation of a strict anti-burning policy by government departments, crop residue open burning has decreased; however, many pieces of research show that the emissions of crop residue open burning are still an important source of air pollution in China, especially in harvest season [7,8,9]. Therefore, obtaining accurate and timely emissions inventory from crop residue open burning is important for making reasonable air quality control measures. Two primary methods are generally used to estimate emissions from crop residue open burning in most previous studies: an approach based on satellite remote sensing data and an approach based on statistical data. The satellite-based method first estimates dry matter burning amount (DMB) according to the burned area (BA) or fire radiative power (FRP) retrieved from the satellite, and then calculates the emissions inventory by multiplying emission factors (EFS) and DMB. Qiu et al. used Modern Resolution Imaging Spectroradiometer (MODIS) BA product to develop an emission inventory of open biomass burning in China in 2013 [10]. Due to the coarse spatial resolution of satellite BA product (500 m), the small size agricultural fires were often missed, which may result in a significant underestimation of emissions inventory from crop residue open burning. Compared with BA products, satellite active fire products can identify smaller size fires and provide fire radiative power (FRP) of burning fires, which are widely used to estimate open biomass burning emission inventory. Liu et al. calculated fire radiation energy based on MODIS FRP, and then estimated emissions from crop burning during the harvest season from 2003 to 2014 in the North China Plain [11]. Yin et al. applied the FRP-based approach to calculate emissions of biomass burning in China from 2003 to 2017 [12]; however, the active fire product retrieved by polar-orbiting satellites can only capture the agricultural fires in cloudless skies at the time of overpass [13]; this indicates active fire product may introduce considerable uncertainty of crop burning emissions inventory due to their large omission errors of agricultural burning fires in China [14,15]. The statistical-based method obtains emissions through detailed activity data including crop yield, grain-to-straw ratio, combustion efficiency and open burning proportion (OBP). Li et al. developed a historical emission inventory of crop residue open burning in China for the period 1990–2013 based on official statistical data and domestic EFS [16]. Gao et al. estimated emissions from residue open burning in Shandong Province for 2014 based on EFS and the latest local activity data [17]. In a statistical-based approach, obtaining accurate and timely OBP is critical for estimating emissions from crop residue open burning [18]; however, OBP is primarily obtained through field investigation, so is difficult to be updated timely due to high cost. We summarized previous studies and the main characteristics of their studies in Table 1. Hubei is a largely agricultural province and an important grain-producing area in central China. A large amount of crop residue will be burned after harvest each year. Therefore, the impact of crop residue open burning on the atmospheric environment in Hubei should not be ignored. Wu et al. estimated the emissions of open biomass burning in central and eastern China from 2003 to 2015 based on MODIS BA and active fire product [6]. Due to long-term cloud cover and small size agricultural fires in central China, emissions obtained from the satellite-based method may be significantly underestimated. Li et al. estimated emissions from crop residue open burning based on a statistical approach in Jianghan Plain of Hubei in 2010 [19]; however, the key parameter, OBP is obtained through a household investigation with small survey samples, which may be not reliable enough. Gong et al. calculated the emissions from crop residue open burning according to the main crop production, grain-to-straw ratio, and fixed open burning proportion of crop residue in Hubei from 2009 to 2017 [20]. The fixed OBP used in the model will introduce large uncertainty under the strict ban on burning policy in recent years. Therefore, we used the Visible Infrared Imaging Radiometer Suite (VIIRS) 375 m active fire product to update annual OBP, and established an accurate emissions inventory in Hubei during 2012–2020 based on activity data. The emissions of 11 types of air pollutants including black carbon (BC), organic carbon (OC), sulfur dioxide (SO2), nitric oxide (NOX), carbon monoxide (CO), carbon dioxide (CO2), fine particles (PM2.5), coarse particles (PM10), ammonia (NH3), methane (CH4), and non-methane volatile organic compound (NMVOC) were calculated. At last, the emissions were allocated into 0.1° × 0.1° spatial grids by active fire product and land cover data derived from the satellite. The detailed emission inventory given by this paper can provide valuable information to support further air quality research and make effective policy on controlling crop residue open burning emissions.

2. Data and Methods

2.1. Study Area

We selected Hubei province as our study area, which is located in central China and the middle reaches of the Yangtze River. The study area is set between latitudes 29°~33°N and longitudes 108°~116°E; it is an incomplete basin surrounded by mountains on three sides (Figure 1). There are 17 cities with a total area of 185,900 km2, which is approximately 1.94% of China. The total crop production in Hubei province was 27,274 Gg in the year of 2020, and has been stable at more than 25,000 Gg for eight consecutive years, accounting for 4.07% of that in China.

2.2. Methods for Estimating Crop Residue Open Burning Emissions

The emission from crop residue open burning was estimated by multiplying the emission factors and total mass of in-field burning crop residues, as shown in the equation:
E p = 10 3 × A × EF p
where p is the different pollutant type; E is the total emissions of each species pollutant, ton; A is the amount of residue burned in the field, ton; EF is the emission factor, g/kg.

2.2.1. Estimation of Residue Resources Burned in the Field

The crop species calculated in our paper included rice, wheat, corn, and rapeseed, which accounted for more than 90% of the total crop production in Hubei and included the vast majority of crop residue burning. The mass of crop residue burning in the field was calculated using the following equation:
A = P × N × R × η
where A is the amount of crop residues burned in the field, ton; P is the production for different crops, ton; N is the grain-to-straw ratio of different crops; R is the open burning proportion (OBP) of different crop residues in the field; η is the combustion efficiency for the various crops.
Crop production at the city-level was taken directly from the Hubei Statistical Yearbook (2013–2021). Grain-to-straw ratios and combustion efficiencies were obtained from a literature survey, as shown in Table 2. The grain-to-straw ratios in this study were based on a literature survey and follows several principles: first of all, the latest measured grain-to-straw ratios of different crop species in Hubei Province are preferred. When the grain-to-straw ratios in Hubei Province were not available, we used the research results from domestic measurements. OBP was usually obtained by field investigation, which was time consuming and expensive. Hence, it was often scarce. Some previous research used the fixed OBP for many different years. Actually, the OBP should change every year with air quality control policies and the development level of the local economy.
In this study, we used VIIRS active fire product to update annual OBP to get accurate emissions inventory. The year of 2012 was selected as the base year, and OBPS for other years were calculated based on the OBP for 2012. The proportion of four types of crop residue open burning in the base year were 19.1%, 27.8%, 21.6%, and 24.7% respectively, which were collected from a questionnaire survey conducted by Peng et al. [21]. The OBPS for other years were calculated using Equation (3) and were shown in Table 3. The trend of OBPS calculated using MODIS FRE by Zhou et al. during 2012–2018 is consistent with that of our results, which indicates that the results of updated OBP in this study are reliable [18].
R y = FC y FC BS × R BS
where y stands for the year; Ry is the proportion of crop residue open burning in year y; FCy is the count of active fires that occurred in cropland; FCBS and RBS are the count of fire counts and the OBP in the base year, respectively.
Table 2. Parameters used in the calculation of residue resources burned in the open field.
CropGrain-to-Straw RatioCombustion Efficiency
Rice1.17 a0.93 d
Wheat1.39 b0.92 d
Corn0.98 b0.92 d
Rapeseed3.17 c0.8 e
References: a Zeng et al. [22]. b Wang et al. [23]. c Zou et al. [24]. d Zhang et al. [25]. e Wang et al. [26].
Table 3. The proportion of crop residue open burning after being updated.
YearFire CountRiceWheatCornRapeseed
2012423919.10%27.80%21.60%24.70%
2013879639.63%57.69%44.82%51.25%
2014626828.24%41.11%31.94%36.52%
2015391517.64%25.68%19.95%22.81%
2016357916.13%23.47%18.24%20.85%
2017322314.52%21.14%16.42%18.78%
2018306313.80%20.09%15.61%17.85%
2019423619.09%27.78%21.58%24.68%
202017327.80%11.36%8.83%10.09%

2.2.2. Emission Factors

The physical and chemical properties of crop residue (water content, density, etc.) have an impact on the emission factors of pollutants emitted from the crop residue combustion. The emission factor is an important parameter for estimating pollutant emissions from crop residue open burning. Accurate EFS can be obtained from field or laboratory-measured, which is difficult to be conducted widely. Emission tests for crop residue open burning in China are relatively few. Therefore, most researchers collect them from literature reviews. In this study, we collected EFs for different species of crop burning from previous research carried out in Hubei or near regions. When domestic EFs were not available, we selected them from foreign research results through literature. The EFS of different crop species were summarized in Table 4.

2.3. Method for Spatial Allocation

Crop residue open burning fires have obvious spatial and temporal variation characteristics under the influence of natural and socio-economic conditions. In order to estimate emissions inventory with high spatial resolution, much previous research allocated total emissions to grids based on cultivated land area or fire counts retrieved by satellite. Due to the influence of a strict prohibition policy of crop burning, regions with a large cultivated land area may not necessarily have more straw burning; this indicates that using cultivated land area alone as the allocation proxy may introduce huge uncertainty. The number of crop fires retrieved by satellite can reflect the spatial distribution of crop residue open burning every year; it is another common spatial proxy; however, there may be many omissions in present active fire product due to the limitation of spatial and temporal resolution of satellites and the weather condition.
Therefore, we used both cultivated land area and fire counts as spatial surrogates in this study [3], and the emissions were allocated to the grid with 0.1° × 0.1° resolution based on a geographic information system (GIS) software tool by the following equation:
E g . p = 50 % · FC g FC c · E c . p + 50 % · CA g CA c · E c . p
where g is the different grids; c is the different cities; p is the different type of pollutants; E is the emissions of pollutants in each city or grid, ton; FC is the number of fire counts in each city or grid; CA is the cultivated land area in each city or grid.
Cultivated land area was calculated from the land cover product (GlobeLand30) derived by the Landsat and China Environmental Disaster Alleviation Satellite (HJ-1), with a spatial resolution of 30 m (http://www.globallandcover.com/, accessed on 27 June 2022). Considering that land cover changes slowly, emissions in this study for 2012–2015 and 2016–2020 were spatially allocated using the cultivated land area in 2010 and 2020, respectively. Crop fire points were collected from VIIRS 375 m active fire products (VNP14IMG) (http://ladsweb.modaps.eosdis.nasa.gov/search, accessed on 27 June 2022). The extraction process of crop fire points is as follows. First, the thermal anomaly points with high accuracy were selected by quality control parameters and overlayed with land cover data. Then the agricultural fire points were screened by cultivated land. Lastly, we used high-resolution remote sensing images to remove noise points.

2.4. Method for Temporal Allocation

Crop residue open burning is related to crop plant structure, the growth pattern of crops and related policy, with an apparent seasonal variation. To investigate the temporal variation of pollutant emissions, monthly emissions were allocated based on VIIRS fire counts. The specific allocation method is shown as the following equation:
E m · p = FC m FC y · E y · p
where m is the month; y is the year; p is the different pollutant type; E is the emissions of each species pollutant in each year or month, ton; FC is the number of fire counts in each year or month.

2.5. Method for Uncertainties Analysis

Activity data and emission factors used to calculate emission inventories are the main sources of uncertainty in this study. Crop yields are obtained from the Hubei Provincial Statistical Yearbook and have high reliability. The combustion efficiency of crop residue open burning is related to the combustion method and crop type; however, there are fewer measurement studies in Hubei Province, which introduces uncertainty into the results of the study. The emission factors of different crops are related to the moisture content and combustion status of crops, which were not considered in this study due to the lack of measured data; these may have a certain impact on emissions from crop residue open burning. Furthermore, the grain-to-straw ratios and open burning proportion introduce some uncertainty to the result.
The Monte Carlo method was used to evaluate the uncertainty for the emissions inventory. Monte Carlo is a method of random simulation using computers; this method estimates the probability characteristics of random events by obtaining their frequency of occurrence in a large number of experiments.
To further verify the reliability of the emission inventory, this study calculated the correlation between total PM2.5 emissions and Aerosol Optical Thickness (AOD) retrieved by satellite during the straw burning season (October) and the non-straw burning season (July) from 2012 to 2020. The AOD data are retrieved by MODIS Multi-Angle Implementation of Atmospheric Correction (MAIAC) algorithm, which uses multi-angle information observed by time series to realize global aerosol retrieval at a high resolution of 1 km. The AOD data can be downloaded from the website (http://ladsweb.modaps.eosdis.nasa.gov/search, accessed on 27 June 2022).

3. Research Results

3.1. Emissions from Crop Residue Open Burning

The total emissions from crop residue open burning in Hubei from 2012 to 2020 were summarized in Table 5. The total emissions of BC, OC, SO2, NOX, CO, CO2, PM2.5, PM10, NH3, CH4 and NMVOC were 34.84, 149.72, 41.06, 90.11, 2640.97, 78,094.91, 485.17, 481.05, 35.21, 246.38 and 499.59 Gg, respectively. The emissions were mainly concentrated in Xiangyang, Jingzhou, Jingmen, and Huanggang, where there was plenty of cultivated land and crop residue. Emissions in Shennongjia, Ezhou, Huangshi, and Qianjiang were small.
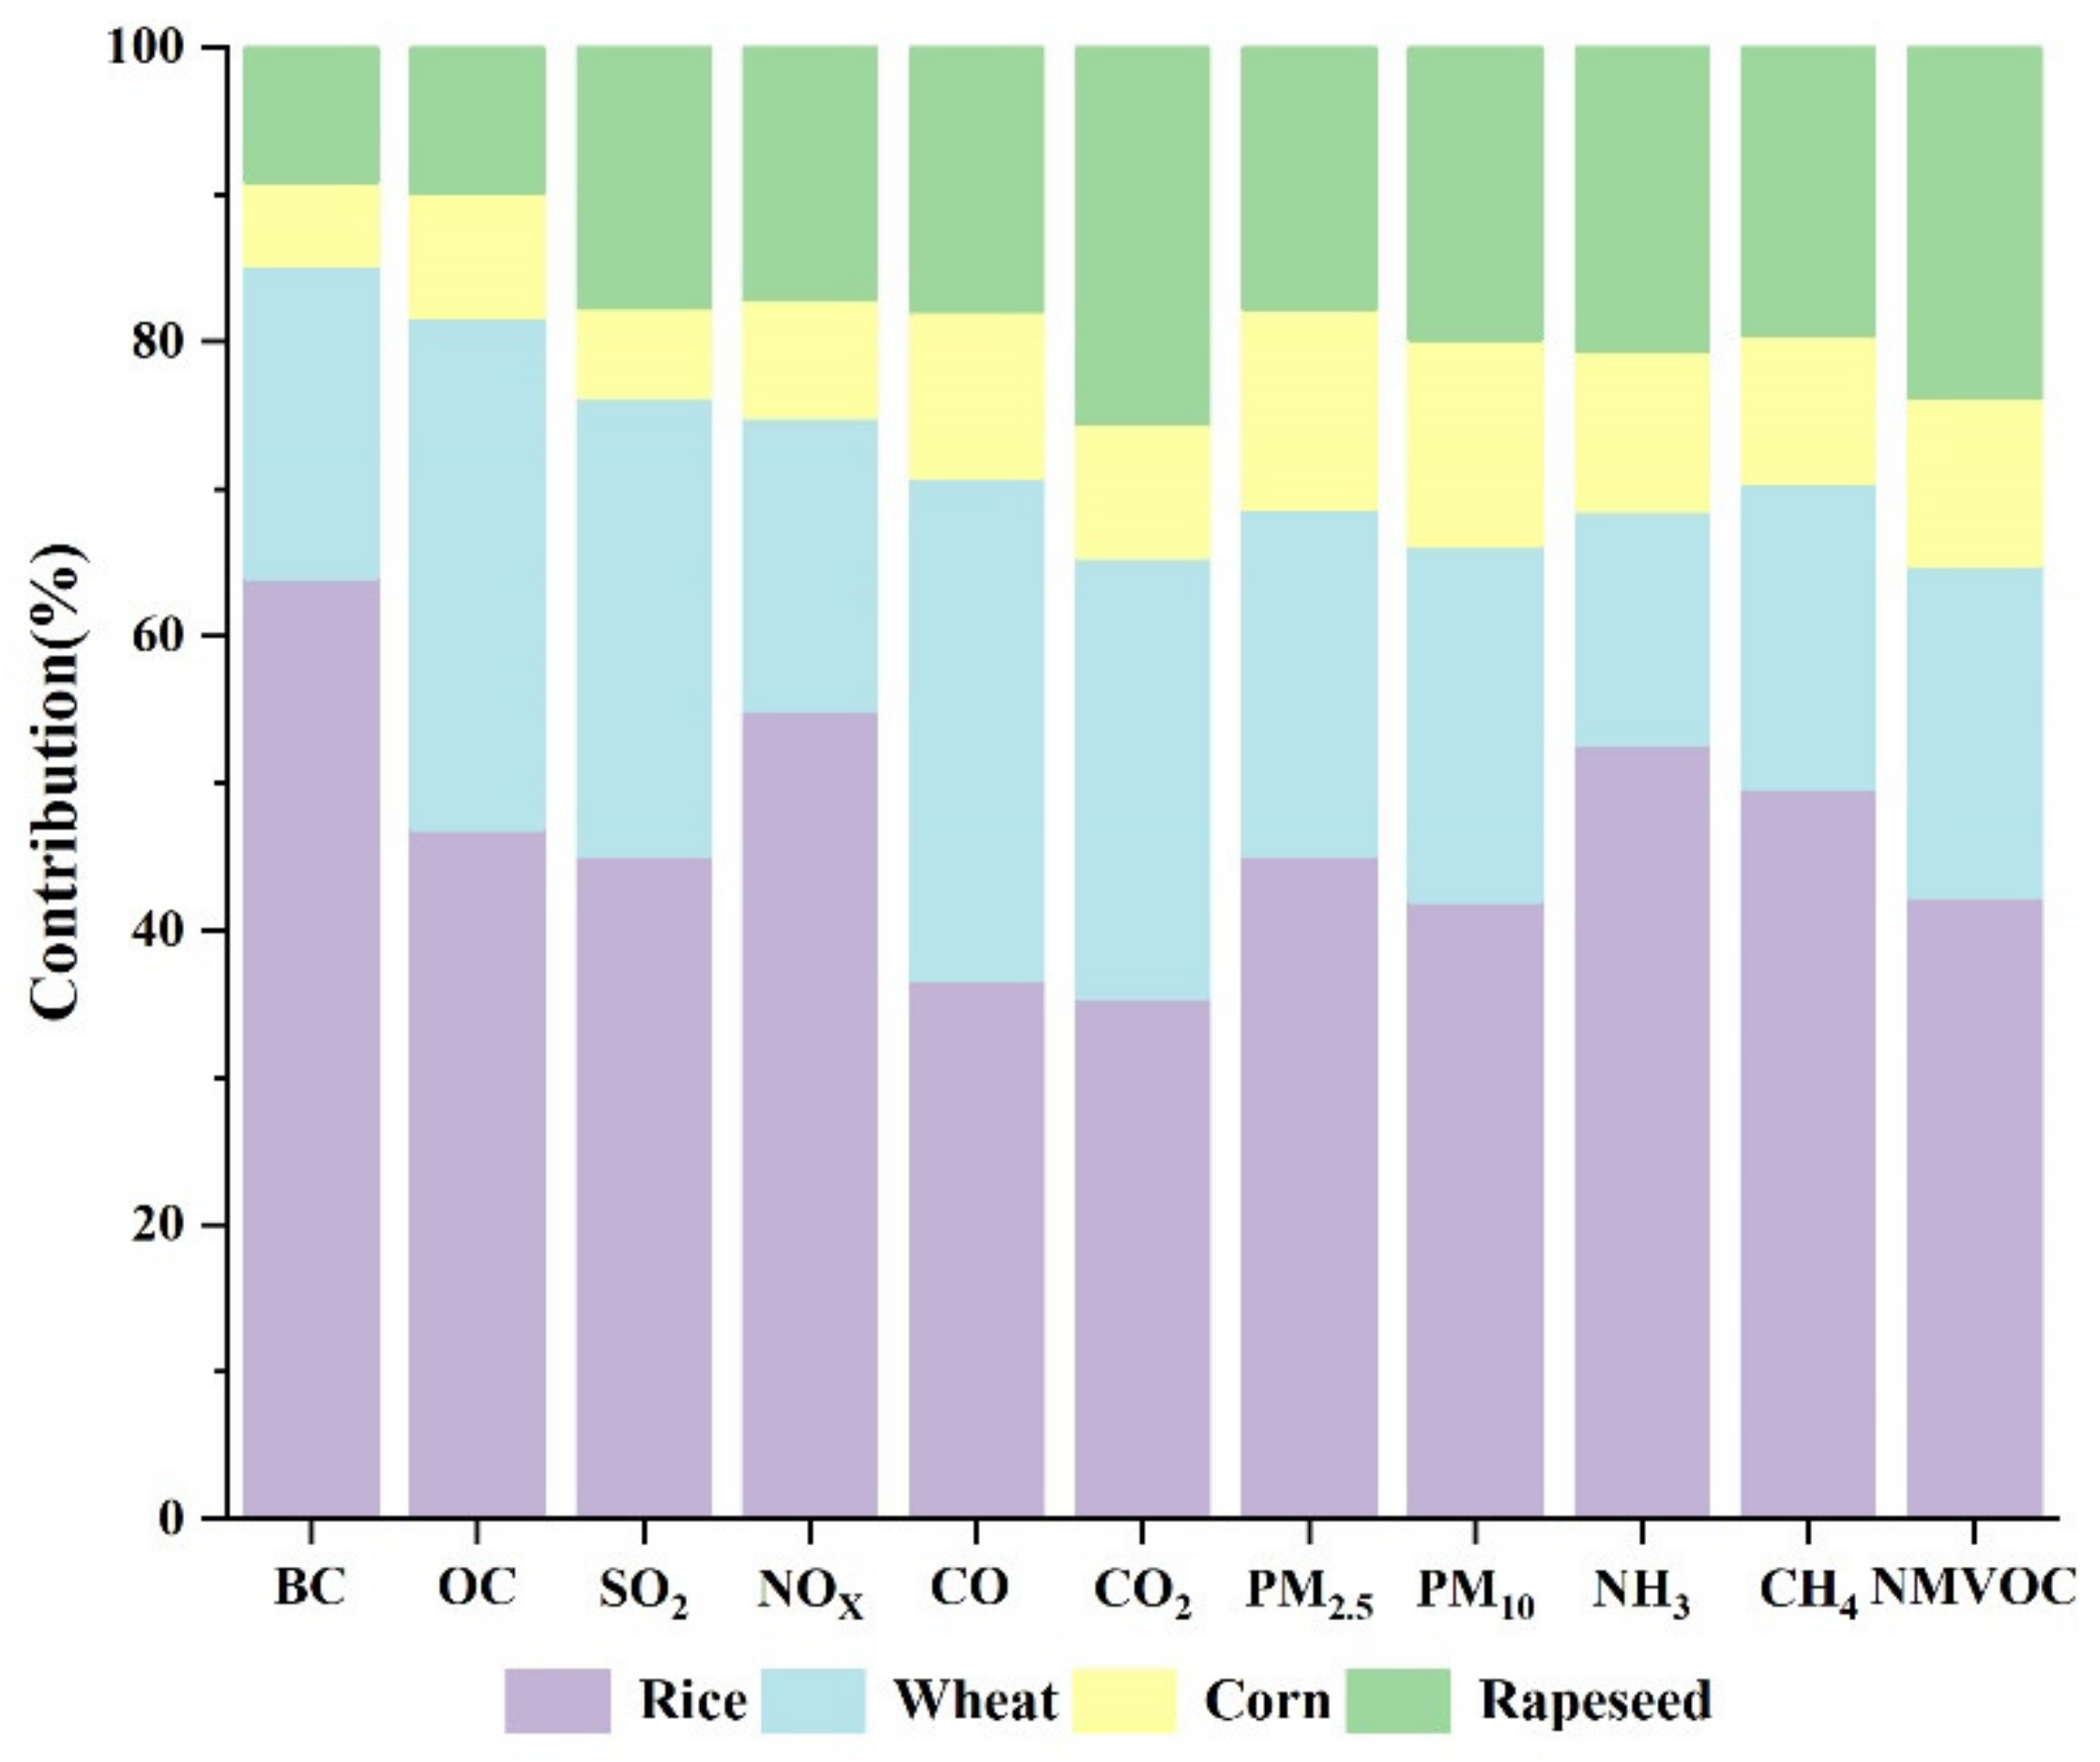
Figure 2 shows the contributions of different crop species to the total emissions in Hubei from 2012 to 2020. The largest contributor to emissions was rice, followed by wheat, rapeseed and corn, accounting for 35.34–64.07%, 15.78–34.71%, 9.12–25.56%, and 5.69–14.06%, respectively. The total yield of rice (164,842.41 Gg) was much higher than that of other crops, which was 4.1, 5.8, and 7.8 times the yield of wheat, corn, and rapeseed, respectively. Therefore, rice straw became to the largest contributor to emissions of pollutants. Although the yield of corn was higher than rapeseed, rapeseed emits more pollutants than corn due to the higher proportion of open burning of rapeseed in Hubei Province. In addition, the EFS of different crop species are also an important factor affecting the contribution of crop residue open burning emissions. For example, the contribution of wheat to CO emission reached 34.12%, which was 3 and 1.9 times that of corn and rapeseed respectively; this was mainly because the CO EF of wheat was significantly higher than that of other crops.
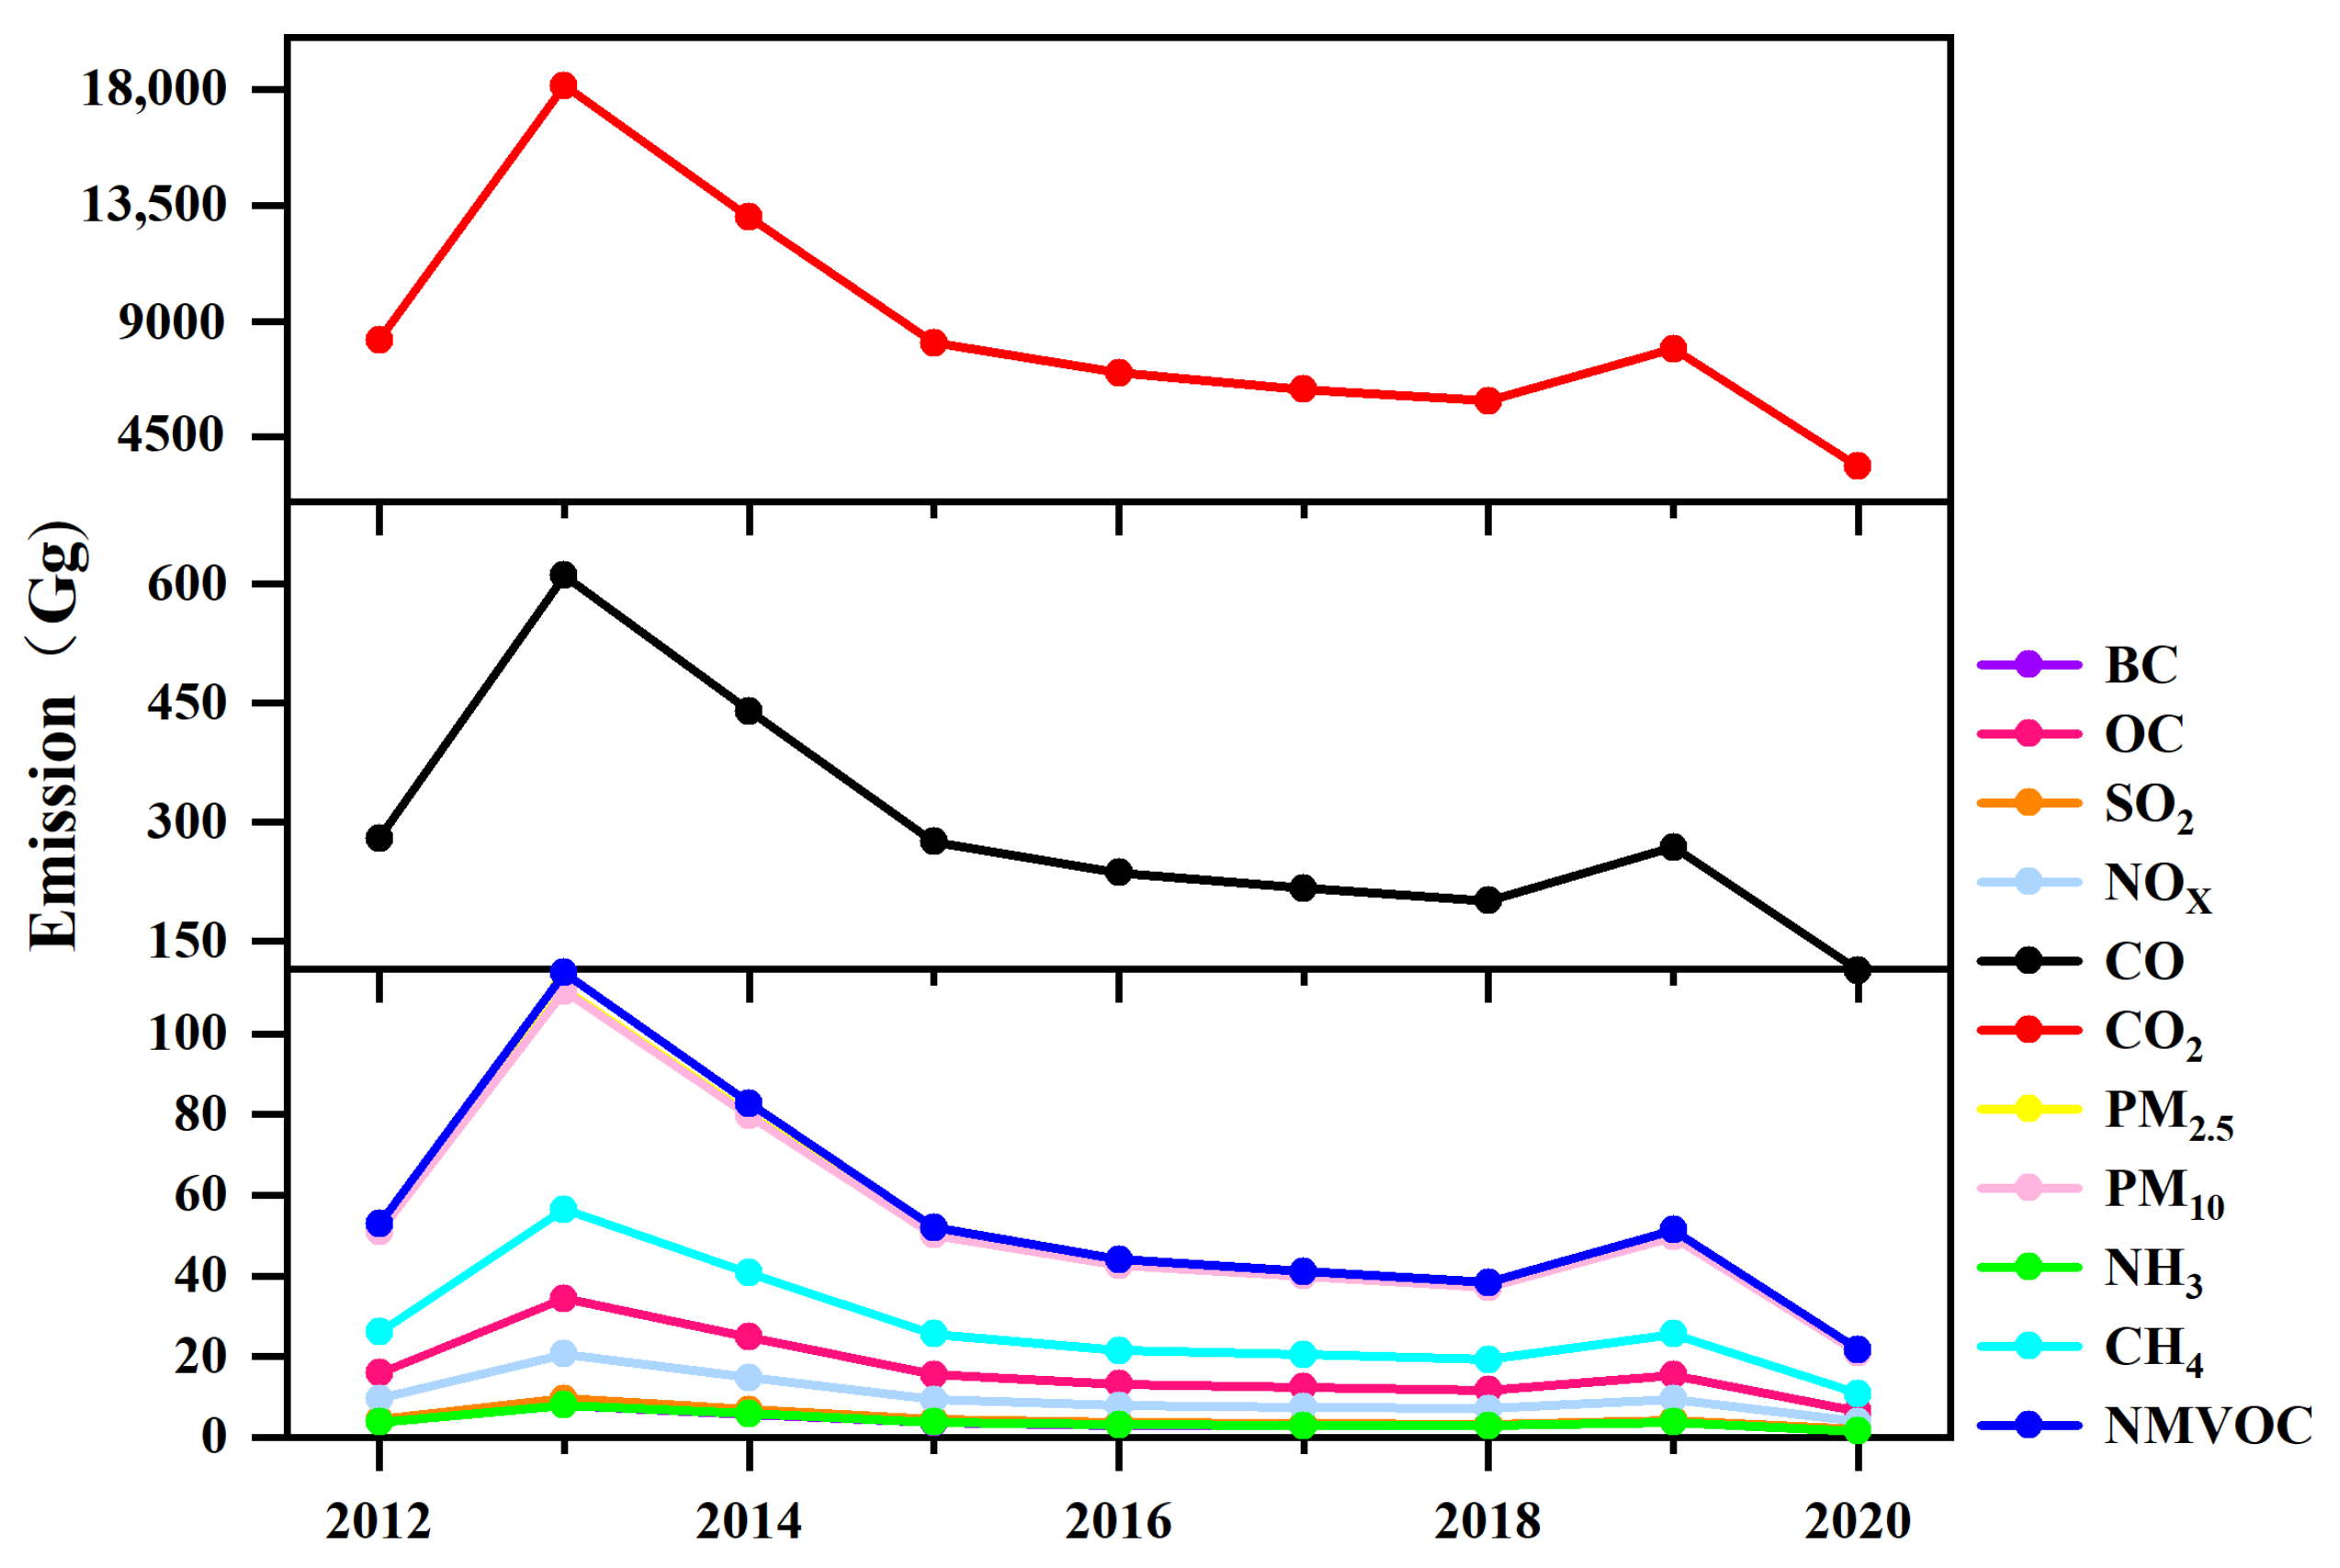
The emissions of all pollutants from crop residue open burning in 2012–2020 had similar annual variation characteristics, with an overall trend of first rising and then falling (Figure 3). As it was shown in Figure 3, the emissions peaked in 2013, increasing by 113–120% compared to 2012. In 2013, Hubei Province had not yet implemented a strict straw burning ban policy, so the amount of crop residue open burning was still increasing. Since 2014, with the adoption of strict control policies, the emissions from crop residue open burning gradually slowed down year by year, with a small rebounded in 2019. Emissions were reduced to their lowest level in the past 9 years in 2020, which were only about 18–20% of the total emissions in 2013.

3.2. Spatial Distribution of Emissions

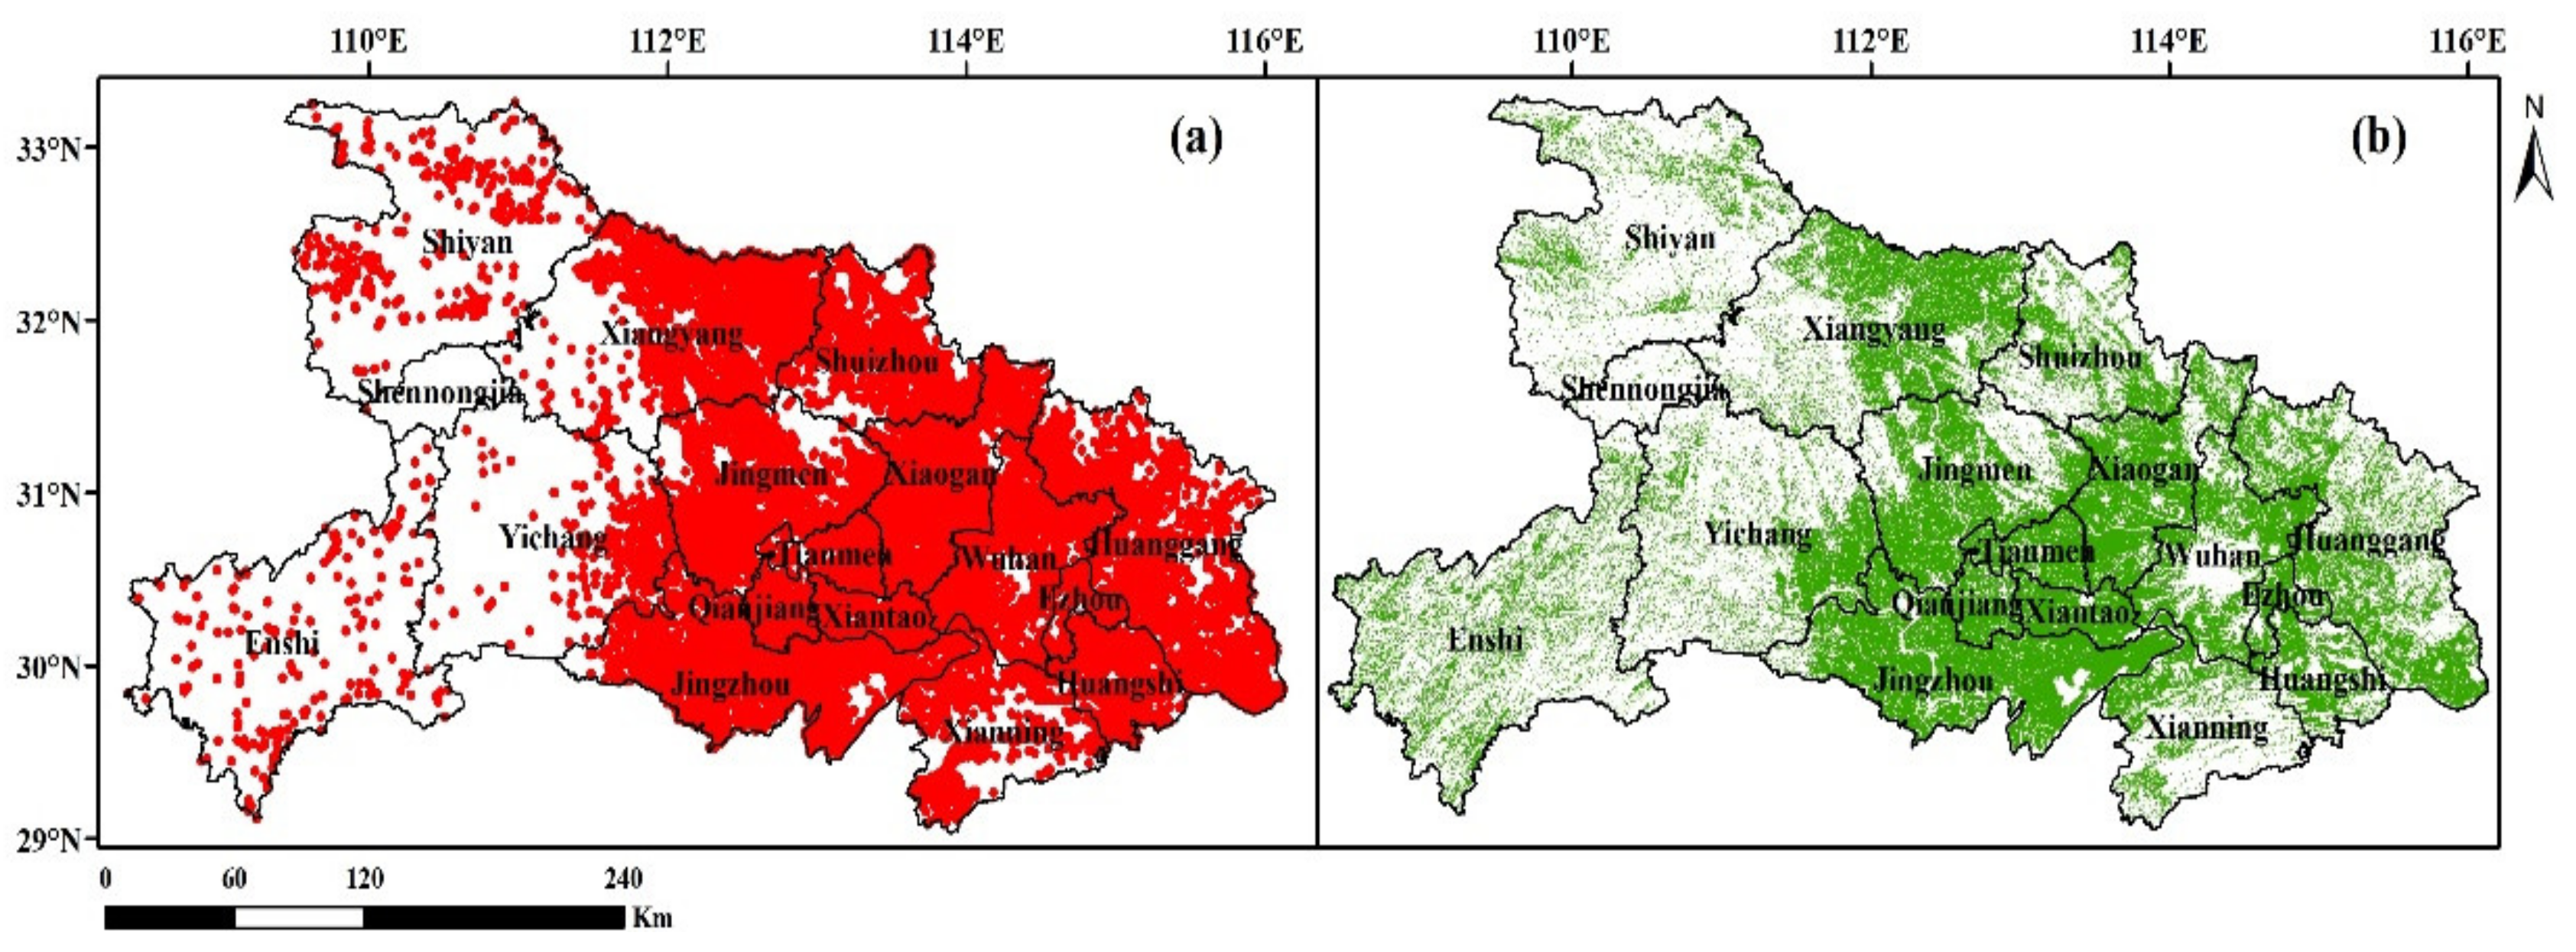
Figure 4 presented the spatial distribution of crop fire points retrieved by VIIRS in Hubei from 2012 to 2020 and the distribution of cultivated land in 2020. As seen in Figure 4, the fire points were mainly concentrated in the central and eastern parts of Hubei Province, which had large areas of cultivated land. At the city level, Xiaogan, Jingzhou, and Huanggang had a large number of fire points, 6634, 4988, and 3583 respectively, accounting for 16.99%, 12.77%, and 9.18% of the total fire counts, and they were the major regions of crop residue open burning in Hubei.
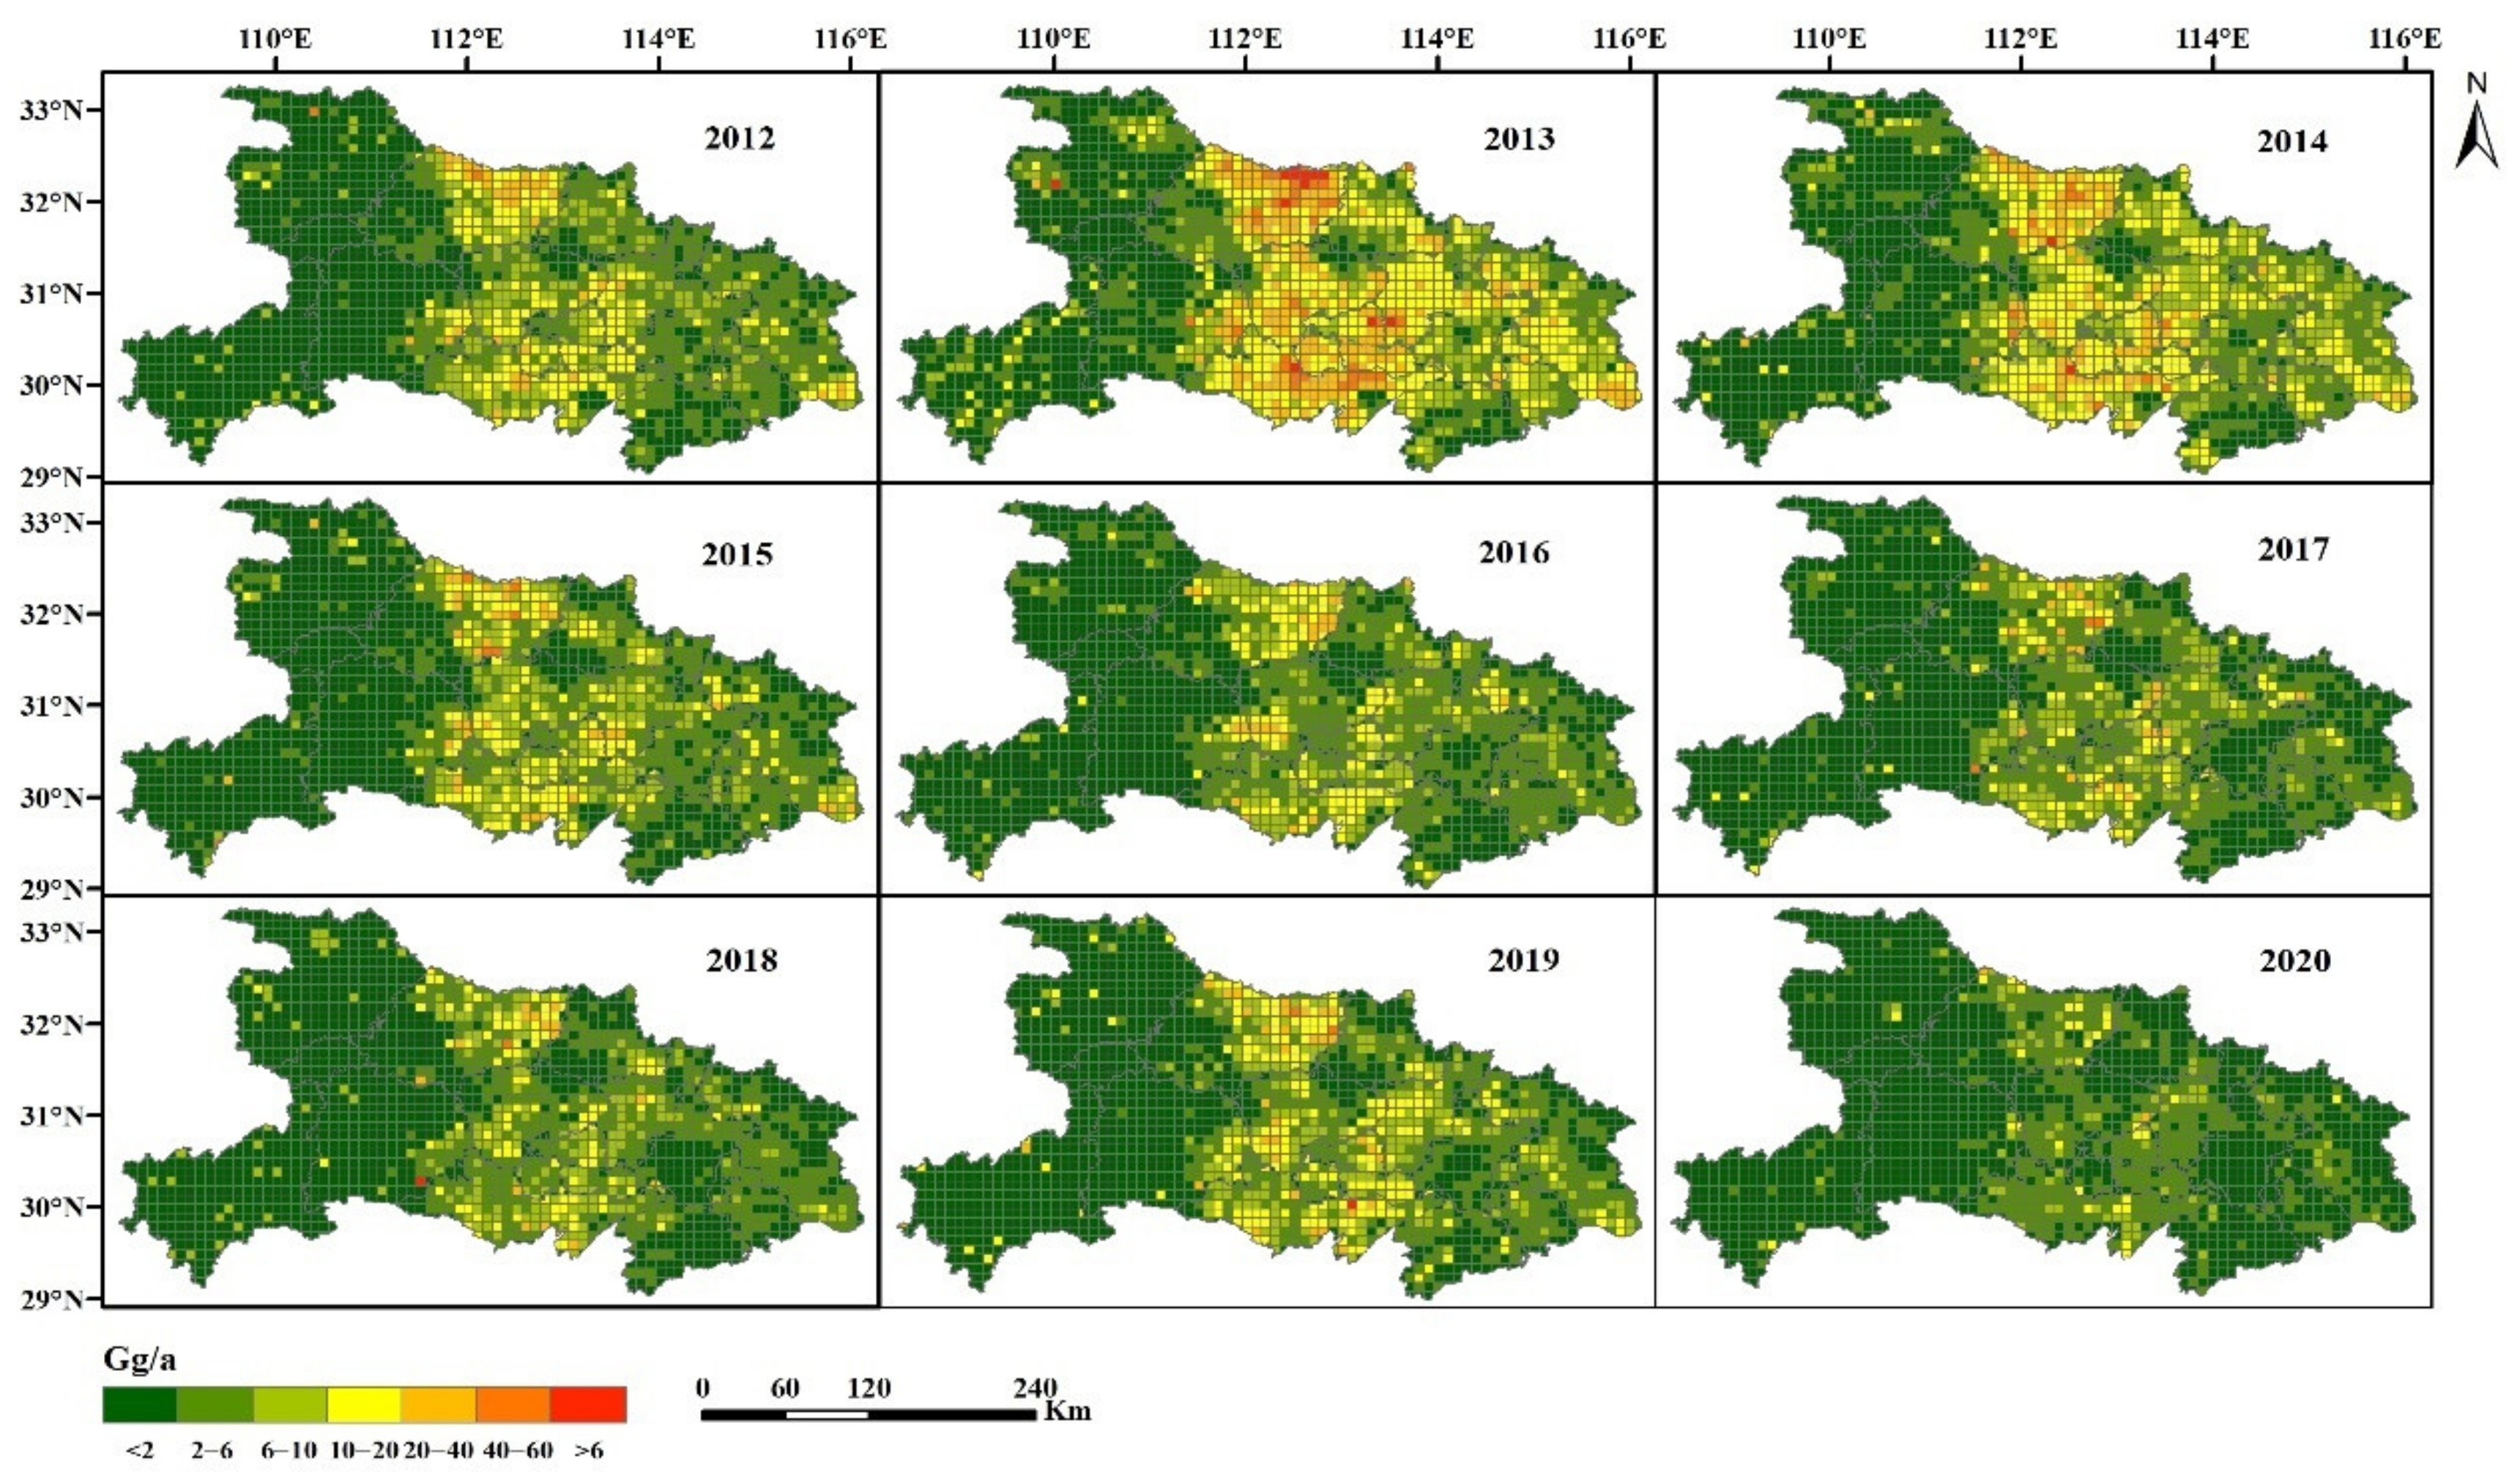
To analyze the spatial distribution and annual variation characteristics of pollutants in Hubei from 2012 to 2020, the resolution of 0.1° × 0.1°grids for CO2 emissions were used as a representative example, which was shown in Figure 5. CO2 emissions were mainly concentrated in the Middle East regions of Hubei Province, where there had a large cultivated land area and high crop yields, such as Xiangyang, Jingzhou, Huanggang, and Jingmen. CO2 emissions peaked in 2013 with 18,137.26 Gg, 2.19 times of the emissions in 2012 and accounting for 23.22% of total emissions. During the peak period of emissions, most of the grids in central and eastern regions had CO2 emission intensity of 10–20 Gg. Some hotspot grids had an emission intensity of more than 60 Gg. Since 2014, the government has strengthened the control measures for crop residue open burning. CO2 emissions had declined year by year and reached a minimum of 3363.05 Gg in 2020. Hotspot grids with CO2 emission intensity of more than 60 Gg had almost disappeared, and the grids with high values of emission intensity (10–20 Gg) in central Hubei province significantly decreased. By the year of 2020, the emission intensity in most grids was below 10 Gg. Places such as Shennongjia in western Hubei have high altitudes and low temperatures, which are not suitable for crop growth, thus, the emission of pollutants had maintained at a low level for a long time. In 2020, the emission intensity of most grids was below 10 Gg, however, there were still a small number of grids that maintain emission intensity of 10–20 Gg; this indicates that though crop residue open burning has been strictly controlled in recent years, scattered burning activities still exist in some regions. Therefore, the government should seek more effective ways to comprehensively utilize straw, rather than relying solely on strict straw burning control measures.

3.3. Temporal Variation of Emissions

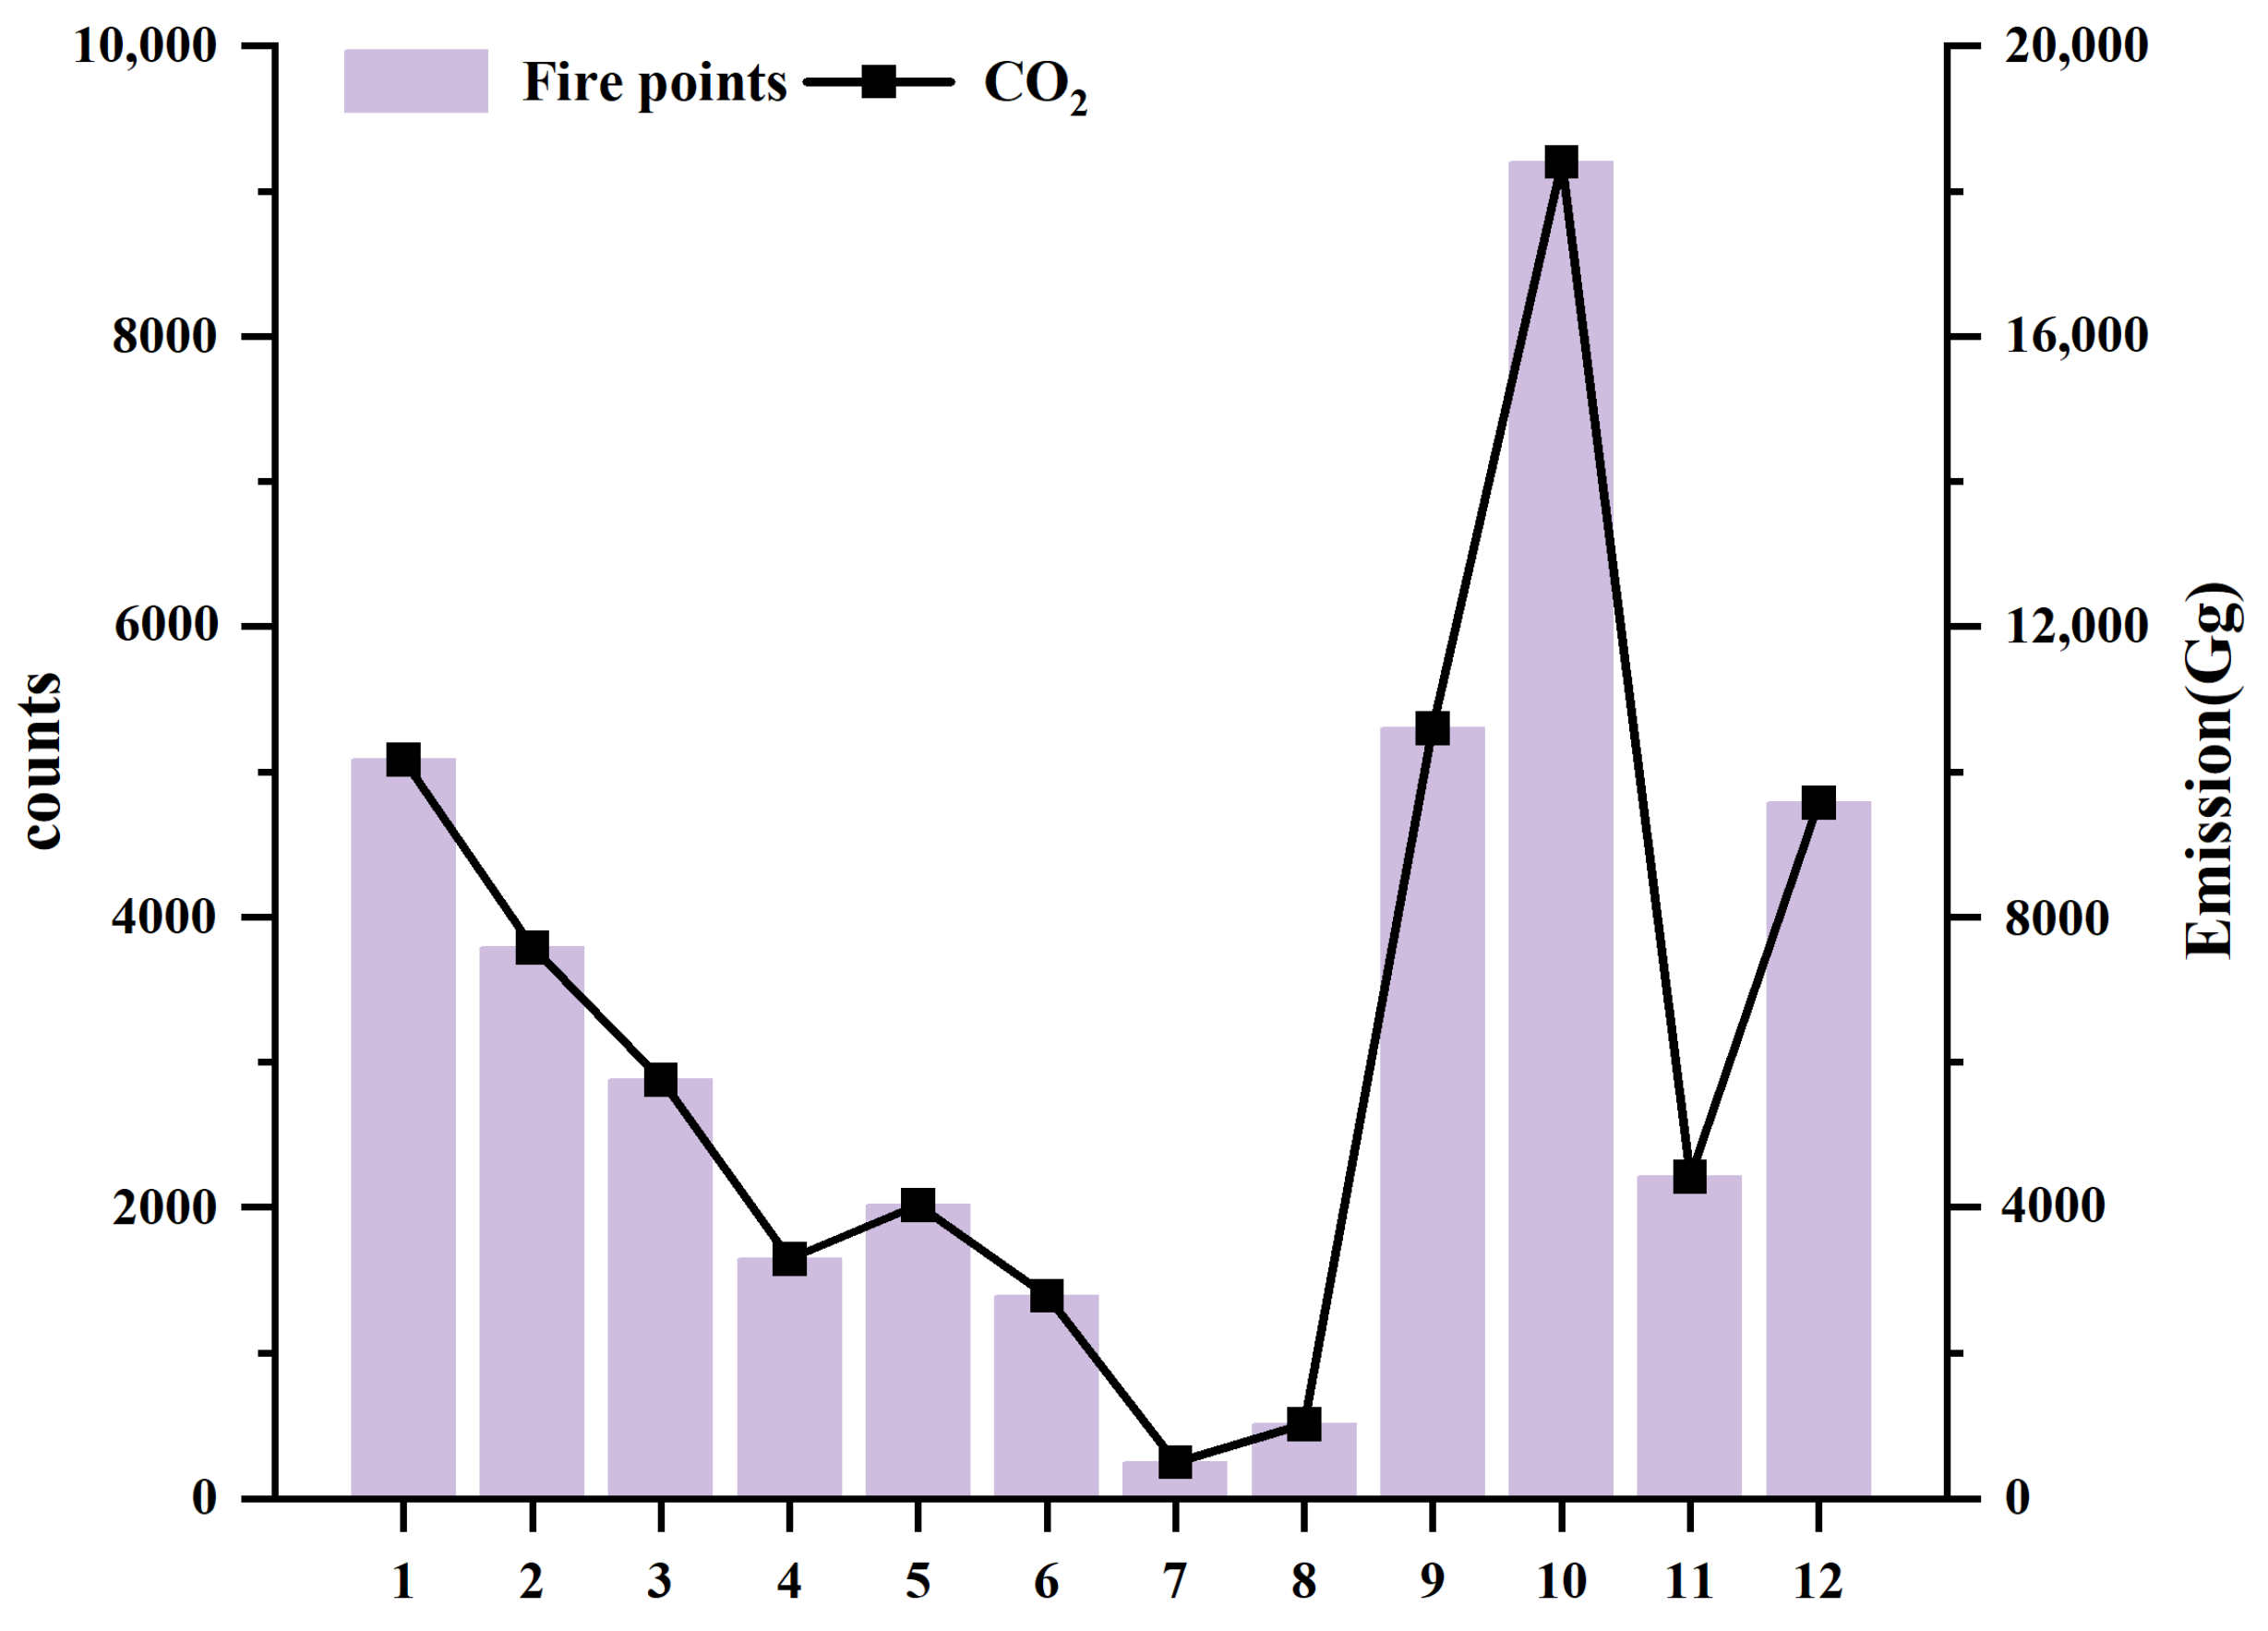
To better understand the spatial-temporal variation patterns of emissions from crop residue open burning, this paper analyzed the monthly CO2 emissions and the number of fire point as illustrative examples (Figure 6). As seen in Figure 6, the monthly number of fire points and CO2 emissions had obvious seasonal variations. More agricultural fires mainly occurred in September and October, with a number of 14,502, accounting for 37.14% of the total number of fire points. The number of fire points peaked in October, with a number of 9202, accounting for 23.56%. In addition, there were some scattered small peaks of fire in other months.
The monthly trend of CO2 emissions was similar to that of the fire points. CO2 emissions were concentrated in September and October, at 10,599.03 and 18,402.31 Gg, accounting for 13.57% and 23.56% of total emissions, respectively; this was mainly because September and October were the ripening periods of rice and corn, and a large amount of straw was produced after the crop was harvested. In addition, there were two small peak periods for CO2 emissions, from December to January and from May to June. In recent years, Hubei Province has strengthened the control measures of crop residue burning during the autumn harvest period, which may lead some farmers to try to burn the crop residue in winter to avoid the strict controls in autumn. In addition, late spring to mid-summer was the ripening period for wheat and rapeseed, which increased emissions from wheat straw and rapeseed from May to June.

3.4. Comparison with Previous Studies

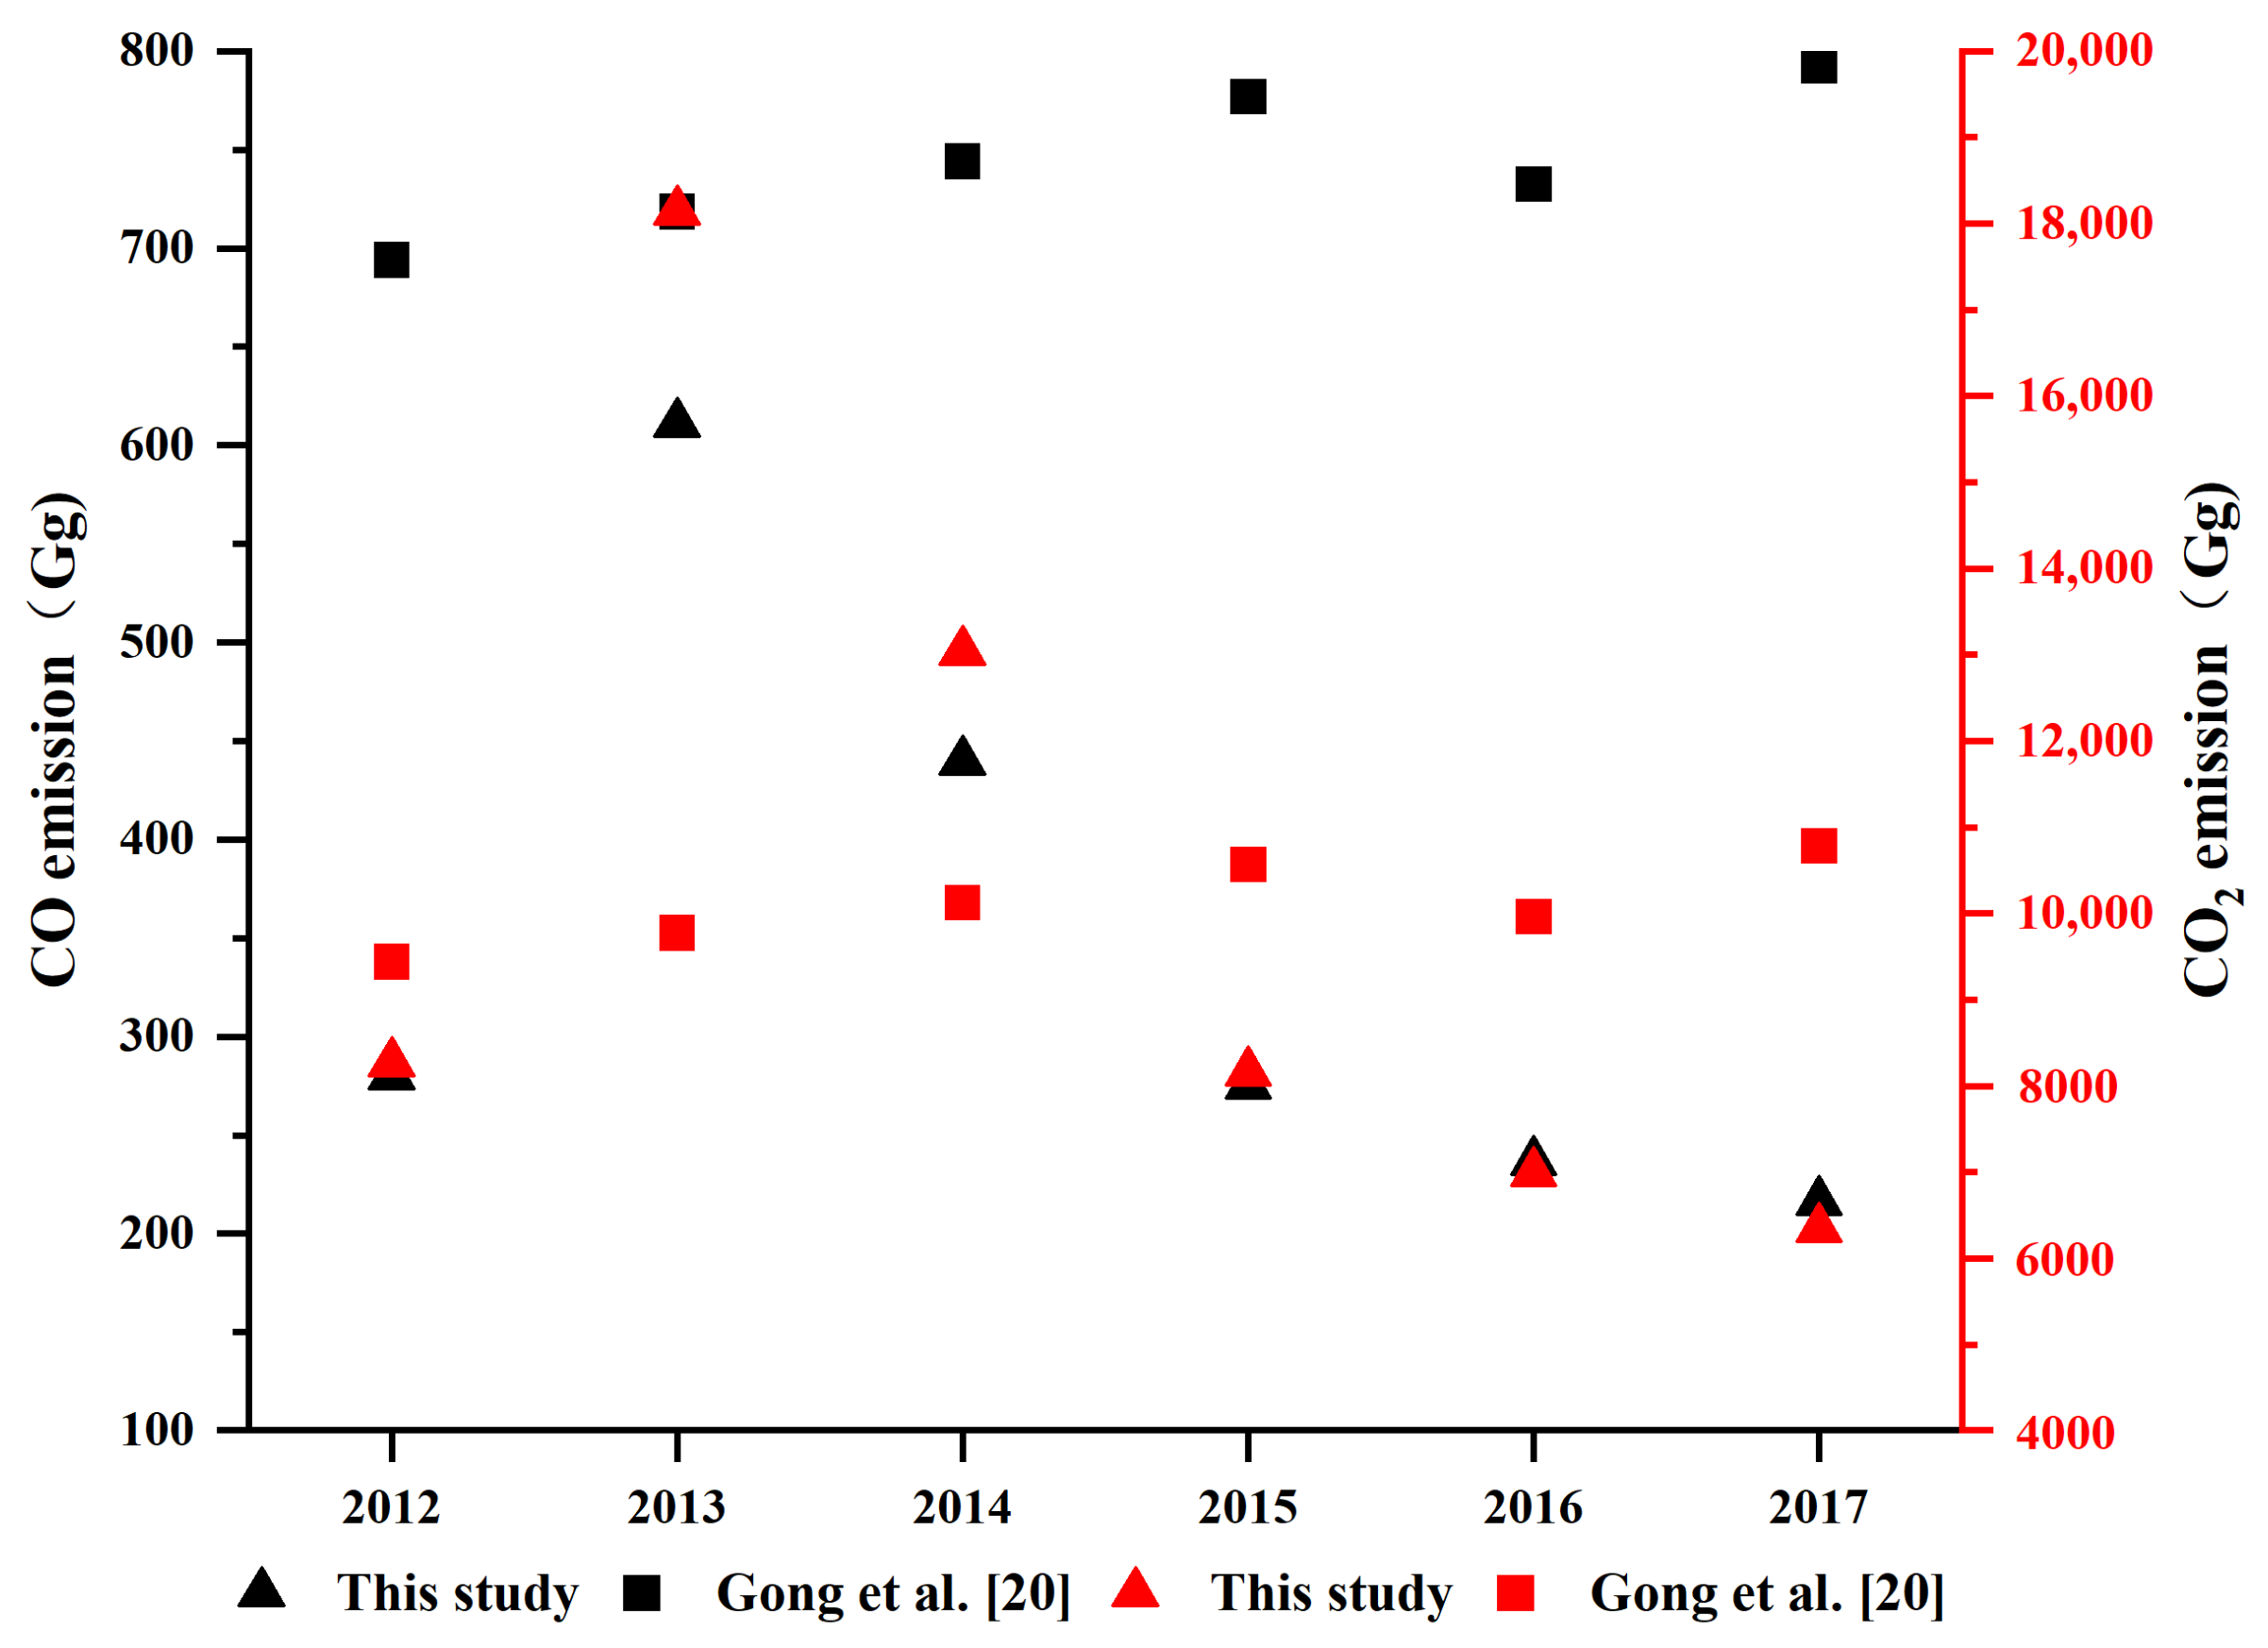
The spatial distribution of crop residue open burning is very dispersed and the combustion process is rapid, which makes it difficult to monitor its emissions using conventional ground investigation. Most current studies have verified the accuracy of the emission inventories by comparing them with previous studies, and analyzed their uncertainties through Monte Carlo simulations. Therefore, the emission inventory of Hubei Province was compared with the results of previous research with the same study area cited in Table 1. And it was found that there were large differences (Figure 7 and Table 6). Compared with the CO and CO2 emissions derived from Gong et al. (Figure 7), the differences ranged from 14.98% to 72.7% and from −85.55% to 41.21%, respectively [20]. For CO emission, the results of Gong et al. were overall higher than those in this study, which was mainly caused by the selection of EFS and OBP. On one hand, the EF of CO for various crop types used in this study was generally lower than the same EF used for all crop species in Gong et al. On the other hand, the OBPS for different crop species for multi-years used in Gong et al. were constant values (19.1–27.8%), while the annually updated OBPS based on the VIIRS fire counts ranging from 28.24 to 57.69% were used in this study, which was reasonable. For CO2 emission, the difference was small in 2012. During 2013–2020, the annual emission of Gong et al. changed very little, while the emission of this study declined drastically due to the use of the annually updated OBPS. The pollutant emissions estimated by using changing OBPS were more reliable under the strict straw burning ban policy in Hubei province. Compared with the pre-2006 emission inventory, the emissions in this study were much higher. The differences might attribute to the gradual increase in crop production. From 2003 to 2006, the yield of major crops in Hubei was about 18,000–20,000 Gg, while in 2012 it was about 28,000 Gg, the differences in crop production and the proportion of open burning both affected the estimation results of the inventory. In addition, compared with the emissions derived by Wang et al., the differences in CO2 emissions were relatively high [34]; these differences were mainly caused by the selection of EFS. The EFS of CO2 employed in Wang et al. was a constant value for various crop types, was 151.5 g/kg, while the value in this study was 791.3–1557 g/kg for different residues; this study synthesized the results of recent EFS experiments and provided more accurate results.
The emissions of BC, OC, SO2, NOX, CO, CO2, PM2.5, NH3, CH4, NMVOC in 2012 in this study were comparable to the results of those in Li et al., with differences of −85%, −13.57%, −46.67%, 49.47%, 8.86%, −31.37%, −11.52%, 53.75%, −8.75% and −50.86%, respectively [35]; these differences were mainly caused by the adoption of more accurate and suitable EFS values in this study. The estimated emissions in this study were comparable to the results of Peng et al. and Li et al., with differences ranging −29% to 52% [21,36]. Most of our estimations were lower than the values estimated by Li et al., the differences were mainly caused by the OBP used [19]. Li et al. used the proportions of open burning in 2010 ranging from 21.2% to 100%, which were significantly higher than the values used in 2012 in this study. In addition, Li et al. calculated emissions from five major crops, while this study only estimated emissions from four crops. There was a large difference between the emission inventories developed by different methods and data sources; this study used more detailed and reliable parameters, which can provide a more reliable emission inventory for further environmental research and policy-making on controlling crop residue open burning in Hubei province.
Table 6. Comparison of the emissions with previous studies in different years (Gg).
RegionReferenceYearBCOCSO2NOXCOCO2PM2.5PM10NH3CH4NMVOC
HubeiThis study20123.7115.914.369.56279.858268.4851.3350.873.7326.152.84
Li et al. [35]2012214319307629446-82435
Li et al. [36]2010----469.76389.5-----
Peng et al. [21]2009321420304809075-42144
Wang et al. [26]20061.211.91.58.9181383654-2.19.321.7
Wang et al. [34]2004-18.72.314.2320.4860.7-32.87.49.5-
Cao et al. [37]20033.114.91.811.3334.86836.5-265.99.9-
Jingzhou
Xiantao
Tianmen
Qianjiang
This study20120.863.380.992.2459.861893.5111.32-0.886.05-
Li et al. [19]20103.0217.37.6115.8221718168.2-5.319.9-

3.5. Comparison with AOD Retrieved by Satellite

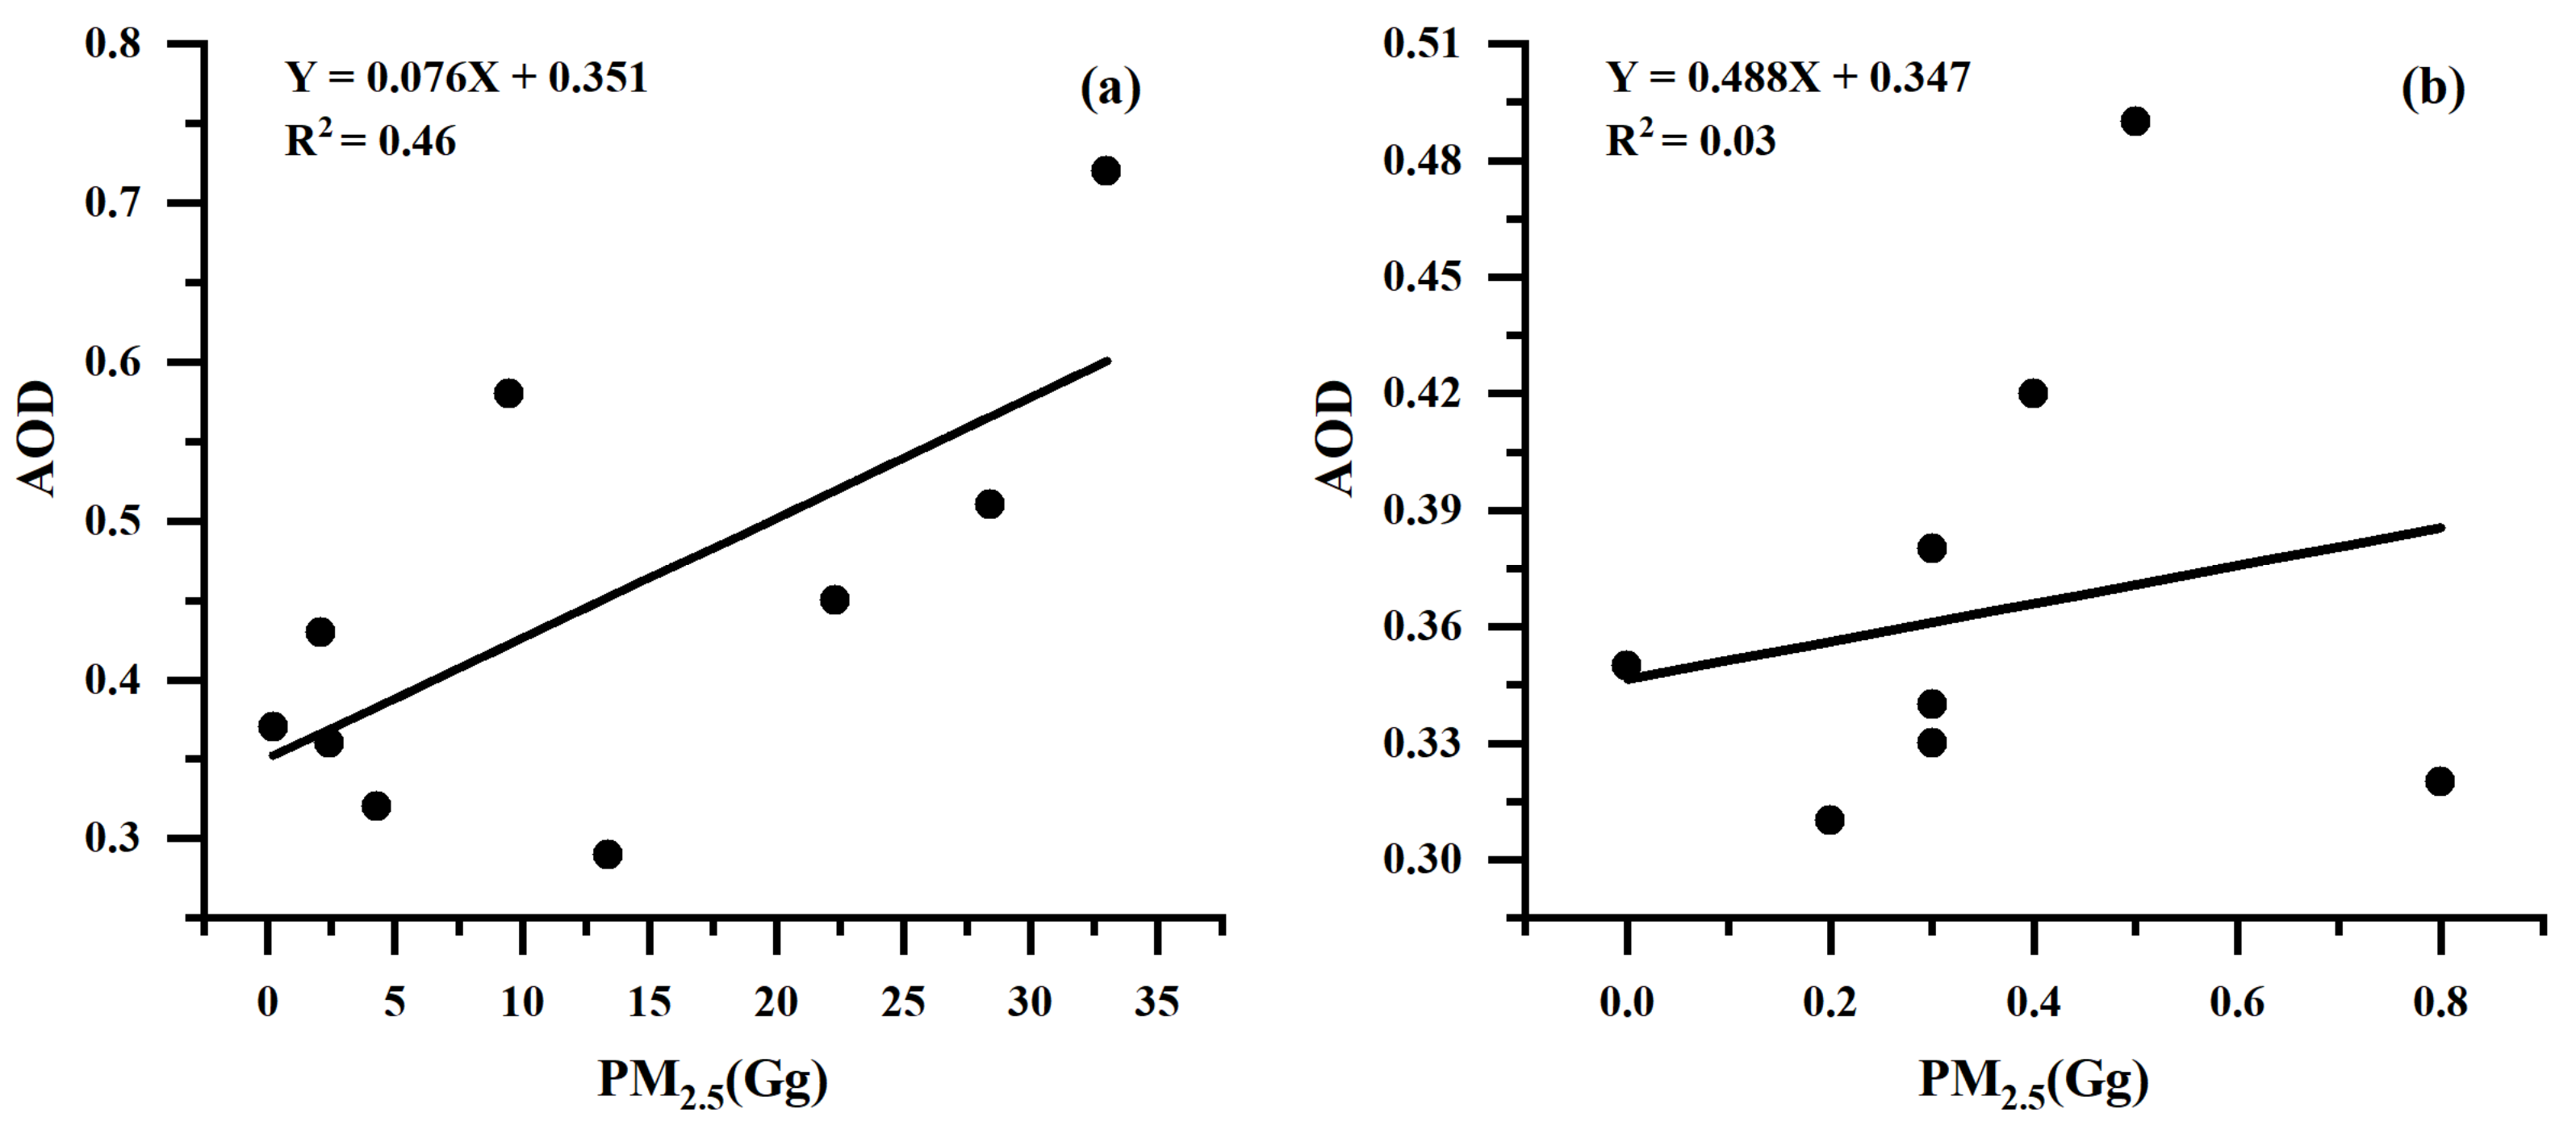
This study assessed the reliability of emission inventories by analyzing the correlation of PM2.5 emissions with MAIAC AOD data. Based on the monthly number of fire points observed by VIIRS from 2012 to 2020, October, with the highest number of fire points was defined as the straw burning season, and July with the lowest number of fire points was defined as the non-straw burning season; this study calculated the correlation between PM2.5 emissions and average monthly AOD during the straw burning season and non-straw burning season in 2012–2020, and the results are shown in Figure 8.
It is found that the correlation between PM2.5 emissions and AOD varies greatly from season to season. The PM2.5 emissions showed a good correlation with AOD during the straw burning season, with a coefficient determination (R2) value of 0.46. During the non-straw burning season, the correlation was poor, with an R2 value of 0.03. In addition to straw burning emissions, anthropogenic emissions are the main factor affecting AOD. Affected by anthropogenic emissions, although the correlation between PM2.5 emission and AOD is high, it is still limited. The results confirm the reasonableness of the estimated PM2.5 emissions, and further demonstrate the reliability of the emissions inventories estimated in this study.

3.6. Uncertainty Analysis

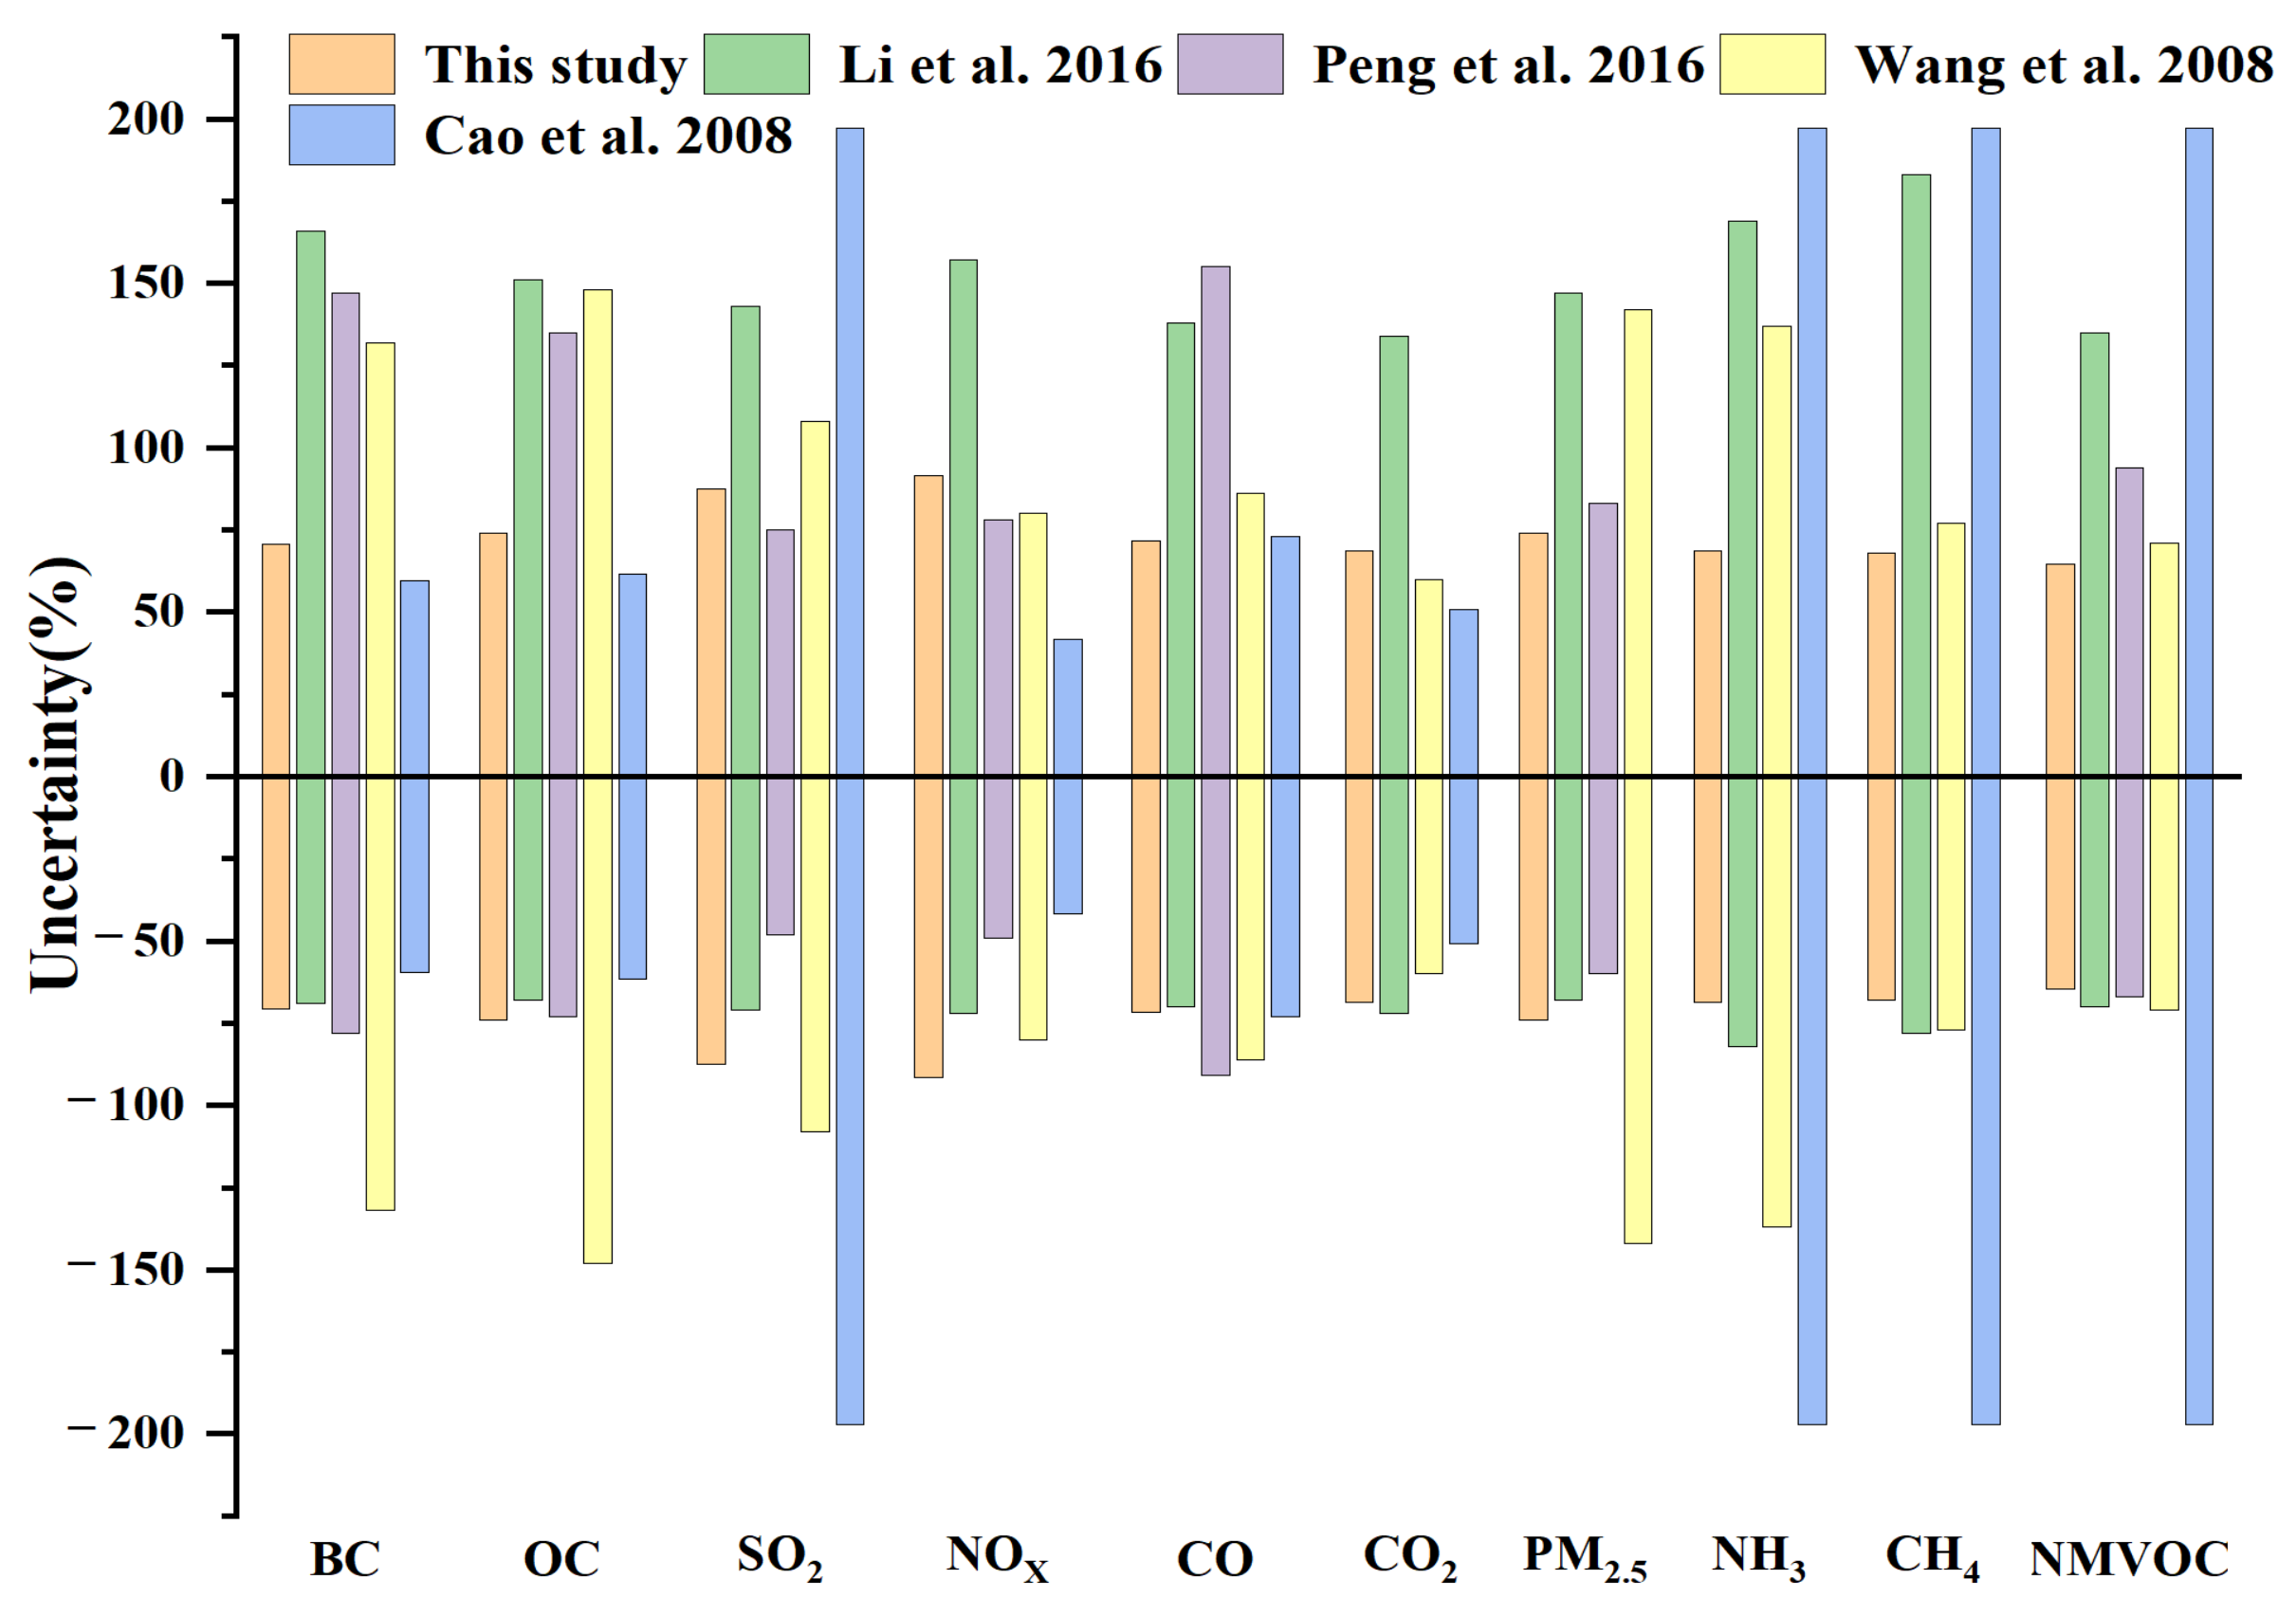
Many previous studies used Monte Carlo simulation to quantify the uncertainties in crop residue burning emission. To better understand the uncertainties in the emission inventory, this study took the emission inventory in 2012 as an example and used the Monte Carlo simulation method for uncertainty analysis. In this study, the emission uncertainty was mainly associated with EFS and activity data. Referring to previous studies, EFS and activity data were assumed to be normal distributions [38,39]. The crop production and grain-to-straw ratio were obtained from official statistics data and were relatively accurate, therefore, their coefficients of variation (CV) were set to 5% and 10%, respectively. The CV of OBP was set to 30% as in previous studies. The CV of combustion efficiency and EFS for each crop and pollutant were shown in Table 7. After CVS were determined, we conducted the Monte Carlo simulation 100,000 times with a confidence interval (CI) of 95%. The emission uncertainties for different pollutants in 2012 were as follows: BC (±70.76%), OC (±74.17%), SO2 (±87.52%), NOX (±91.35%), CO (±71.71%), CO2 (±68.62%), PM2.5 (±74.16%), PM10 (±75.98%), NH3 (±68.59%), CH4 (±68.13%), and NMVOC (±64.76%); this study compared the uncertainties of emission inventory with those in other studies (Figure 9) [21,26,35,40]; it was shown that the uncertainties of our emission inventory were lower due to the parameters selected were more representative. In particular, the use of the updated OBP can better reflect the actual situation of crop residue open burning in the region; however, it should be noted that EFs and activity data used in the model will greatly affect the uncertainties.

4. Conclusions

A statistical-based method was used to establish an emission inventory of crop residue open burning at the spatial resolution of 0.1° × 0.1°in Hubei Province from 2012 to 2020. To improve the accuracy of emission inventory, this study used the VIIRS 375 m active fire products to update the OBP annually and selected reliable EFs through an extensive literature review.
The total emissions of BC, OC, SO2, NOX, CO, CO2, PM2.5, PM10, NH3, CH4, and NMVOC from crop residue open burning were 34.84, 149.72, 41.06, 90.11, 2640.97, 78,094.91, 485.17, 481.05, 35.21, 246.38 and 499.59 Gg, respectively. The largest contributor of crop residue open burning was rice, followed by wheat, rapeseed and corn, with the contribution rates of 35.34–64.07%, 15.78–34.71%, 9.12–25.56%, and 5.69–14.06%, respectively. The pollutants emissions exhibited large annual variation, with the highest emissions in 2013 and a remarkable decrease from 2013 to 2015 under strict control measures. Since 2015, the emissions remained at a low level which showed that air quality control policies played a role in recent years. The high emissions are concentrated in the central and eastern parts of Hubei with frequent agricultural activities. Most hotspots of emission are distributed in Xiangyang, Jingzhou, Huanggang, and Jingmen. At the time scale, peak emissions of pollutants occurred in autumn harvest periods; moreover, there were two small peak periods in Winter and Spring.
In summary, this study constructed a pollutant emission inventory of crop residue open burning in Hubei from 2012 to 2020 based on EFS and activity data, which will provide long-term data support for formulating pollution prevention policies on open burning activities in Hubei; however, there are still some limitations that need to be further addressed. Due to the lack of local EFS data in Hubei, this study used the recent experimental EFS through a literature review. The emission factors of crop residue open burning are greatly affected by physical and chemical properties, so the selection of emission factors will bring certain uncertainties to the emissions inventory estimated in this study; moreover, the OBP in this study was annually updated by VIIRS active fire data, both the accuracy of OBP in the base year and that of satellite product will affect the estimated OBP; these parameters may introduce some uncertainty into the emission inventory. Therefore, in the future, more accurate parameters can be obtained through field trials in the study area to improve the reliability of the inventory. In this study, the activity data and emission factors of the study area were collected through literature review, and the proportion of open straw burning was adjusted by VIIRS fire point data. Based on the above data, the emission inventory is constructed by using statistical methods, which have certain generalizability.

Author Contributions

Conceptualization, R.L. and X.H.; methodology, R.L. and X.H.; software, H.W.; validation, Y.W., M.Z., X.M. and F.Z.; formal analysis, L.C.; investigation, R.L.; resources, H.W.; data curation, Y.W.; writing—original draft preparation, R.L.; writing—review and editing, H.W.; visualization, R.L.; supervision, H.W.; project administration, X.H.; funding acquisition, R.L. All authors have read and agreed to the published version of the manuscript.

Funding

This research was funded by the National Natural Science Foundation of China (Grant NO. 42171354) and State Key Laboratory of Atmospheric Boundary Layer Physics and Atmospheric Chemistry (Grant NO. LAPC-KF-2022-07).

Data Availability Statement

Data used in this research are freely available online and upon request.

Acknowledgments

The authors are grateful for the support offered by the National Natural Science Foundation of China and State Key Laboratory of Atmospheric Boundary Layer Physics and Atmospheric Chemistry.

Conflicts of Interest

The authors declare no conflict of interest.

References

  1. Zhou, Y.; Xing, X.; Lang, J.; Chen, D.; Cheng, S.; Wei, L.; Wei, X.; Liu, C. A comprehensive biomass burning emission inventory with high spatial and temporal resolution in China. Atmos. Chem. Phys. 2017, 17, 2839–2864. [Google Scholar] [CrossRef] [Green Version]
  2. Xu, Y.; Huang, Z.; Jia, G.; Fan, M.; Cheng, L.; Chen, L.; Shao, M.; Zheng, J. Regional discrepancies in spatiotemporal variations and driving forces of open crop residue burning emissions in China. Sci. Total Environ. 2019, 671, 536–547. [Google Scholar] [CrossRef] [PubMed]
  3. Zhang, X.; Lu, Y.; Wang, Q.; Qian, X. A high-resolution inventory of air pollutant emissions from crop residue burning in China. Atmos. Chem. Phys. Discuss. 2018, 1, 1–13. [Google Scholar] [CrossRef]
  4. Chen, J.; Li, C.; Ristovski, Z.; Milic, A.; Gu, Y.; Islam, M.S.; Wang, S.; Hao, J.; Zhang, H.; He, C.; et al. A review of biomass burning: Emissions and impacts on air quality, health and climate in China. Sci. Total Environ. 2017, 579, 1000–1034. [Google Scholar] [CrossRef] [PubMed] [Green Version]
  5. Li, C.; Hu, Y.; Zhang, F.; Chen, J.; Ma, Z.; Ye, X.; Yang, X.; Wang, L.; Tang, X.; Zhang, R.; et al. Multi-pollutant emissions from the burning of major agricultural residues in China and the related health-economic effects. Atmos. Chem. Phys. 2017, 17, 4957–4988. [Google Scholar] [CrossRef] [Green Version]
  6. Wu, J.; Kong, S.; Wu, F.; Cheng, Y.; Zheng, S.; Yan, Q.; Zheng, H.; Yang, G.; Zheng, M.; Liu, D.; et al. Estimating the open biomass burning emissions in central and eastern China from 2003 to 2015 based on satellite observation. Atmos. Chem. Physics. 2018, 18, 11623–11646. [Google Scholar] [CrossRef] [Green Version]
  7. Yang, Y.; Liu, X.; Qu, Y.; An, J.L.; Jiang, R.; Zhang, Y.; Sun, Y.; Wu, Z.; Zhang, F.; Xu, W.; et al. Characteristics and formation mechanism of continuous hazes in China: A case study during the autumn of 2014 in the North China Plain. Atmos. Chem. Phys. 2015, 15, 8165–8178. [Google Scholar] [CrossRef] [Green Version]
  8. Zhang, L.; Liu, Y.; Hao, L. Contributions of open crop straw burning emissions to PM2.5 concentrations in China. Environ. Res. Lett. 2016, 11, 014014. [Google Scholar] [CrossRef]
  9. Yin, S.; Wang, X.; Xiao, Y.; Tani, H.; Zhong, G.; Sun, Z. Study on spatial distribution of crop residue burning and PM2.5 change in China. Environ. Pollut. 2017, 220, 204–221. [Google Scholar] [CrossRef]
  10. Qiu, X.; Duan, L.; Chai, F.; Wang, S.; Yu, Q.; Wang, S. Deriving high-resolution emission inventory of open biomass burning in China based on satellite observations. Environ. Sci. Technol. 2016, 50, 11779–11786. [Google Scholar] [CrossRef]
  11. Liu, M.; Song, Y.; Yao, H.; Kang, Y.; Li, M.; Huang, X.; Hu, M. Estimating emissions from agricultural fires in the North China Plain based on MODIS fire radiative power. Atmos. Environ. 2015, 112, 326–334. [Google Scholar] [CrossRef]
  12. Yin, L.; Du, P.; Zhang, M.; Liu, M.; Xu, T.; Song, Y. Estimation of emissions from biomass burning in China (2003–2017) based on MODIS fire radiative energy data. Biogeosciences 2019, 16, 1629–1640. [Google Scholar] [CrossRef] [Green Version]
  13. Zhang, T.; de Jong, M.C.; Wooster, M.J.; Xu, W.; Wang, L. Trends in eastern China agricultural fire emissions derived from a combination of geostationary (Himawari) and polar (VIIRS) orbiter fire radiative power products. Atmos. Chem. Phys. 2020, 20, 10687–10705. [Google Scholar] [CrossRef]
  14. Chen, J.; Li, R.; Tao, M.; Wang, L.; Lin, C.; Wang, J.; Wang, L.; Wang, W.; Chen, L. Overview of the performance of satellite fire products in China: Uncertainties and challenges. Atmos. Environ. 2022, 268, 118838. [Google Scholar] [CrossRef]
  15. Fu, Y.; Gao, H.; Liao, H.; Tian, X. Spatiotemporal Variations and Uncertainty in Crop Residue Burning Emissions over North China Plain: Implication for Atmospheric CO2 Simulation. Remote Sens. 2021, 13, 3880. [Google Scholar] [CrossRef]
  16. Li, J.; Li, Y.; Bo, Y.; Xie, S. High-resolution historical emission inventories of crop residue burning in fields in China for the period 1990–2013. Atmos. Environ. 2016, 138, 152–161. [Google Scholar] [CrossRef]
  17. Gao, R.; Jiang, W.; Gao, W.; Sun, S. Emission inventory of crop residue open burning and its high-resolution spatial distribution in 2014 for Shandong province, China. Atmos. Pollut. Res. 2017, 8, 545–554. [Google Scholar] [CrossRef]
  18. Zhou, Y.; Zhang, Y.; Zhao, B.; Lang, J.; Xia, X.; Chen, D.; Cheng, S. Estimating air pollutant emissions from crop residue open burning through a calculation of open burning proportion based on satellite-derived fire radiative energy. Environ. Pollut. 2021, 286, 117477. [Google Scholar] [CrossRef]
  19. Li, J.; Song, Y.; Li, M.; Huang, X. Estimating Air Pollutants Emissions from Open Burning of Crop Residues in Jianghan Plain. Acta Sci. Nat. Univ. Pekin. 2015, 51, 647–656. (In Chinese) [Google Scholar]
  20. Gong, S.; Guo, Y.; Ye, Q.; Lan, Y.; Wang, W.; Xiao, N. Estimation of carbon emission from burning of agricultural crop straw in hubei province. Hubei Agric. Sci. 2020, 59, 4. (In Chinese) [Google Scholar]
  21. Peng, L.; Zhang, Q.; He, K. Emissions inventory of atmospheric pollutants from open burning of crop residues in china based on a national questionnaire. Res. Environ. Sci. 2016, 29, 1109–1118. (In Chinese) [Google Scholar]
  22. Zeng, J.; Cui, K.; Huang, J.; He, F.; Peng, S. Responses of Physio-Biochemical Properties to N-Fertilizer Application and Its Relationship with Nitrogen Use Efficiency in Rice. Acta Agron. Sin. 2007, 33, 1168–1176. (In Chinese) [Google Scholar]
  23. Wang, X.; Xue, S.; Xie, G. Value-taking for residue factor as a parameter to assess the field residue of field crops. J. China Agric. Univ. 2012, 17, 1–8. (In Chinese) [Google Scholar]
  24. Zou, J.; Lu, J.; Liao, Z.; Gong, X.; Wang, H.; Zhou, Y.; Zhou, H. Study on Response of Rapeseed to Boron Application and Critical Level of Soil Available B in Hubei Province. Sci. Agric. Sin. 2008, 41, 752–759. (In Chinese) [Google Scholar]
  25. Zhang, H.; Ye, X.; Cheng, T.; Chen, J.; Yang, X.; Wang, L.; Zhang, R. A laboratory study of agricultural crop residue combustion in China: Emission factors and emission inventory. Atmos. Environ. 2008, 42, 8432–8441. [Google Scholar] [CrossRef]
  26. Wang, S.; Zhang, C. Spatial and temporal distribution of air pollutant emissions from open burning of crop residues in China. China Sci. 2008, 5, 329–333. (In Chinese) [Google Scholar]
  27. Cao, G.; Zhang, X.; Gong, S.; Zheng, F. Investigation on emission factors of particulate matter and gaseous pollutants from crop residue burning. J. Environ. Sci. 2008, 20, 50–55. [Google Scholar] [CrossRef]
  28. Tang, X.; Huang, C.; Lou, S.; Qiao, L.; Wang, H.; Zhou, M.; Chen, M.; Chen, C.; Wang, Q.; Li, G.; et al. Emission factors and PM chemical composition study of biomass burning in the Yangtze River Delta region. Environ. Sci. 2014, 35, 1623–1632. (In Chinese) [Google Scholar]
  29. EPD: Guide for Compiling Atmospheric Pollutant Emission Inventory for Biomass Burning, Environmental Protection Department. 2014. Available online: https://www.mee.gov.cn/gkml/hbb/bgg/201501/t20150107_293955.htm (accessed on 26 June 2022). (In Chinese)
  30. Li, X.; Wang, S.; Duan, L.; Hao, J.; Li, C.; Chen, Y.; Yang, L. Particulate and trace gas emissions from open burning of wheat straw and corn stover in China. Environ. Sci. Technol. 2007, 41, 6052–6058. [Google Scholar] [CrossRef]
  31. Akagi, S.K.; Yokelson, R.J.; Wiedinmyer, C.; Alvarado, M.J.; Reid, J.S.; Karl, T.; Crounse, J.D.; Wennberg, P.O. Emission factors for open and domestic biomass burning for use in atmospheric models. Atmos. Chem. Phys. 2011, 11, 4039–4072. [Google Scholar] [CrossRef] [Green Version]
  32. He, M.; Wang, X.; Han, L.; Feng, X.; Mao, X. Emission Inventory of Crop Residues Field Burning and Its Temporal and Spatial Distribution in Sichuan Province. Environ. Sci. 2015, 36, 1208–1216. (In Chinese) [Google Scholar]
  33. Tian, H.; Zhao, D.; Wang, Y. Emission inventories of atmospheric pollutants discharged from biomass burning in China. Acta Sci. Circumstantiae 2011, 31, 349–357. (In Chinese) [Google Scholar]
  34. Wang, L.; Li, X.; Xu, Y. The Economic Losses Caused By Crop Residues Burnt in Open Field in China. J. Arid Land Resour. Environ. 2008, 2, 170–175. (In Chinese) [Google Scholar]
  35. Li, J.; Bo, Y.; Xie, S. Estimating emissions from crop residue open burning in China based on statistics and MODIS fire products. J. Environ. Sci. 2016, 44, 158–170. [Google Scholar] [CrossRef]
  36. Li, F.; Wang, J. Estimation of carbon emission from burning and carbon sequestration from biochar producing using crop straw in China. Trans. Chin. Soc. Agric. Eng. 2013, 29, 1–7. (In Chinese) [Google Scholar]
  37. Cao, G.; Zhang, X.; Wang, D.; Zhen, F. Inventory of emissions of pollutants from open burning crop residue. J. Agro-Environ. Sci. 2005, 24, 800–804. (In Chinese) [Google Scholar]
  38. Streets, D.G.; Yarber, K.F.; Woo, J.H.; Carmichael, G.R. Biomass burning in Asia: Annual and seasonal estimates and atmospheric emissions. Glob. Biogeochem. Cycles 2003, 17, 1099. [Google Scholar] [CrossRef] [Green Version]
  39. Zhao, Y.; Nielsen, C.P.; Lei, Y.; McElroy, M.B.; Hao, J. Quantifying the uncertainties of a bottom-up emission inventory of anthropogenic atmospheric pollutants in China. Atmos. Chem. Phys. 2011, 11, 2295–2308. [Google Scholar] [CrossRef] [Green Version]
  40. Cao, G.; Zhang, X.; Wang, Y.; Zheng, F. Estimation of emissions from field burning of crop straw in China. Chin. Sci. Bull. 2008, 53, 784–790. [Google Scholar] [CrossRef]
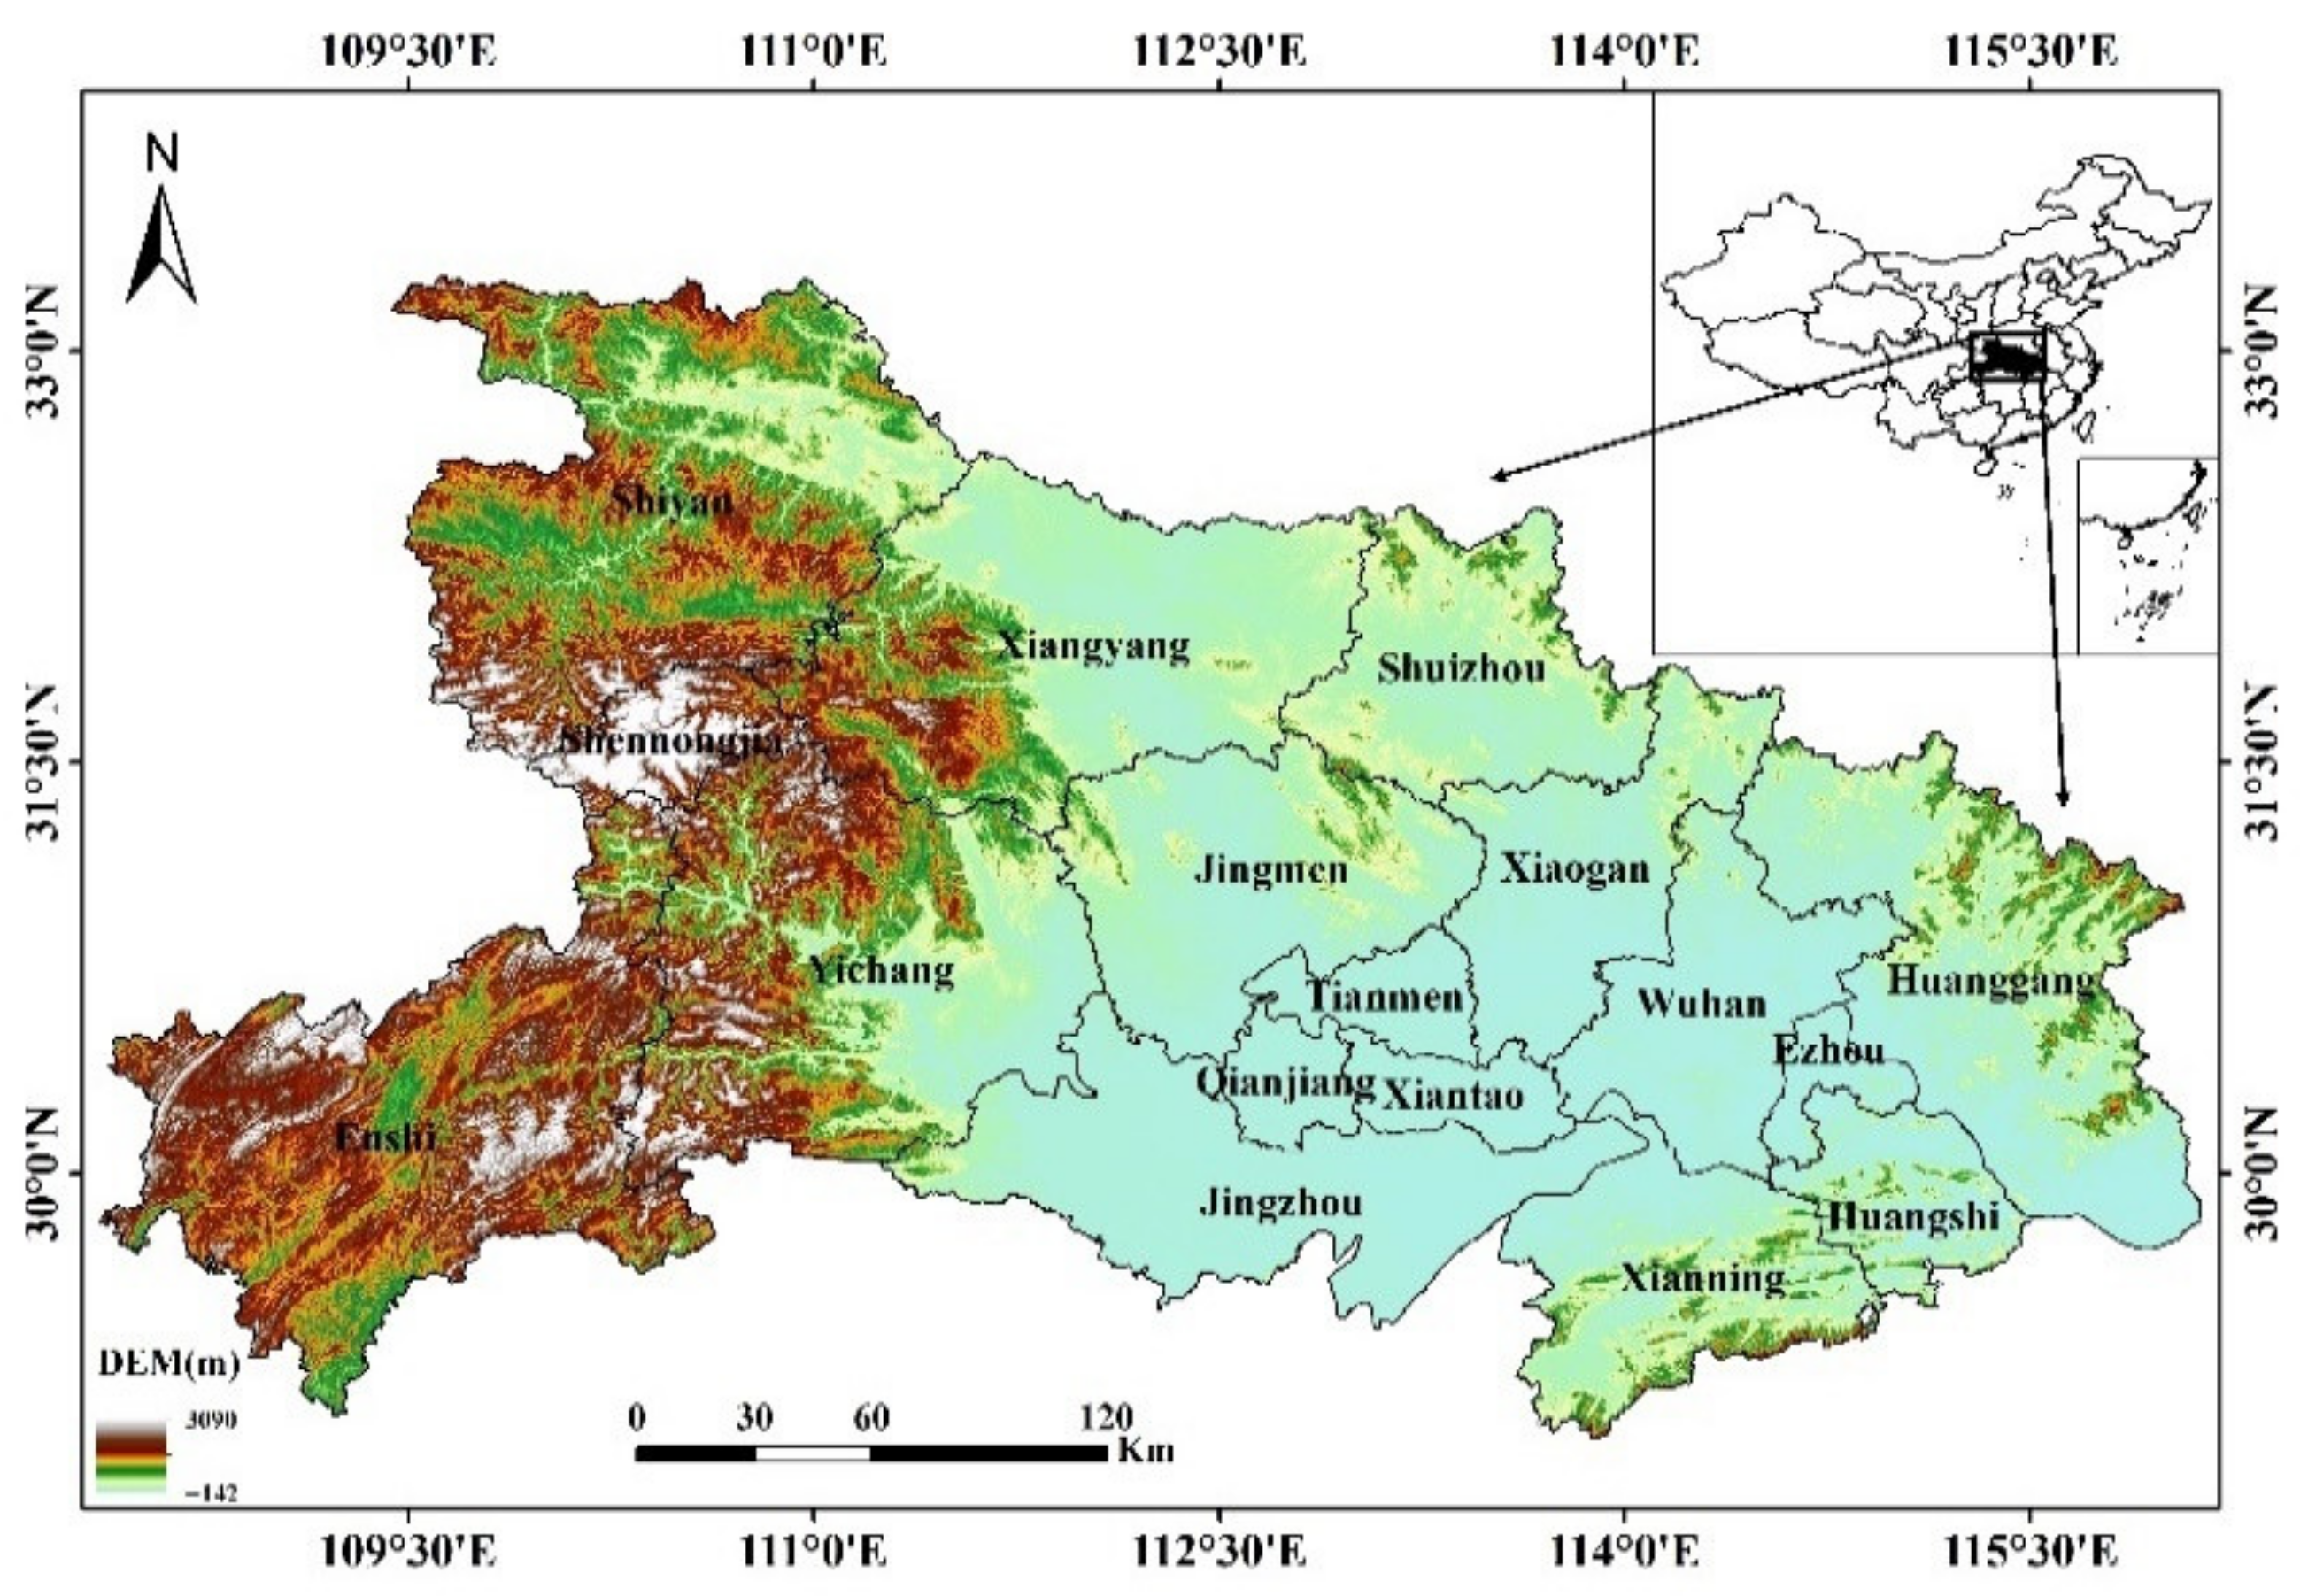
Figure 1. Distribution of elevation and geographical location in Hubei Province.
Remotesensing 14 03682 g001
Figure 2. Emission contributions by different crop residues in Hubei from 2012 to 2020.
Remotesensing 14 03682 g002
Figure 3. Yearly emissions emitted from crop residue open burning from 2012 to 2020.
Remotesensing 14 03682 g003
Figure 4. (a) The spatial distribution of crop fire points in Hubei from 2012 to 2020; (b) The spatial distribution of cultivated land in Hubei in 2020.
Remotesensing 14 03682 g004
Figure 5. The spatial distribution of CO2 emissions in Hubei from 2012 to 2020.
Remotesensing 14 03682 g005
Figure 6. The monthly trend of the number of fire points and CO2 emissions in Hubei from 2012 to 2020.
Remotesensing 14 03682 g006
Figure 7. Comparison with the results of Gong et al. [20].
Remotesensing 14 03682 g007
Figure 8. Comparison of PM2.5 emissions with AOD during the straw burning season (a) and non-straw burning season (b) during 2012–2020.
Remotesensing 14 03682 g008
Figure 9. Comparisons of emission uncertainties from different studies.
Remotesensing 14 03682 g009
Table 1. The characteristics of previous studies.
ReferenceYearRegionMethodCharacteristics
Qiu et al. [10]2013ChinaBAThe MODIS burned area product MCD64Al combined with the active fire product MCD14 ML were applied to develop a high-resolution emission inventory of open biomass burning; however, due to the coarse spatial resolution of MODIS, the small size agricultural fires were often missed.
Wu et al. [6]2003–2015Central and
Eastern China
BA
Liu et al. [11]2003–2014North China PlainFRPEmissions from crop burning in fields in the North China Plain were estimated using MODIS FRP derived from the Terra and Aqua satellites; however, many small agricultural fires may be undetected by MODIS sensors with the resolution of 1 km; moreover, the FRP retrieved by polar-orbiting satellites can only capture the agricultural fires in cloudless skies at the time of overpass.
Yin et al. [12]2003–2017ChinaFRPEmissions inventories from biomass open burning were constructed using MODIS FRP data. Emissions from crop burning in fields may be underestimated.
Zhang et al. [13]2012–2015Eastern ChinaFRPThis study developed an agricultural burning emissions inventory by combining FRP observation from the VIIRS and Himawari-8 sensors. Although the FRP of agricultural small fires in this study was greatly increased, the total emissions were 2–5 times lower than the emissions estimated by statistical methods.
Fu et al. [15]2003–2019North China PlainThree methods (Statistical-based method, BA-based method and FRP-based method)This study investigated the crop residue burning emissions using three methods, and found that the statistical-based method is necessary for estimating local emissions.
Li et al. [16]1990–2013ChinaStatisticalMore accurate time-varying statistical data and locally observed emission factors were utilized to estimate crop residue open burning emissions at the provincial level.
Gao et al. [17]2014ShandongStatisticalAn emission inventory of crop residue open burning was established in Shandong Province based on emission factors and activity data for a single year.
Li et al. [19]2010Jianghan PlainStatisticalOBP is obtained through a household investigation with small survey samples, which may be not reliable enough.
Gong et al. [20]2009–2017HubeiStatisticalThe fixed OBP used in the model will introduce large uncertainty.
Table 4. Emission factors for crop residue open burning (g/kg).
PollutantRiceWheatCornRapeseed
BC0.64 h0.49 d0.35 d0.23 b
OC2.01 a3.46 a2.25 a1.08 b
SO20.53 c0.85 d0.44 d0.53 c
NOX1.42 b1.19 b1.28 g1.12 b
CO27.7 b60 d53 d34.3 b
CO2791.3 g1557.9 g1261.5 g1445 i
PM2.56.26 e7.6 d11.7 d6.26 e
PM105.78 c7.73 c11.95 c6.93 c
NH30.53 c0.37 d0.68 d0.53 c
CH43.5 i3.4 d4.4 d3.5 i
NMVOC6.05 f7.5 f10 f8.64 f
References: a Cao et al. [27]. b Tang et al. [28]. c EPD [29]. d Li et al. [30]. e Akagi et al. [31]. f He et al. [32]. g Zhang et al. [25]. h Tian et al. [33]. i Wang et al. [26].
Table 5. Emission inventory of crop residue open burning in Hubei during 2012–2020 (Gg).
CityBCOCSO2NOXCOCO2PM2.5PM10NH3CH4NMVOC
Wuhan1.435.221.493.6489.582775.2818.2517.871.459.7119.04
Huangshi0.762.840.832.0050.131590.1010.059.910.805.3710.71
Shiyan0.975.261.362.79103.112881.3518.2318.541.168.2818.06
Yichang1.657.512.084.83150.684513.5429.3429.732.0714.0630.09
Xiangyang6.2434.448.5715.67602.3916,046.3894.9794.905.7344.1192.32
Ezhou0.421.500.451.0926.41862.305.315.240.432.915.78
Jingmen3.6615.394.309.44269.788124.0049.4849.023.6625.6051.73
Xiaogan2.9711.583.207.26189.855660.4235.8234.842.7519.0736.94
Jingzhou5.7122.066.4514.80386.2112,188.3774.0073.135.8039.7079.45
Huanggang3.9414.244.2110.09244.867840.3849.0548.153.9826.7652.68
Xianning1.314.631.333.3278.502447.9416.4416.021.338.8117.12
Shuizhou1.948.492.204.59137.183802.0223.8223.161.6712.1123.56
Enshi0.994.711.173.08100.032771.4321.3621.621.439.4020.32
Xiantao1.074.221.252.8777.292461.4714.8514.821.157.8516.04
Qianjiang0.773.250.942.0458.571825.2110.6210.610.805.5811.44
Tianmen1.004.311.212.5775.242275.3013.3413.240.986.9614.11
Shennongjia0.010.050.010.031.1729.420.240.240.010.090.21
Total34.84149.7241.0690.112640.9778,094.91485.17481.0535.21246.38499.59
Table 7. Parameters used in the calculation of uncertainty.
ParameterDistributionCoefficients of Variation
RiceWheatCornRapeseed
Activity dataCrop productionnormal5%
Grain-to-straw ratio10%
Combustion efficiency4.82%5.00%5.31%5.82%
Open burning proportion30%
EFSBC12.97%1.01%6.67%33.33%
OC24.24%14.78%25.29%5.00%
SO269.53%3.03%4.76%35.90%
NOX34.51%48.76%36.53%5.00%
CO30.16%5.25%20.82%2.53%
CO232.39%4.84%3.49%1.23%
PM2.528.24%0.13%5.88%34.32%
PM1030.32%16.84%10.85%18.77%
NH320.30%14.94%1.45%5.00%
CH49.86%21.00%1.12%6.85%
NMVOC0.41%1.96%1.96%4.74%
Publisher’s Note: MDPI stays neutral with regard to jurisdictional claims in published maps and institutional affiliations.