Article

Retrieval of Aged Biomass-Burning Aerosol Properties by Using GRASP Code in Synergy with Polarized Micro-Pulse Lidar and Sun/Sky Photometer

by
María-Ángeles López-Cayuela
1,2,
Milagros E. Herrera
3,
Carmen Córdoba-Jabonero
1,*,
Daniel Pérez-Ramírez
2,4,
Clara Violeta Carvajal-Pérez
1,
Oleg Dubovik
5 and
Juan Luis Guerrero-Rascado
2,4
1
Atmospheric Research and Instrumentation Branch, Instituto Nacional de Técnica Aeroespacial (INTA), Torrejón de Ardoz, 28850 Madrid, Spain
2
Applied Physics Department, University of Granada (UGR), 18071 Granada, Spain
3
GRASP-SAS, Villeneuve d’Ascq, 59655 Lille, France
4
Andalusian Institute for Earth System Research (IISTA-CEAMA), University of Granada (UGR), 18006 Granada, Spain
5
Laboratoire d’Optique Atmosphérique (LOA), UMR 8518 CNRS, University of Lille, 59000 Lille, France
*
Author to whom correspondence should be addressed.
Remote Sens. 2022, 14(15), 3619; https://doi.org/10.3390/rs14153619
Submission received: 27 May 2022 / Revised: 5 July 2022 / Accepted: 14 July 2022 / Published: 28 July 2022
(This article belongs to the Special Issue Selected Papers of the European Lidar Conference)

Abstract

:
The aim of this study was to analyze the potential of the GRASP code to retrieve optical and microphysical properties vertically-resolved using a synergy of polarized Micro-Pulse Lidar and Sun/sky photometer observations. The focus was on the long-range transport of Canadian aged-smoke plumes observed at El Arenosillo/Huelva (Spain) from 7 to 8 September 2017. Both the columnar and height-resolved microphysical and optical properties were assessed in comparison with AERONET data and vertical lidar-retrieved profiles, respectively. In particular, the vertical properties were also derived using the POLIPHON approach, which serves as a comparison for GRASP retrievals. The retrieved columnar aerosol microphysical properties (volume concentration and effective radius) showed an excellent agreement, with negligible differences, and were within the uncertainties. Nevertheless, for the retrieved columnar optical properties, we could only perform an individual comparison, due to the strong AERONET limitations, and although the agreements were generally good, no conclusions were obtained, due to differences in the real refractive index and due to the large uncertainties obtained in the retrievals. For the vertical profiles, however, we present a large advance that permits obtaining aerosol backscatter and extinction coefficients, plus volume concentrations, without the need for internal assumptions (extinction-to-backscatter ratios and depolarization measurements), due to the very good agreement observed between GRASP and the lidar-derived methodologies. However, the separation of the properties into their fine and coarse modes was not feasible using the one-wavelength elastic lidar measurements with the GRASP retrieval configuration used in this work. Therefore, current studies are being addressed to assessing the introduction of lidar depolarization in the GRASP code as an encouraged added-value, for the improvement of the retrieval of vertical aerosol properties.

Graphical Abstract

1. Introduction

The Generalized Retrieval of Atmosphere and Surface Properties code (GRASP; [1,2]) has proven to be a versatile open-source code, allowing for the combination of remote sensing measurements from different instrumentations, to provide aerosol optical and microphysical properties. The GRASP code uses the heritage of both AERONET (Aerosol Robotic NETwork; [3,4]) and POLDER (POLarization and Directionality of the Earth’s Reflectances; [5]) inversion schemes, and further GRASP developments incorporated the GARRLIC scheme (Generalized Aerosol Retrieval from Radiometer and Lidar scheme; [6]), which permits simultaneously retrieving columnar and vertically-resolved optical and microphysical properties, by combining direct and sky radiances from sun photometry with elastic backscattered signals from lidar systems. Currently, the GARRLiC approach implemented in GRASP uses multiwavelength lidar measurements (e.g., 355 nm, 532 nm, and 1064 nm), being thus able to distinguish between fine- and coarse-mode optical and microphysical properties, which has been widely used and validated, e.g., [7,8]. In spite of the intrinsic limitations in the GARRLiC approach, its versatility permits day-time retrievals, which are only possible with very advanced multiwavelength Raman and HSRL systems [9,10]. Moreover, GRASP’s capabilities have been recently expanded by combining sun photometry with either ceilometers [11] or one-wavelength lidar measurements [12,13,14]. This approach permits obtaining an aerosol’s vertical distribution and concentration, although without distinguishing between fine and coarse modes. Nevertheless, the large number of one-wavelength lidar systems, which are able to operate continuously and unattended, opens new possibilities for this new inversion approach. In particular, GRASP’s potential for this simpler GARRLiC approach has been proven to derive optical and microphysical mineral dust properties [12,13,14], by combining AERONET Sun/sky photometer and polarized elastic Micro-Pulse Lidar (P-MPL) measurements. However, the suitability of GRASP for deriving the properties of aged biomass-burning (BB) aerosols, using the same approach as that applied for dust particles [13], has not yet been studied.
Wildfires are a significant source of BB particles in the atmosphere (both black and organic carbon), annually contributing around 40–59% of the global particulate organic carbon and 60–85% of black carbon emissions [15,16]. The direct effect of aerosols (scattering plus absorption) on the Earth’s total radiative forcing is close to zero, owing to the opposite effects of the two main components, namely the black carbon that induces a warming effect (light absorption) and the organic carbon that generates a cooling effect (light scattering) [17]. However, the impact of BB in clouds (aerosol indirect effect) has large uncertainties, because BB aerosols can act as cloud or ice nuclei [18,19]. Some studies have shown that convective smoke plumes from large wildfires under certain meteorological conditions, such as those that produce dry thunderstorms [20], can develop strong pyrocumulonimbus towers [21]. Thus, large amounts of BB aerosols can be lifted into the upper troposphere and lower stratosphere [22,23]. At those altitudes, the typical wet and dry deposition processes for aerosols are less efficient. The particles can persist for a longer time in the atmosphere, being transported over much longer distances. This represents unusual atmospheric conditions, differing from those when BB aerosols are just injected into the lower troposphere. Therefore, studying BB particles at different altitudes in the atmosphere is essential to further enhance the understanding of BB impacts on climate. Vertically-resolved BB optical and microphysical property retrievals are required and will serve to advance our knowledge from the first studies of column-integrated properties using AERONET data [24].
Intense and extreme wildfires occurred in Canada in the summertime of 2017. In particular, the British Columbia area suffered one of its worst burning seasons on record, with a total of 1.2 million hectares burned and over 65,000 people evacuated by the end of the record-breaking fire season (British Columbia Government communication; https://www2.gov.bc.ca/gov/content/safety/wildfire-status/about-bcws/wildfire-history/wildfire-season-summary, accessed on 28 March 2022). The meteorological conditions during this summer favored the injection of smoke particles into the upper troposphere–lower stratosphere and their transport over long distances. Following westerly winds, these smoke particles were transported to eastern latitudes, being registered in the Arctic [25] and Europe [26,27,28,29,30,31,32]. Particularly, the long-range transport of Canadian BB aerosols was reported in Europe in August–September 2017 at altitudes from 3 to 17 km, and their optical properties were studied over short- [26,28] and long-term [27,29,30,31] periods. More specifically, ref. [32] focused on a 2-day study of the tropospheric BB impact over the Iberian Peninsula of those Canadian wildfires that occurred in the 2017 summertime, and a detailed description of that particular smoke plume transport can be found in that work. Briefly, the first plume was released from the north-western areas of the North American continent on 30 August 2017 and travelled slowly eastwards over the Atlantic. On 3 September 2017 a second plume, with higher particle concentrations, was uplifted from the same source region and started travelling again to the east. From 4 to 6 September 2017, it was carried away by the jet stream and travelled rapidly towards the east. Finally, on 7 September 2017 both plumes merged into one and affected the Iberian Peninsula from 7 to 8 September 2017. Therefore, an in-depth analysis of this long-range BB transport would serve to complement other studies that focused on fresh-BB episodes [33,34,35] and others that used one-channel Raman lidar with satellite measurements [36,37].
The objective of this work was to assess the GRASP’s suitability to derive optical and microphysical aerosol properties for long-range transported BB aerosols using sun photometer and polarized micro-pulse lidar (P-MPL) observations. Measurements were acquired at El Arenosillo/Huelva station (ARN/Huelva, southwestern of the Iberian Peninsula), where AERONET and P-MPL observations are routinely performed. Preliminary results were previously reported in [38]. In this particular work, 10 study cases of BB particles, as observed for the period 7–8 September 2017, were selected and extensively analyzed. The paper is organized as follows. Section 2 describes the experimental site, the instrumentation, and the methodology used. Section 3 contains the main results and a comparison between the GRASP retrievals and AERONET/lidar-derived optical and microphysical properties. Section 4 has a discussion. The main conclusions are given in Section 5.

2. Materials and Methods

2.1. Measurement Site and Instrumentation

Atmospheric observations were performed at El Arenosillo/Huelva station (ARN/Huelva, 37.1°N 6.7°W, 59 m a.s.l., South-Western Iberian Peninsula), which is managed by the Spanish Institute for Aerospace Technology (Instituto Nacional de Técnica Aeroespacial, INTA, Torrejón de Ardoz, Spain). This station is in a rural protected environment close to the Doñana National Park and situated less than 1 km away from the Atlantic coastline. ARN/Huelva is an atmospheric observatory devoted to aerosols, gases, and solar radiation research. The facilities include diverse remote sensing, in situ, and solar radiation instrumentation, and also the ARN/Huelva site belongs to both AERONET and MPLNET (Micro-Pulse Lidar NETwork) aerosol networks. The background aerosols detected at ARN/Huelva are mostly of marine and/or rural origin, but the area is also frequently affected by Saharan dust outbreaks [39]. Exceptionally, smoke aerosols can also be transported to this site [27,32].
A polarized micro-pulse lidar (P-MPL, v. 4B, Droplet Measurement Technologies, LLC, Longmont, CO, USA) is deployed at ARN/Huelva. The P-MPL system is an elastic one-wavelength lidar with a relatively high pulse repetition frequency (~2500 Hz), a low-energy (~6 μJ) Nd:YVO4 laser at 532 nm, and depolarization capabilities. The P-MPL operates in full-time continuous mode (24/7), performing measurements with 1-min integrating time and 15-m vertical resolution. A complete description of the data correction and calibration processing can be found in [40,41,42,43,44]. In particular, the overlap calibration for the P-MPL systems is crucial, as the full overlap height is reached at relatively high altitudes (around 4–5 km height), due to the very narrow telescope field of view [40]. However, retrieval of the aerosol optical properties is accurately achieved once the overlap is optimally determined, by applying the experimental procedure described in [44], based on the comparison of the P-MPL range-corrected signal (RCS) with that obtained from a lidar system reaching the full overlap height at very low altitudes. Thus, an optimal overlap function (with relative errors lower than 25% below the full overlap height) can be obtained for the correction of P-MPL measurements. These primary P-MPL data are the RCS and the volume linear depolarization ratio (δv). By using different retrieval algorithms and methods (see Section 2.2.2), the P-MPL system enables obtaining height-resolved aerosol optical and microphysical properties. In particular, the total particle backscatter coefficient (βp(z), Mm−1 sr−1) together with the total volume concentration (VC(z), μm3 cm−3) were analyzed (see Section 2.3).
The Sun/sky/lunar photometer (CE-318T, Cimel Electronique, Paris, France) situated at ARN/Huelva is used for acquiring both the direct sun and sky radiance measurements. It consists of a sensor head, fitted with a filter wheel with different interference spectral filters, and a temperature sensor for the temperature correction of the signal [45]. Specifically, the CE318T has 9 available spectral bands (340 nm, 380 nm, 440 nm, 500 nm, 675 nm, 870 nm, 937 nm, 1020 nm, and 1640 nm). The instrument operates within the AERONET network, and the data used are AERONET L2 V3 (cloud-screening and quality assured) [46].

2.2. Retrieval of Aerosol Properties

2.2.1. AERONET Products

In order to distinguish the BB study cases, two products (with their associated uncertainties, Δ) are used. That is, the Angstrom exponent (AE; Δ = ±10%, [47]) at the wavelength pair of 440 nm and 675 nm (AE440/675), as they are closer to the P-MPL 532-nm laser, being an indicator of the predominant particle size (i.e., AE >0.6 should indicate a predominance of fine BB aerosols); and the fine mode fraction at 500 nm (FMF500, i.e., the fine-to-total optical depth ratio), whose values near to 1 represent the presence of BB particles. In addition, the aerosol optical depth (AOD; Δ = ±0.01, [3]) at different wavelengths (440 nm, 500 nm, 675 nm, 870 nm, and 1020 nm) is used as input of the GRASP scheme (see Section 2.2.3).
Moreover, the following products (with their associated uncertainties for BB, Δ) are used in this comparative study: the column-integrated single scattering albedo (SSA; Δ = ±0.03, [48]), the complex (real and imaginary) refractive indices (RRI and IRI, respectively; Δ = ±0.04, 30–50%, respectively, [48]), the particle volume size distribution (VSD, μm3 μm−2; Δ = 25% for 0.1 μm < radius < 7 μm, and Δ = 25–100% otherwise, [48]), the total columnar volume concentration (VC, μm3 μm−2), and the total effective radius (Reff, μm).

2.2.2. Lidar-Based Algorithms

First computations of the vertically-resolved particle backscatter coefficients (βp) are obtained using the Klett–Fernald (KF) inversion algorithm [49,50] that requires the assumption of the particle extinction-to-backscatter ratio (lidar ratio, LR). The particle extinction coefficient (αp) is derived by multiplying βp and an effective LR (LReff), which is estimated by tuning the LR value in the expression:
τ = z LR   β p ( z )   Δ z ,
where τ is the vertically-integrated extinction coefficient ( = z α p ( z ) Δ z ), and Δz is the vertical resolution of the lidar profiles, by minimizing the difference between τ (LReff) and the AERONET AOD500 (a convergence threshold of 1% is used in this study). Optimal βp profiles are also obtained, corresponding to those calculated with the previously estimated LReff value.
Once the βp profiles are determined, the total particle volume concentration (VC) profiles are derived by applying the POLIPHON (POlarization LIdar PHOtometer Networking, ref. [51] and references therein) methodology. POLIPHON uses lidar depolarization measurements to separate the optical properties of the individual particle components of aerosol mixtures, taking into account the specific particle linear depolarization ratio (δp) for each of those components. In this work, βp profiles are separated into their biomass-burning (βBB) and non-BB (βNB) components, as described in [40], using the typical δp for Canadian BB, i.e., δpBB = 0.15 [32,41]. The corresponding extinction coefficients (αBB and αNB) are obtained by multiplying βBB and βNB by the typical LR for each component (e.g., values of 70 and 50 sr are assumed for BB and NB components, respectively [52]). Finally, the total VC(z) profiles are obtained, as described in [13,53], i.e.,
VC ( z ) = i f v i   α i ( z ) ,
where αi (z) are the extinction profiles for the i-component (i = BB, and NB), and fvi are the specific volume-to-extinction conversion factors. In particular, fv values of 0.13·10−12 Mm and 0.34·10−12 Mm are used in this work for BB and NB components, respectively. They correspond to the statistical AERONET-derived BB and NB values reported for Canadian boreal forest fires [54].

2.2.3. GRASP Retrieval

This work uses the GARRLiC approach that is implemented in GRASP, with the particular configuration of using only one-wavelength lidar measurements (see details in [11]). It is worth highlighting that the application of this retrieval scheme is able to obtain, besides column-integrated aerosol optical and microphysical profiles, height-resolved properties. However, separation into particle components of different aerosol mixtures is not possible using this configuration with a one-single wavelength lidar system such as the P-MPL.
Briefly, this GRASP configuration uses two types of inputs, the AERONET V3 L2.0 [4,46] AOD and the Sun/sky-photometer sky radiance measurements (almucantar sequence) at 440 nm, 675 nm, 870 nm, and 1020 nm at specific measurement times, and the successive P-MPL 1-min RCS profiles averaged over a ±15-min window of the sun-photometer measurements. P-MPL RCS are centered on the almucantar-recorded time and are normalized and discretely distributed in the GRASP height levels (60 bins).
In order to ensure that the input data are suitable for deriving robust aerosol retrievals, some quality criteria are applied [11]. In addition, P-MPL cloud-contaminated observations are discarded in advance. Thus, a minimum of 15 cloud-free 1-min RCS profiles are required for averaging, to increase the signal-to-noise ratio. A detailed description of this GRASP retrieval scheme can be found in [11], and its application to P-MPL measurements in [13]. The input and output (both columnar and height-resolved) variables used in this work are listed in Table 1. Details of the output calculations can be found in [2,55]. In this work, the errors provided by GRASP for the various retrieved parameters are also illustrated (more details can be found in [2,55]).
Finally, GRASP retrieval provides the aerosol columnar properties and the normalized aerosol vertical profile concentration, AVP(z), which is applied to derive both the βp(z) and VC(z) profiles, as follows:
β p ( z ) = AOD   AVP ( z ) LR ,
VC ( z ) = VC   AVP ( z ) ,
where the columnar AOD, LR, and total volume concentration (VC) are also retrieved by GRASP.

2.3. GRASP Evaluation: A Comparative Analysis

The AERONET Level 2.0 Version 3 data inversion products are used for comparison with GRASP column-integrated retrievals. Particularly, comparisons are performed for the volume size distributions (VSD), effective radius (Reff), total volume concentrations (VC), and optical properties such as the spectral single scattering albedo (SSA) and real (RRI) and imaginary (IRI) refractive indexes. In addition, the GRASP-retrieved height-resolved total βp(z) and total VC(z) profiles are compared with those obtained from the lidar-derived methodologies previously described (Section 2.2).
To evaluate the discrepancies in the retrieved parameters between the different methodologies, the following statistical proxies are used [13]:
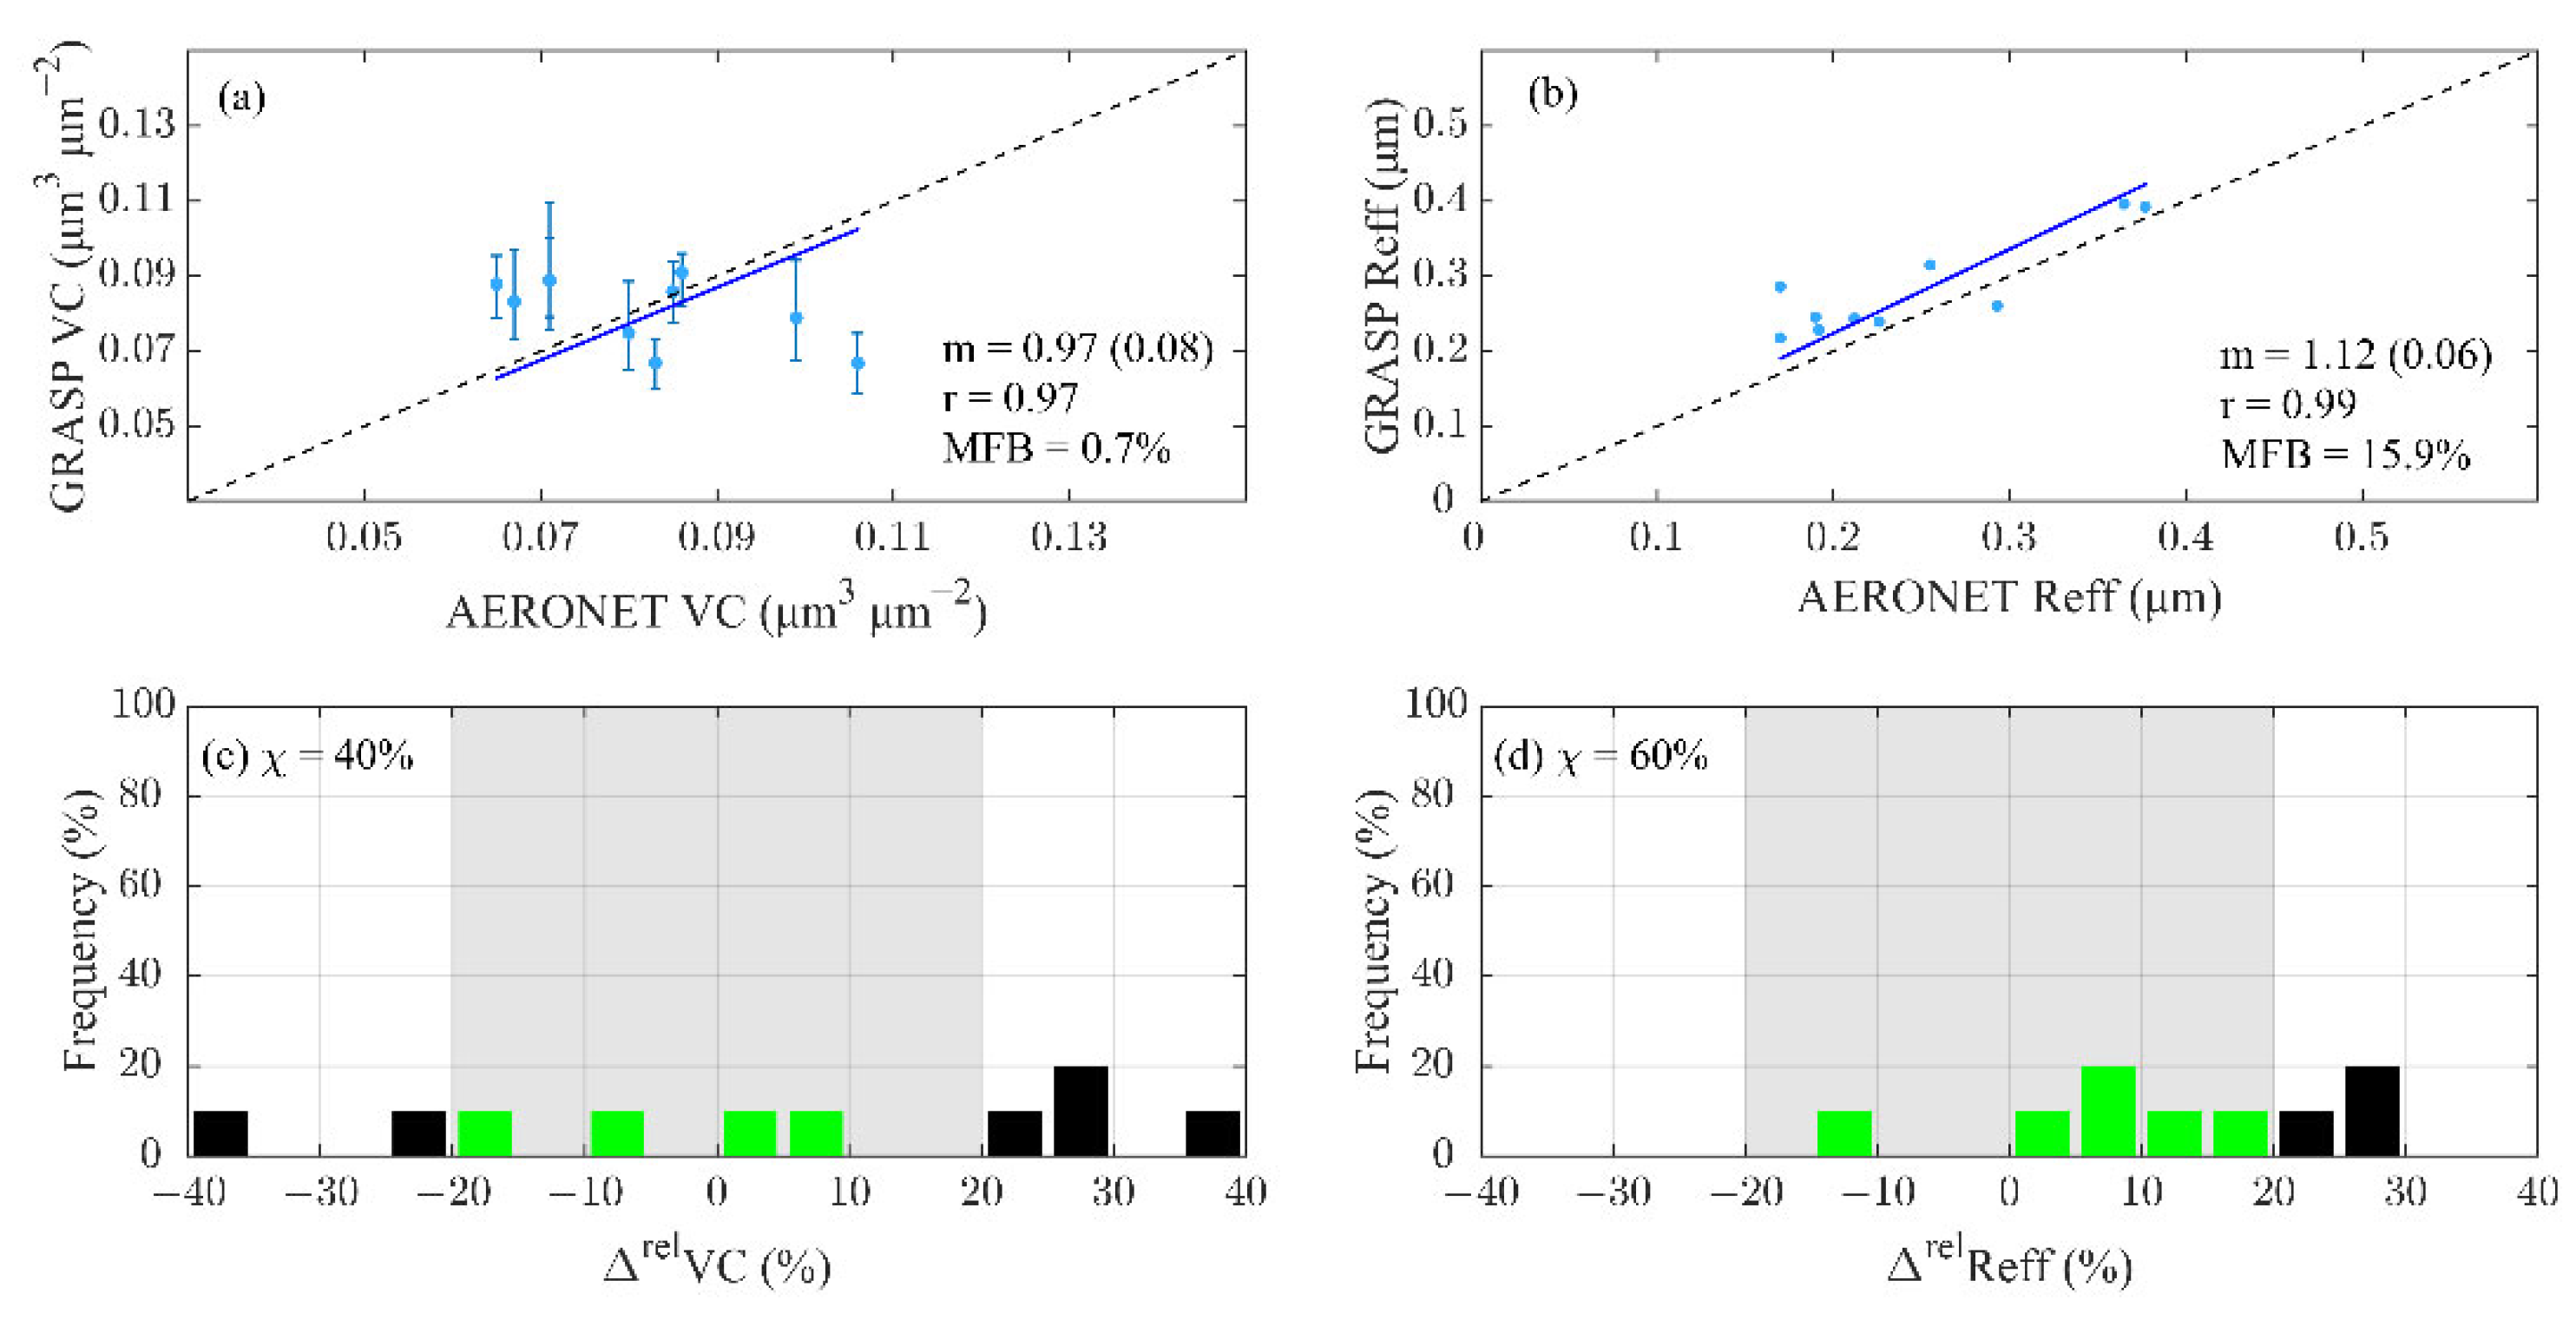
  • A linear regression analysis between GRASP and AERONET/lidar-based results (constraining to zero the intersection value). Both the slope (m) and the correlation coefficient (r) are obtained, not only as a measure of the similarities between GRASP and AERONET models but also as a quantification of the model’s capability to reproduce the shape of the aerosol profiling.
  • The mean fractional bias (MFB) for quantifying a possible under- or overestimation of the GRASP-derived products:
    MFB = 1 N i = 1 N 2 Y G i Y M i Y G i + Y M i ,
    where i represents the case study and Y is the variable to be compared (i.e., Y = Reff, VC, VSD, βp(z), VC(z)), G represents the GRASP-retrieved variable, M denotes AERONET or lidar-derived variable, and N is either the number of total cases (N = 10) for columnar properties or the number of total height bins (N = 60) for the vertical profiles.
  • The total occurrence (χ) of either BB cases (for the GRASP/AERONET comparison) or the height-resolved level (for the GRASP/lidar comparison) fulfils an acceptable confidence value (±20%) of the relative differences (ΔrelY, in %):
    Δ rel Y = 100 Y G Y M Y M ,
Typically, a high confidence level is accepted when the following conditions are satisfied simultaneously: m is within the 0.80–1.20 interval, r > 0.60, MFB < |±60%| for acceptable (|±30%|, optimal) performance and χ > 40%. Moreover, a moderate confidence level is accepted when 3 out of the 4 proxies are achieved fulfilling the above requirements.

2.4. Ancillary Information

The aerosol-type product from the S-NPP/VIIRS (Suomi-National Polar-Orbiting Partnership Visible Infrared Imaging Radiometer Suite; https://viirsland.gsfc.nasa.gov, accessed on 15 March 2022) “Deep Blue” plus the TERRA/MODIS (Moderate Resolution Imaging Spectroradiometer; https://modis.gsfc.nasa.gov, accessed on 15 March 2022) corrected reflectance images are used to obtain an overview of the BB transport through the WorldView tool from NASA’s Earth Observing System Data and Information System (EOSDIS, https://worldview.earthdata.nasa.gov, accessed on 15 March 2022).
Moreover, the NOAA Air Research Laboratory’s HYSPLIT model ([56]; Hybrid Single-Particle Lagrangian Integrated Trajectory model version 4; https://ready.arl.noaa.gov/HYSPLIT.php (accessed on 8 November 2021)) is used to determine backward-trajectories in the experimental site. The GDAS database (Global Data Assimilation System; spatial resolution of 1° × 1° every 3 h; ftp://www.arl.noaa.gov/puv/archives/gdas1 (accessed on 8 November 2021)) is used as inputs in HYSPLIT. On the one hand, backward trajectories are computed for 240 h flight-time and for altitudes of 2500 m, 4000 m, and 8000 m, which are representative of the upper troposphere–lower stratosphere. On the other hand, in order to determine the possible uncertainty of those individual trajectories, a trajectory ensemble is calculated, by offsetting the meteorological data by a fixed grid factor. In particular, in this work, one meteorological grid point in the horizontal and 0.01 sigma units in the vertical are the offset used. This results in 27 trajectories for all-possible offsets. When all the trajectories follow a similar path, any trajectory represents the mean flow with high confidence.

3. Results

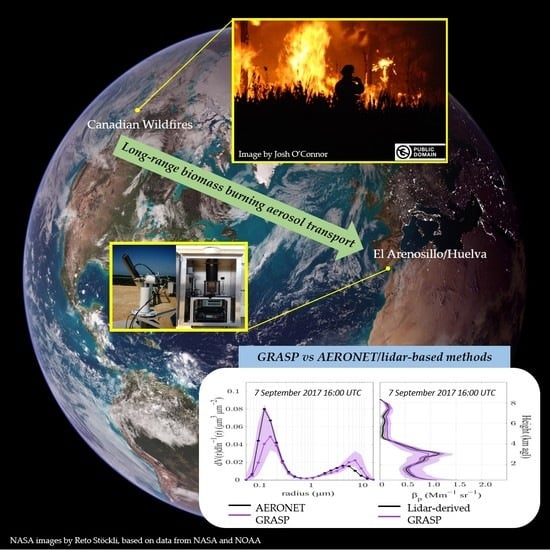
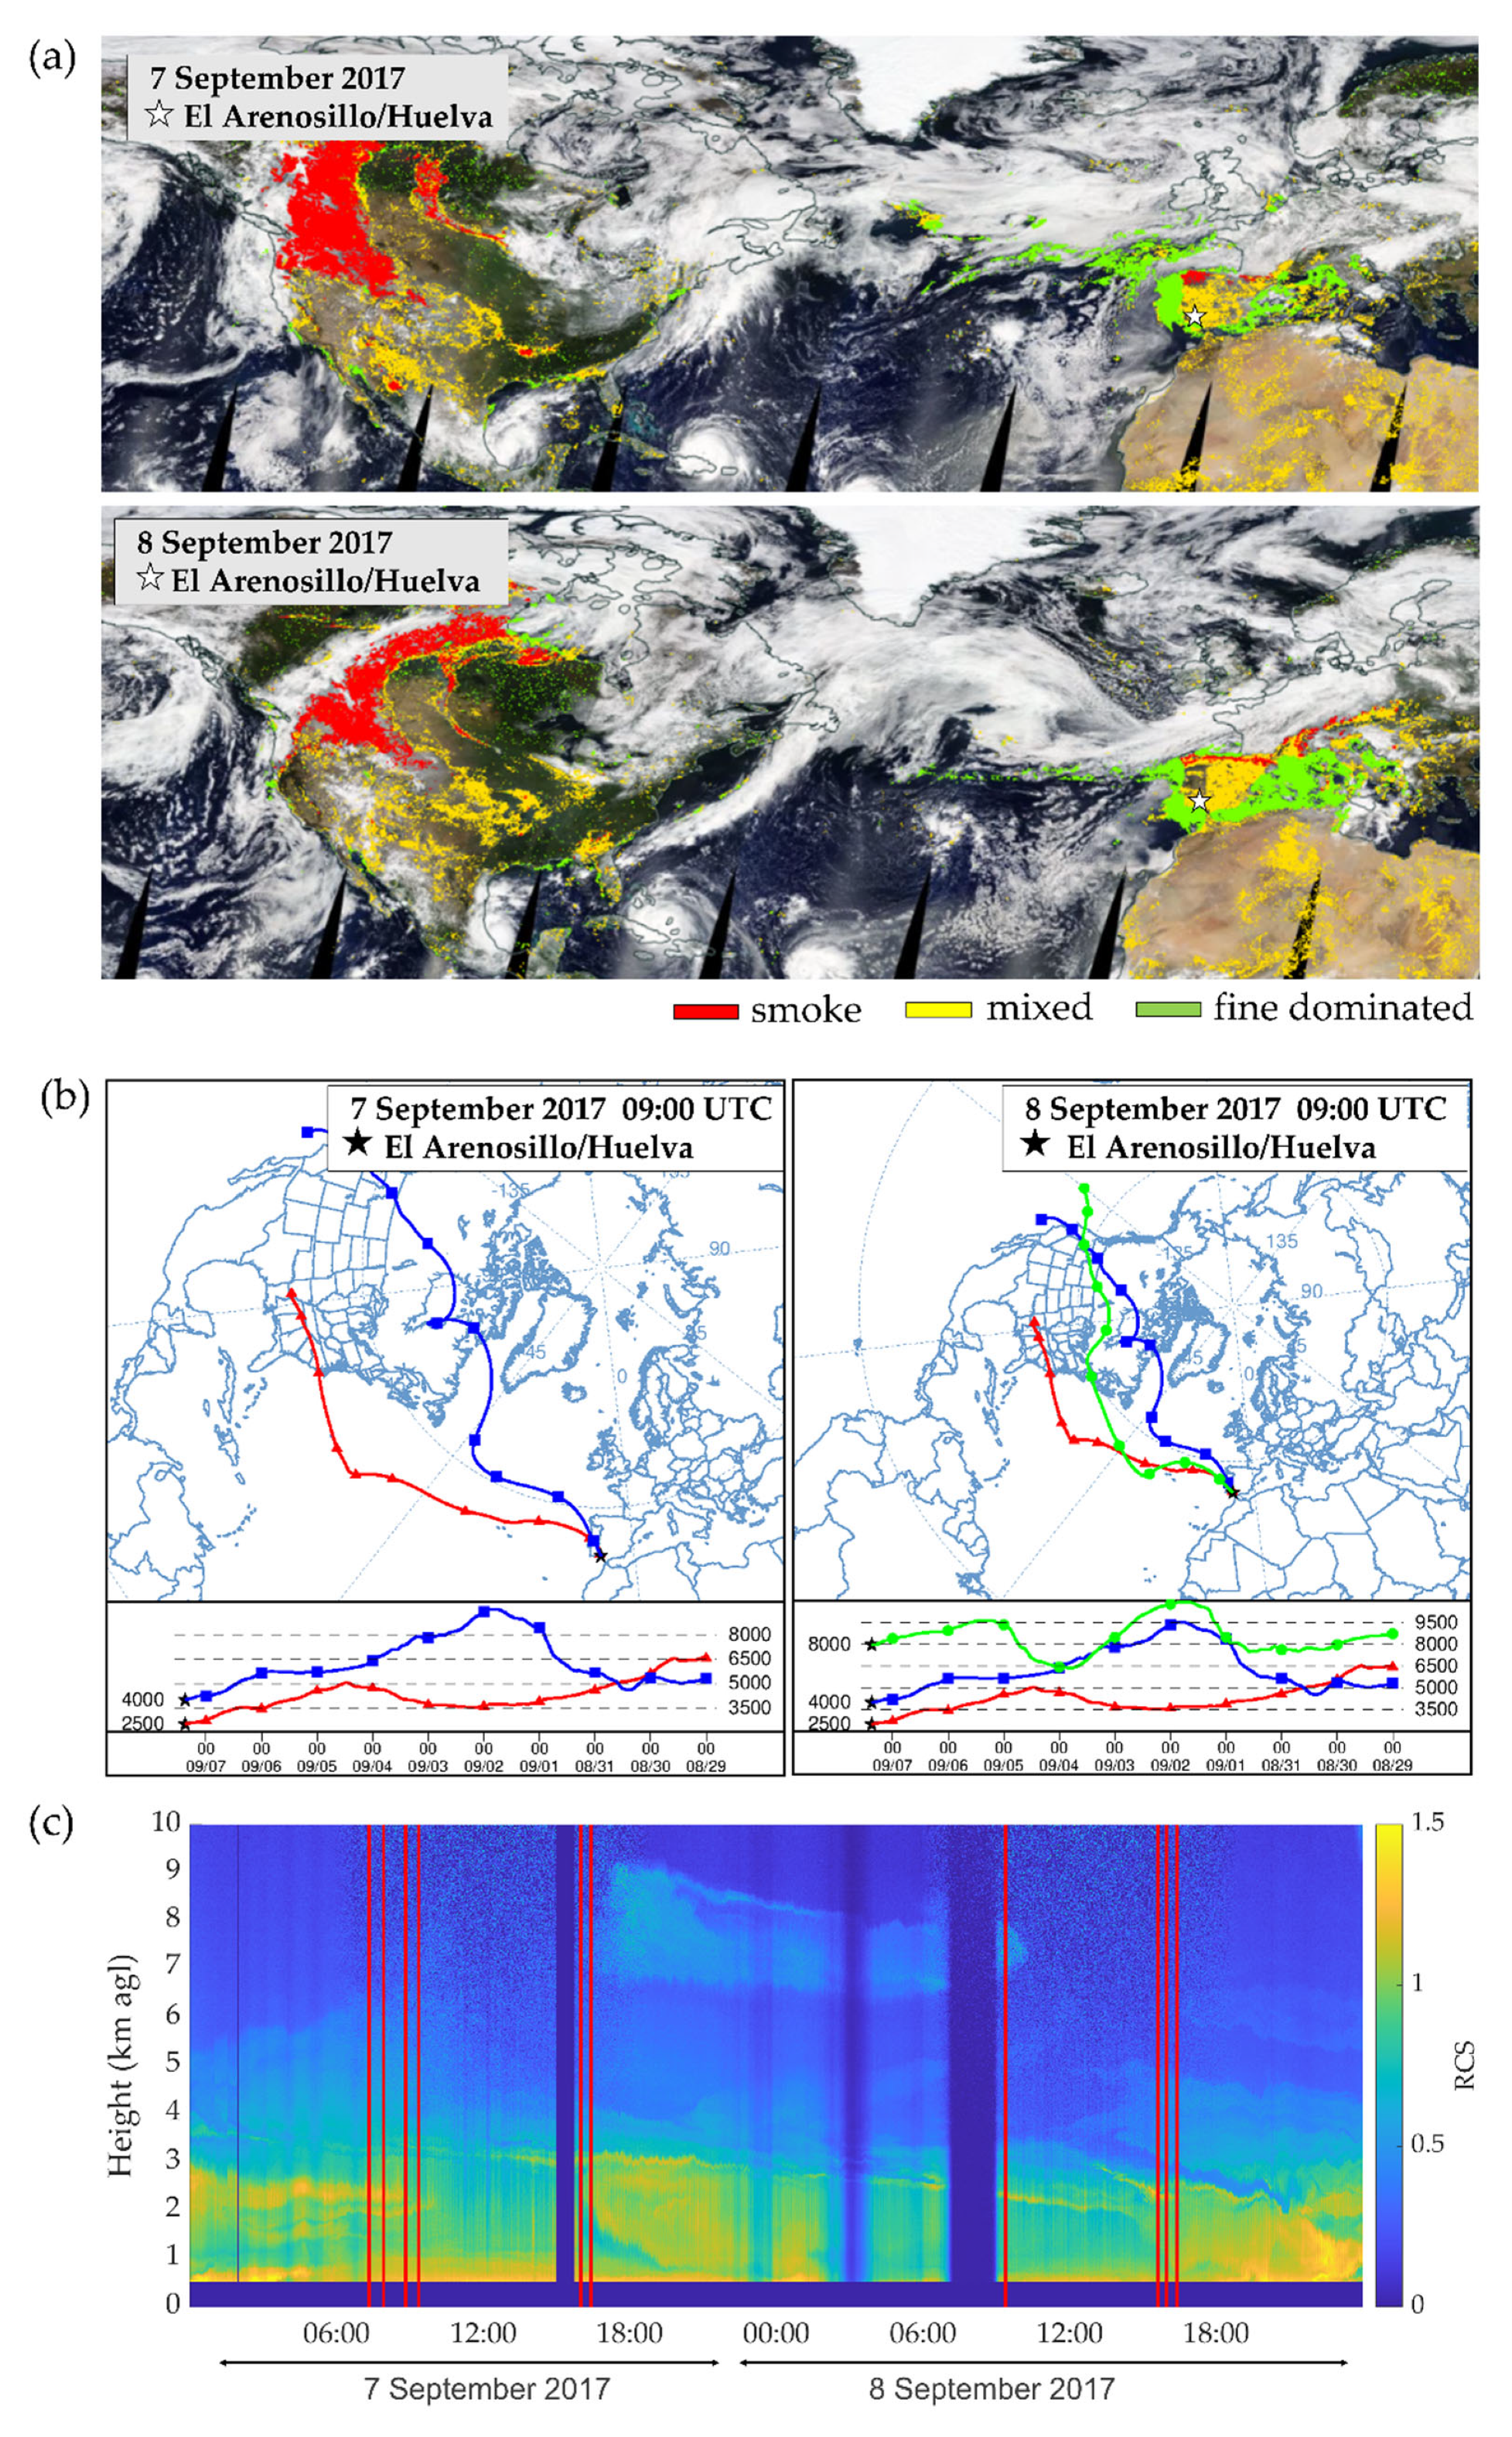
3.1. Selection of the Biomass-Burning Cases

Figure 1a shows the aerosol typing based on the Suomi NPP/VIIRS satellite imagery for the 7–8 September 2017. Smoke particles were identified over the north-western United States and Canada, while the images show the presence of mixed particle types on the ARN site (marked as a black star in Figure 1a). Large portions over the North Atlantic Ocean are cloud-covered, and the algorithms were not able to identify an aerosol type.
Figure 1b shows the 10-day backward trajectories analysis at ARN (marked by a white star) for those two days for the air masses arriving at 2500 m, 4000 m, and 8000 m a.g.l. Backward trajectories clearly showed air masses coming from the West with an origin in North America. An ensemble trajectory analysis (images not shown) revealed a high confidence for these results.
Finally, Figure 1c shows P-MPL RCS at 532 nm in the ARN site from 7 September 2017 at 00:00 UTC to 9 September 2017 at 00:00 UTC. This figure clearly shows aerosol structures above the atmospheric boundary layer, at altitudes that vary between 2 km and 8 km height, depending on the time. These aerosol layerings can be associated with long-range aerosol transport and potentially identified as BB aerosols from North America because of the backward trajectories’ patterns. Moreover, more lofted aerosol structures are observed on 7 September 2017 after midday and until early in the night, when aerosol entrainment is observed in the atmospheric boundary layer.
As sky radiances are needed to run GRASP, only 10 BB cases fulfilling the high-quality approach were found, which are marked in red in Figure 1c (see Section 2.2.2). For those specific cases, the mean AERONET values of AOD500, AE440/675, and FMF500 are shown in Table 2. The 2-day BB event showed a medium aerosol load, with AOD500 ranging from 0.26 to 0.40, being a mean value of 0.29 ± 0.04. A high predominance of fine-mode particles was observed for time-period, although they were slightly larger on 7 September 2017 after midday, when more BB layers were observed in the vertical. In particular, this was confirmed by the AE and FMF values reported, i.e., AE440/675 (FMF500) ranged from 1.76 (0.92) at the beginning of the BB event to 1.67 (0.98) at the end of the episode, showing averaged values of 1.68 ± 0.07 (0.95 ± 0.02). Indeed, these results agree with the predominance of small-sized particles, which is typical of biomass-burning aerosols [57].

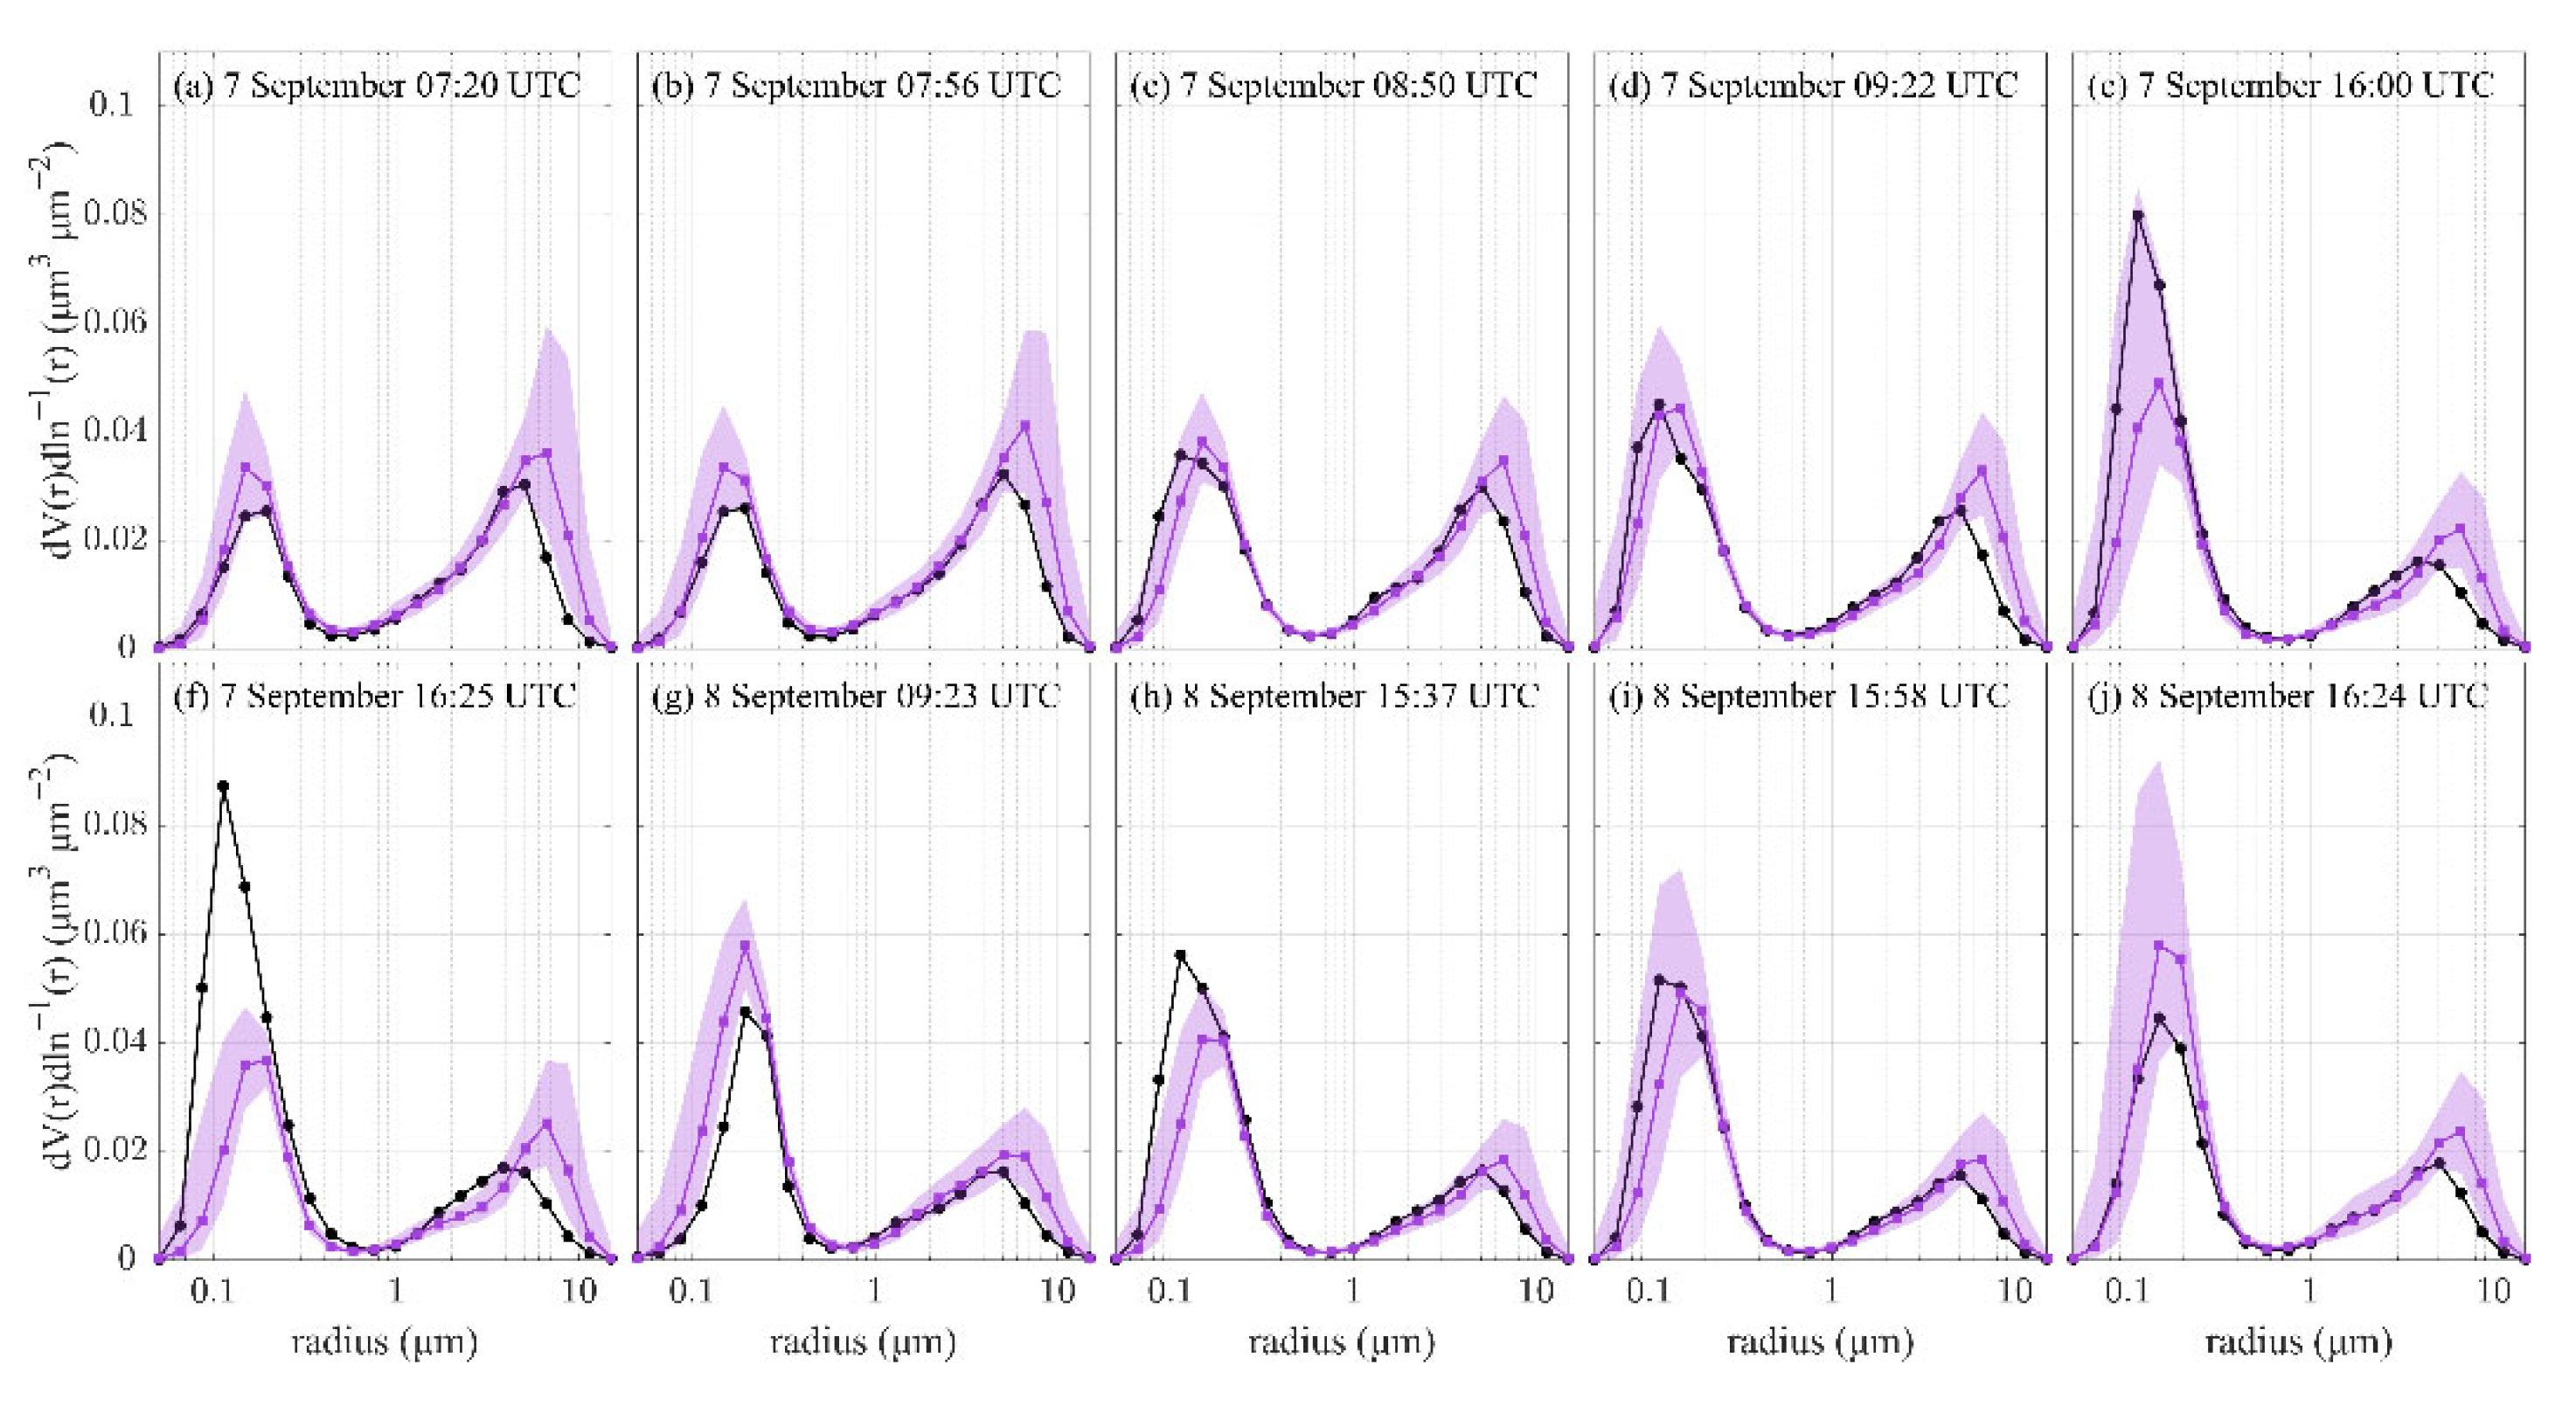
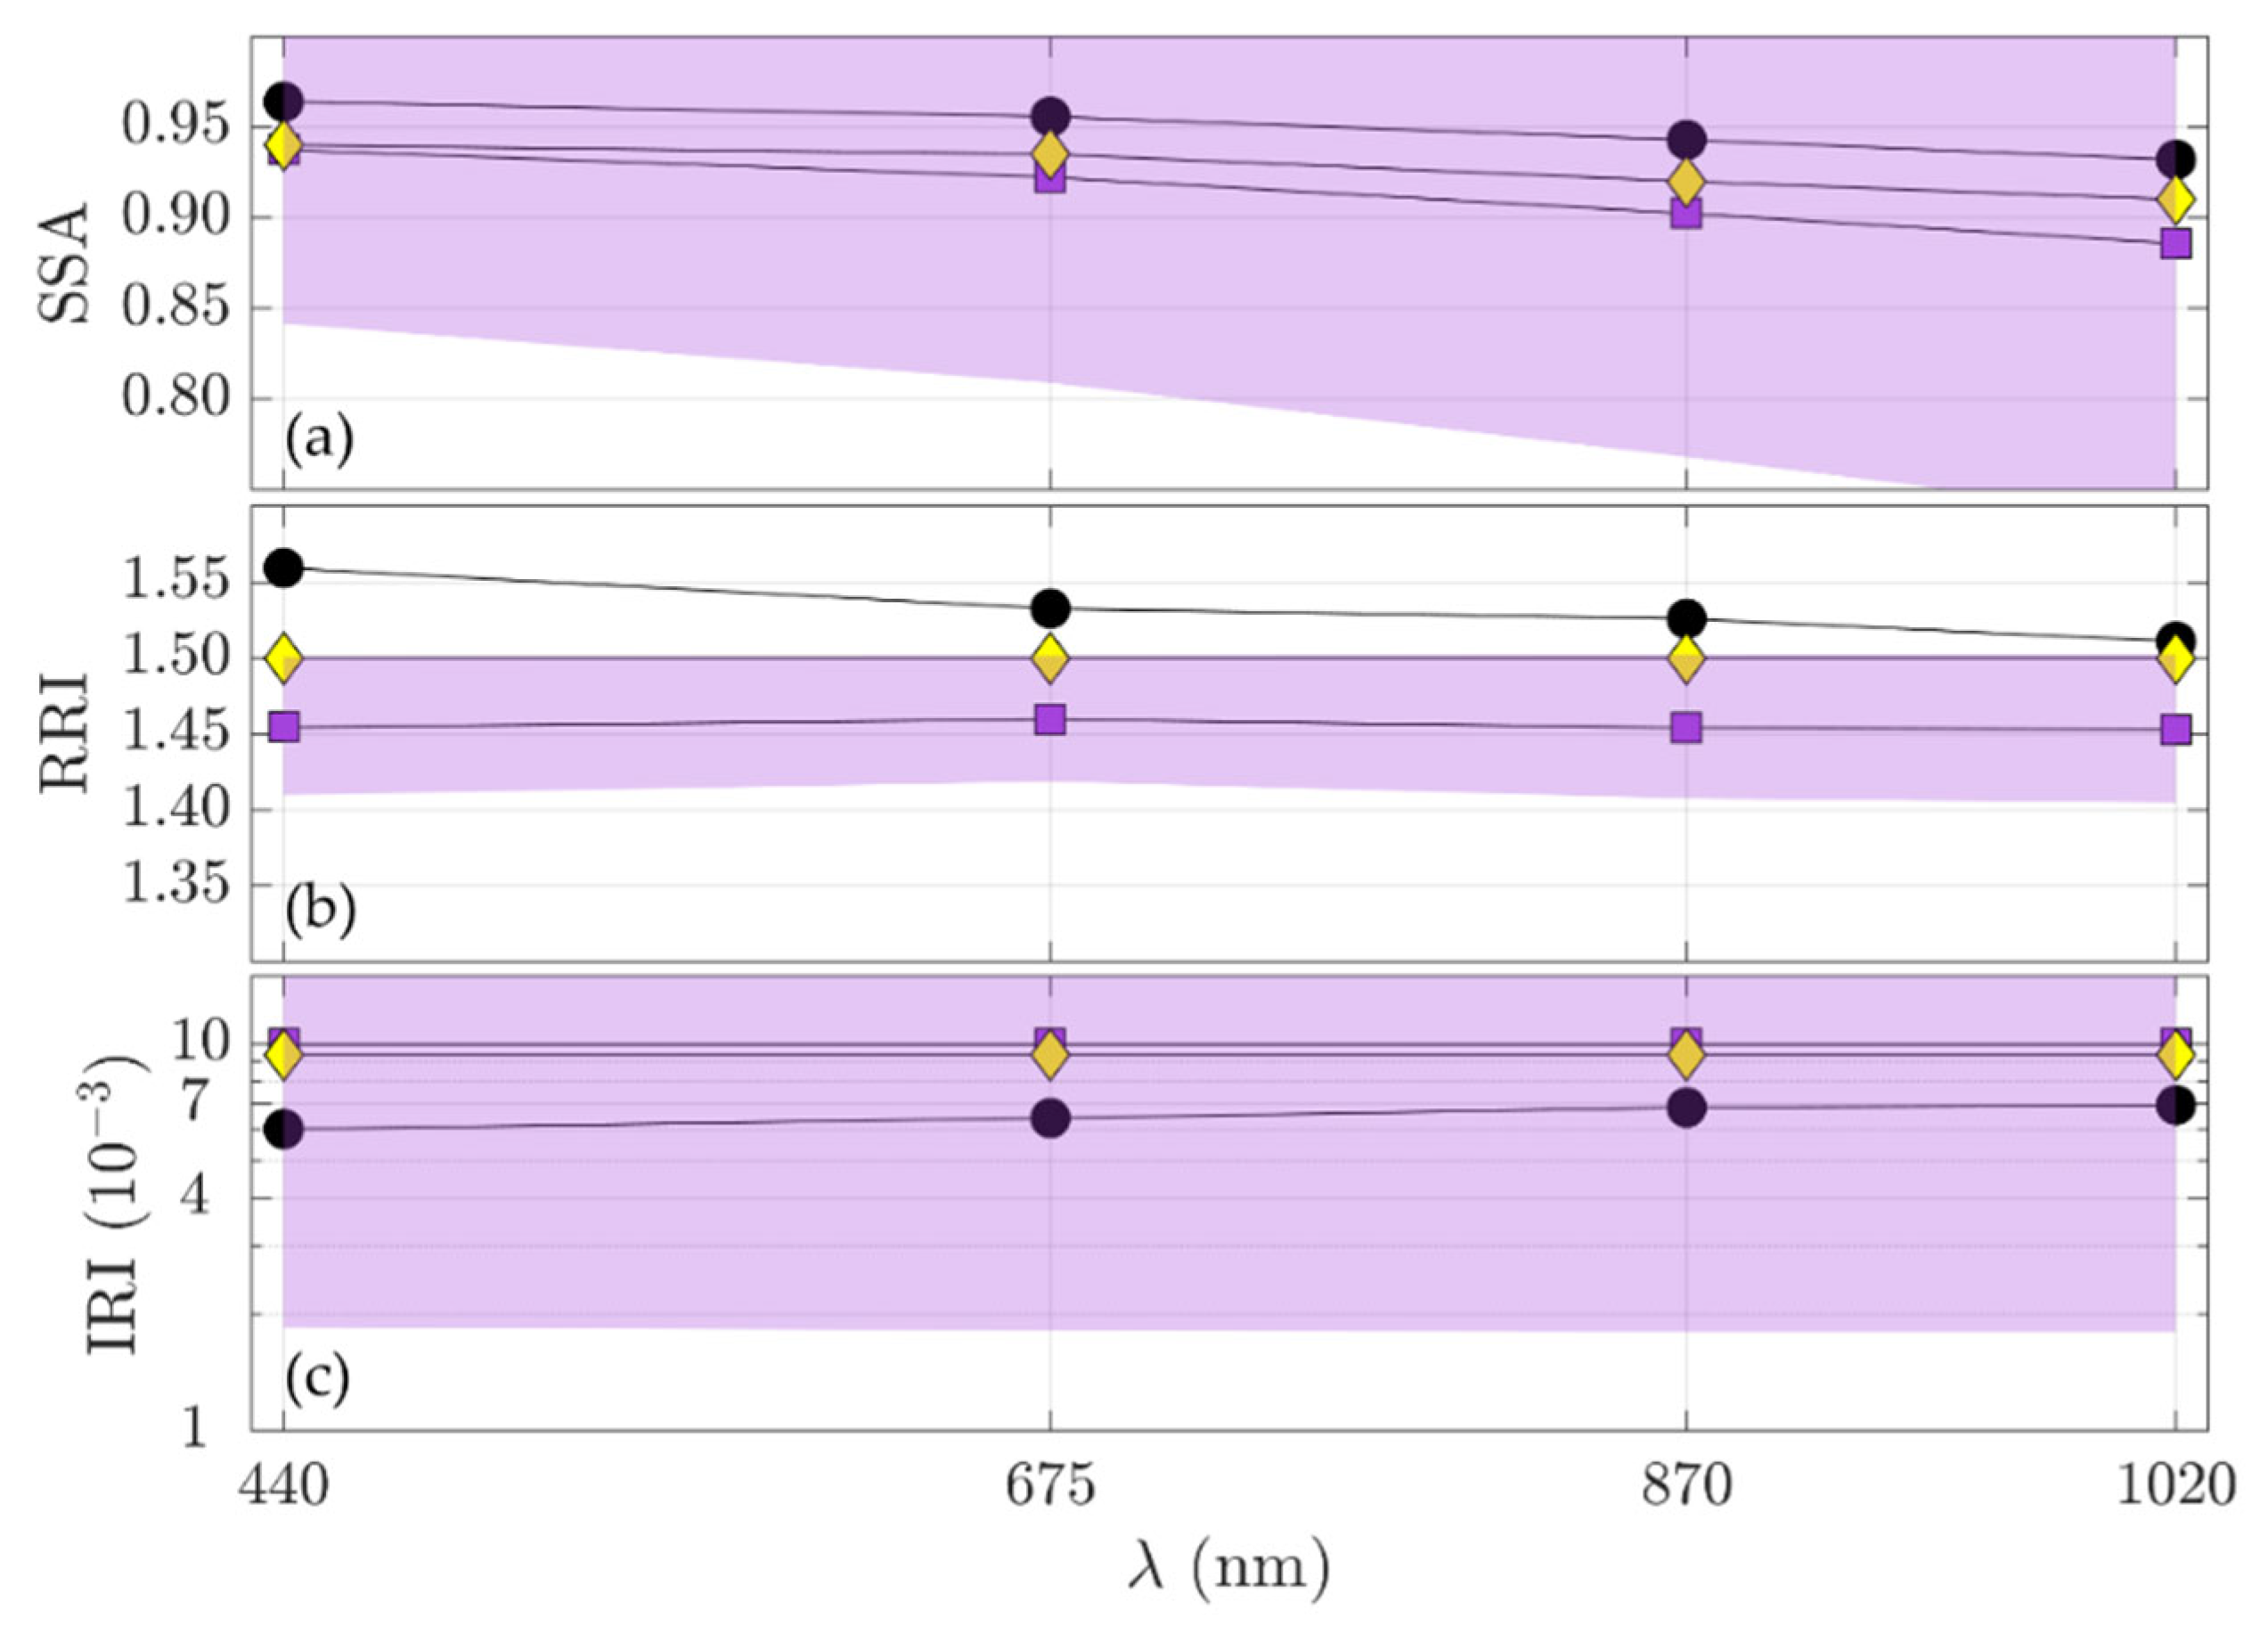
3.2. Columnar Optical and Microphysical Properties

Figure 2 shows the VC and Reff retrieved by GRASP versus those derived by AERONET for the selected BB cases. The dashed line corresponds to the 1:1 line, while the blue line is the linear fit, with the main parameters of this fit included in the graph (slope (m) and the correlation coefficient (r), together with the MFB as estimated by Equation (6)). Additionally, the frequency analysis of the relative differences (Δrel, %) is shown in the bottom panels, including χ values (Figure 2c,d).
Figure 2 reveals the very good correlation (r ~ 1) between GRASP and AERONET retrievals for both parameters. For VC, the linear slope is very close to 1, and the MFB is close to zero. However, the occurrence χ of the BB cases with Δrel values within ±20% (good level of confidence) is 40%. The GRASP-derived Reff values are slightly higher than the AERONET ones (linear slope of 1.12 ± 0.06), MFB is within the optimal range of the confidence interval (±30%), and Δrel is χ = 60%. It should be highlighted that for the Δrel values within ±30%, χ increases up to 80% and 100%, respectively, for VC and Reff.
Figure 3 shows the VSD derived by both GRASP and AERONET. The main results of the statistical proxies for VSDs can be found in Table 3. Particularly, for the coarse (fine) mode, 80% (30%), 100% (100%), 100% (90%), and 90% (40%) out of the 10 BB cases fulfilled the conditions for m, r, MFB, and χ, respectively. Regarding the total VSD, 40%, 100%, 100%, and 80% out of 10 BB cases fulfilled the above conditions.
Unfortunately, a comparative analysis such as that performed for the VSDs could not be applied to the columnar optical variables (i.e., SSA, RRI, IRI), since only one case (8 September 2017 at 09:23 UTC; Table 2) is available from AERONET Level 2.0 Version 3 data with AOD440 ≥ 0.40, which is a mandatory condition for a good-quality AERONET retrieval. Figure 4 shows the spectral SSA, RRI, and IRI obtained from GRASP and AERONET for this BB case. For comparison, the climatological values as reported in [57] of those variables for BB aerosols are also shown in Figure 4.
Figure 4a shows that GRASP provided lower values than AERONET, but the differences were within 0.02, which is the uncertainty claimed for the use of SSA in climate studies. In addition, the GRASP uncertainties increased with wavelength (from ~10% at 355 nm to ~20% at 1064 nm). The relative differences (Δrel) for SSA also increased as the wavelength increased, from −2.8% (440 nm) to −5.0% (1020 nm); this result agrees with the spectral dependence of the uncertainties. Regarding the typical SSA values observed for BB, the Δrel for SSA ranged from −0.3% (440 nm) to −2.7% (1020 nm).
GRASP retrievals also showed lower values (~1.45) than AERONET (from 1.55 to 1.50) for RRI, with the differences being outside of the uncertainties range (Figure 4b). The Δrel for RRI were smaller compared to AERONET, ranging from −6.7% (440 nm) to −3.4% (1020 nm), whereas those values were around −3.0% with respect to statistical RRI values. The GRASP and statistical values were almost constant at all wavelengths.
Finally, both GRASP and AERONET showed very similar values for IRI, with a negligible spectral dependence. By looking at the statistical parameters, Δrel IRI was around 6.0% and ranged from 65.9% (440 nm) to 43.8% (1020 nm) compared to AERONET.

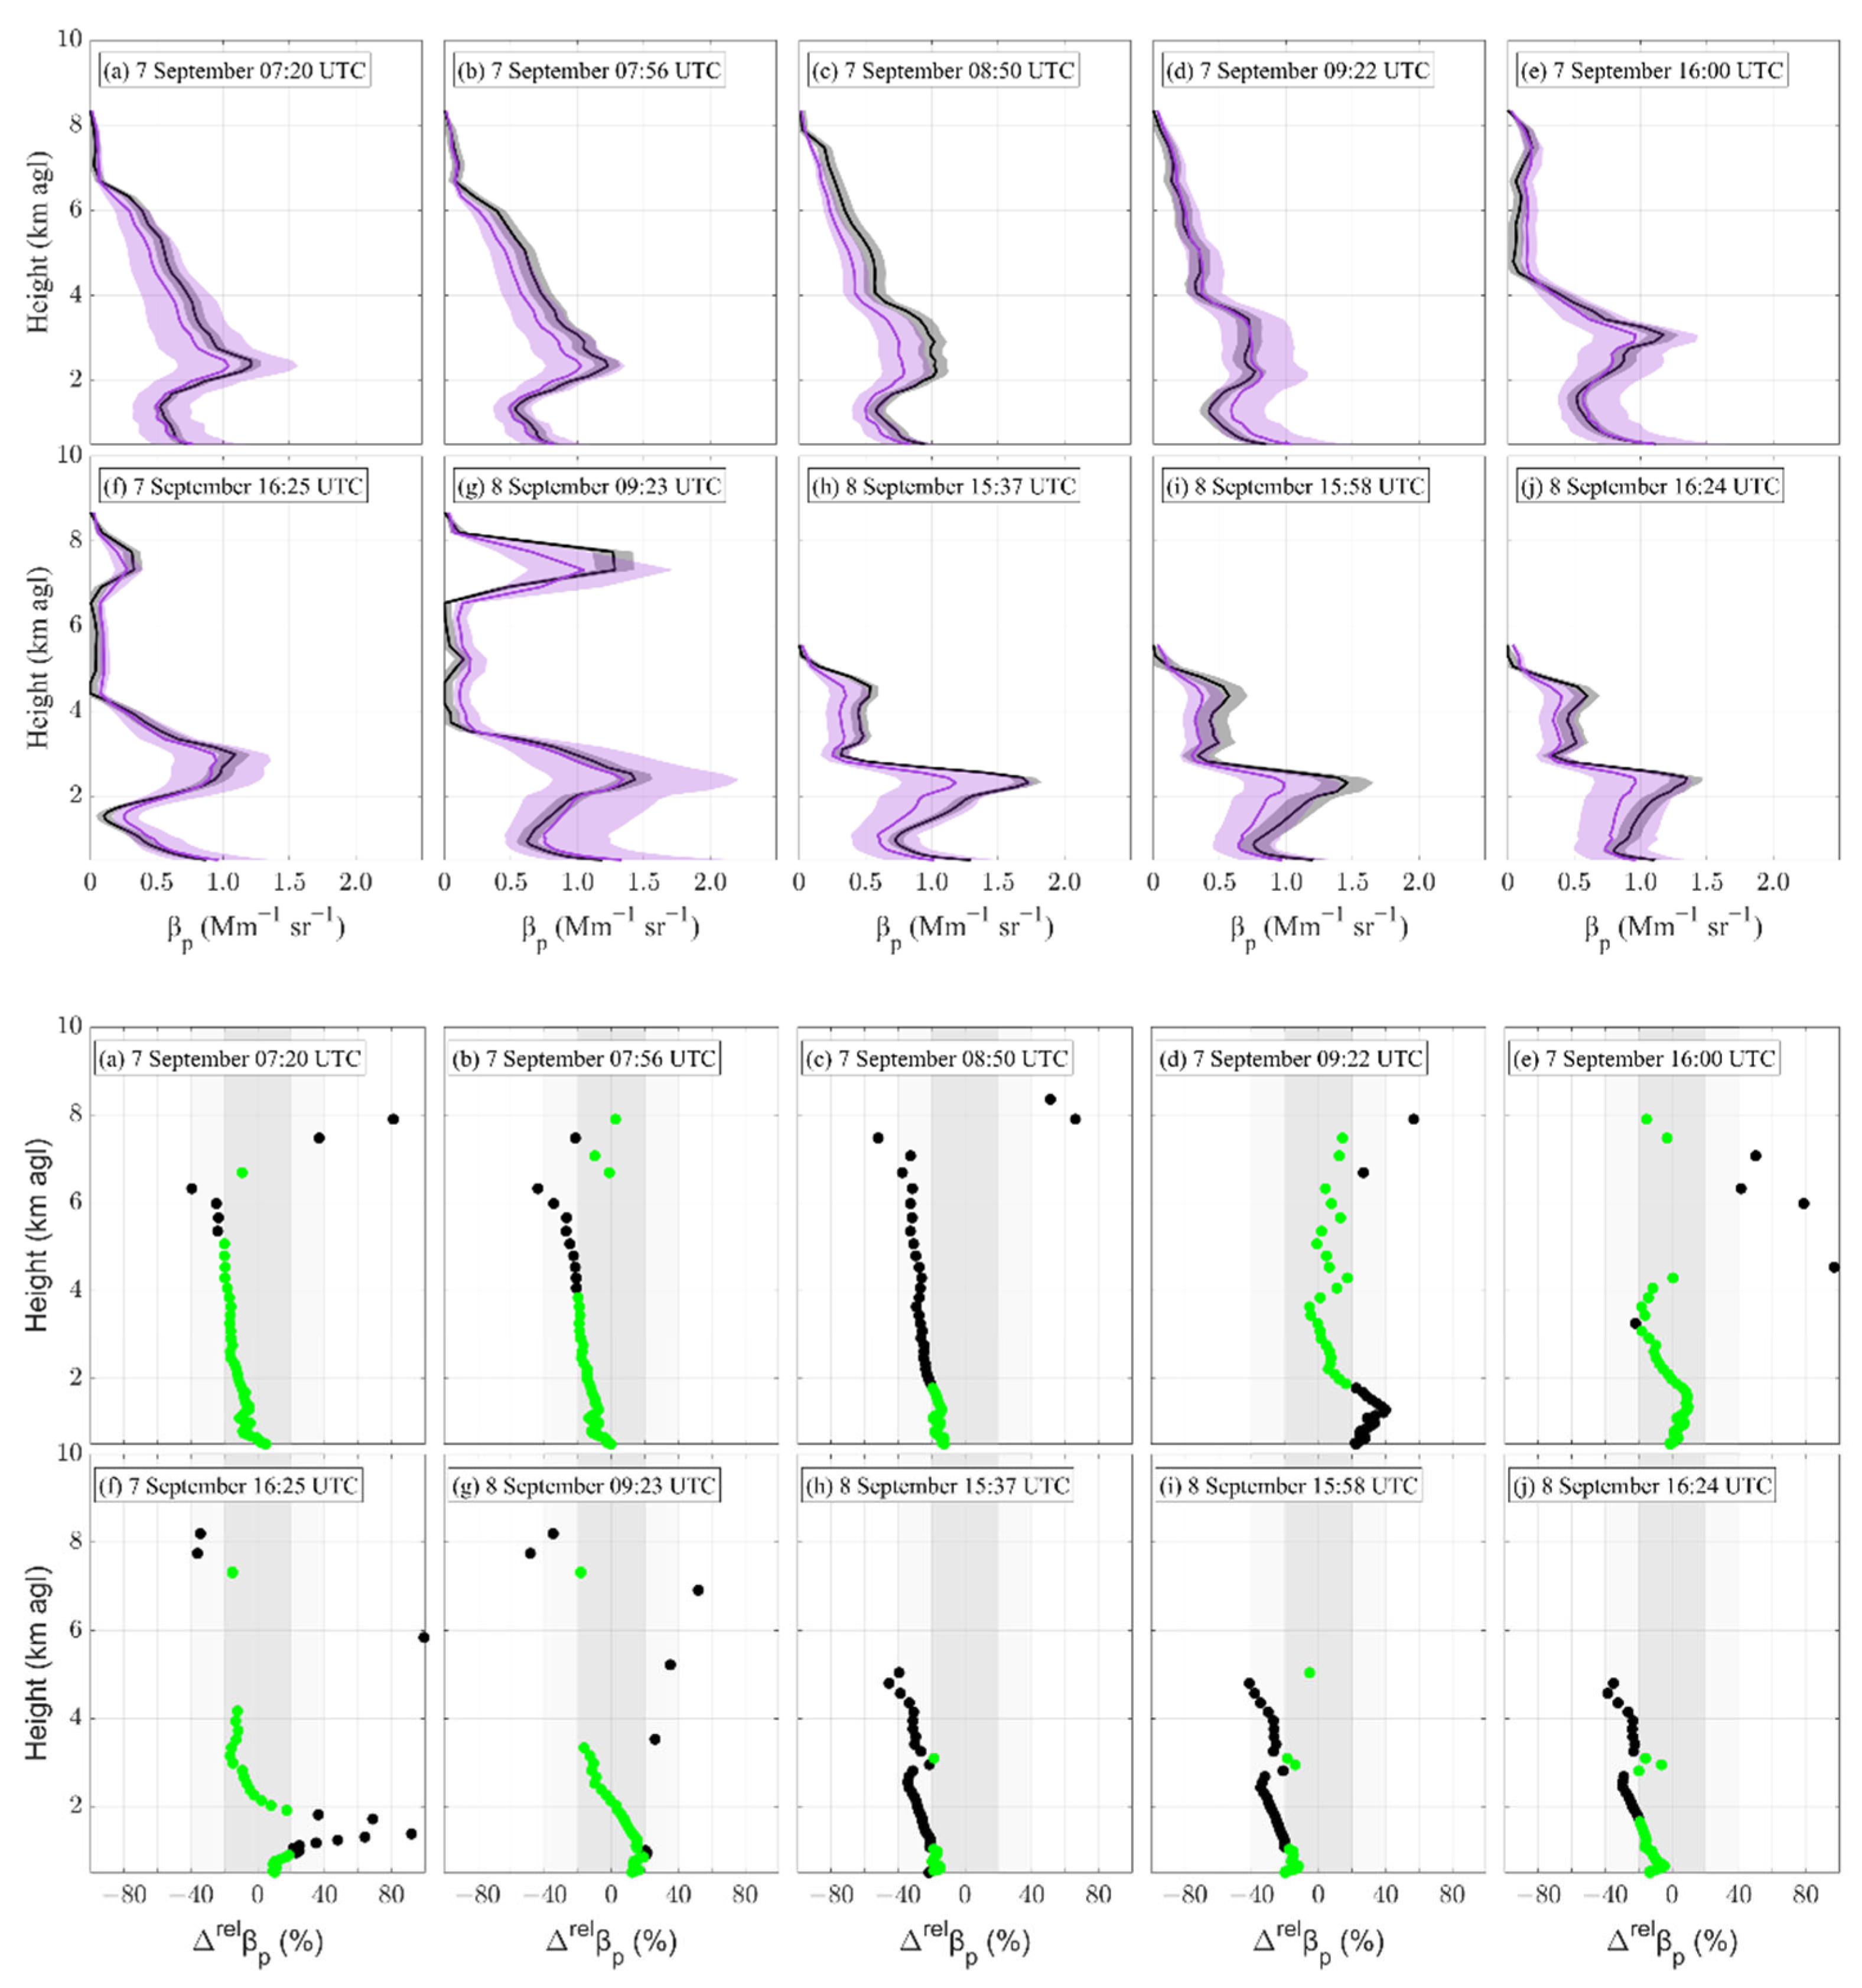
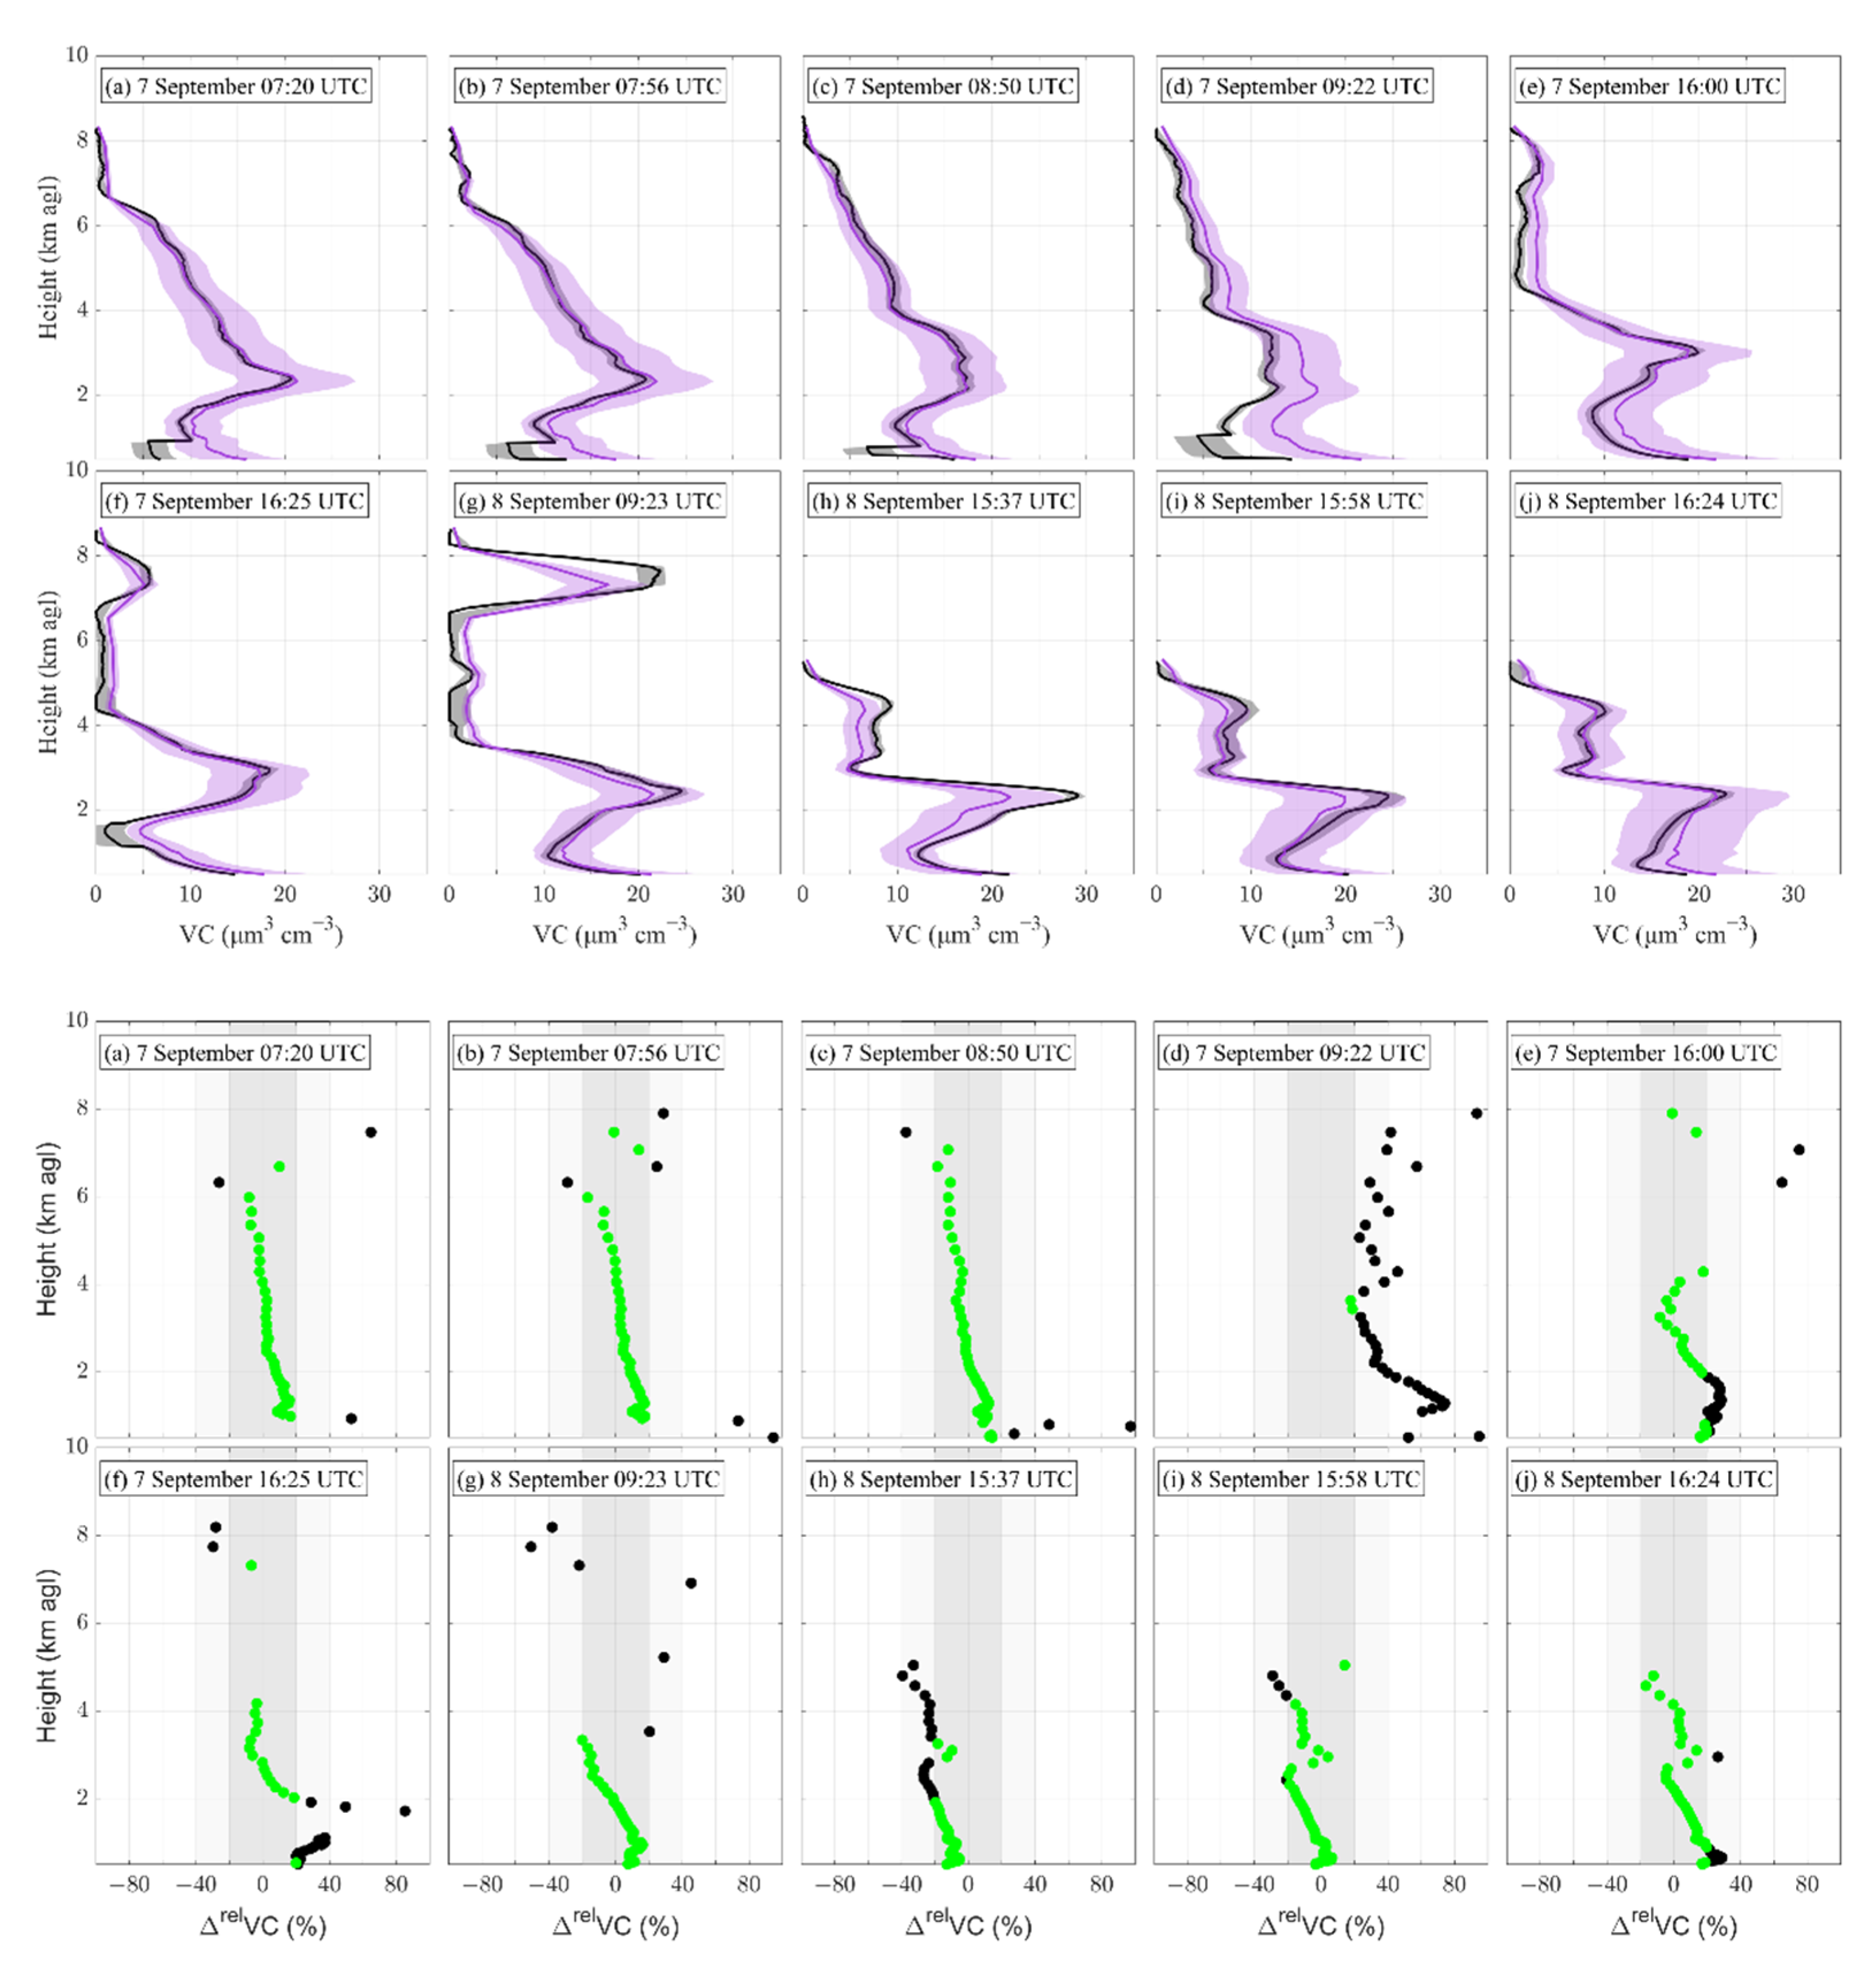
3.3. Height-Resolved Optical and Microphysical Properties

Height-resolved optical and microphysical properties, as derived by GRASP, were compared with their independent lidar-derived variables. In particular, the profiles of both the total particle backscatter coefficient βp (z) at 532 nm and the total volume concentration VC(z) are shown in Figure 5 and Figure 6 (top panels), respectively, for the 10 selected BB cases. For comparison purposes, the lidar-derived profiles were degraded to the GRASP height levels (Section 2.2.3. Their relative differences Δrel βp(z) (%) and Δrel VC(z) (%) with height are also shown in Figure 5 and Figure 6 (bottom panels), respectively. The confidence levels within ±20% intervals are marked by a shaded grey band (the ±40% interval by a shaded light-grey band). Finally, linear fits using all the points of the vertical profile were performed between the GRASP and lidar-derived properties for each BB profile individually. The results of these linear fits, together with MFB and χ values, are summarized in Table 4.
Figure 5a–j shows a chronological overview of the βp(z) profiles at 532 nm for the 10 selected BB cases. The presence of smoke layers is clearly illustrated in most of the graphs, although from the afternoon of 8 September 2017 this is less pronounced and the layer starts to dissipate with entrainment in the atmospheric boundary layer. Smoke layers on the upper troposphere (>6 km height) are also observed, although they are more pronounced from 7 September 2017 at 12:00 UTC to 8 September 2017 at 00:00 UTC. After that time, the upper troposphere is very clean, and the low signal-to-noise ratio did not permit retrievals at those levels. VC(z) profiles (see Figure 6a–j) follow tendencies very similar to βp(z), although for the case on 8 September 2017 at 09:23 UTC VC(z), the values are similar to those near the surface, which can be explained by the presence of large particles in the upper troposphere layers. This result suggests that the long-range transport of smoke layers at these altitudes may imply larger particles, rather than fresh-smoke particles, because of particle ageing.
Regarding the statistical proxies for the βp(z) profiles, m ranged from 0.80 to 1.20, r > 0.98, MFB varies from −3.3 to 35.5%, and χ was between 38% and 87%. Those results were even better if a ±40% interval of confidence was considered, with χ ranging from 68 to 97%. With respect to the VC(z) profiles, 90%, 100%, 100%, and 80% of the 10 BB cases satisfied the high-confidence conditions for m, r, MFB, and χ, respectively. In particular, m ranged from 0.90 to 1.58, r was higher than 0.97, and the MFB and χ varied in the range [−8.9, 53.0] and [3%, 83%], respectively. Moreover, χ increased when considering a ±40% for the interval of confidence, and then χ ranged from 35 to 95%.

4. Discussion

4.1. Columnar Optical and Microphysical Properties

Regarding the VC properties, a moderate agreement between GRASP and AERONET was found on the basis of three out of four proxies, fulfilling the high-quality criteria. Although the correlation was near 1 and the MFB was close to zero, almost half of the VC values between GRASP and AERONET differed, showing a point dispersion, which is reflected in the low values of Δrel (40%). Thus, a high value of r could be explained in this particular case by the symmetry in the data distribution. In the case of Reff, a good agreement was found based on the four proxies, fulfilling the high-quality criteria. The Reff values were within 0.2–0.4 μm; this result agrees with the typical values for long-range smoke particles of different sources [58], but also for specific Canadian BB particles, as observed on 22 August 2017 over Leipzig [28].
Figure 3 shows the volume size distributions, both by GRASP and AERONET, for each particular BB case. All size distributions are bimodal and the differences between GRASP and AERONET are within the uncertainties associated with each methodology. Nevertheless, slightly larger particle VSDs were retrieved by GRASP in comparison with AERONET, in both fine and coarse modes. The maximum values of the fine (coarse) mode were 1.0–1.3 (1.1–1.5) times greater than the AERONET ones. However, there are two important exceptions to highlight for the fine mode. The two BB cases on 7 September 2017 at 16:00 and 16:25 UTC presented maximum values 1.6 and 2.4 times, respectively, smaller than those for the AERONET fine mode (Figure 3e,f). These differences in the maximum values are compensated by the larger values of the modal radius of each mode. The statistical proxies revealed a high (moderate) degree of agreement between GRASP and AERONET for the coarse (fine) mode, based on 80% (30%) out of all the cases fulfilling the high-confidence criteria for the four proxies. Regarding the total VSD, a moderate degree of agreement was found, on the basis that only 40% out of all the cases showed a high confidence level, fulfilling the criteria for the four proxies. The slope was the proxy that shows the least agreement (40%). However, more than 80% of the cases satisfied the high-confidence conditions regarding r, MFB, and χ. These similarities and differences agreed with the results found in Figure 2.
Regarding the columnar optical properties (see Figure 4), it was highlighted that GRASP retrieval shows lower values for SSA and RRI than AERONET. Specifically, SSA followed the same spectral dependence, which is typically observed for BB [57], showing similar values as those reported in [32] for long-range Canadian BB aerosols, which were registered over the southern Iberian Peninsula on 7 to 8 September 2017. The uncertainties increased with the wavelength, due to the high predominance of fine mode particles. In the case of RRI, GRASP showed values 7% lesser than AERONET, an important result and one that requires further analyses to determine which approach, between AERONET and GRASP, has the superior precision in RRI estimations. Preliminary results by other authors (e.g., [33,57]) provided higher RRI values close to 1.55 for fresh biomass burning and lower values (~1.45) for aged-smoke RRI. Nevertheless, further studies are required. Finally, for the IRI values, no spectral dependence could be found in either GRASP or AERONET, with values lower than 0.01. These results agree with those reported by other authors, showing that long-range transported smoke particles usually present a lower absorption than fresh ones, due to the ageing processes [30,57].
A sensitive analysis of the aerosol retrieval properties can be found in [11], where synthetic data were used for different aerosol scenarios (dust, smoke, and different mixtures of both) in the GRASP model. Regarding the microphysical properties, larger discrepancies between retrieved and reference VSDs were found for the fine mode under the smoke scenario, being more evident at lower AODs. In the present work, a lower agreement was also found for the fine mode of the VSD. Moreover, the retrieved SSA, RRI, and IRI fit better when AOD increased; unfortunately, only one case could be studied in this work with an AOD400 ≥ 0.40 (see Section 3.2). Therefore, it would be necessary to analyze other real smoke scenarios with greater AODs (>0.40) to clarify this point.

4.2. Height-Resolved Optical and Microphysical Properties

The comparison of βp(z) profiles between GRASP and lidar-derived ones (Figure 5) showed a very good agreement between both approaches, the differences being within the uncertainties. Actually, the GRASP uncertainties (shaded areas) were within 20%, which is very similar to those associated with the lidar-derived methodology. In addition, there were no differences in altitude, showing that both methodologies presented the same patterns. The specific LRs used in the lidar-derived methodology (P-MPL/POLIPHON retrieval) for separating the backscatter coefficients for the BB and NB components and, hence, for estimating the VC profiles (Section 2.2.3) were statistically determined from AERONET long-term measurements of BB aerosols from Boreal forest wildfires [57]. Hence, those LRs might not coincide with the real LRs for each specific profile, leading to an intrinsic uncertainty source. GRASP retrieved parameters were 60% lower than the lidar-derived ones for the BB cases (Table 4). Those small differences may be related to the LRs obtained by GRASP, which on average were slightly greater than those used by the KF method. In particular, for the 10 BB cases the averaged GRASP- and KF-LR were 70 ± 7 and 62 ± 7 sr, respectively, thus showing a relative difference of around 10%, which is within the uncertainties. On the other hand, high confidence values were found for Δβp(z) (Figure 5a–j (bottom)) at the altitudes where BB particles predominate. Overall, good agreements were found between both methodologies, considering that more than 90% of the profiles fulfilled the optimal confidence conditions for the four statistical proxies.
By comparing VC(z) profiles (Figure 6), a very good agreement between GRASP and lidar-derived parameters (Figure 6a–j (top)) was observed, the differences being within the uncertainties associated with each methodology. The BB cases with remarkable differences at low altitudes were the first four cases (Figure 6a–d), where the values were not within the uncertainty interval. This is associated with the different methodological approaches used by each algorithm and the change of the particle properties in the lowermost region. GRASP retrieves the VC without discriminating between depolarizing and non-depolarizing particles in this configuration, and POLIPHON takes advantage of incorporating depolarization information together with different volume-to-extinction conversion factors for each component. Thus, a potential change with time in the depolarizing-to-non-depolarizing particles ratio might cause the discrepancies observed in the retrieval of VC profiles by each algorithm. Likewise, by comparing with the results obtained from synthetic data (as reported in [11]), the largest differences between the retrieved and reference VC(z) profiles were found for smoke, especially at heights below 2 km. In addition, differences were found above GRASP uncertainties for the layer in the upper troposphere on 8 September 2017 at 09:23 UTC, due to the difficulties in accurately measuring depolarization at these altitudes, which might ultimately have affected the lidar-derived parameters. Another uncertainty affecting the lidar-derived parameters is associated with the LR assumption, as introduced in the lidar retrievals. Moreover, it should be noticed that the methodology used to calculate the VC(z) profiles differed between GRASP and the lidar-derived method (see Section 2.2.2 Equation (2), and Section 2.2.3 Equation (4)). In the GRASP method, the VC(z) profiles were calculated by multiplying the columnar volume concentration by the normalized aerosol vertical profile concentration (see Section 2.2.3 Equation (4)). In the lidar-derived method, they were obtained from the sum of the coarse and fine VC, by applying a volume-to-extinction conversion factor to the extinction profile for each POLIPHON-separated component (see Section 2.2.2 Equation (2)). In particular, the climatological values for Canadian BB [54] were chosen. Thus, it is possible that the uncertainties could be related to the fact that the POLIPHON method included information of the depolarization ratio, unlike the GRASP configuration retrieval (no depolarization was used). However, the good agreement found between the profiles is supported by the statistical parameters.

5. Conclusions

For the first time, the performance of the GRASP model in the retrieval of aerosol optical and microphysical properties for aged-smoke plumes was evaluated using the combination of both sun/sky photometer and Polarized Micro-Pulse Lidar measurements. For that purpose, biomass-burning (BB) aerosols, which originated in intense Canadian wildfires in summertime 2017 and were transported at long distances, were analyzed using observations of BB particles detected over the El Arenosillo/Huelva station in the south-western Iberian Peninsula in September 2017. Ten BB cases fulfilling the high-quality GRASP criteria were selected to evaluate the degree of agreement between GRASP and AERONET products for columnar aerosol optical and microphysical properties, as well as GRASP and independent lidar-derived variables for height-resolved properties.
The comparison analysis for the columnar aerosol microphysical properties such as particle volume size distribution showed a moderate agreement between the GRASP and AERONET values. Thus, eight cases (coarse mode) and three cases (fine mode) fulfilled the high-quality criteria. The volume concentration (effective radius) revealed a moderate (high) agreement between GRASP and AERONET, with values of 0.97 (1.12), 0.97 (0.99), 0.7% (15.9%), and 40% (60%) for m, r, MFB, and χ, respectively. For the columnar aerosol optical properties (e.g., single scattering albedo and complex refractive index), unfortunately, only one case could be compared, because of the strict restrictions in AERONET V3 L2 data requiring AOD440 > 0.40; the rest of the cases presented AODs < 0.25. For that single case, the differences between both retrieval techniques indicated the same spectral pattern, with values coincident with those typical for biomass-burning aerosols. In addition, the discrepancies found in the real refractive index require extended evaluations. Further analyses are also required to be performed in future works to evaluate the precision of GRASP retrieval for the imaginary refractive index.
Moreover, the height-resolved properties such as the total particle backscatter coefficient (total volume concentration) also presented a good agreement between GRASP and lidar-derived methodologies, on the basis of 100% (90%), 100% (100%), 100% (100%) and 90% (80%) satisfaction of the high-confidence conditions for m, r, MFB, and χ, respectively. Their discrepancies were within the interval of uncertainty. For the total backscatter coefficient, differences were related to the lidar ratio as estimated by each method, differing from each other by around 10% on average. On the other hand, the differences found in the total volume concentration may be associated with the internal assumptions of statistical values assumed for the volume-to-extinction conversion factors and those uncertainties introduced into the depolarization measurements within the lidar retrievals, in addition to the uncertainties in GRASP inversion.
Some degree of discrepancy in the retrieved properties between GRASP and AERONET/lidar-derived methods was expected, not only because of the particular retrieval method, but also as BB aerosols present low AODs and due to the predominance of fine particles, as highlighted in [11] (synthetic data). However, an overall good agreement of the optical and microphysical properties could be found by using real measurements, and it could be even improved by adding the lidar depolarization measurements in the GRASP scheme. Indeed, GRASP is presented as a consistent inversion scheme for aerosol property determination. It could be also useful for deriving columnar optical properties with a high degree of confidence, even for aerosol optical depths below 0.40, i.e., when AERONET is unable to retrieve optical properties with a high accuracy. The capabilities of GRASP to provide error estimation of the retrieved variables is also a step forward, to better understand the feasibility of these derived parameters.
The synergy of the Micro-Pulse Lidar and Sun/sky photometer in combination with the GRASP code, as shown in this work, opens new opportunities for the characterization of vertically-resolved aerosol properties, without internal assumptions of aerosol lidar ratios and depolarization measurements. However, the separation of the optical and microphysical variables into their fine and coarse modes is not feasible using one-wavelength elastic lidar measurements with the current GRASP retrieval configuration, as presented in this work. On the contrary, methods based on lidar depolarization measurements (e.g., POLIPHON/P-MPL synergy) are devoted to discriminating an aerosol into fine and coarse components. Therefore, current studies are being addressed to assess the introduction of lidar depolarization in the GRASP code as an encouraged added-value, for an improved vertical retrieval of aerosol properties. Indeed, such GRASP optimization will permit further advances in aerosol studies by its implementation in global networks, and will also validate satellite retrievals. In particular, this is in relation to the usual co-location of Micro-Pulse Lidars with AERONET sun/sky photometers, since a semi-automatic retrieval processing of the aerosol properties with vertical resolution and a separation into particle size modes could be easily implemented.

Author Contributions

Conceptualization, C.C.-J. and J.L.G.-R.; methodology, M.-Á.L.-C. and C.C.-J.; software, O.D., M.E.H.; formal analysis, M.-Á.L.-C. and M.E.H.; investigation, M.-Á.L.-C., C.C.-J., D.P.-R. and J.L.G.-R.; data curation, M.-Á.L.-C., C.C.-J. and C.V.C.-P.; writing—original draft preparation, M.-Á.L.-C., C.C.-J. and J.L.G.-R.; writing—review and editing, all authors; supervision, C.C.-J. and J.L.G.-R.; funding acquisition, C.C.-J. and J.L.G.-R. All authors have read and agreed to the published version of the manuscript.

Funding

This work was funded by the Spanish Ministry of Science and Innovation (PID2019-104205GB-C21, PID2020-117825GB-C21), and partly by the Spanish Ministry of Science, Innovation, and Universities (CGL2017-90884-REDT), the Regional Government of Andalusia (P18-RT-3820, P20_00136, A-RNM-430-UGR20), and the Marie Sklodowska-Curie Research Innovation and Staff Exchange (RISE) GRASPACE (GA n. 778349). Authors acknowledge the support of the European Union’s H2020 research and innovation program (ACTRIS GA n. 654109, 871115). M.-Á.L.-C. and C.V.C.-P. are supported by the INTA predoctoral contract program.

Data Availability Statement

The GRASP retrieval algorithm is an open-source code available at http://www.grasp-open.com (accessed on 28 May 2021). Part of the data used in this publication was obtained from AERONET (publicly available). For additional data or information, please contact the authors.

Acknowledgments

The authors would like to acknowledge the use of GRASP inversion algorithm software (http://www.grasp-open.com, accessed on 28 May 2021). The authors acknowledge the use of imagery from NASA’s Worldview application (https://worldview.earthdata.nasa.gov, accessed on 15 March 2022), part of NASA’s Earth Observing System Data and Information System (EOSDIS). The authors thank the PIs of the AERONET and MPLNET El Arenosillo site and its technical staff for maintenance and operation support. Authors also thank R. Román at the University of Valladolid and M. Herreras-Giralda at GRASP-SAS for their advice on improving this work.

Conflicts of Interest

The authors declare no conflict of interest.

References

  1. Dubovik, O.; Lapyonok, T.; Litvinov, P.; Herman, M.; Fuertes, D.; Ducos, F.; Lopatin, A.; Chaikovsky, A.; Torres, B.; Derimian, Y. GRASP: A Versatile Algorithm for Characterizing the Atmosphere. SPIE Newsroom 2014, 25, 2-1201408. [Google Scholar] [CrossRef]
  2. Dubovik, O.; Fuertes, D.; Litvinov, P.; Lopatin, A.; Lapyonok, T.; Doubovik, I.; Xu, F.; Ducos, F.; Chen, C.; Torres, B.; et al. A Comprehensive Description of Multi-Term LSM for Applying Multiple a Priori Constraints in Problems of Atmospheric Remote Sensing: GRASP Algorithm, Concept, and Applications. Front. Remote Sens. 2021, 2, 706851. [Google Scholar] [CrossRef]
  3. Holben, B.N.; Eck, T.F.; Slutsker, I.; Tanre, D.; Buis, J.P.; Setzer, A.; Vermote, E.; Reagan, J.A.; Kaufman, Y.J.; Nakajima, T. AERONET—A Federated Instrument Network and Data Archive for Aerosol Characterization. Remote Sens. Environ. 1998, 66, 1–16. [Google Scholar] [CrossRef]
  4. Sinyuk, A.; Holben, B.N.; Eck, T.F.; Giles, D.M.; Slutsker, I.; Korkin, S.; Schafer, J.S.; Smirnov, A.; Sorokin, M.; Lyapustin, A. The AERONET Version 3 Aerosol Retrieval Algorithm, Associated Uncertainties and Comparisons to Version 2. Atmos. Meas. Tech. 2020, 13, 3375–3411. [Google Scholar] [CrossRef]
  5. Dubovik, O.; Herman, M.; Holdak, A.; Lapyonok, T.; Tanré, D.; Deuzé, J.L.; Ducos, F.; Sinyuk, A.; Lopatin, A. Statistically Optimized Inversion Algorithm for Enhanced Retrieval of Aerosol Properties from Spectral Multi-Angle Polarimetric Satellite Observations. Atmos. Meas. Tech. 2011, 4, 975–1018. [Google Scholar] [CrossRef] [Green Version]
  6. Lopatin, A.; Dubovik, O.; Chaikovsky, A.; Goloub, P.; Lapyonok, T.; Tanré, D.; Litvinov, P. Enhancement of Aerosol Characterization Using Synergy of Lidar and Sun-Photometer Coincident Observations: The GARRLiC Algorithm. Atmos. Meas. Tech. 2013, 6, 2065–2088. [Google Scholar] [CrossRef] [Green Version]
  7. Benavent-Oltra, J.A.; Román, R.; Casquero-Vera, J.A.; Pérez-Ramírez, D.; Lyamani, H.; Ortiz-Amezcua, P.; Bedoya-Velásquez, A.E.; de Arruda-Moreira, G.; Barreto, Á.; Lopatin, A. Different Strategies to Retrieve Aerosol Properties at Night-Time with the GRASP Algorithm. Atmos. Chem. Phys. 2019, 19, 14149–14171. [Google Scholar] [CrossRef] [Green Version]
  8. Soupiona, O.; Samaras, S.; Ortiz-Amezcua, P.; Böckmann, C.; Papayannis, A.; Moreira, G.A.; Benavent-Oltra, J.A.; Guerrero-Rascado, J.L.; Bedoya-Velásquez, A.E.; Olmo, F.J.; et al. Retrieval of Optical and Microphysical Properties of Transported Saharan Dust over Athens and Granada Based on Multi-Wavelength Raman Lidar Measurements: Study of the Mixing Processes. Atmos. Environ. 2019, 214, 116824. [Google Scholar] [CrossRef]
  9. Müller, D.; Hostetler, C.A.; Ferrare, R.A.; Burton, S.P.; Chemyakin, E.; Kolgotin, A.; Hair, J.W.; Cook, A.L.; Harper, D.B.; Rogers, R.R.; et al. Airborne Multiwavelength High Spectral Resolution Lidar (HSRL-2) Observations during TCAP 2012: Vertical Profiles of Optical and Microphysical Properties of a Smoke/Urban Haze Plume over the Northeastern Coast of the US. Atmos. Meas. Tech. 2014, 7, 3487–3496. [Google Scholar] [CrossRef] [Green Version]
  10. Pérez-Ramírez, D.; Whiteman, D.N.; Veselovskii, I.; Colarco, P.; Korenski, M.; da Silva, A. Retrievals of Aerosol Single Scattering Albedo by Multiwavelength Lidar Measurements: Evaluations with NASA Langley HSRL-2 during Discover-AQ Field Campaigns. Remote Sens. Environ. 2019, 222, 144–164. [Google Scholar] [CrossRef] [Green Version]
  11. Román, R.; Benavent-Oltra, J.A.; Casquero-Vera, J.A.; Lopatin, A.; Cazorla, A.; Lyamani, H.; Denjean, C.; Fuertes, D.; Pérez-Ramírez, D.; Torres, B. Retrieval of Aerosol Profiles Combining Sunphotometer and Ceilometer Measurements in GRASP Code. Atmos. Res. 2018, 204, 161–177. [Google Scholar] [CrossRef] [Green Version]
  12. Lopatin, A.; Dubovik, O.; Fuertes, D.; Stenchikov, G.; Lapyonok, T.; Veselovskii, I.; Wienhold, F.G.; Shevchenko, I.; Hu, Q.; Parajuli, S. Synergy Processing of Diverse Ground-Based Remote Sensing and in Situ Data Using the GRASP Algorithm: Applications to Radiometer, Lidar and Radiosonde Observations. Atmos. Meas. Tech. 2021, 14, 2575–2614. [Google Scholar] [CrossRef]
  13. López-Cayuela, M.-Á.; Herreras-Giralda, M.; Córdoba-Jabonero, C.; Lopatin, A.; Dubovik, O.; Guerrero-Rascado, J.L. Vertical Assessment of the Mineral Dust Optical and Microphysical Properties as Retrieved from the Synergy between Polarized Micro-Pulse Lidar and Sun/Sky Photometer Observations Using GRASP Code. Atmos. Res. 2021, 264, 105818. [Google Scholar] [CrossRef]
  14. Parajuli, S.P.; Stenchikov, G.L.; Ukhov, A.; Shevchenko, I.; Dubovik, O.; Lopatin, A. Aerosol Vertical Distribution and Interactions with Land/Sea Breezes over the Eastern Coast of the Red Sea from Lidar Data and High-Resolution WRF-Chem Simulations. Atmos. Chem. Phys. 2020, 20, 16089–16116. [Google Scholar] [CrossRef]
  15. Andreae, M.O. Emission of Trace Gases and Aerosols from Biomass Burning–an Updated Assessment. Atmos. Chem. Phys. 2019, 19, 8523–8546. [Google Scholar] [CrossRef] [Green Version]
  16. Bond, T.C.; Doherty, S.J.; Fahey, D.W.; Forster, P.M.; Berntsen, T.; DeAngelo, B.J.; Flanner, M.G.; Ghan, S.; Kärcher, B.; Koch, D.; et al. Bounding the Role of Black Carbon in the Climate System: A Scientific Assessment. J. Geophys. Res. Atmos. 2013, 118, 5380–5552. [Google Scholar] [CrossRef]
  17. Myhre, G.; Samset, B.H.; Schulz, M.; Balkanski, Y.; Bauer, S.; Berntsen, T.K.; Bian, H.; Bellouin, N.; Chin, M.; Diehl, T.; et al. Radiative Forcing of the Direct Aerosol Effect from AeroCom Phase II Simulations. Atmos. Chem. Phys. 2013, 13, 1853–1877. [Google Scholar] [CrossRef] [Green Version]
  18. Giordano, M.; Espinoza, C.; Asa-Awuku, A. Experimentally Measured Morphology of Biomass Burning Aerosol and Its Impacts on CCN Ability. Atmos. Chem. Phys. 2015, 15, 1807–1821. [Google Scholar] [CrossRef] [Green Version]
  19. Prenni, A.J.; DeMott, P.J.; Sullivan, A.P.; Sullivan, R.C.; Kreidenweis, S.M.; Rogers, D.C. Biomass Burning as a Potential Source for Atmospheric Ice Nuclei: Western Wildfires and Prescribed Burns. Geophys. Res. Lett. 2012, 39, 11. [Google Scholar] [CrossRef] [Green Version]
  20. Peterson, D.A.; Hyer, E.J.; Campbell, J.R.; Solbrig, J.E.; Fromm, M.D. A Conceptual Model for Development of Intense Pyrocumulonimbus in Western North America. Mon. Weather Rev. 2017, 145, 2235–2255. [Google Scholar] [CrossRef]
  21. Fromm, M.; Lindsey, D.T.; Servranckx, R.; Yue, G.; Trickl, T.; Sica, R.; Doucet, P.; Godin-Beekmann, S. The Untold Story of Pyrocumulonimbus. Bull. Am. Meteorol. Soc. 2010, 91, 1193–1210. [Google Scholar] [CrossRef] [Green Version]
  22. Das, S.; Colarco, P.R.; Oman, L.D.; Taha, G.; Torres, O. The Long-Term Transport and Radiative Impacts of the 2017 British Columbia Pyrocumulonimbus Smoke Aerosols in the Stratosphere. Atmos. Chem. Phys. 2021, 21, 12069–12090. [Google Scholar] [CrossRef]
  23. Peterson, D.A.; Campbell, J.R.; Hyer, E.J.; Fromm, M.D.; Kablick, G.P.; Cossuth, J.H.; DeLand, M.T. Wildfire-Driven Thunderstorms Cause a Volcano-like Stratospheric Injection of Smoke. Npj Clim. Atmos. Sci. 2018, 1, 1–8. [Google Scholar] [CrossRef] [Green Version]
  24. Pérez-Ramírez, D.; Andrade-Flores, M.; Eck, T.F.; Stein, A.F.; O’Neill, N.T.; Lyamani, H.; Gassó, S.; Whiteman, D.N.; Veselovskii, I.; Velarde, F.; et al. Multi Year Aerosol Characterization in the Tropical Andes and in Adjacent Amazonia Using AERONET Measurements. Atmos. Environ. 2017, 166, 412–432. [Google Scholar] [CrossRef] [Green Version]
  25. Calì Quaglia, F.; Meloni, D.; Muscari, G.; Di Iorio, T.; Ciardini, V.; Pace, G.; Becagli, S.; Di Bernardino, A.; Cacciani, M.; Hannigan, J.W.; et al. On the Radiative Impact of Biomass-Burning Aerosols in the Arctic: The August 2017 Case Study. Remote Sens. 2022, 14, 313. [Google Scholar] [CrossRef]
  26. Ansmann, A.; Baars, H.; Chudnovsky, A.; Mattis, I.; Veselovskii, I.; Haarig, M.; Seifert, P.; Engelmann, R.; Wandinger, U. Extreme Levels of Canadian Wildfire Smoke in the Stratosphere over Central Europe on 21–22 August 2017. Atmos. Chem. Phys. 2018, 18, 11831–11845. [Google Scholar] [CrossRef] [Green Version]
  27. Baars, H.; Ansmann, A.; Ohneiser, K.; Haarig, M.; Engelmann, R.; Althausen, D.; Hanssen, I.; Gausa, M.; Pietruczuk, A.; Szkop, A.; et al. The Unprecedented 2017–2018 Stratospheric Smoke Event: Decay Phase and Aerosol Properties Observed with the EARLINET. Atmos. Chem. Phys. 2019, 19, 15183–15198. [Google Scholar] [CrossRef] [Green Version]
  28. Haarig, M.; Ansmann, A.; Baars, H.; Jimenez, C.; Veselovskii, I.; Engelmann, R.; Althausen, D. Depolarization and lidar ratios at 355, 532, and 1064 nm and microphysical properties of aged tropospheric and stratospheric Canadian wildfire smoke. Atmos. Chem. Phys. 2018, 18, 11847–11861. [Google Scholar] [CrossRef] [Green Version]
  29. Hu, Q.; Goloub, P.; Veselovskii, I.; Bravo-Aranda, J.-A.; Popovici, I.E.; Podvin, T.; Haeffelin, M.; Lopatin, A.; Dubovik, O.; Pietras, C. Long-Range-Transported Canadian Smoke Plumes in the Lower Stratosphere over Northern France. Atmos. Chem. Phys. 2019, 19, 1173–1193. [Google Scholar] [CrossRef] [Green Version]
  30. Khaykin, S.M.; Godin-Beekmann, S.; Hauchecorne, A.; Pelon, J.; Ravetta, F.; Keckhut, P. Stratospheric Smoke With Unprecedentedly High Backscatter Observed by Lidars Above Southern France. Geophys. Res. Lett. 2018, 45, 1639–1646. [Google Scholar] [CrossRef]
  31. Torres, O.; Bhartia, P.K.; Taha, G.; Jethva, H.; Das, S.; Colarco, P.; Krotkov, N.; Omar, A.; Ahn, C. Stratospheric Injection of Massive Smoke Plume From Canadian Boreal Fires in 2017 as Seen by DSCOVR-EPIC, CALIOP, and OMPS-LP Observations. J. Geophys. Res. Atmos. 2020, 125, e2020JD032579. [Google Scholar] [CrossRef]
  32. Sicard, M.; Granados-Muñoz, M.J.; Alados-Arboledas, L.; Barragán, R.; Bedoya-Velásquez, A.E.; Benavent-Oltra, J.A.; Bortoli, D.; Comerón, A.; Córdoba-Jabonero, C.; Costa, M.J.; et al. Ground/Space, Passive/Active Remote Sensing Observations Coupled with Particle Dispersion Modelling to Understand the Inter-Continental Transport of Wildfire Smoke Plumes. Remote Sens. Environ. 2019, 232, 111294. [Google Scholar] [CrossRef] [Green Version]
  33. Alados-Arboledas, L.; Müller, D.; Guerrero-Rascado, J.L.; Navas-Guzmán, F.; Pérez-Ramírez, D.; Olmo, F.J. Optical and Microphysical Properties of Fresh Biomass Burning Aerosol Retrieved by Raman Lidar, and Star-and Sun-Photometry. Geophys. Res. Lett. 2011, 38, 1. [Google Scholar] [CrossRef]
  34. Pereira, S.N.; Preißler, J.; Guerrero-Rascado, J.L.; Silva, A.M.; Wagner, F. Forest Fire Smoke Layers Observed in the Free Troposphere over Portugal with a Multiwavelength Raman Lidar: Optical and Microphysical Properties. Sci. World J. 2014, 2014, e421838. [Google Scholar] [CrossRef]
  35. Salgueiro, V.; Costa, M.J.; Guerrero-Rascado, J.L.; Couto, F.T.; Bortoli, D. Characterization of Forest Fire and Saharan Desert Dust Aerosols over South-Western Europe Using a Multi-Wavelength Raman Lidar and Sun-Photometer. Atmos. Environ. 2021, 252, 118346. [Google Scholar] [CrossRef]
  36. Ortiz-Amezcua, P.; Guerrero-Rascado, J.L.; Granados-Muñoz, M.J.; Benavent-Oltra, J.A.; Böckmann, C.; Samaras, S.; Stachlewska, I.S.; Janicka, Ł.; Baars, H.; Bohlmann, S.; et al. Microphysical Characterization of Long-Range Transported Biomass Burning Particles from North America at Three EARLINET Stations. Atmos. Chem. Phys. 2017, 17, 5931–5946. [Google Scholar] [CrossRef] [Green Version]
  37. Veselovskii, I.; Whiteman, D.N.; Korenskiy, M.; Suvorina, A.; Kolgotin, A.; Lyapustin, A.; Wang, Y.; Chin, M.; Bian, H.; Kucsera, T.L.; et al. Characterization of Forest Fire Smoke Event near Washington, DC in Summer 2013 with Multi-Wavelength Lidar. Atmos. Chem. Phys. 2015, 15, 1647–1660. [Google Scholar] [CrossRef] [Green Version]
  38. Cayuela, M.Á.L.; Córdoba-Jabonero, C.; Pérez-Ramírez, D.; Herrera, M.; Guerrero-Rascado, J.L. GRASP retrievals in synergy with both polarized Micro-Pulse Lidar and Sun/Sky photometer measurements to derive optical and microphysical properties of aged smoke plumes. In Remote Sensing of Clouds and the Atmosphere XXVI; SPIE: Bellingham, WA, USA, 2021; Volume 11859, pp. 79–89. [Google Scholar]
  39. Toledano, C.; Cachorro, V.E.; Frutos, A.M.; Torres, B.; Berjón, A.; Sorribas, M.; Stone, R.S. Airmass Classification and Analysis of Aerosol Types at El Arenosillo (Spain). J. Appl. Meteorol. Climatol. 2009, 48, 962–981. [Google Scholar] [CrossRef]
  40. Campbell, J.R.; Hlavka, D.L.; Welton, E.J.; Flynn, C.J.; Turner, D.D.; Spinhirne, J.D.; Scott, V.S.; Hwang, I.H. Full-Time, Eye-Safe Cloud and Aerosol Lidar Observation at Atmospheric Radiation Measurement Program Sites: Instruments and Data Processing. J. Atmos. Ocean. Technol. 2002, 19, 431–442. [Google Scholar] [CrossRef]
  41. Córdoba-Jabonero, C.; Sicard, M.; Ansmann, A.; Águila, A.; Baars, H. Separation of the Optical and Mass Features of Particle Components in Different Aerosol Mixtures by Using POLIPHON Retrievals in Synergy with Continuous Polarized Micro-Pulse Lidar (P-MPL) Measurements. Atmos. Meas. Tech. 2018, 11, 4775–4795. [Google Scholar] [CrossRef] [Green Version]
  42. Flynn, C.J.; Mendoza, A.; Zheng, Y.; Mathur, S. Novel Polarization-Sensitive Micropulse Lidar Measurement Technique. Opt. Express 2007, 15, 2785–2790. [Google Scholar] [CrossRef]
  43. Welton, E.J.; Campbell, J.R. Micropulse Lidar Signals: Uncertainty Analysis. J. Atmos. Ocean. Technol. 2002, 19, 2089–2094. [Google Scholar] [CrossRef]
  44. Córdoba-Jabonero, C.; Ansmann, A.; Jiménez, C.; Baars, H.; López-Cayuela, M.-Á.; Engelmann, R. Experimental Assessment of a Micro-Pulse Lidar System in Comparison with Reference Lidar Measurements for Aerosol Optical Properties Retrieval. Atmos. Meas. Tech. 2021, 14, 5225–5239. [Google Scholar] [CrossRef]
  45. Estellés, V.; Utrillas, M.P.; Martínez-Lozano, J.A.; Alcántara, A.; Alados-Arboledas, L.; Olmo, F.J.; Lorente, J.; Cabo, X.; Cachorro, V.; Horvath, H.; et al. Intercomparison of Spectroradiometers and Sun Photometers for the Determination of the Aerosol Optical Depth during the VELETA-2002 Field Campaign. J. Geophys. Res. Atmos. 2006, 111, D17. [Google Scholar] [CrossRef] [Green Version]
  46. Giles, D.M.; Sinyuk, A.; Sorokin, M.G.; Schafer, J.S.; Smirnov, A.; Slutsker, I.; Eck, T.F.; Holben, B.N.; Lewis, J.R.; Campbell, J.R.; et al. Advancements in the Aerosol Robotic Network (AERONET) Version 3 Database–Automated near-Real-Time Quality Control Algorithm with Improved Cloud Screening for Sun Photometer Aerosol Optical Depth (AOD) Measurements. Atmos. Meas. Tech. 2019, 12, 169–209. [Google Scholar] [CrossRef] [Green Version]
  47. Wagner, F.; Silva, A.M. Some considerations about Ångström exponent distributions. Atmos. Chem. Phys. 2008, 8, 481–489. [Google Scholar] [CrossRef] [Green Version]
  48. Dubovik, O.; Smirnov, A.; Holben, B.N.; King, M.D.; Kaufman, Y.J.; Eck, T.F.; Slutsker, I. Accuracy Assessments of Aerosol Optical Properties Retrieved from Aerosol Robotic Network (AERONET) Sun and Sky Radiance Measurements. J. Geophys. Res. Atmos. 2000, 105, 9791–9806. [Google Scholar] [CrossRef] [Green Version]
  49. Fernald, F.G. Analysis of Atmospheric Lidar Observations: Some Comments. Appl. Opt. 1984, 23, 652–653. [Google Scholar] [CrossRef]
  50. Klett, J.D. Lidar Inversion with Variable Backscatter/Extinction Ratios. Appl. Opt. 1985, 24, 1638–1643. [Google Scholar] [CrossRef]
  51. Mamouri, R.-E.; Ansmann, A. Potential of Polarization/Raman Lidar to Separate Fine Dust, Coarse Dust, Maritime, and Anthropogenic Aerosol Profiles. Atmos. Meas. Tech. 2017, 10, 3403–3427. [Google Scholar] [CrossRef] [Green Version]
  52. Groß, S.; Esselborn, M.; Weinzierl, B.; Wirth, M.; Fix, A.; Petzold, A. Aerosol Classification by Airborne High Spectral Resolution Lidar Observations. Atmos. Chem. Phys. 2013, 13, 2487–2505. [Google Scholar] [CrossRef] [Green Version]
  53. Córdoba-Jabonero, C.; Sicard, M.; López-Cayuela, M.-Á.; Ansmann, A.; Comerón, A.; Zorzano, M.-P.; Rodríguez-Gómez, A.; Muñoz-Pocar, C. Aerosol Radiative Effect during the Summer 2019 Heatwave Produced Partly by an Inter-Continental Saharan Dust Outbreak. 1. Shortwave Dust-Induced Direct Impact. Atmos. Chem. Phys. 2021, 21, 6455–6479. [Google Scholar] [CrossRef]
  54. Ansmann, A.; Ohneiser, K.; Mamouri, R.-E.; Knopf, D.A.; Veselovskii, I.; Baars, H.; Engelmann, R.; Foth, A.; Jimenez, C.; Seifert, P.; et al. Tropospheric and Stratospheric Wildfire Smoke Profiling with Lidar: Mass, Surface Area, CCN, and INP Retrieval. Atmos. Chem. Phys. 2021, 21, 9779–9807. [Google Scholar] [CrossRef]
  55. Herrera, M.E.; Dubovik, O.; Torres, B.; Lapyonok, T.; Fuertes, D.; Lopatin, A.; Litvinov, P.; Chen, C.; Benavent-Oltra, J.A.; Bali, J.L.; et al. Estimates of the Remote Sensing Retrieval Errors by GRASP Algorithm: Application to Ground-Based Observations, Concept and Validation. Atmos. Meas. Tech. Discuss. 2022, 1–88. [Google Scholar] [CrossRef]
  56. Rolph, G.; Stein, A.; Stunder, B. Real-Time Environmental Applications and Display System: READY. Environ. Model. Softw. 2017, 95, 210–228. [Google Scholar] [CrossRef]
  57. Dubovik, O.; Holben, B.; Eck, T.F.; Smirnov, A.; Kaufman, Y.J.; King, M.D.; Tanré, D.; Slutsker, I. Variability of Absorption and Optical Properties of Key Aerosol Types Observed in Worldwide Locations. J. Atmos. Sci. 2002, 59, 590–608. [Google Scholar] [CrossRef]
  58. Müller, D.; Mattis, I.; Ansmann, A.; Wandinger, U.; Ritter, C.; Kaiser, D. Multiwavelenght Raman lidar observations of particle growth during long-range transport of forest-fire smoke in the free troposphere. Geophis. Res. Lett. 2007, 34, L05803. [Google Scholar] [CrossRef]
Figure 1. (a) Deep Blue Aerosol Type (Suomi NPP/VIIRS) and corrected reflectance (TERRA/MODIS) on 7 and 8 September 2017. The ARN station is marked with a white star. (b) HYSPLIT 10-day backward trajectories arriving at ARN/Huelva (Spain; marked with a black star) at altitudes of (left) 2500 (red) and 4000 (blue) m a.g.l., and (right) 2500 (red), 4000 (blue) and 8000 (green) m a.g.l. on 7 and 8 September 2017, respectively. (c) Lidar range-corrected signal (RCS) at 532 nm for the period of 7 September 2017 at 00:00 UTC to 9 September 2017 at 00:00 UTC at ARN. Vertical red lines indicate the periods with correlative sun/sky radiances that allow for GRASP retrievals.
Remotesensing 14 03619 g001
Figure 2. Comparison between GRASP and AERONET retrievals of the more representative properties of columnar aerosol size distribution: (Left) total volume concentration (VC, μm3 μm−2) and (Right) effective radius (Reff, μm). (a) and (b) Linear regression for each parameter was performed, showing the slope (m, with their error in brackets) and the correlation coefficient (r). The dark blue line represents the linear fit, while the dashed line is the 1:1 line. Light blue lines in (a) represent the error for the VC. The mean fractional bias (MFB) for each parameter is also included. (c) and (d) Relative differences (Δrel, %) for each parameter, together with the optimal occurrence (χ, %) of biomass-burning cases that fulfil ±20% of Δrel (as marked by a grey band, green bars).
Remotesensing 14 03619 g002
Figure 3. Particle volume size distributions (VSD) derived using GRASP (purple line + squares) and AERONET (black line + dots) retrievals for the 10 selected BB cases. Corresponding errors provided by GRASP are shown by shaded areas.
Remotesensing 14 03619 g003
Figure 4. Spectrally-resolved (a) single scattering albedo (SSA), (b) real refractive index (RRI), and (c) imaginary refractive index (IRI) obtained from AERONET (black dots) and GRASP (purple squares) on 8 September 2017 at 09:23 UTC (BB case with AOD440 ≥ 0.40). GRASP errors are shown by the shaded areas for each retrieved property. For comparison, statistical values as reported in [57] of those variables for BB particles are shown with yellow diamonds.
Remotesensing 14 03619 g004
Figure 5. (Top panels) GRASP (purple) and lidar-derived (black) retrievals of the height-resolved total particle backscatter coefficient βp (Mm−1 sr−1) at 532 nm for the 10 selected biomass-burning cases (chronologically shown from (aj)). Errors provided by GRASP are shown by the purple shaded areas. (Bottom panels) Relative differences between GRASP and lidar-derived values, Δrelβp (%). Those Δrelβp values within ±20% (marked by the shaded grey band) are indicated by green points; the rest of them are marked in black. The ±40% for the confidence interval is indicated by a shaded light-grey band. The profiles are averaged at the time interval of ±15 min around the sun photometer measurements.
Remotesensing 14 03619 g005
Figure 6. The same as for Figure 5, but for (top panels (aj)) the vertical total volume concentration VC (z) (μm3·cm−3), and (bottom panels) the relative differences ΔrelVC for the 10 selected BB cases.
Remotesensing 14 03619 g006
Table 1. Inputs and outputs of the columnar and height-resolved variables used in this work.
Column-Integrated DataVertical Profiles
INPUTS
Sky radiances
(440, 675, 870, and 1020 nm)
Range-corrected signal
(RCS, 532 nm)
AOD
(440, 500, 675, 870, and 1020 nm)
OUTPUTS
Total Volume Concentration (VC)Total Volume Concentration (VC(z))
Total Effective Radius (Reff)Total Backscatter Coefficient (βp(z))
Particle Volume Size Distribution (VSD)
Single Scattering Albedo (SSA)
Complex Refractive Indexes (RRI, IRI)
Table 2. Aerosol Optical Depth at 500 nm (AOD500), Angstrom Exponent at the pair of wavelengths 440 nm and 675 nm (AE440/675), and Fine Mode Fraction at 500 nm (FMF500) for the 10 selected cases of the aged smoke event.
Date and Time (UTC)AOD500AE440/675FMF500
7 September 201707:200.261.750.92
07:56 0.261.760.92
08:50 0.271.760.93
09:22 0.291.730.93
16:00 0.281.640.95
16:25 0.281.610.96
8 September 201709:23 0.401.530.98
15:37 0.291.660.97
15:58 0.291.680.97
16:24 0.291.670.97
Table 3. Mean statistical parameters of the comparisons of GRASP vs. AERONET retrievals for the fine (particle radius < 0.5 μm) and coarse (particle radius ≥ 0.5 μm) mode, and for total volume size distributions (VSD, μm3 μm−2): slope (m) and correlation coefficient (r) from the linear regression, MFB (%) and χ (%) values for the 10 selected biomass-burning cases. The percentage of the 10 BB-selected cases fulfilling the high confidence condition for each proxy is also included (last row).
BB Case (Date, Time)FineCoarseTotal
mrMFB (%)χ (%)mrMFB (%)χ (%)MrMFB (%)χ (%)
7 September 2017
07:20 UTC
1.24 (0.04)0.99−6.4331.16 (0.13)0.9431.8541.19 (0.08)0.9616.245
7 September 2017
07:56 UTC
1.25 (0.03)0.996.6331.21 (0.09)0.9731.2621.22 (0.06)0.9821.150
7 September 2017
08:50 UTC
0.91 (0.09)0.97−17.2671.10 (0.08)0.9714.8620.99 (0.06)0.961.764
7 September 2017
09:22 UTC
0.97 (0.08)0.988.8671.11 (0.13)0.9316.0691.00 (0.07)0.9613.068
7 September 2017
16:00 UTC
0.63 (0.06)0.97−22.8221.12 (0.14)0.9212.1540.66 (0.05)0.94−2.241
7 September 2017
16:25 UTC
0.39 (0.08)0.87−63.9111.08 (0.18)0.8717.9150.43 (0.07)0.80−15.614
8 September 2017
09:23 UTC
1.30 (0.10)0.9837.5111.19 (0.09)0.9718.8461.28 (0.06)0.9826.532
8 September 2017
15:58 UTC
0.84 (0.08)0.97−12.8561.12 (0.09)0.9615.3620.87 (0.06)0.963.859
8 September 2017
16:24 UTC
1.27 (0.05)0.9913.8561.26 (0.05)0.9927.8461.26 (0.05)0.9922.150
Percentage of BB cases fulfilling high confidence conditions30%100%90%40%80%100%100%90%40%100%100%80%
Table 4. GRASP vs. lidar-derived retrieval of the total particle backscatter coefficient (βp(z), Mm−1 sr−1) and total volume concentration (VC(z), μm3 cm−3). Results obtained from the linear regression, i.e., m (and their error in brackets) and r, together with both MFB and χ values for those 10 selected BB cases. The profiles are averaged at the time interval of ±15 min around the sun photometer measurements.
Total Particle Backscatter Coefficient
βp(z) (Mm−1 sr−1)
Total Volume Concentration
VC(z) (μm3 cm−3)
Date, TimemrMFB (%) χ   ( % ) mrMFB (%) χ   ( % )
7 September 2017,
07:20 UTC
0.91 (0.01)0.99−3.3871.16 (0.04)0.9728.058
7 September 2017,
07:56 UTC
0.88 (0.01)0.99−9.6821.18 (0.04)0.9724.662
7 September 2017,
08:50 UTC
0.82 (0.01)0.99−21.1531.09 (0.03)0.9912.982
7 September 2017,
09:22 UTC
1.20 (0.02)0.9920.3421.58 (0.06)0.9753.03
7 September 2017,
16:00 UTC
1.01 (0.02)0.9913.7781.18 (0.02)0.9928.845
7 September 2017,
16:25 UTC
1.09 (0.03)0.9832.2521.20 (0.03)0.9845.727
8 September 2017,
09:23 UTC
1.07 (0.03)0.9835.5621.02 (0.02)0.9831.267
8 September 2017,
15:37 UTC
0.81 (0.02)0.98−18.9380.90 (0.02)0.98−8.963
8 September 2017,
15:58 UTC
0.82 (0.02)0.98−15.6431.00 (0.02)0.982.883
8 September 2017,
16:24 UTC
0.88 (0.02)0.98−7.2601.19 (0.03)0.9821.563
Percentage of BB cases fulfilling high confidence conditions100%100%100%90%90%100%100%80%
Publisher’s Note: MDPI stays neutral with regard to jurisdictional claims in published maps and institutional affiliations.

