Communication

Machine Learning-Based Approach Using Open Data to Estimate PM2.5 over Europe

1
Department of Geomatics, Faculty of Civil Engineering, Czech Technical University in Prague, 166 29 Prague, Czech Republic
2
Department of Applied Geoinformatics and Cartography, Faculty of Science, Charles University, 128 43 Prague, Czech Republic
*
Author to whom correspondence should be addressed.
Remote Sens. 2022, 14(14), 3392; https://doi.org/10.3390/rs14143392
Submission received: 14 May 2022 / Revised: 9 July 2022 / Accepted: 12 July 2022 / Published: 14 July 2022
(This article belongs to the Special Issue Air Quality Research Using Remote Sensing)

Abstract

:
Air pollution is currently considered one of the most serious problems facing humans. Fine particulate matter with a diameter smaller than 2.5 micrometres (PM2.5) is a very harmful air pollutant that is linked with many diseases. In this study, we created a machine learning-based scheme to estimate PM2.5 using various open data such as satellite remote sensing, meteorological data, and land variables to increase the limited spatial coverage provided by ground-monitors. A space-time extremely randomised trees model was used to estimate PM2.5 concentrations over Europe, this model achieved good results with an out-of-sample cross-validated R2 of 0.69, RMSE of 5 μg/m3, and MAE of 3.3 μg/m3. The outcome of this study is a daily full coverage PM2.5 dataset with 1 km spatial resolution for the three-year period of 2018–2020. We found that air quality improved throughout the study period over all countries in Europe. In addition, we compared PM2.5 levels during the COVID-19 lockdown during the months March–June with the average of the previous 4 months and the following 4 months. We found that this lockdown had a positive effect on air quality in most parts of the study area except for the United Kingdom, Ireland, north of France, and south of Italy. This is the first study that depends only on open data and covers the whole of Europe with high spatial and temporal resolutions. The reconstructed dataset will be published under free and open license and can be used in future air quality studies.

1. Introduction

Air quality monitoring is one of the most important fields when it comes to the individual’s health due to the high risks related to its low quality. Fine particulate matter is an air pollutant that consists of liquid and solid molecules such as acid condensates, sulphates, and nitrates that have negative effects on human health [1]. The harmful effects of these particles vary depending on the concentrations, time exposure, and the particulate diameter. Risks are higher when the diameter gets smaller; PM2.5 can penetrate deep into the lungs and may reach the blood circulation causing dangerous diseases such as cardiovascular problems, diabetes, prenatal disorder, and even mortality [2,3,4,5]. The effects are more notable in urban areas, where higher population density can be found, and more exposure will occur [6]. The form of the urban area plays an important role in the concentration of PM2.5 [7].
The U.S. Environmental Protection Agency (EPA) has set an annual average standard of 12 μg/m3 and a daily (24 h) of 35 μg/m3 for PM2.5 and when the amounts of these pollutants in the ambient air exceed these limits that could cause serious health issues [8]. The revised Directive 2008/50/EC of the European Parliament (EP) and of the Council on ambient air quality and cleaner air for Europe set limit values of annual PM2.5 to 25 μg/m3 since 1 January 2015 and not to exceed 20 μg/m3 since 1 January 2020. PM2.5 ground-based monitors are used to measure PM2.5 with high accuracy. These stations are considered the backbone in almost all analyses related to these particles. However, the high cost of establishing these monitors limits the overall spatial coverage and the researchers who are focusing on air quality were seeking new methodologies to increase the spatial coverage so they have a better understanding on larger geographical scales. Numerous techniques were used to increase PM2.5 spatial coverage, in other words, to estimate the pollutant concentrations in the areas where no monitors exist. Examples of that are interpolation techniques that count only on the ground stations [9,10]. The accuracy of these interpolations is highly related to the spatial distribution of the stations; although they can have good estimations in the areas that are surrounded by the network stations, they will probably fail to have good estimations where there is a lack of the stations [9]. Land use regression (LUR) models were also used to analyse pollution, particularly in densely populated areas [11,12].
Satellite remote sensing provides wide spatial coverage compared to the spatial coverage obtained from ground monitors. Aerosol optical depth (AOD) is an air quality indicator that can be observed from satellite remote sensing, and it is defined as the measure of the columnar atmospheric aerosol content. Numerous studies have found a positive correlation between satellite-based AOD and surface particulate matter [13,14]. Researchers have utilised satellite AOD to estimate PM2.5 by developing different types of models such as physical models that were built based on the physical relationship between AOD and surface PM2.5 [15]. Statistical methods which train the relationship between AOD and PM2.5 using different statistical models [16,17] are suitable for the regions with a sufficient number of ground stations since they require a large amount of training data [18]. The generalised additive model (GAM) empowers the AOD–PM relationship by adding meteorological and land use information [19]. In the last few decades, artificial intelligence models have been applied to estimate PM2.5 and were found to give a better description of the complex non-linear relationship between PM2.5, AOD, and other independent variables than the previously mentioned methods [18] based on the usage of machine learning algorithms [20,21,22] or deep neural networks [23,24]. These algorithms utilise satellite observations, various modelled meteorological variables, population, land use, land cover, etc., to estimate PM2.5. The importance of the inputs differs from one area to another, but generally, they can enhance PM2.5 estimations since counting solely on AOD to estimate near-surface particulate matter values is not sufficient [25]. AOD without other variables was not enough to provide good PM2.5 estimations over Europe [26]. In Great Britain, AOD was not among the 15 most important variables when predicting PM2.5 levels [20]. Satellite AOD are more correlated with surface PM when the aerosols are well mixed within the planetary boundary layer height (PBLH) [9]. A global study found that 69% of the total AOD are within the PBLH [27], other studies have shown that temperature plays an important role in capturing AOD and understanding its vertical distribution that improve PM analysis [28]. Moreover, a higher humidity atmosphere is likely to have higher AOD without affecting the levels of PM2.5 [9]. Other meteorological variables that affect PM2.5 are the precipitation that showed a negative correlation in some areas [29] and a positive correlation in other parts of the world [30], and wind speed (WS) that also has different effects from one area to another [30,31].
In this study, we report the modelling of spatiotemporal heterogeneity of PM2.5 using machine learning to generate daily estimations of PM2.5 over the European Union member states, together with the United Kingdom, Iceland, Liechtenstein, Norway, Switzerland, Albania, Bosnia and Herzegovina, Kosovo, Montenegro, North Macedonia, and Serbia [32]. We will refer to the area of study as “Europe” located inside the coordinates box 26°W, 72°N, 42°E, and 36°S. The total study area covers 13,391,504 of 1 km grid cells; 5,450,009 of the total cell number are located over land. The study period covers the years 2018–2020 with full coverage of 1 km spatial resolution using various open data. In the following sections, we will introduce the study area and period and present the preliminary data that were tested while building the predicting model.

2. Primary Data

In this section, we will introduce the primary data we investigated while building the model. Not all these data were utilised while building the model. The chosen data can be found in Section 3.3.

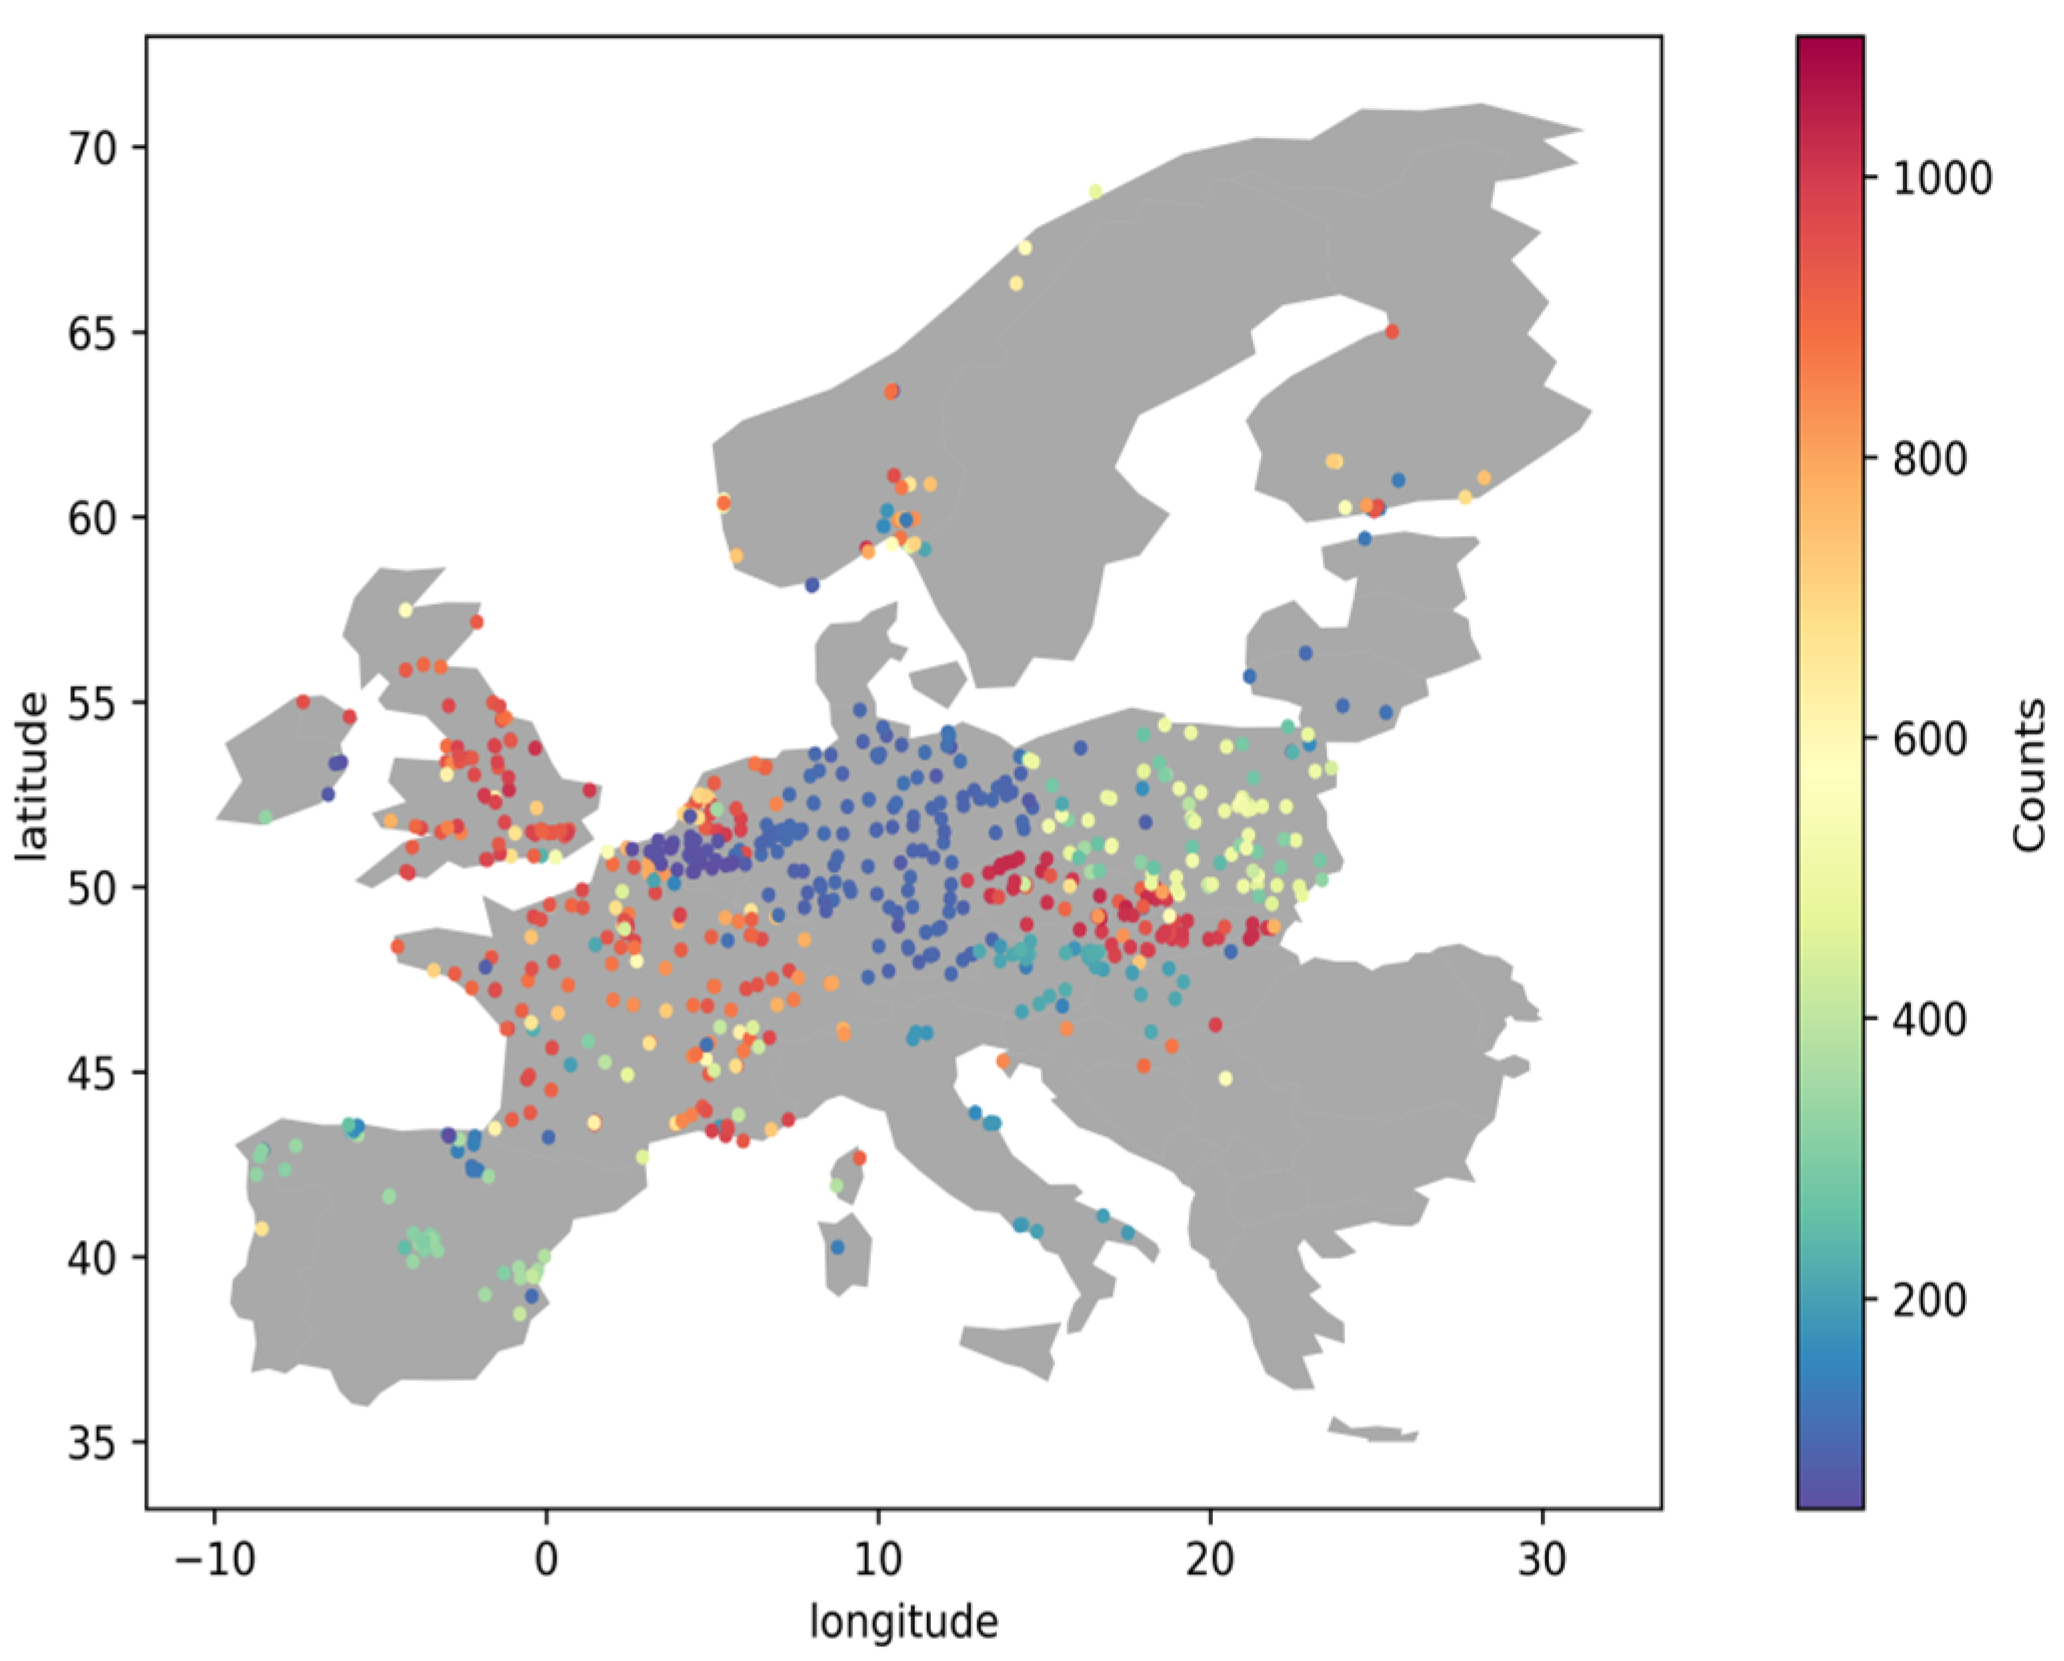
2.1. PM2.5 Measurements

PM2.5 observations were collected from 848 stations across Europe represented in Figure 1. Data was downloaded from OpenAQ which is a non-profit organisation that collects air quality data from different governmental and research institutions and provides it to the users [33].
For each station, data between 10 a.m. and 2 p.m. local time were averaged where there are at least 2 available observations to be consistent with MODIS satellites overpassing. We identified a skewed distribution for PM2.5 as shown in Figure 2, we calculated the 25th percentile (Q1), the 75th percentile (Q2) of the dataset, and the inter-quartile range (IQR = Q3 − Q1). All PM2.5 values that are higher than 2 × (Q3 + 3 × IQR which is refer as outer fence [34]) were removed, which counted less than 1% of the total data. The number of valid PM2.5 observations was 123,248 in 2018, 143,048 in 2019, and 158,964 in 2020 totalling 425,260 observations throughout the study period.

2.2. AOD Data

AOD data were downloaded from GHADA, which is a Geo-Harmonized Atmospheric Dataset for Aerosol optical depth at 550 nm [35]. It contains daily estimations of AOD550 over Europe with 1 km spatial resolution. GHADA was built based on the MODIS MCD19A2 product [36] and modelled AOD data from Copernicus Atmosphere Monitoring Service (CAMS) [37] that were used to overcome the high percentage of gaps found in the MCD19A2 product. This dataset showed good results when validated with NASA’s Aerosols Robotic Network (AERONET).

2.3. Meteorological Data

Meteorological data of the following variables wind component u, wind component v, PBLH, total column water vapour, total perception, evaporation, surface pressure, and temperature at 2 m (T2m) were collected from ERA5-Land which is a reanalysis dataset offering a consistent view of the development of land parameters over several decades with a spatial resolution of ~9 km. ERA5-Land was produced by replaying the land component of the European Centre for Medium-Range Weather Forecasts ERA5 climate reanalysis [38]. Relative humidity was collected from ERA5 with 0.25 × 0.25 horizontal resolution.

2.4. Digital Elevation Model

The Japan Aerospace Exploration Agency (JAXA) provides a worldwide digital surface model with a horizontal resolution of ~30 m by the Panchromatic Remote-sensing Instrument for Stereo Mapping (PRISM), which was carried on the Advanced Land Observing Satellite “ALOS” [39]. Data were accessed on the 8 March 2021 from https://www.eorc.jaxa.jp/ALOS/.

2.5. Normalised Difference Vegetation Index

MODIS Terra satellite provides a monthly normalised difference vegetation index (NDVI) product called MOD13A3 [40]. It has 1 km spatial resolution, and it quantifies vegetation presence with values ranging between −1 and 1. NDVI is commonly expressed as shown in Equation (1):
NDVI   = NIR Red NIR + Red
where NIR and Red are spectral reflectance values in the near-infrared and red wavelengths.

2.6. Land Cover

Land cover data were extracted from the 2018 CORINE Land Cover (CLC) inventory that was built based on ortho-rectified satellite images having a spatial resolution ranging from 5 m to 60 m and were aggregated into 100 m. We grouped the original 44 CLC classes into seven level 1 classes defined as: agricultural areas, artificial areas, continues urban areas, discontinues urban areas, forests, industrial areas, and water surfaces. Then, we calculated the percentage of each class in every 1 × 1 km2 grid cell.

2.7. Population Data

Population data was extracted from the Visible Infrared Imaging Radiometer Suite (VIIRS) night-time lights (NTL) data by averaging the monthly data of the year 2019.

3. Methodology

3.1. Data Pre-Processing

All data were reprojected to the European Terrestrial Reference System 1989 (EPSG:3035) that uses metres as measuring units. This system is used for statistical mapping and other purposes which requires a true area representation, using a 1 km grid cell with bilinear interpolation method for ECMWF data and the cubic convolution for the ALOS elevation model. In addition, we calculated WS based on the two wind U and V components.
A spatio-temporal dataset was created by extracting the information from all input data at the locations of PM2.5 stations. The Julian day, month, and year were added as the temporal information; longitude and latitude were added as the spatial information. The generated dataset was used to train and test the model.

3.2. Model Development

We first analysed the linear relationship between the primary independent variables and PM2.5 values. PBLH was negatively correlated to PM2.5 with Pearson correlation of r = −0.24. Most of the meteorological variables were also negatively related to PM2.5 with r = −0.2 for WS, r = −0.15 for T2m, r = −0.13 for RH, and r = −0.1 for TP. AOD and evaporation had the highest positive correlation with PM2.5 r = 0.14. Based on this initial data exploratory analysis, we excluded some primary inputs that had high correlation with other inputs such as skin temperature, which was correlated to T2m with r = 0.93. We tested linear models to estimate PM2.5. These models suffered from underfitting issues and failed to describe the relationship between the independent variables and PM2.5. Therefore, we used a more complex algorithm called Extremely Randomised Trees (ET).
ET is a very similar decision tree-based ensemble method to the widely used Random Forest (RF). Both algorithms are composed of large number of trees, where the final decision is obtained from the prediction of every tree by majority vote in classification problems and arithmetic average in regression problems. Both algorithms have the same growing tree procedure and selecting the partition of each node. Additionally, both algorithms randomly choose a subset of input features.
ET, on the other hand, strongly randomises the selection of both attribute and cut point while splitting a tree node using the whole learning sample to grow the trees which adds randomisation, making it a more robust algorithm against overfitting. From computational point of view, the complexity of the tree growing procedure is on the order of N log N with respect to learning sample size [41]. The main parameters in the ET splitting process are the number of attributes that are randomly selected at each node and the minimum sample size for splitting a node. For further information on how the ET algorithm operates refer to Table 1 in [41]. In addition to accuracy, the ET algorithm has higher computational efficiency than the RF algorithm since it chooses the splits randomly and does not look for the optimum split as the latter one [41]. The number of estimators (number of trees in the forest), the maximum depth of the trees, the number of samples required to split an internal node, and the minimum number of samples required to be at a leaf node were the main parameters while tuning our model.
To reduce model complexity due to the large number of independent variables we excluded the input variables based on the feature importance in the ET algorithm. Besides the spatio-temporal information, we used PM2.5 with the independent variables that are shown in Table 1 to develop our model.

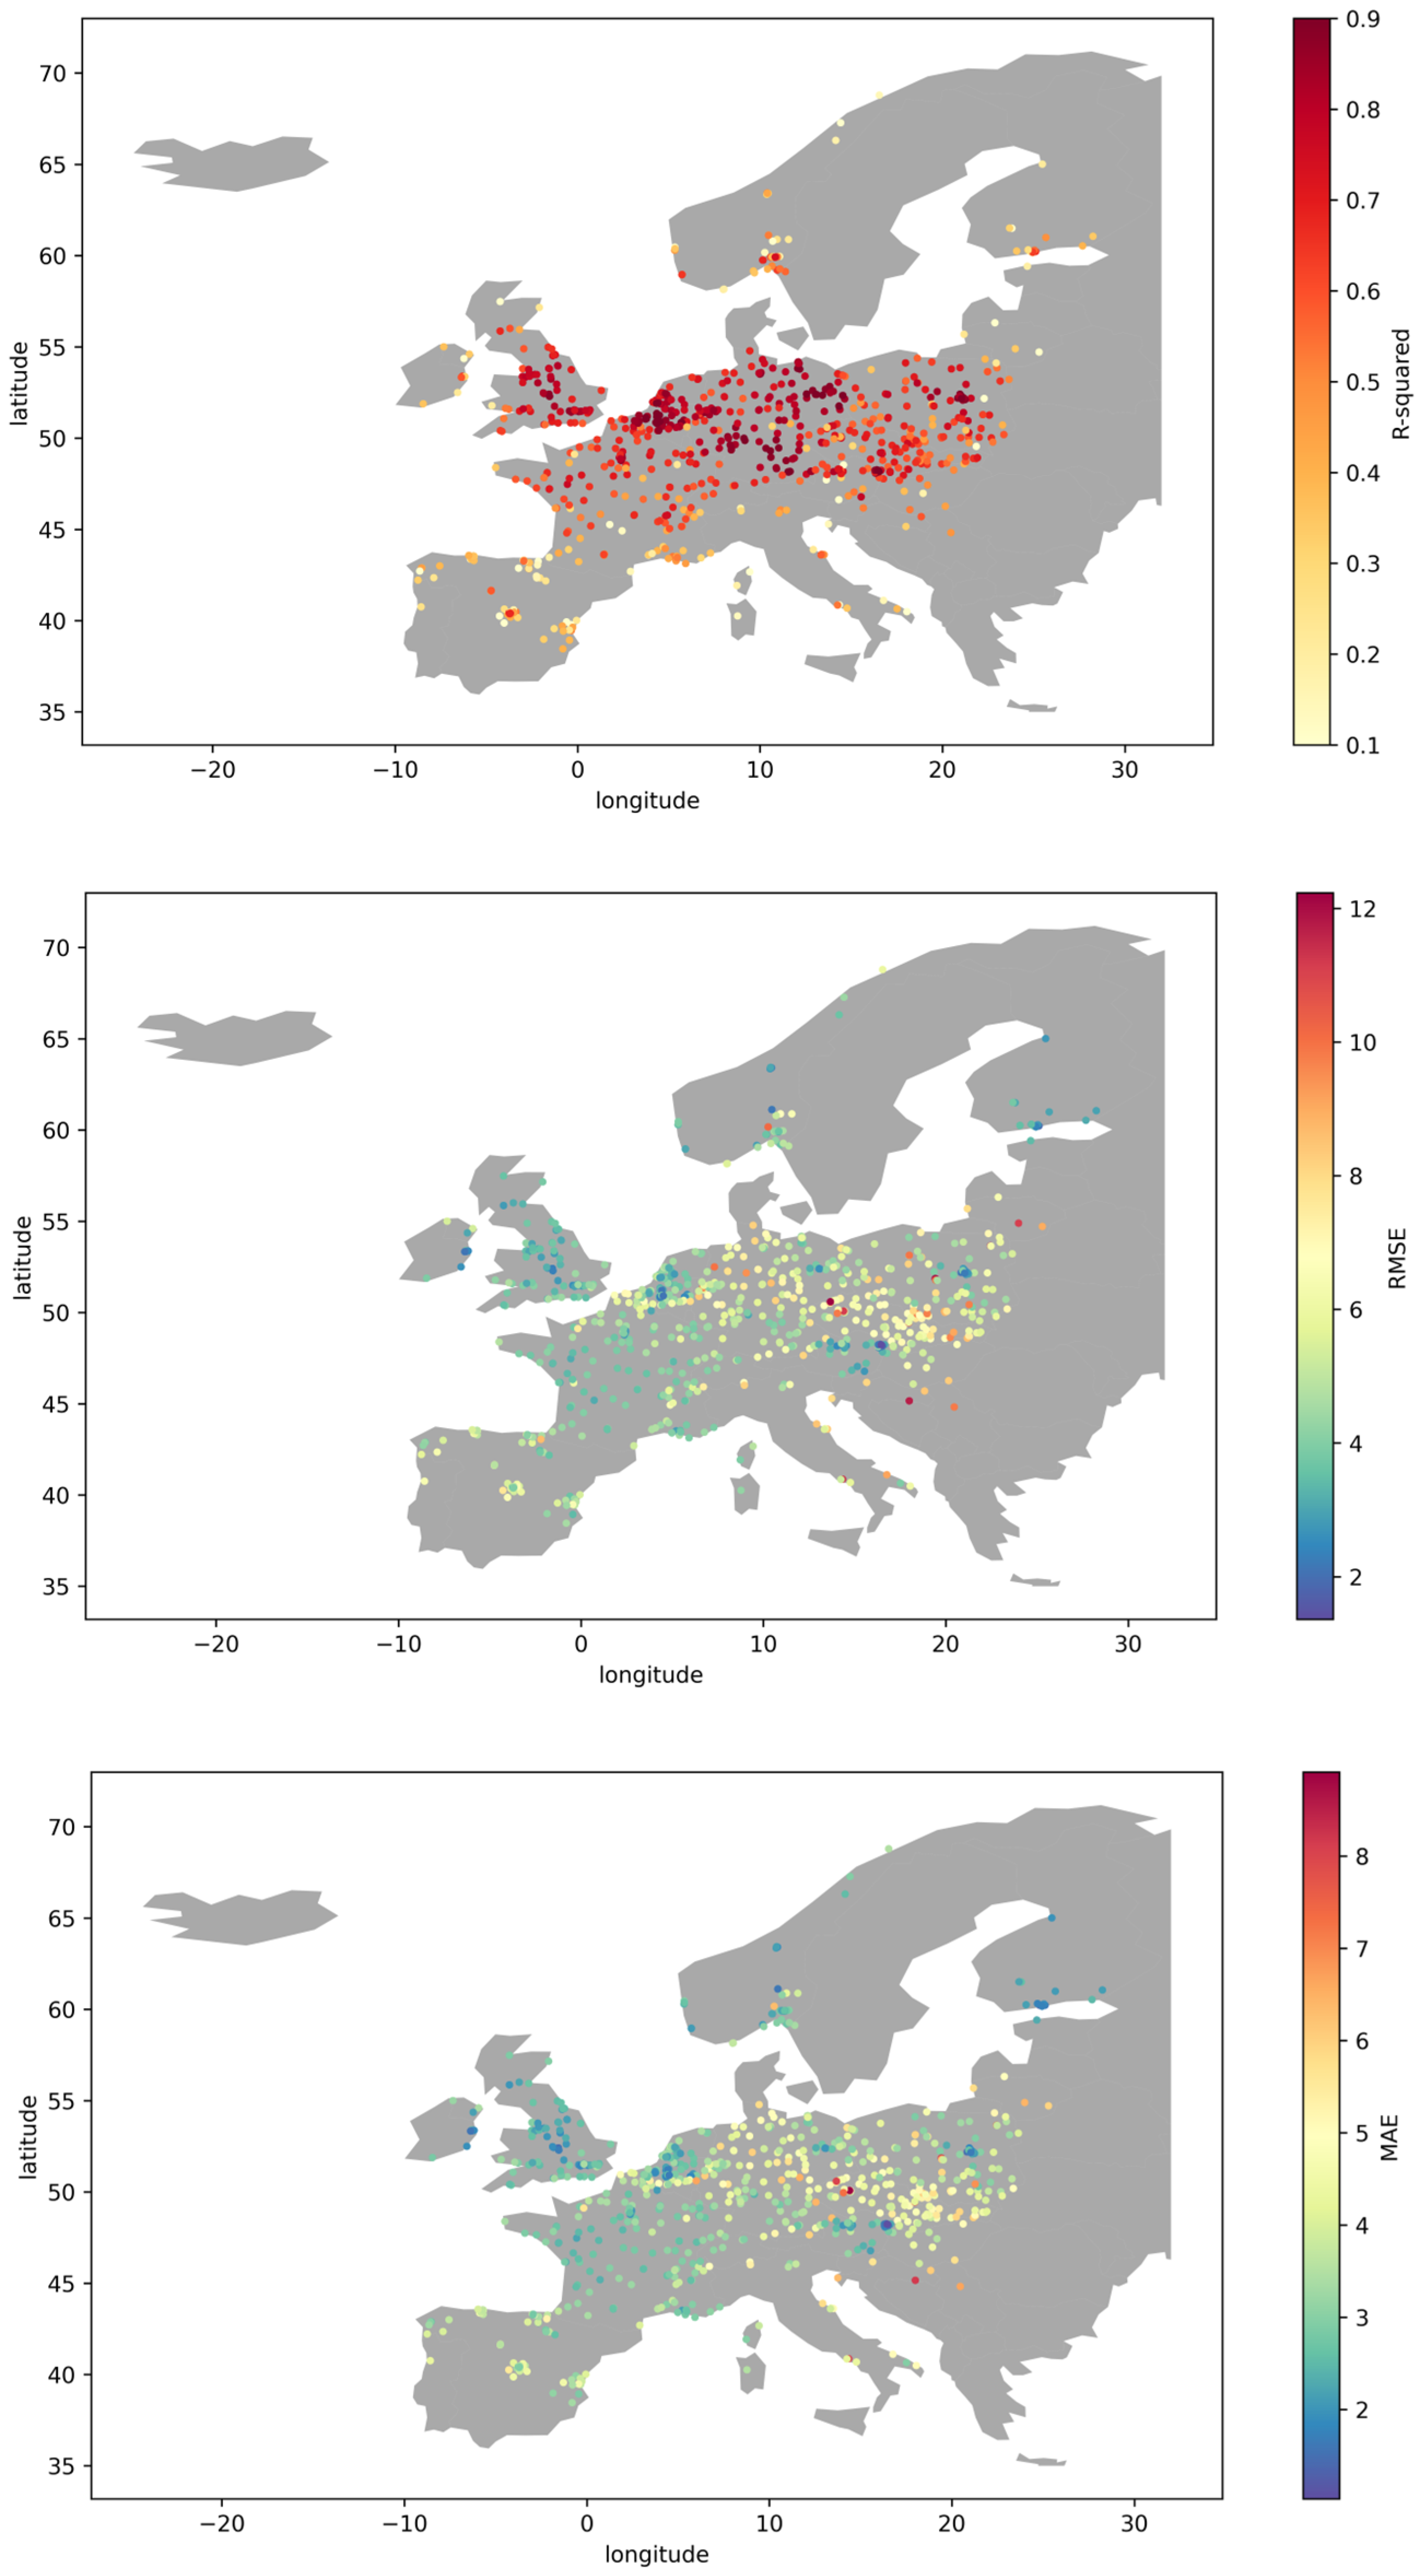
3.3. Model Validation

3.3.1. Sample-Based Cross Validation

Cross validation (CV) is a common method to analyse the model performance and detect potential overfitting problems where the model achieves high accuracy on the training set and performs badly on new data or the test set. We applied a 10-fold CV where all samples in the training dataset were randomly divided into 10 equal subsets. Then, in each round, 9 subsets were used to fit the model, and the remaining subset was used for testing the model performance [42]. This approach is used widely in PM studies [20,21,43,44,45].

3.3.2. Spatial and Temporal 10-Fold Cross Validation

In this validation, we divided the samples based on two factors. For the spatial 10-fold cross validation we splatted the data based on the location of the stations, the stations were divided randomly into 10 folds. In each fold, the model was trained on the samples from 90% of the stations and the samples from the remaining 10% for testing. For the temporal 10-fold cross validation, we divided the samples into 10 folds based on the Julian day and applied the cross validation in a similar way to the previously mentioned one.

4. Results

The results of sample-based, spatial, and temporal 10-fold cross validation are shown in Table 2. The density scatter plot for the sample-based cross validation is shown in Figure 3.
It must be noted that PM2.5 levels in general are low in Europe when compared to more polluted areas and this is reflected by the low RMSE we obtained in our study when compared to some studies outside Europe with higher R2 values [44,45]. Our model proved its efficiency in predicting PM2.5 when our results (out-of-sample R2 = 0.69, RMSE = 5 μg/m3) were comparable with results obtained from a recent study over a smaller geographic area in Europe (Great Britain; out-of-sample R2 = 0.77, RMSE = 4 μg/m3) [20]. It is also noted that the model underestimates high PM2.5 values (>40 μg/m3) since such values are not abundant over our study area.
To justify the difference in the model performance spatially and temporally, we applied site-based cross validation where we used samples from one station as the test set, and the samples from all remaining stations were used to train the model. We applied this method to analyse the model performance spatially, since the standard 10-CV may not be able to detect potential spatial overfitting [18].
The results are shown in Figure 4. The model performs well in most of the locations in Central Europe with an average R2~0.7. A total of 63% of all stations in Europe have R2 > 0.6. The accuracy of the model is lower in the northern and southern parts of Europe. However, the RMSE and MAE are relatively small even in the northern and southern parts.

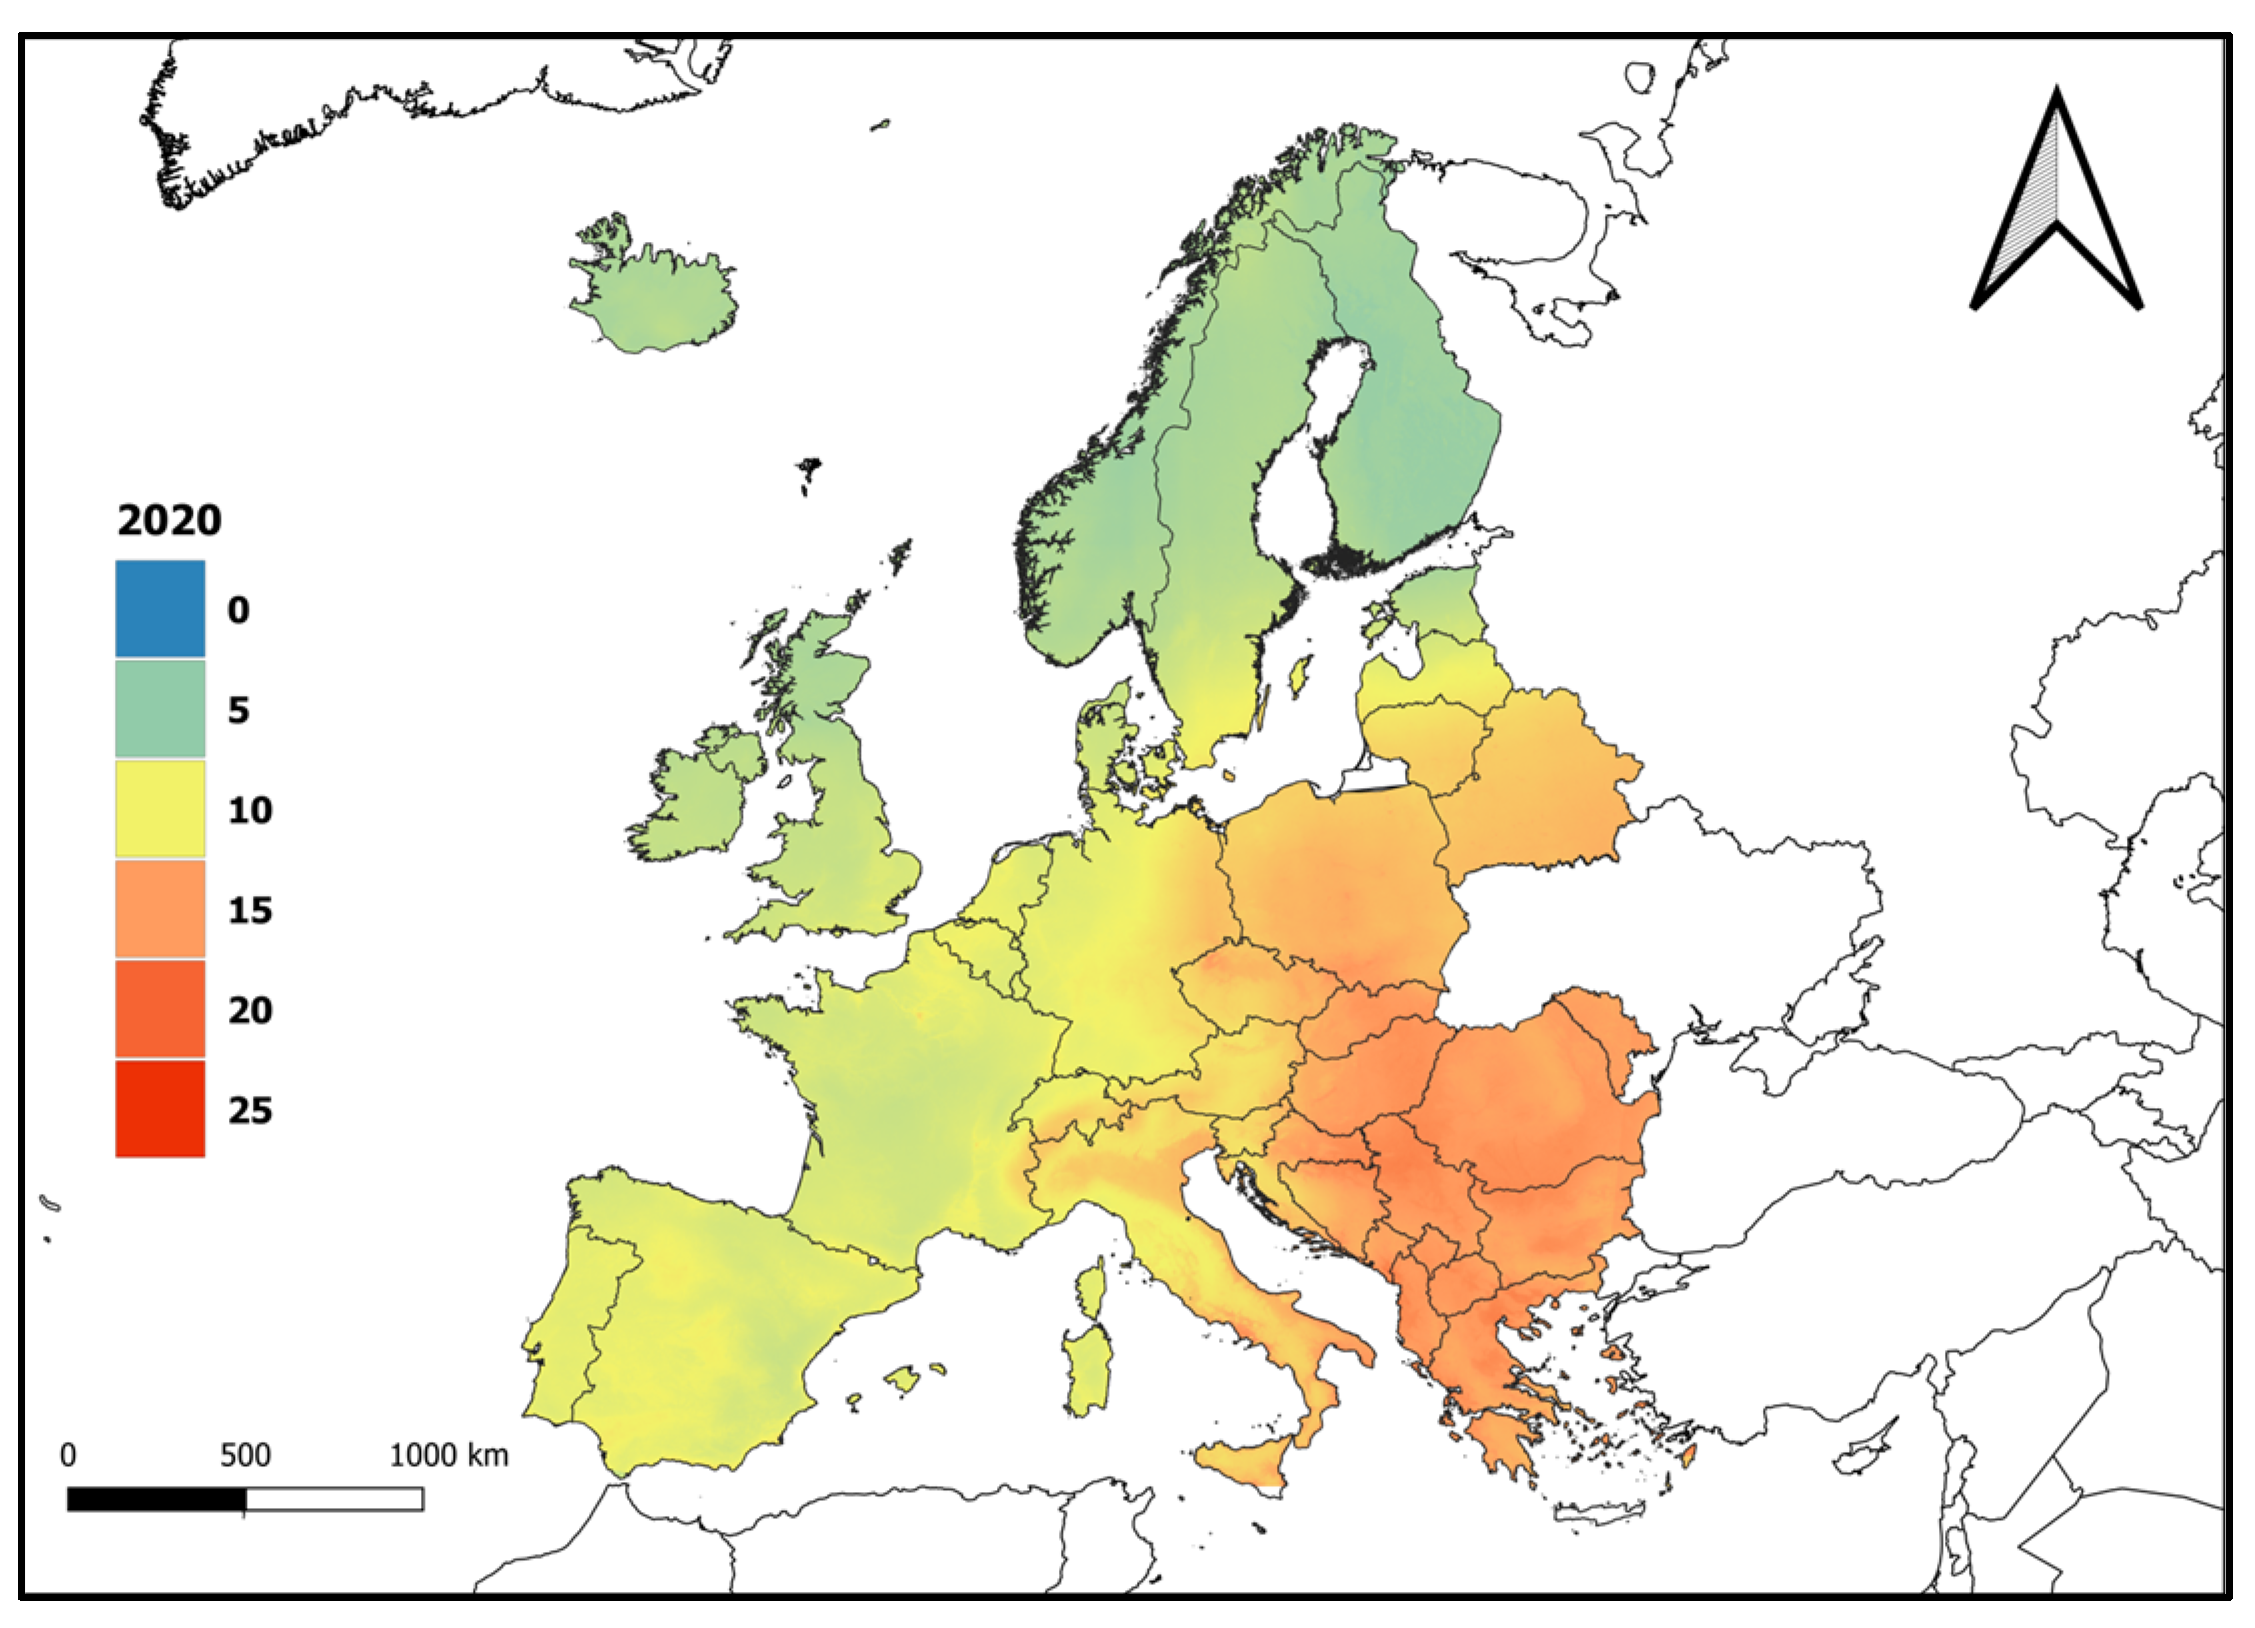
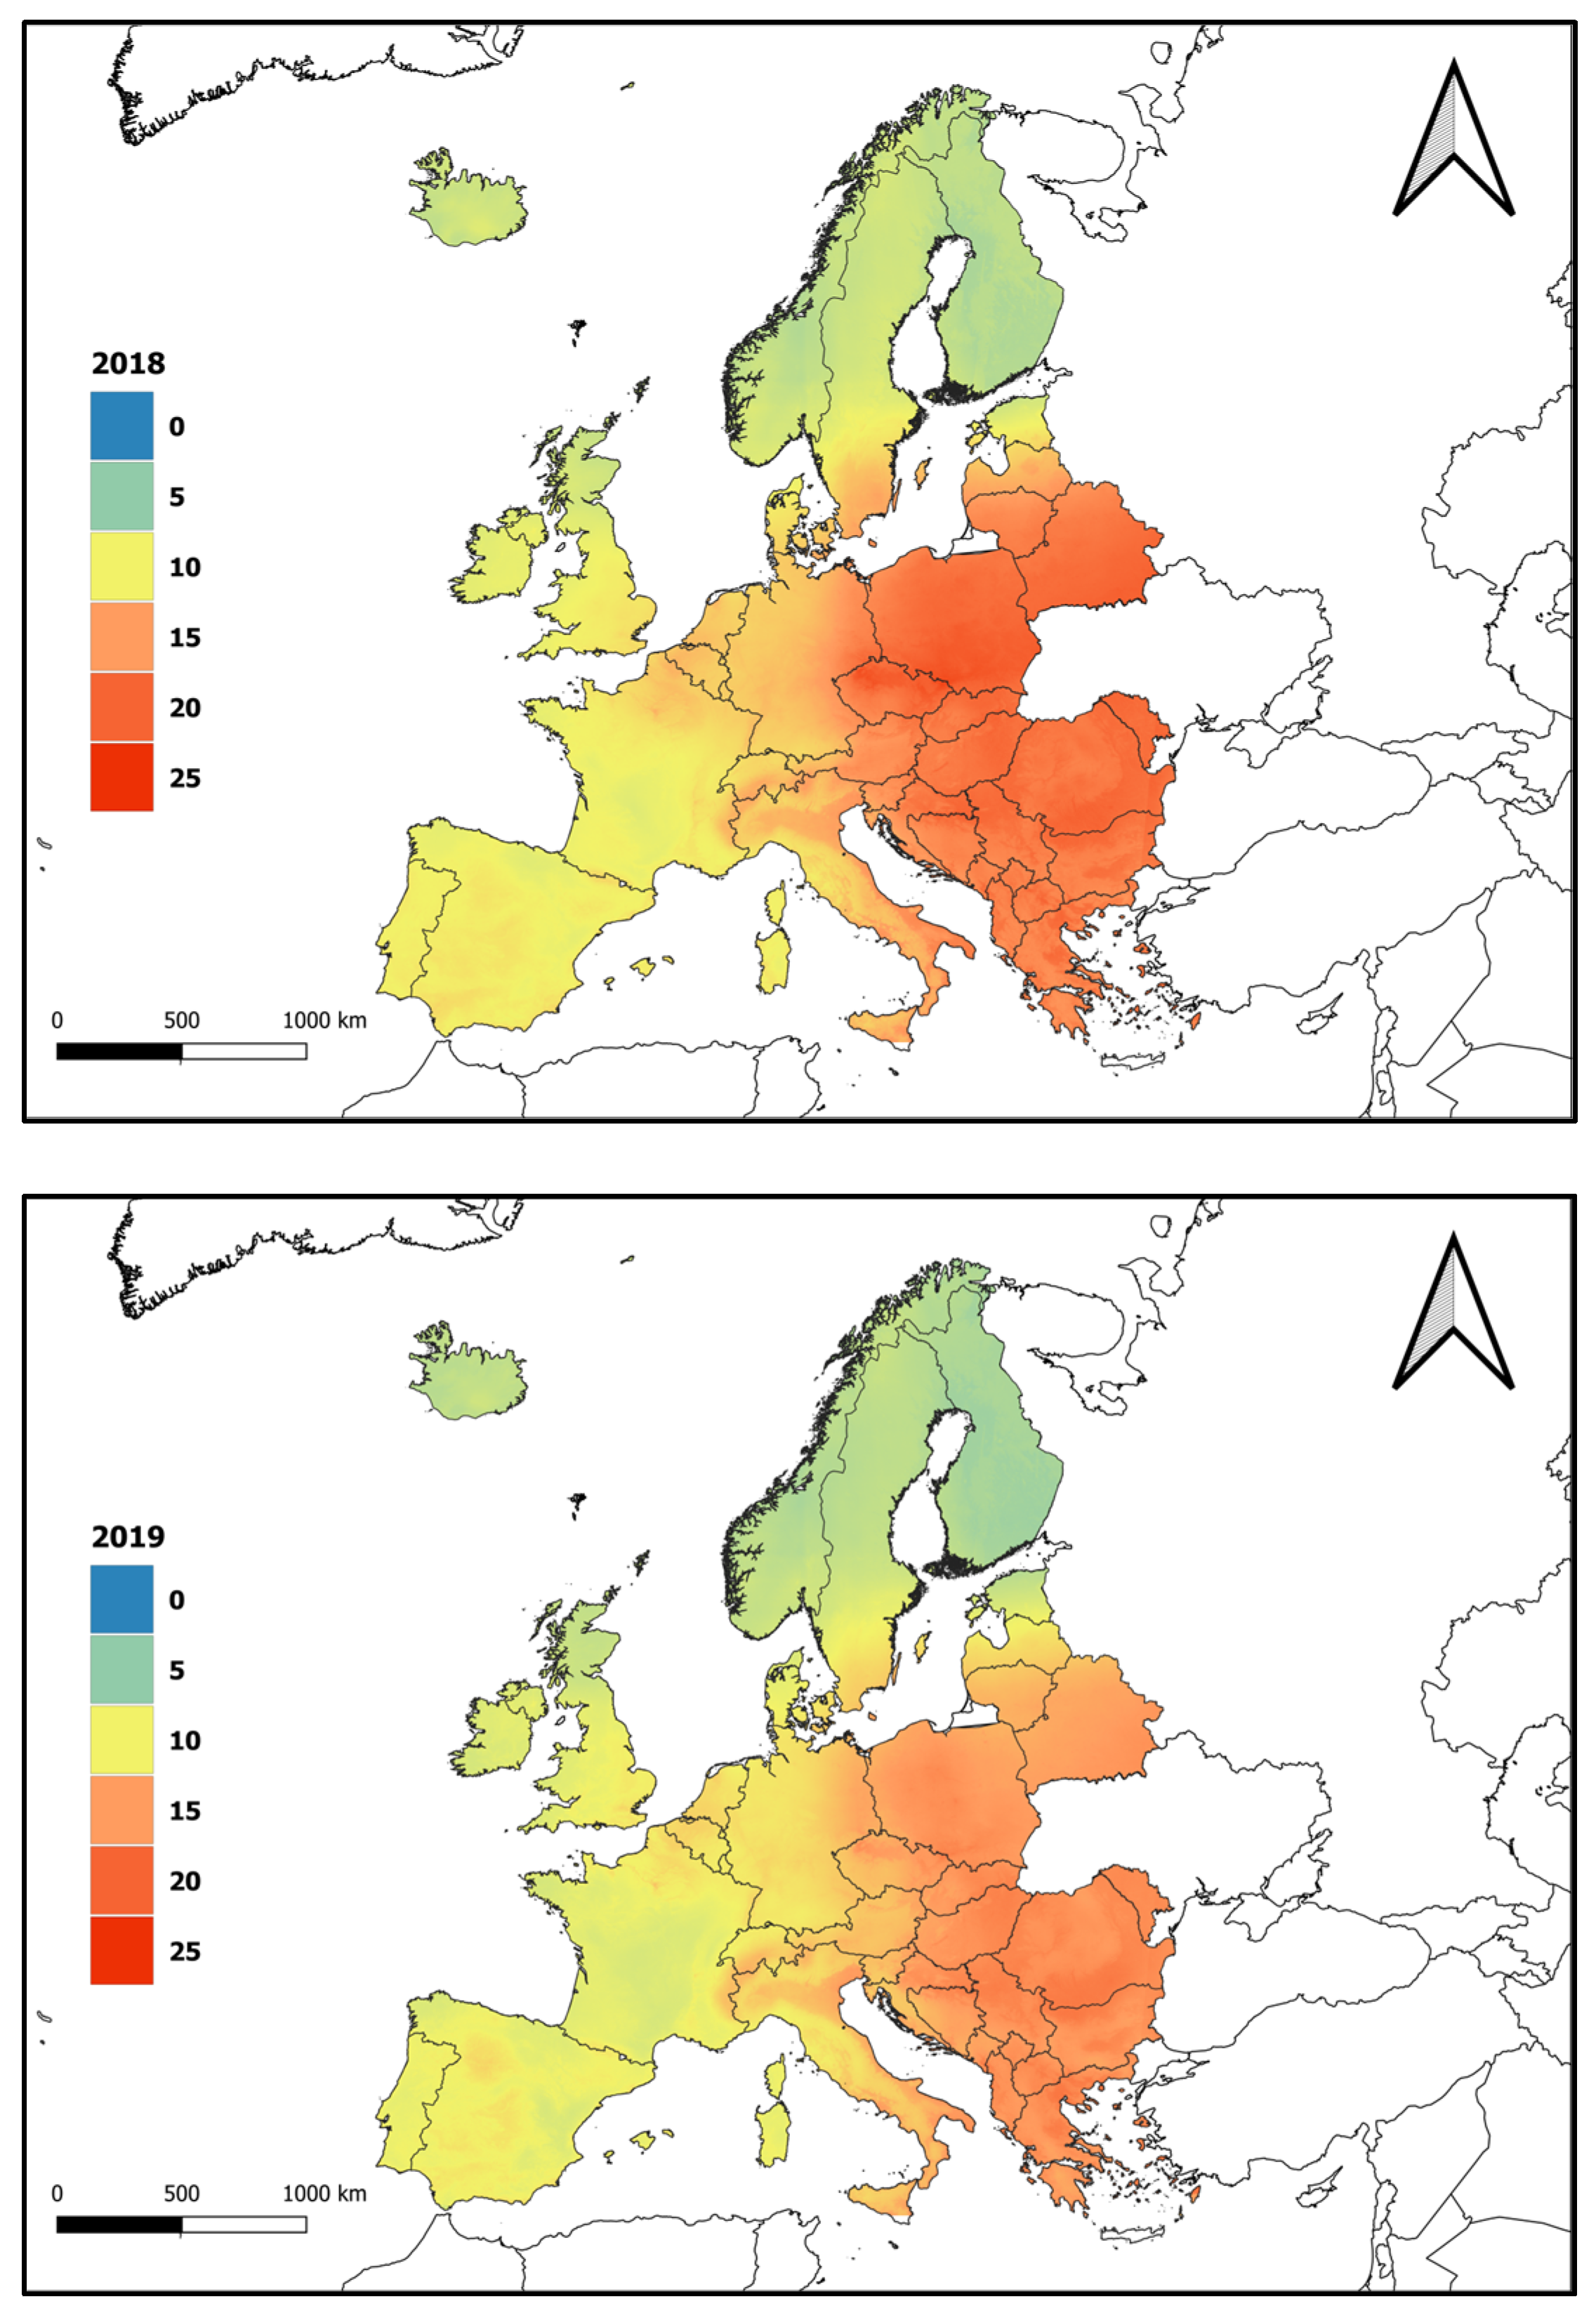
5. Creating PM2.5 Maps

Daily PM2.5 maps during MODIS satellite overpassing were created for the period 2018–2020 over Europe. Figure 5 shows the average PM2.5 for the year 2018, 2019, and 2020.
A significant decline in PM2.5 levels has occurred over Europe throughout the study period. Poland had the highest PM2.5 average level in the year 2018 with an average level~19.5 μg/m3, in 2019 Romania had the highest average~16.5 μg/m3 whereas Serbia had the highest average in 2020 with an average~15.8 μg/m3. Finland had the lowest PM2.5 average level in all three years with 7.1 in 2018, 6.3 in 2019, and 5.8 in 2020. Comparing the results of the average PM2.5 levels for the years 2018, 2019, and 2020 were highly compatible with the reports of the European Environment Agency (EEA). According to EEA the highest PM2.5 concentrations were found in central and eastern Europe and northern Italy. For the central and western parts, the main reason for high PM2.5 is the usage of solid fuels with older vehicle compared to other parts of Europe [46], besides using the solid fuels for heating as was found in Poland [47]. For the northern part of Italy, the high levels of PM2.5 are due to the combination of a high density of anthropogenic emissions and meteorological conditions [46,48]. Furthermore, Milan, the largest city in the north of Italy previously reported levels of PM2.5 exceeding the safety limit set by the EU [49].
As an application, we used the proposed machine learning-based prediction approach in PM2.5 levels analysis to study the effect of the COVID-19 lockdown (March to June of the year 2020) on air quality over Europe. As an attempt to verify the influence of the lockdown on air quality, we compared the average PM2.5 of the previous 4 months (November to December in 2019 and January to February 2020) and the following 4 months (July to October 2020) to the 4 months of the lockdown by calculating the relative percentage difference (RPD). By doing so, we masked the general improvement trend in air quality over Europe. RPD calculated using Equation (2).
RPD = PM 2.5   ( lockdown )   PM 2.5   avg ( before   lockdown , after   lockdown ) PM 2.5   avg ( before   lockdown , after   lockdown )   ×   100
We found a significant improvement in air quality over Europe except for UK, Ireland, north of France, and south of Italy as shown in Figure 6. Our results are in agreement with another study over Poland (Eastern Europe), where the air quality represented by PM2.5 has significantly improved in the months of March to April in 2020 when the authors compared to the same months from the previous two years [50]. Interestingly, the unusual increase in PM2.5 levels in the UK was consistent with what was reported in [51] as the authors justified such increase by unusual meteorological conditions. The latter conditions may also justify the increase in PM2.5 over northern France. In Italy, where people were spending most of their time at home, the increased house heating during the lockdown period limited the decrease in PM2.5 levels besides the effects of the agriculture sector that kept performing during the lockdown [52].

6. Discussion

In this study, we proposed the first machine learning-based scheme to estimate PM2.5 levels over Europe with high spatial resolution of 1 km. We trained an extra trees model using observed PM2.5 from 848 stations as the target variable. AOD, different meteorological variables, land variables, and NDVI as the independent variables.
The sample-based 10-fold CV showed that our model underestimates high PM2.5 values (>40 μg/m3) which may limit the model ability to detect hazard situations. This underestimation occurred since high PM2.5 values were not common over our study area as shown in Figure 2. The spatial cross validation showed that the model estimates PM2.5 with a higher R2 in the areas with high ground stations density the compared to the areas with a lower density. The occurred spatial overfitting is expected to happen due to spatially unbalanced data.
In Central Europe (Czech Republic, Poland, Slovakia, and surrounding areas), the model performed with a higher R2 compared to the northern and southern parts of Europe. However, the RMSE in Central Europe was comparably higher than the ones in the previously mentioned parts. This is due to the fact that the average PM2.5 value in Central Europe is higher and have more variations than the northern and southern parts. The highest RMSE in Central Europe can be found in three stations in the Czech Republic. These stations are located near mining areas with higher PM2.5 values compared to other stations that are mostly located in urban areas. This issue can be potentially solved by including a detailed land cover data with an appropriate classification for each station which is usually difficult to achieve on a large scale such as in our study.
Having unbalanced spatial-temporal data made the modelling more complex than other studies which focused on smaller areas with well-balanced data and with similar instruments in measuring PM2.5 values. However, by tuning the parameters in the model, we were able to achieve acceptable results for most parts of our study area. The effect of the chosen independent variables in estimating PM2.5 differs across the study area. We analysed the spatial potential relationships of the independent variables in estimating PM2.5 by calculating feature importance in four parts of Europe: north-west (latitude > 50 and longitude < 10), north-east (latitude > 50 and longitude > 10), south-west (latitude < 50 and longitude < 10), and south-east (latitude < 50 and longitude > 10). AOD and PBLH had the most feature importance in all parts of Europe with an average of 10.4% and 14.1%, respectively. WS and temperature had more effect in estimating PM2.5 in the south of Europe compared to the north. Rh had more importance in estimating PM2.5 in the western part of Europe compared to the eastern part.
Table 3 shows the effects of AOD and the most important meteorological variables on PM2.5 estimates. We tried to train multiple models based on the area. However, this approach did not improve the overall performance over the whole study area.

7. Conclusions

In this study, we developed a spatio-temporal machine learning model to estimate daily PM2.5 levels for the years 2018–2020 with 1 km spatial resolution over Europe using open data from multiple sources such as remote sensing satellite-based products, meteorological reanalysis datasets, and other land variables.
The developed model was used to estimate PM2.5 values over 5,450,009 land cells (1 km2) for a 3-year period (1096 days) totalling more than 5.973 billion estimations with a good sample-based CV coefficient of 0.69, RMSE of 5 μg/m3, and MAE of 3.3 μg/m3.
We calculated the yearly average of PM2.5 levels, and we found that PM2.5 values have dropped in almost all parts of Europe during the study period.
The full coverage dataset of PM2.5 that we produced can be used to investigate air quality over Europe with higher spatial resolution compared to the available products which may provide better understanding in time series analysis in this field.

Author Contributions

Conceptualization, S.I.; Data curation, S.I.; Formal analysis, S.I., M.L., O.P. and L.B.; Funding acquisition, M.L.; Investigation, S.I.; Methodology, S.I., L.B. and L.H.; Project administration, M.L. and L.H.; Resources, S.I. and L.H.; Software, S.I., M.L. and O.P.; Supervision, L.H.; Validation, S.I.; Visualization, S.I.; Writing—original draft, S.I.; Writing—review & editing, S.I., M.L., O.P., L.B. and L.H. All authors have read and agreed to the published version of the manuscript.

Funding

This work is co-financed under the Grant Agreement Connecting Europe Facility (CEF) Telecom project 2018-EU-IA-0095 by the European Union and by the Grant Agency of the Czech Technical University in Prague, grant No. SGS22/047/OHK1/1T/11.

Data Availability Statement

The data and data analysis methods are available upon request.

Acknowledgments

The authors sincerely thank the OpenAQ organisation for providing PM2.5 observations, NASA EOSDIS for providing the daily MODIS MAIAC AOD product (MCD19A2) which was used to build GHADA and that is available from the Land Processes Distributed Active Archive Centre (LPDAAC), the European Centre for Medium-Range Weather Forecasts (ECMWF) for providing global reanalysis of atmospheric composition, and the Japan Aerospace Exploration Agency (JAXA) for providing the digital surface model used in this study.

Conflicts of Interest

The authors declare no conflict of interest.

References

  1. Li, L.; Losser, T.; Yorke, C.; Piltner, R. Fast Inverse Distance Weighting-Based Spatiotemporal Interpolation: A Web-Based Application of Interpolating Daily Fine Particulate Matter PM2.5 in the Contiguous U.S. Using Parallel Programming and k-d Tree. Int. J. Environ. Res. Public Health 2014, 11, 9101–9141. [Google Scholar] [CrossRef] [PubMed]
  2. Crippa, M.; Janssens-Maenhout, G.; Guizzardi, D.; Van Dingenen, R.; Dentener, F. Contribution and uncertainty of sectorial and regional emissions to regional and global PM2.5 health impacts. Atmos. Chem. Phys. 2019, 19, 5165–5186. [Google Scholar] [CrossRef] [Green Version]
  3. Pascal, M.; Falq, G.; Wagner, V.; Chatignoux, E.; Corso, M.; Blanchard, M.; Host, S.; Pascal, L.; Larrieu, S. Short-term impacts of particulate matter (PM10, PM10–2.5, PM2.5) on mortality in nine French cities. Atmos. Environ. 2014, 95, 175–184. [Google Scholar] [CrossRef]
  4. Liu, C.; Chen, R.; Sera, F.; Vicedo-Cabrera, A.M.; Guo, Y.; Tong, S.; Coelho, M.S.Z.S.; Saldiva, P.H.N.; Lavigne, E.; Matus, P.; et al. Ambient Particulate Air Pollution and Daily Mortality in 652 Cities. N. Engl. J. Med. 2019, 381, 705–715. [Google Scholar] [CrossRef]
  5. Martins, N.R.; da Graça, G.C. Impact of PM2.5 in indoor urban environments: A review. Sustain. Cities Soc. 2018, 42, 259–275. [Google Scholar] [CrossRef]
  6. Baklanov, A.; Molina, L.T.; Gauss, M. Megacities, air quality and climate. Atmos. Environ. 2016, 126, 235–249. [Google Scholar] [CrossRef]
  7. Mao, X.; Wang, L.; Pan, X.; Zhang, M.; Wu, X.; Zhang, W. A study on the dynamic spatial spillover effect of urban form on PM2.5 concentration at county scale in China. Atmos. Res. 2022, 269, 106046. [Google Scholar] [CrossRef]
  8. Environmental Protection Agency 40 CFR Part 50 Review of the National Ambient Air Quality Standards for Particulate Matter. Available online: https://cfpub.epa.gov/ncea/ (accessed on 19 December 2021).
  9. Lee, H.J. Advancing Exposure Assessment of PM2.5 Using Satellite Remote Sensing: A Review. Asian J. Atmos. Environ. 2020, 14, 319–334. [Google Scholar] [CrossRef]
  10. Deng, L. Estimation of PM2.5 spatial distribution based on kriging interpolation. In Proceedings of the First International Conference on Information Sciences, Machinery, Materials and Energy, Chongqing, China, 11–13 April 2015; Volume 126. [Google Scholar] [CrossRef] [Green Version]
  11. Vienneau, D.; De Hoogh, K.; Beelen, R.; Fischer, P.; Hoek, G.; Briggs, D. Comparison of land-use regression models between Great Britain and the Netherlands. Atmos. Environ. 2010, 44, 688–696. [Google Scholar] [CrossRef]
  12. Briggs, D.J. The use of GIS to evaluate traffic-related pollution. Occup. Environ. Med. 2006, 64, 1–2. [Google Scholar] [CrossRef] [Green Version]
  13. You, W.; Zang, Z.; Pan, X.; Zhang, L.; Chen, D. Estimating PM2.5 in Xi’an, China using aerosol optical depth: A comparison between the MODIS and MISR retrieval models. Sci. Total Environ. 2015, 505, 1156–1165. [Google Scholar] [CrossRef] [PubMed]
  14. Yao, F.; Si, M.; Li, W.; Wu, J. A multidimensional comparison between MODIS and VIIRS AOD in estimating ground-level PM2.5 concentrations over a heavily polluted region in China. Sci. Total Environ. 2017, 618, 819–828. [Google Scholar] [CrossRef] [PubMed]
  15. Zhang, Y.; Li, Z. Remote sensing of atmospheric fine particulate matter (PM2.5) mass concentration near the ground from satellite observation. Remote Sens. Environ. 2015, 160, 252–262. [Google Scholar] [CrossRef]
  16. Kanabkaew, T. Prediction of Hourly Particulate Matter Concentrations in Chiangmai, Thailand Using MODIS Aerosol Optical Depth and Ground-Based Meteorological Data. EnvironmentAsia 2013, 6, 65–70. [Google Scholar] [CrossRef]
  17. Gupta, P.; Christopher, S.A. Particulate matter air quality assessment using integrated surface, satellite, and meteorological products: Multiple regression approach. J. Geophys. Res. Earth Surf. 2009, 114. [Google Scholar] [CrossRef] [Green Version]
  18. Ma, Z.; Dey, S.; Christopher, S.; Liu, R.; Bi, J.; Balyan, P.; Liu, Y. A review of statistical methods used for developing large-scale and long-term PM2.5 models from satellite data. Remote Sens. Environ. 2021, 269, 112827. [Google Scholar] [CrossRef]
  19. Liu, Y.; Paciorek, C.J.; Koutrakis, P. Estimating Regional Spatial and Temporal Variability of PM2.5 Concentrations Using Satellite Data, Meteorology, and Land Use Information. Environ. Health Perspect. 2009, 117, 886–892. [Google Scholar] [CrossRef] [PubMed] [Green Version]
  20. Schneider, R.; Vicedo-Cabrera, A.M.; Sera, F.; Masselot, P.; Stafoggia, M.; de Hoogh, K.; Kloog, I.; Reis, S.; Vieno, M.; Gasparrini, A. A Satellite-Based Spatio-Temporal Machine Learning Model to Reconstruct Daily PM2.5 Concentrations across Great Britain. Remote Sens. 2020, 12, 3803. [Google Scholar] [CrossRef]
  21. Wei, J.; Li, Z.; Cribb, M.; Huang, W.; Xue, W.; Sun, L.; Guo, J.; Peng, Y.; Li, J.; Lyapustin, A.; et al. Improved 1 km resolution PM2.5 estimates across China using enhanced space–time extremely randomized trees. Atmos. Chem. Phys. 2020, 20, 3273–3289. [Google Scholar] [CrossRef] [Green Version]
  22. Chen, G.; Li, S.; Knibbs, L.D.; Hamm, N.A.S.; Cao, W.; Li, T.; Guo, J.; Ren, H.; Abramson, M.J.; Guo, Y. A machine learning method to estimate PM2.5 concentrations across China with remote sensing, meteorological and land use information. Sci. Total Environ. 2018, 636, 52–60. [Google Scholar] [CrossRef]
  23. Xiao, F.; Yang, M.; Fan, H.; Fan, G.; Al-Qaness, M.A.A. An improved deep learning model for predicting daily PM2.5 concentration. Sci. Rep. 2020, 10, 20988. [Google Scholar] [CrossRef] [PubMed]
  24. Li, L.; Girguis, M.; Lurmann, F.; Pavlovic, N.; McClure, C.; Franklin, M.; Wu, J.; Oman, L.D.; Breton, C.; Gilliland, F.; et al. Ensemble-based deep learning for estimating PM2.5 over California with multisource big data including wildfire smoke. Environ. Int. 2020, 145, 106143. [Google Scholar] [CrossRef] [PubMed]
  25. Van Donkelaar, A.; Martin, R.V.; Brauer, M.; Kahn, R.; Levy, R.; Verduzco, C.; Villeneuve, P.J. Global Estimates of Ambient Fine Particulate Matter Concentrations from Satellite-Based Aerosol Optical Depth: Development and Application. Environ. Health Perspect. 2010, 118, 847–855. [Google Scholar] [CrossRef] [Green Version]
  26. Koelemeijer, R.; Homan, C.; Matthijsen, J. Comparison of spatial and temporal variations of aerosol optical thickness and particulate matter over Europe. Atmos. Environ. 2006, 40, 5304–5315. [Google Scholar] [CrossRef]
  27. Bourgeois, Q.; Ekman, A.M.L.; Renard, J.-B.; Krejci, R.; Devasthale, A.; Bender, F.A.-M.; Riipinen, I.; Berthet, G.; Tackett, J.L. How much of the global aerosol optical depth is found in the boundary layer and free troposphere? Atmos. Chem. Phys. 2018, 18, 7709–7720. [Google Scholar] [CrossRef] [Green Version]
  28. Liu, B.; Ma, X.; Ma, Y.; Li, H.; Jin, S.; Fan, R.; Gong, W. The relationship between atmospheric boundary layer and temperature inversion layer and their aerosol capture capabilities. Atmos. Res. 2022, 271, 106121. [Google Scholar] [CrossRef]
  29. Li, X.; Feng, Y.J.; Liang, H.Y. The Impact of Meteorological Factors on PM2.5 Variations in Hong Kong. IOP Conf. Series Earth Environ. Sci. 2017, 78, 012003. [Google Scholar] [CrossRef]
  30. Wang, J.; Ogawa, S. Effects of Meteorological Conditions on PM2.5 Concentrations in Nagasaki, Japan. Int. J. Environ. Res. Public Health 2015, 12, 9089–9101. [Google Scholar] [CrossRef]
  31. Wang, S.; Gao, J.; Guo, L.; Nie, X.; Xiao, X. Meteorological Influences on Spatiotemporal Variation of PM2.5 Concentrations in Atmospheric Pollution Transmission Channel Cities of the Beijing–Tianjin–Hebei Region, China. Int. J. Environ. Res. Public Health 2022, 19, 1607. [Google Scholar] [CrossRef]
  32. Open Data Science Europe. Geo-Harmonizer Project Implementation Plan 2020–2022; Open Data Science Europe: Wageningen, The Netherlands, 2020. [Google Scholar]
  33. OpenAQ. Available online: https://openaq.org/ (accessed on 8 May 2022).
  34. Tukey, J.W. Exploratory Data Analysis; Addison-Wesley Publishing Company: Boston, MA, USA, 1977. [Google Scholar]
  35. Ibrahim, S.; Landa, M.; Pešek, O.; Pavelka, K.; Halounova, L. Space-Time Machine Learning Models to Analyze COVID-19 Pandemic Lockdown Effects on Aerosol Optical Depth over Europe. Remote Sens. 2021, 13, 3027. [Google Scholar] [CrossRef]
  36. Lyapustin, A.; Wang, Y.; Laszlo, I.; Kahn, R.; Korkin, S.; Remer, L.; Levy, R.; Reid, J.S. Multiangle implementation of atmospheric correction (MAIAC): Part 2. Aerosol algorithm. J. Geophys. Res. 2011, 116. [Google Scholar] [CrossRef]
  37. Inness, A.; Ades, M.; Agustí-Panareda, A.; Barré, J.; Benedictow, A.; Blechschmidt, A.-M.; Dominguez, J.J.; Engelen, R.; Eskes, H.; Flemming, J.; et al. The CAMS reanalysis of atmospheric composition. Atmos. Chem. Phys. 2019, 19, 3515–3556. [Google Scholar] [CrossRef] [Green Version]
  38. Muñoz-Sabater, J.; Dutra, E.; Agustí-Panareda, A.; Albergel, C.; Arduini, G.; Balsamo, G.; Boussetta, S.; Choulga, M.; Harrigan, S.; Hersbach, H.; et al. ERA5-Land: A state-of-the-art global reanalysis dataset for land applications. Earth Syst. Sci. Data 2021, 13, 4349–4383. [Google Scholar] [CrossRef]
  39. Tadono, T.; Ishida, H.; Oda, F.; Naito, S.; Minakawa, K.; Iwamoto, H. Precise Global DEM Generation by ALOS PRISM. ISPRS Ann. Photogramm. Remote Sens. Spat. Inf. Sci. 2014, II-4, 71–76. [Google Scholar] [CrossRef] [Green Version]
  40. Didan, K. MOD13A3 MODIS/Terra Vegetation Indices Monthly L3 Global 1 km SIN Grid V006 [Dataset]. NASA EOSDIS Land Processes DAAC. 2015. Available online: https://doi.org/10.5067/modis/mod13a3.006 (accessed on 14 March 2021).
  41. Geurts, P.; Ernst, D.; Wehenkel, L. Extremely randomized trees. Mach. Learn. 2006, 63, 3–42. [Google Scholar] [CrossRef] [Green Version]
  42. Rodriguez, J.D.; Perez, A.; Lozano, J.A. Sensitivity Analysis of k-Fold Cross Validation in Prediction Error Estimation. IEEE Trans. Pattern Anal. Mach. Intell. 2009, 32, 569–575. [Google Scholar] [CrossRef] [PubMed]
  43. Li, T.; Shen, H.; Zeng, C.; Yuan, Q.; Zhang, L. Point-surface fusion of station measurements and satellite observations for mapping PM2.5 distribution in China: Methods and assessment. Atmos. Environ. 2017, 152, 477–489. [Google Scholar] [CrossRef] [Green Version]
  44. He, Q.; Huang, B. Satellite-based mapping of daily high-resolution ground PM2.5 in China via space-time regression modeling. Remote Sens. Environ. 2018, 206, 72–83. [Google Scholar] [CrossRef]
  45. Wei, J.; Huang, W.; Li, Z.; Xue, W.; Peng, Y.; Sun, L.; Cribb, M. Estimating 1-km-resolution PM2.5 concentrations across China using the space-time random forest approach. Remote Sens. Environ. 2019, 231, 111221. [Google Scholar] [CrossRef]
  46. European Environment Agency. Available online: https://www.eea.europa.eu (accessed on 19 December 2021).
  47. Baborska-Narozny, M.; Szulgowska-Zgrzywa, M.; Mokrzecka, M.; Chmielewska, A.; Fidorow-Kaprawy, N.; Stefanowicz, E.; Piechurski, K.; Laska, M. Climate justice: Air quality and transitions from solid fuel heating. Build. Cities 2020, 1, 120–140. [Google Scholar] [CrossRef]
  48. Perrone, M.G.; Zhou, J.; Malandrino, M.; Sangiorgi, G.; Rizzi, C.; Ferrero, L.; Dommen, J.; Bolzacchini, E. PM chemical composition and oxidative potential of the soluble fraction of particles at two sites in the urban area of Milan, Northern Italy. Atmos. Environ. 2016, 128, 104–113. [Google Scholar] [CrossRef] [Green Version]
  49. Perrone, M.; Larsen, B.; Ferrero, L.; Sangiorgi, G.; De Gennaro, G.; Udisti, R.; Zangrando, R.; Gambaro, A.; Bolzacchini, E. Sources of high PM2.5 concentrations in Milan, Northern Italy: Molecular marker data and CMB modelling. Sci. Total Environ. 2012, 414, 343–355. [Google Scholar] [CrossRef] [PubMed]
  50. Filonchyk, M.; Hurynovich, V.; Yan, H. Impact of Covid-19 lockdown on air quality in the Poland, Eastern Europe. Environ. Res. 2020, 198, 110454. [Google Scholar] [CrossRef] [PubMed]
  51. Jenkins, N.; Parfitt, H.; Nicholls, M.; Beckett, P.; Wyche, K.; Smallbone, K.; Gregg, D.; Smith, M. Estimation of Changes in Air Pollution Emissions, Concentrations and Exposure during the COVID-19 Outbreak in the UK; Report for The Air Quality Expert Group, on Behalf of Defra: Analysis of Air Quality Changes Experienced in Sussex and Surrey since the COVID-19 Outbreak; UK Air, Department for Food and Rural Affairs: London, UK, 2020; 57p. [Google Scholar]
  52. Pala, D.; Casella, V.; Larizza, C.; Malovini, A.; Bellazzi, R. Impact of COVID-19 lockdown on PM concentrations in an Italian Northern City: A year-by-year assessment. PLoS ONE 2022, 17, e0263265. [Google Scholar] [CrossRef]
Figure 1. The location of PM2.5 ground stations with the number of valid measurements used in this study.
Remotesensing 14 03392 g001
Figure 2. The distribution of the measured PM2.5 used in this study.
Remotesensing 14 03392 g002
Figure 3. Density scatter plot of the sample-based 10-CV results of the model.
Remotesensing 14 03392 g003
Figure 4. Spatial distribution of the site-based cross validation of coefficient of determination, the root mean square error, and the mean absolute error.
Remotesensing 14 03392 g004
Figure 5. The average PM2.5 for the years 2018, 2019, and 2020 over Europe.
Remotesensing 14 03392 g005aRemotesensing 14 03392 g005b
Figure 6. Relative percentage difference of PM2.5 for the lock down period of the year 2020 with the average of the previous 4 months and the following 4 months.
Remotesensing 14 03392 g006
Table 1. The dependent and independent variables used to build the ET model.
Name of the VariableUnitMinimumMaximumMeanSTD
PM2.5μg/m328011.819.26
Aerosol optical depth-0.013.120.130.08
PBLHm73.903420.17933.39463.59
WSm/s0.2318.123.882.13
T2mK249.86314.15287.038.17
Relative Humidity%0.04110.8268.5322.93
Total precipitationmm080.10.3
Total Column Water VapourKg/m20.9550.6116.767.88
NDVI-−0.30.730.250.12
Evaporationmm−0.7440.065−0.1640.109
Elevationm−3.88914.26151.66156.01
Table 2. R2, RMSE, and MAE of the sample-based 10-CV, spatial 10-CV, and the temporal 10-CV.
10-CVR2RMSEMAE
Sample-based0.695.03.3
Spatial0.694.93.2
Temporal0.536.14.1
Table 3. The effects (%) of AOD and the most important meteorological variables on PM2.5 estimations in the four chosen parts of our study area.
Independent VariableNorth-WestNorth-EastSouth-WestSouth-East
AOD13.258.8110.439.11
BLH15.8915.2214.9810.41
T2m8.626.2510.1310.71
Rh6.413.995.824.71
E3.585.993.447.96
WS5.184.257.325.82
TCWV4.4693.634.554.07
Publisher’s Note: MDPI stays neutral with regard to jurisdictional claims in published maps and institutional affiliations.

