Communication

Shallow Regolith Structure and Obstructions Detected by Lunar Regolith Penetrating Radar at Chang’E-5 Drilling Site

by
Jianqing Feng
1,2,*,
Matthew A. Siegler
1,2 and
Mackenzie N. White
1,2
1
Planetary Science Institute, Tucson, AZ 85719, USA
2
Department of Earth Sciences, Southern Methodist University, Dallas, TX 75205, USA
*
Author to whom correspondence should be addressed.
Remote Sens. 2022, 14(14), 3378; https://doi.org/10.3390/rs14143378
Submission received: 4 June 2022 / Revised: 7 July 2022 / Accepted: 12 July 2022 / Published: 13 July 2022
(This article belongs to the Section Satellite Missions for Earth and Planetary Exploration)

Abstract

:
This work analyzes the observations from the Lunar Regolith Penetrating Radar (LRPR) onboard Chang’E-5 to reconstruct the subsurface structure of the regolith under the lander at the drilling site. This is the first stationary Ground-Penetrating Radar (GPR) array to operate on the Moon. Imaging results of pre-drilling and post-drilling measurements show that the thickness of local regolith is larger than 2 m. Within the LRPR’s detection range, we do not find any continuous layer. Instead, irregular, high-density zones are identified in the regolith. Two of these zones are on the drilling trajectory at ~30 cm and ~70 cm, consistent with the recorded drilling process. We speculate a rock fragment from the deeper, high-density zone obstructed the drill, which led to an early termination of the drilling. Based on our interpretation of subsurface structure, we modeled the LRPR echoes using a finite-difference time-domain method. The same imaging algorithm was also applied to the simulation data. The modeled data verify our inference of the regolith structure under the lander.

1. Introduction

The Chang’E-5 (CE-5) was China’s first lunar sample-return mission. On 1 December 2020, CE-5 landed on the Moon at 43.06°N, 51.92°W and collected 1731 g of lunar regolith samples by scooping and drilling [1,2]. Studying the age and composition of these samples will constrain the impact chronology of the inner Solar System and the thermal evolution of the Moon, while researching the subsurface structures in the regolith will reveal the impact gardening history of the lunar surface. In addition to the scooper and drill, four instruments were installed on the CE-5 lander, including a landing camera (LCAM), a panoramic camera (PCAM), a lunar mineralogical spectrometer (LMS), and a lunar regolith penetrating radar (LRPR). The LRPR detects the subsurface structure of lunar regolith up to a depth of 2 m and provides supporting information for the drilling process [3,4,5]. In contrast to the Lunar-Penetrating Radars (LPR) onboard the rovers of the Chang’E-3 and Chang’E-4 missions [6,7,8], the LRPR remains stationary and produces spatially resolved radargrams with a 12-antenna array.
The landing region, in Northern Oceanus Procellarum, to the north-east of Mons Rümker, is a relatively young and flat basalt mare unit named P58 in the geologic map given by Hiesinger et al. (2011) [9] and Hiesinger et al. (2003) [10]. Figure 1a shows the location of the CE-5 landing site. The radiometric dating of returned lunar samples shows that the formation age of this unit is 2030 ± 4 million years [11]. Local basalt has an estimated TiO2 abundance of 5–8 wt.% and FeO abundance of 16.5–17.5 wt.% [12]. A degraded crater named Xu Guangqi with a diameter of ~463 m is ~400 m to the northwest of the landing site. Based on the morphologies of small fresh craters identified in high-resolution optical images, Jia et al. (2020) estimate that regolith thickness varies from ~1.5 to ~8 m with a median value of ~5 m, implying a high mean regolith growth rate over the landing region [13]. Qian et al. (2021) indicate that the regolith at the Chang’e-5 site is ~4–6 m thick, and ejecta are primarily from five proximal craters, including Xu Guangqi, dominantly with ages < 200 Ma [14]. Deeply buried distal materials are believed to originate mainly from the Harpalus, Copernicus, Aristarchus, and Mairan G craters [14]. As it is covered by multiple young ejecta deposits, the landing site is relatively rocky. Studies from LRO Diviner infrared radiometer data suggest that the rock abundance on the surface of this region is ~0.6–0.7%, which is higher than that in most highlands (~0.1–0.3%) [15]. Figure 1b illustrates a low-angle illumination Lunar Reconnaissance Orbiter (LRO) Narrow-Angle Camera (NAC) image of the CE-5 landing site, showing that many large rocks (>1 m) are exposed on the southern crater wall of Xu Guangqi.
Despite the success of sample collection, the drill of CE-5 only penetrated ~1 m into the regolith [16], and the majority of the samples were derived from 0–73.8 cm depth [1], smaller than the planned 2 m sampling depth [2]. In this study, we will examine the CE-5 LRPR data to study the subsurface structure and explore the possible reason for the shallow penetration depth of the CE-5 drill. While this obstruction did not prevent CE-5 from completing its mission, it illustrates the utility of a stationary Ground-Penetrating Radar (GPR) system to predict high-density materials.

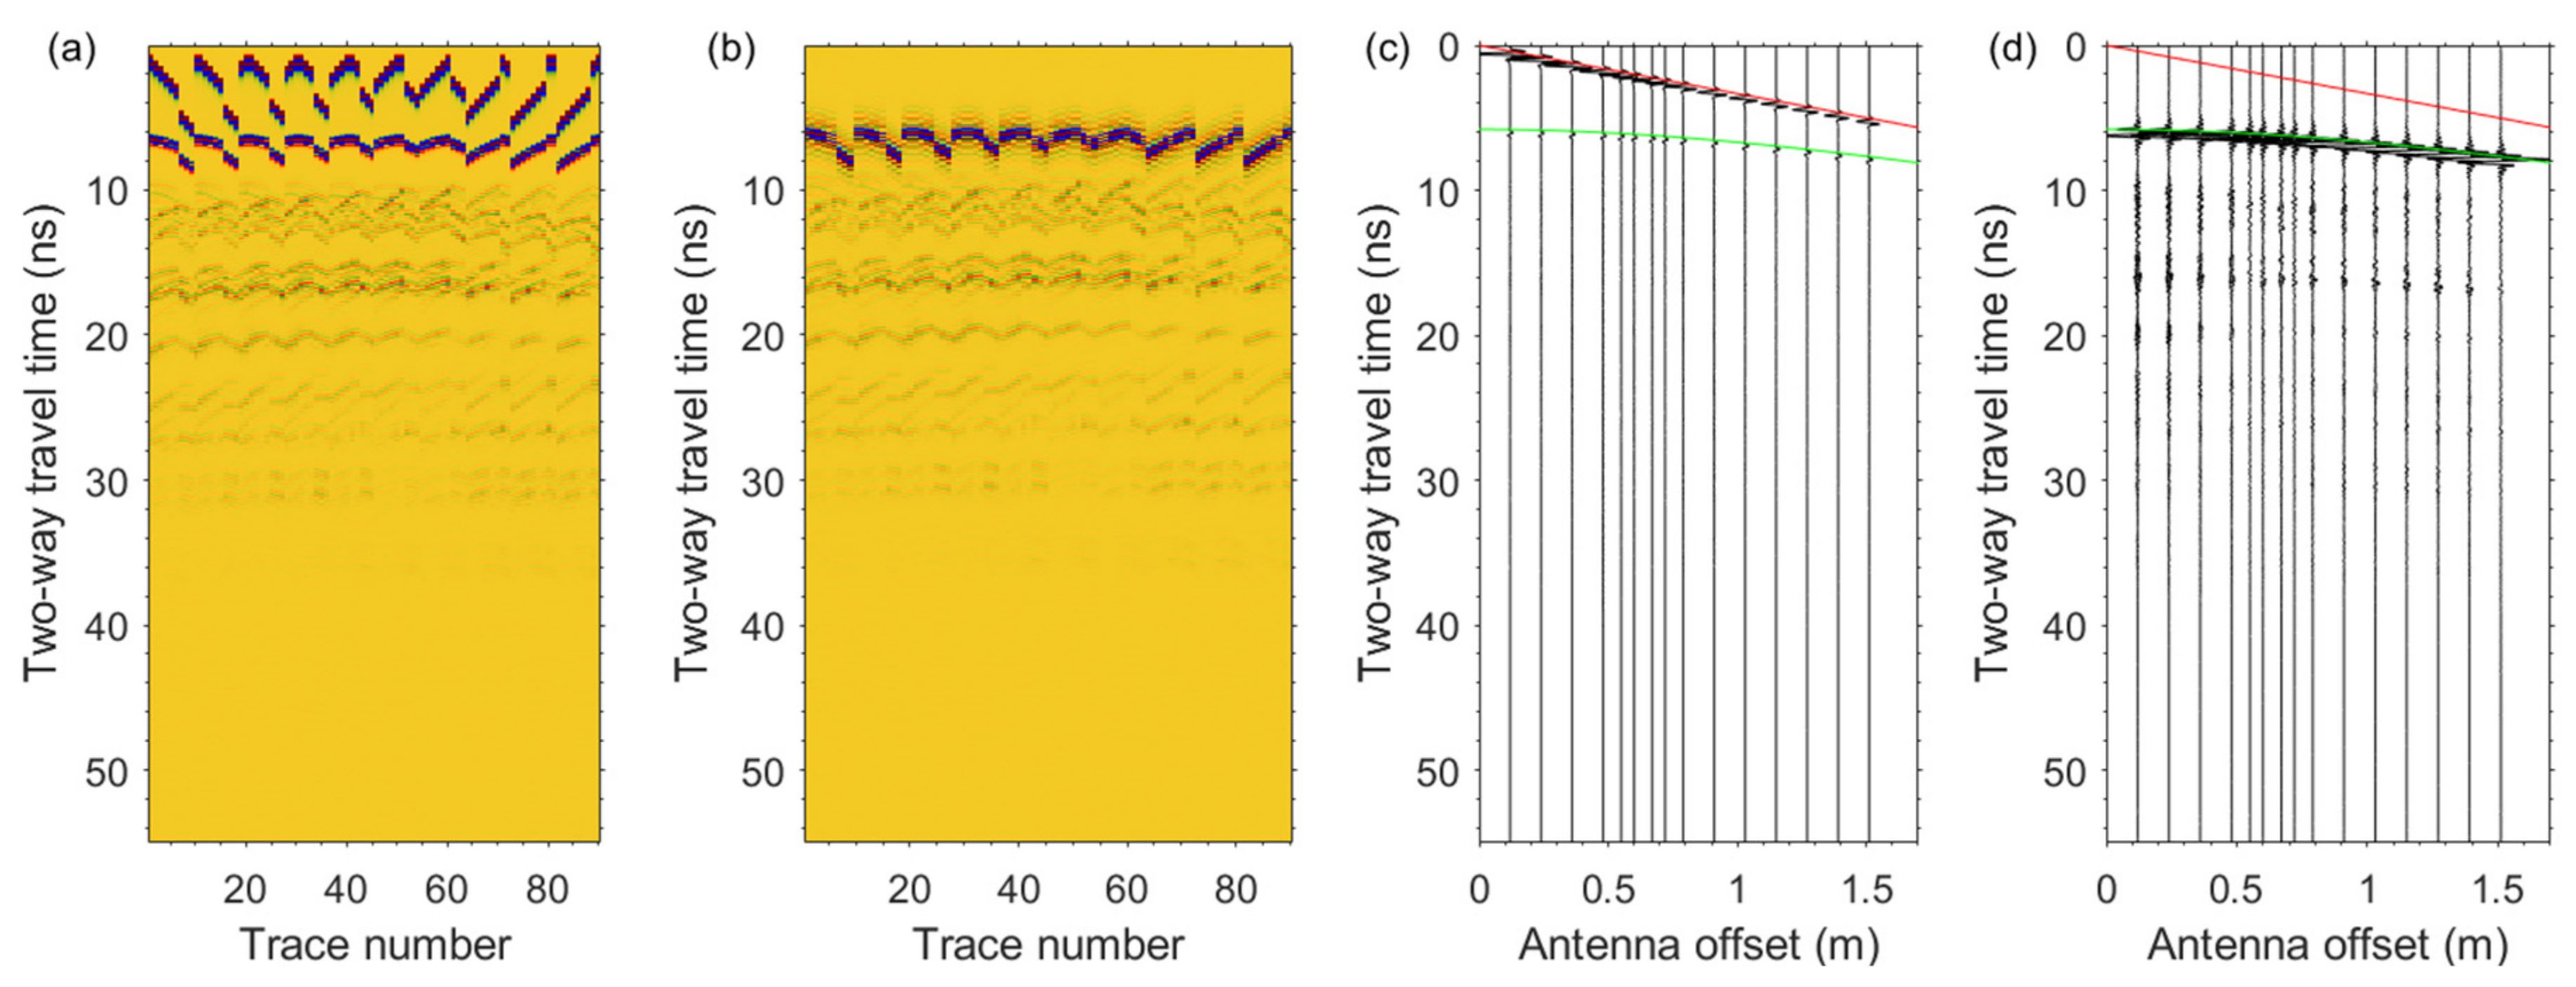
2. Measurements and Data Processing
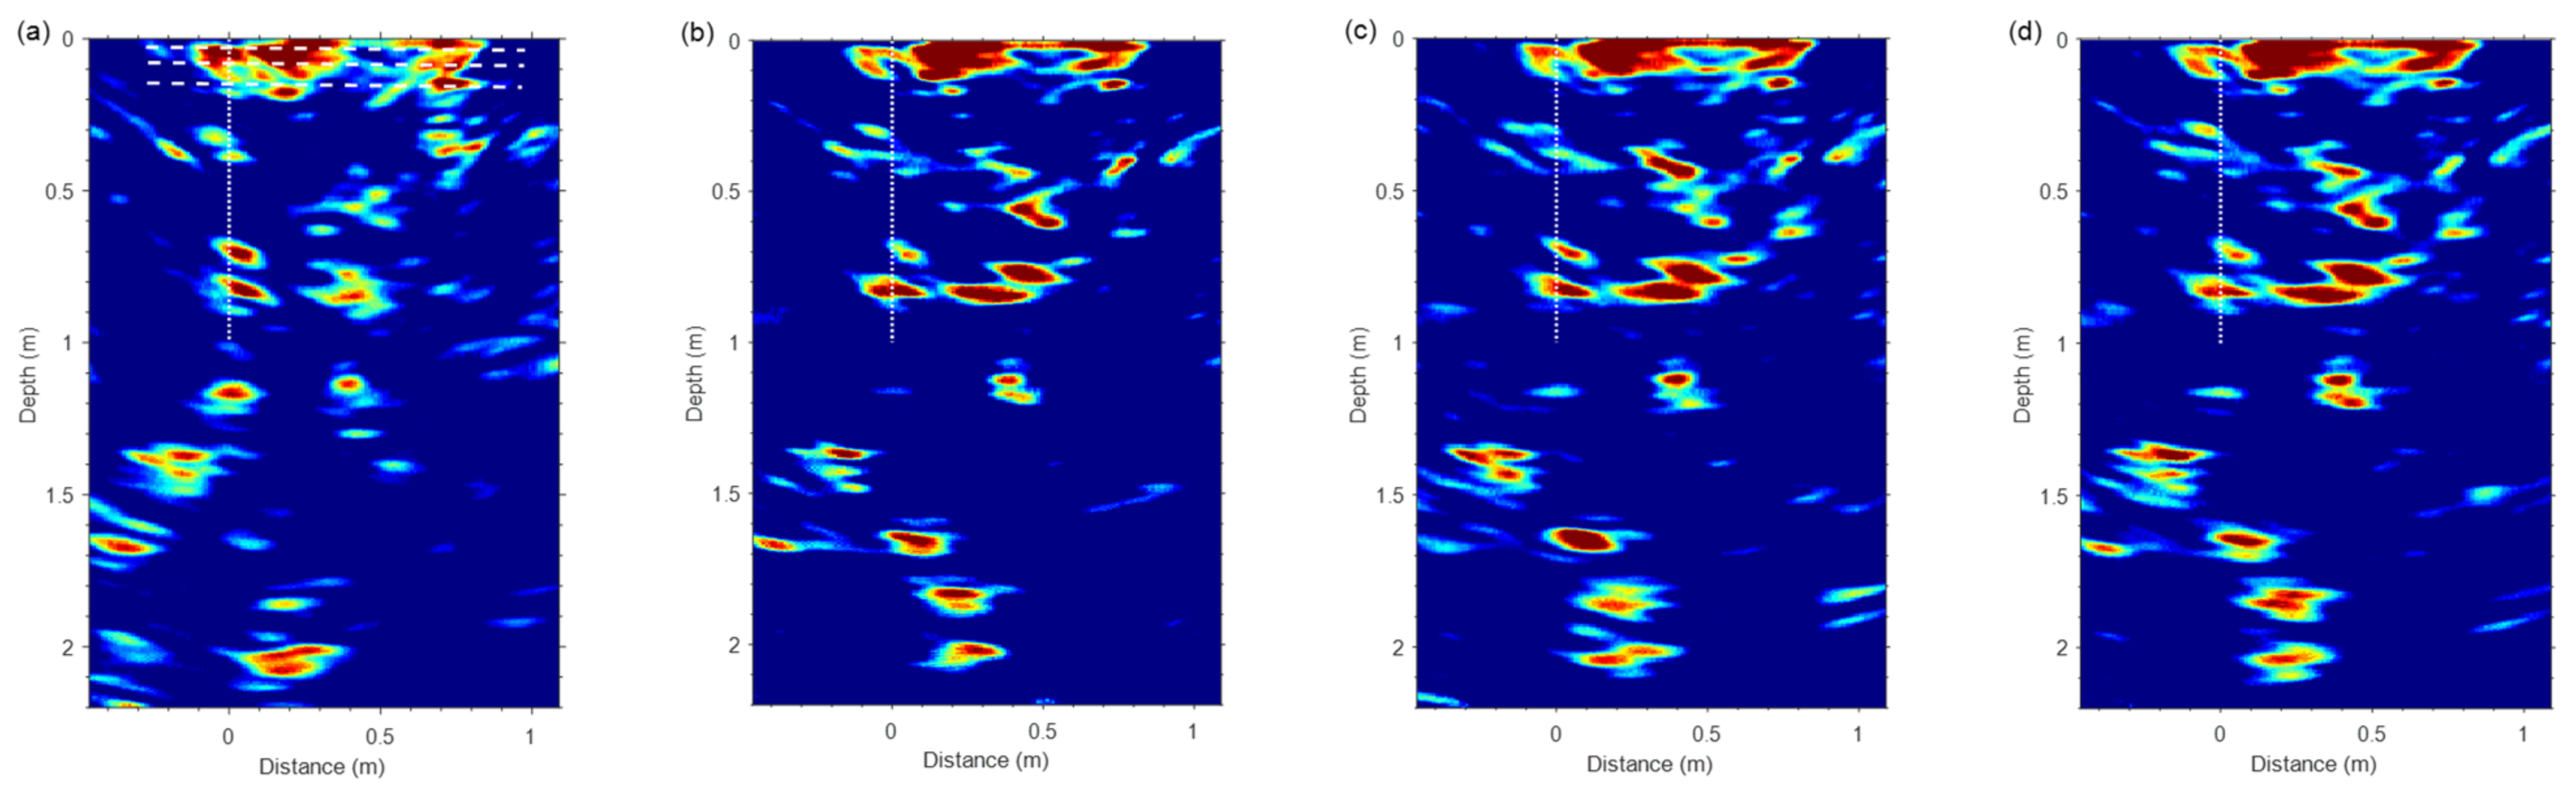
The LRPR consists of twelve Vivaldi antennas, working in the time domain at a center frequency of 2000 MHz with a bandwidth of 500 to 4000 MHz [17]. Figure 2 demonstrates the mounting positions of the twelve antennas, running behind one of the lander’s four legs. These antennas are installed asymmetrically next to the drilling device, ~88 cm above the lunar surface. The longest dimension of the antenna array is 1.518 m. Antennas #1 to #10 are aligned along one edge of the lander’s bottom with element spacing of 12 cm, and the offset between #7 and #8 is 56 cm; antennas #11 and #12 are mounted separately. As an ultra-wideband radar, the LRPR transmits carrier-free pulses with a Full Width at Half Maximum (FWHM) of 200 ps. The LRPR works with one of the antennas transmitting pulse signals into the lunar subsurface and the other eleven antennas receiving echoes. In this way, 12 antennas will produce 132 traces of radar data in one observation period. Each trace has a time window of 55 ns, collecting 3000 samples with a temporal sampling interval of 18.3 ps. The nominal vertical range resolution of LRPR is 5 cm [4,5].
The LRPR conducted seven measurements during the CE-5 mission, including three background measurements, one pre-drilling observation, and three post-drilling observations [4]. The background measurements were taken in free space before the CE-5 landed on the lunar surface. Figure 3a shows the waveform of a single trace of the pre-drilling observation raw data. The radargrams of the observation data and background are shown in Figure 3b,c.
Before imaging the subsurface structure, the data-processing steps include bandpass filtering, time-delay correction, background removal, and trace balance. The bandpass filtering was first implemented to remove low-frequency system noise and direct current bias in the signals. This was conducted in the frequency domain using Fast Fourier Transform (FFT) with a pass range of 1 to 3 GHz. For time-delay correction, the time zero position of each trace was corrected according to the theoretical arrival time of the direct wave, which would increase linearly with antenna offsets. Subsequently, the background was subtracted from the observation data to eliminate the direct waves. To achieve background removal, we align each trace in the data to its counterpart in the background by shifting the waveform in the time domain in the form of:
τ i , c = max τ ( 0 t g E i , b t E i , o t + τ d t )
where i is the trace number, τ i , c is the shifting time for observation data, t is the two-way travel time, t g is the time range for correlation calculation (smaller than the arrival time of ground-reflected waves), E i , o t and E i , b t are waveforms of observation data and background, respectively, τ is the trial shifting time, and d t is the sampling interval. Figure 4a compares the waveforms of a single trace before and after background removal. Data after 45 ns in each trace are abandoned to avoid the reflection signals from the cable-antenna interface. As the travel distance increases with antenna offset, the energy of traces become weaker. According to Feng and Sato [18], to balance the energy of each trace, we correct the amplitude of each trace by:
E i , new = f i E i , old
where E i , old and E i , new are the i-th waveforms of observation data before and after trace balancing, respectively, f i is the amplitude correction factor for each trace defined as f i = A ¯ / A i , where A i is the average amplitude of each trace calculated by A i = 1 T t = 0 T = 20 ns E i t d t . A ¯ is the average amplitude of all traces calculated by A ¯ = 1 N i = 1 N A i , where N is the total trace number. Figure 4b,c show the radargram and the wiggle form of the observation data after processing.

3. Imaging Result

The LRPR is a multi-input and multi-output (MIMO) GPR, and its antenna layout is irregular. We utilize a diffraction stack migration [19,20] for LRPR imaging because this algorithm is straightforward, flexible, and easily applicable to various antenna array layouts. It has been used in data processing for the ground test of CE-5 LRPR [3,21]. In the imaging space, the scattering intensity of the reflection at a subsurface point, I x , y , z , can be expressed by:
I x , y , z = w x , y , z E x r , y r , z r , t d x r d y r
where x , y , z and x r , y r , z r are the coordinates of each subsurface point and the receiving antenna. t is the two-way travel time of the echo from each scattering point. E x r , y r , z r , t is the collected echo on the antennas plane at time t . w x , y , z is the weighting function used to compensate for the geometrical spreading and propagation loss.
Since antenna #11 and #12 are out of the 2D imaging plane containing the drill, in this study, only the traces generated by antennas #1 to #10 are used to image the subsurface structure. We consider the x z plane is the vertical profile of the regolith. As the LRPR collects a limited number of traces in one observation, Formula (3) can be rewritten in a discrete form of I x , z = i = 1 N w x , z , i E i , t x , z , i , where i is the trace number, N is the number of traces used for imaging, and E i , t x , z , i is the echo on the i -th trace at the two-way travel time, t x , z , i . We use a cross-correlation sum to improve the imaging result to replace the simple echo summation in the equation. Additionally, the analytical signal derived by applying a Hilbert transform to the data is used for the accumulation. Thus, the imaging algorithm can be modified as follows:
I x , z = i = 1 N j = 1 , j i N w x , z , i w x , z , j [ E i , t x , z , i E j , t x , z , j + H i , t x , z , i H j , t x , z , j ]
where i and j are trace numbers, E i , t and E j , t are real parts of the analytical signals in trace i and j at t , while H i , t and H j , t are the imaginary parts of the analytical signals. w x , z , i and w x , z , j are weighting functions for echoes in trace i and j . The weighting function is determined by the signal travel distance and the attenuation coefficient. The travel time t x , z , i is a function of the subsurface point’s coordinates x , z , signal propagation geometry, and antennas’ coordinates in trace i . Snell’s law is employed to calculate the signal propagation geometry and travel time for each scattering point. Since LRPR is not a traditional movable common-offset GPR, there is no hyperbola in its radargram, and we cannot use the hyperbola fitting method to estimate the travel velocity. According to the laboratory measurements of the CE-5 lunar samples, the average permittivity and loss tangent of the regolith at 1–3 GHz at the landing site are 3.04 ± 0.02 and 0.014 ± 0.002 [4]. We use these measured values to calculate the propagation velocity and attenuation coefficient of the radar signal in the regolith. Details of the imaging method can be found in Feng et al. [21].
Figure 5a shows the imaging result of shallow regolith structure before drilling, while Figure 5b–d demonstrate the imaging results of data after drilling. The high intensity in these figures represents the strong radar echoes from buried objects with higher density than the regolith, while the relative transparent background represents fine regolith with uniform density. Within the top ~20 cm of the images, the dominated signals are reflections from the space–ground interface, which also appeared in the ground test data [21]. In the regolith deeper than 20 cm, some high-density zones are found, indicating the presence of either buried rocks or a cluster of dense fragments. Along the drilling trajectory, at a depth of ~30 cm and ~70 cm, there are two high-density zones, and the reflection at ~70 cm is stronger than that at ~30 cm. This is consistent with the pulling force and rotational torque recorded during the drilling process, which shows that the drill came across high resistance at ~30 cm and ~70 cm depth but still penetrated these structures [1]. Therefore, these structures are more likely to be aggregate fragments.
High-density zones are also present in the deeper regolith at ~1.3–2.0 m depth, as strong radar echoes are found. The three post-drilling imaging results are almost identical, while there are some differences between the pre-drilling and post-drilling images. This is probably not the structure change resulting from drilling process, because these differences not only appear on the drill trajectory but also in other regions out of the trajectory and at depths larger than 1.5 m, where the drill did not reach at all. Instead, this is most likely due to the change of the electromagnetic environment where LRPR worked. As the drill and scooper were deployed after the pre-drilling scan, the reflections from the drilling mechanism (such as drill stem) and the scooper arm might cause some clutter that seems like a structure change in the post-drilling data. In general, our imaging results in this paper agree with the work from Su et al. [4].

4. Subsurface Structure and Modeling Result

Figure 6a illustrates the structure diagram of regolith at the CE-5 drilling site based on our interpretation of the LRPR imaging results. It represents a cross-section of regolith along the red dashed line shown in Figure 6b. There is no continuous layer or bedrock–regolith interface within the LRPR’s detection range, implying that the regolith thickness is larger than 2 m. The local regolith consists of fine-grained material with some rocky regions of decimeters in size. This is consistent with the rock distribution on the surface captured by LCAM. As shown in Figure 6b, rocks of decimeters in size and aggregate fragments (indicated by black arrows) are just several meters away from the drilling site. The landscape photographed by the lander’s panoramic camera also illustrates that the lunar surface near the landing site is strewn with many small rocks (Figure 7). According to Liang et al. [16], the drilling and coring process was terminated at 1 m, possibly because a rock fragment obstructed the drill bit or internal coring mechanism. Zheng et al. [1] state that most of the Chang’E-5 drill samples were derived from 0 to 73.8 cm below the lunar surface, and few samples were extracted below 73.8 cm, as the drilling encountered several rocky regions. Therefore, we speculate that the drill penetrated two rocky regions (probably aggregate fragments) in the regolith, and a rock fragment from the deeper region obstructed the drill.
To verify the inferred subsurface structure, we apply the finite-difference time-domain (FDTD) method to model the LRPR echoes. The modeling tool used in this study is gprMax [22]. The input scenario is the subsurface structure, as given in Figure 6a. The spatial grid of the model is 5 mm × 5 mm, and the time window is 55 ns with a sampling period of 11.8 ps. The transmitted pulse in the simulation is a Ricker wavelet with a central frequency of 2 GHz. The modeling is performed in two dimensions, so only antennas #1 to #10 are included in the model. The permittivity of regolith in the model is 3, the same as CE-5 lunar samples. As the lunar basalt rock has a permittivity of 6–7 and high-density zones are a mixture of regolith and rock fragments, a permittivity of 4.5 is used for these zones in the model.
The simulated raw data are demonstrated in Figure 8a. The data processed with bandpass filtering and background removal are shown in Figure 8b. Figure 8c,d show the wiggle forms of the simulated data. In contrast to real lunar data (Figure 4b,c), the waveform of the simulated data is much “cleaner”, with less noise and clutters. This is because the transmitted pulse in the model is an ideal wavelet without any tails and there is no interference from the lander.
The imaging algorithm described in Section 3 was also implemented in the simulated data, with the imaging result given in Figure 9a. The geometric mean of four lunar measurements is shown in Figure 9b. Compared with lunar data, the ground reflection in the model also dominates the early signals but lasts a shorter time. The buried objects are focused correctly in their positions. However, like the imaging result of lunar data, the outlines of these objects are distorted and incomplete. Thicker objects appear with two strong reflections representing their top and bottom, while thinner objects are present as just one reflection. Even though these “focused” patterns in the model are not exactly the same as real data, the similarity between them implies that our inference of the lunar subsurface structure, at least the positions of rocky regions, is reasonable.

5. Discussion

In Figure 5, only strong reflections with a large extent are identified as buried objects, but there are still uncertainties about these recognitions. Since the received echoes of the LRPR include interference from the lander, such as the reflection from lander legs and the drill mechanism, the imaging results may contain clutters, especially at shallow depth. In addition, unlike normal GPR, the buried targets do not appear as hyperbola patterns in LRPR radargrams. Both cause difficulties in distinguishing artifacts and real objects. However, the radar echoes at ~70 cm are very strong and consistent with the drilling logs and the sample distribution in the drill core, so we firmly believe that there is density contrast at this depth. In addition, we exclude the possibility that a regolith/bedrock interface exists within the detection range. To study the potential reflections from such boundary, we add a bedrock layer at 1.5 m to the input scenario for FDTD model, as shown in Figure 10a. The imaging result of the FDTD model is shown in Figure 10b. It is evident that a wide, high-intensity pattern would appear at depth of the boundary, and no other radar echoes would exist below this depth. Such features are not found in the lunar data.
According to the pulling force, lifting force, and rotational torque recorded during the drilling process, the drill encountered two rocky zones at the depths of ~29–40 cm and ~70–86 cm. Our imaging results are consistent with the drilling record. However, the dissected drill core samples show that a small number of rocks was detected at the depth of ~40 cm, not exactly the depth deduced from the drilling log. We think that this is because the density in the rocky zone at 29–40 cm is not uniform. Even though the rocky zone is denser than the surrounding regolith, in the upper part of this zone, the rock debris size is relative smaller, while at bottom, both the size and abundance of the rock fragment are larger. At the depth of 70–86 cm, either a rock fragment obstructed the entrance of the drill or the inner soft tube became stuck by a small debris, so the drill obtained very little samples from this depth.
Due to the sparsity of the antenna elements, limited aperture, and the diffraction characteristics of electromagnetic waves, the horizontal resolution of the LRPR imaging result is low [23], and it is hard to tell the accurate size and outlines of the high-density zones from the ‘focused’ patterns. This is supported not only by the FDTD modeling in Section 4 but also by the results from the ground test [3,5,21]. Therefore, Figure 3a just gives the approximate extent of rocky regions in the regolith. We estimate that the high-density zone at ~30 cm has a lateral size of ~20–30 cm and a thickness of ~5–10 cm, and the one at ~70 cm has a lateral size of ~20–40 cm and a thickness of ~10–15 cm. In the case of CE-5, the drill mechanism was fixed across both the lander and ascender [1], so it was not able to move laterally to avoid the obstructions found here. In the future sampling mission, if the spacecraft carries a laterally movable drill, a similar GPR array may provide useful information for the drill to avoid buried objects.
It should be noted that Figure 6a only gives the 2D cross-section of the subsurface structure on the x–z plane. On this plane, the area ratio between the rocky regions and the background is ~3%. The LRPR cannot constrain the size of the buried objects in the y-direction because of the limited synthetic aperture in this direction. However, assuming the high-density material in the y-direction has a mean length of 30 cm, the volume fraction of those rocky regions may be constrained. According to Shen et al. [17], the beamwidth of the antenna element E plane (perpendicular to array direction) is 70°. The height of the antenna array is ~88 cm. This means that, in the y-direction, the footprint of each antenna has a size of 1.23 m on the lunar surface. Based on the imaging result on the x–z plane and the assumed size in the y-direction, the volume fraction of high-density material is roughly estimated to be ~0.7%. Since there are some false recognitions and some rocky regions consisting of small rock fragments, 0.7% is an upper boundary for those rocks larger than decimeters.

6. Conclusions

In this study, we process the LRPR data to study the regolith structure at the CE-5 drilling site. Radar images show that the local regolith is composed of fine-grained material, with several high-density zones identified within a 2 m depth. The boundary between the regolith and the bedrock is not evident and is therefore likely at a deeper depth than could be sensed by the LRPR instrument. The high-density zones are either rocks or aggregate fragments. Based on the pre-flight ground test [3,5,21] and the FDTD modeling result in this study, we believe that the positions of these rocky regions are retrieved well in the radar image. Our analyses, combined with the studies from Liang et al. [16], reveal that the drill penetrated two aggregate fragment regions at ~30 cm and ~70 cm depths, and a rock fragment from the region at 70 cm depth might have obstructed the drill and terminate the drilling and coring process.

Author Contributions

Concepts and methodology, J.F.; LRPR raw data processing, J.F.; writing—original draft preparation, J.F. and M.N.W.; writing—review and editing, J.F., M.N.W. and M.A.S. All authors have read and agreed to the published version of the manuscript.

Funding

This research received no external funding.

Data Availability Statement

The Chang’E-5 Lunar Regolith-Penetrating Radar data, LCAM data, and PCAM data displayed in figures in the paper can be downloaded from https://moon.bao.ac.cn/ (accessed on 10 May 2022). The Lunar Reconnaissance Orbiter (LRO) Wide-Angle Camera image and the LRO Narrow-Angle Camera image are available at http://wms.lroc.asu.edu/lroc (accessed on 10 May 2022). The IDs of the CE-5 data used in this paper are: CE5-L_GRAS_LRPR-A_SCI_N_20201130090249_20201130092017_0001_A.01; CE5-L_GRAS_LRPR-A_SCI_N_20201130092304_20201130094032_0001_A.01; CE5-L_GRAS_LRPR-A_SCI_N_20201130094404_20201130100132_0001_A.01; CE5-L_GRAS_LRPR-A_SCI_N_20201201171559_20201201173326_0001_A.01; CE5-L_GRAS_LRPR-A_SCI_N_20201201211719_20201201213446_0001_A.01; CE5-L_GRAS_LRPR-A_SCI_N_20201201213749_20201201215516_0001_A.01; CE5-L_GRAS_LRPR-A_SCI_N_20201201215911_20201201221639_0001_A.01; CE5-L_GRAS_LCAM-2-0082_SCI_N_20201201151103_20201201151103_0001_A.2A; CE5-L_GRAS_PCAML-I-011_SCI_N_20201201214315_20201201214315_0001_A.2B; CE5-L_GRAS_PCAMR-I-006_SCI_N_20201201214215_20201201214215_0001_A.2B.

Conflicts of Interest

The authors declare no conflict of interest.

References

  1. Zheng, Y.; Mengfei, Y.; Xiangjin, D.; Shengyi, J.; Jing, P.; Yan, S.; Gu, Z.; Chen, L.; Pang, Y.; Zhang, N. Analysis of Chang’e-5 lunar core drilling process. Chin. J. Aeronaut. 2022, in press. [Google Scholar] [CrossRef]
  2. Zhou, C.; Jia, Y.; Liu, J.; Li, H.; Fan, Y.; Zhang, Z.; Liu, Y.; Jiang, Y.; Zhou, B.; He, Z.; et al. Scientific objectives and payloads of the lunar sample return mission—Chang’e-5. Adv. Space Res. 2022, 69, 823–836. [Google Scholar] [CrossRef]
  3. Li, Y.; Lu, W.; Fang, G.; Zhou, B.; Shen, S. Performance verification of Lunar Regolith Penetrating Array Radar of Chang’E-5 mission. Adv. Space Res. 2018, 63, 2267–2278. [Google Scholar] [CrossRef]
  4. Su, Y.; Wang, R.; Deng, X.; Zhang, Z.; Zhou, J.; Xiao, Z.; Ding, C.; Li, Y.; Dai, S.; Ren, X.; et al. Hyperfine Structure of Regolith Unveiled by Chang’E-5 Lunar Regolith Penetrating Radar. IEEE Trans. Geosci. Remote Sens. 2022, 60, 5110414. [Google Scholar] [CrossRef]
  5. Xiao, Y.; Su, Y.; Dai, S.; Feng, J.; Xing, S.; Ding, C.; Li, C. Ground experiments of Chang’e-5 lunar regolith penetrating radar. Adv. Space Res. 2019, 63, 3404–3419. [Google Scholar] [CrossRef]
  6. Feng, J.; Su, Y.; Ding, C.; Xing, S.; Dai, S.; Zou, Y. Dielectric properties estimation of the lunar regolith at CE-3 landing site using lunar penetrating radar data. Icarus 2017, 284, 424–430. [Google Scholar] [CrossRef]
  7. Feng, J.; Siegler, M.A.; White, M.N. Dielectric properties and stratigraphy of regolith in the lunar South Pole-Aitken basin: Observations from the Lunar Penetrating Radar. Astron. Astrophys. 2022, 661, A47. [Google Scholar] [CrossRef]
  8. Su, Y.; Fang, G.-Y.; Feng, J.-Q.; Xing, S.-G.; Ji, Y.-C.; Zhou, B.; Gao, Y.-Z.; Li, H.; Dai, S.; Xiao, Y.; et al. Data processing and initial results of Chang’e-3 lunar penetrating radar. Res. Astron. Astrophys. 2014, 14, 1623–1632. [Google Scholar] [CrossRef]
  9. Hiesinger, H.; Head, J.; Wolf, U.; Jaumann, R.; Neukum, G. Ages and stratigraphy of lunar mare basalts: A synthesis. Recent Adv. Curr. Res. Issues Lunar Stratigr. 2011, 477, 1–51. [Google Scholar]
  10. Hiesinger, H.; Head, J.; Wolf, U.; Jaumann, R.; Neukum, G. Ages and stratigraphy of mare basalts in oceanus pro-cellarum, mare nubium, mare cognitum, and mare insularum. J. Geophys. Res. Planets 2003, 108, 5065. [Google Scholar] [CrossRef] [Green Version]
  11. Tian, H.-C.; Wang, H.; Chen, Y.; Yang, W.; Zhou, Q.; Zhang, C.; Lin, H.-L.; Huang, C.; Wu, S.-T.; Jia, L.-H.; et al. Non-KREEP origin for Chang’e-5 basalts in the Procellarum KREEP Terrane. Nature 2021, 600, 59–63. [Google Scholar] [CrossRef]
  12. Sato, H.; Robinson, M.S.; Lawrence, S.J.; Denevi, B.W.; Hapke, B.; Jolliff, B.L.; Hiesinger, H. Lunar mare TiO2 abundances estimated from UV/Vis reflectance. Icarus 2017, 296, 216–238. [Google Scholar] [CrossRef]
  13. Jia, M.; Yue, Z.; Di, K.; Liu, B.; Liu, J.; Michael, G. A catalogue of impact craters larger than 200 m and surface age analysis in the Chang’e-5 landing area. Earth Planet. Sci. Lett. 2020, 541, 116272. [Google Scholar] [CrossRef]
  14. Qian, Y.; Xiao, L.; Wang, Q.; Head, J.W.; Yang, R.; Kang, Y.; van der Bogert, C.H.; Hiesinger, H.; Lai, X.; Wang, G.; et al. China’s Chang’e-5 landing site: Geology, stratigraphy, and provenance of materials. Earth Planet. Sci. Lett. 2021, 561, 116855. [Google Scholar] [CrossRef]
  15. Bandfield, J.; Ghent, R.R.; Vasavada, A.R.; Paige, D.A.; Lawrence, S.J.; Robinson, M.S. Lunar surface rock abundance and regolith fines temperatures derived from LRO Diviner Radiometer data. J. Geophys. Res. Earth Surf. 2011, 116, E00H02. [Google Scholar] [CrossRef]
  16. Liang, J.; Tao, L.; Zhang, W.; Tang, J.; Pang, Y.; Jiang, S. Analysis of the lunar regolith sample obstruction in the Chang’E-5 drill and its improvement. Adv. Space Res. 2021, 69, 2248–2258. [Google Scholar] [CrossRef]
  17. Shen, S.; Zhou, B.; Li, Y.; Lu, W.; Liu, Q.; Tang, C.; Fang, G.; Wang, L. The Design of Payload Lunar Regolith Penetrating Radar on Chang’E-5 Lander. IEEE Aerosp. Electron. Syst. Mag. 2021, 36, 4–16. [Google Scholar] [CrossRef]
  18. Feng, X.; Sato, M. Pre-stack migration applied to GPR for landmine detection. Inverse Probl. 2004, 20, S99–S115. [Google Scholar] [CrossRef]
  19. Schneider, W.A. Developments in seismic data processing and analysis (1968–1970). Geophysics 1971, 36, 1043–1073. [Google Scholar] [CrossRef]
  20. Zhuge, X.; Savelyev, T.; Yarovoy, A.G.; Ligthart, L. UWB array-based radar imaging using modified Kirchhoff migration. In Proceedings of the 2008 IEEE International Conference on Ultra-Wideband, Hannover, Germany, 10–12 September 2008. [Google Scholar]
  21. Feng, J.; Su, Y.; Li, C.; Dai, S.; Xing, S.; Xiao, Y. An imaging method for Chang’e−5 Lunar Regolith Penetrating Radar. Planet. Space Sci. 2019, 167, 9–16. [Google Scholar] [CrossRef]
  22. Warren, C.; Giannopoulos, A.; Giannakis, I. gprMax: Open source software to simulate electromagnetic wave propagation for Ground Penetrating Radar. Comput. Phys. Commun. 2016, 209, 163–170. [Google Scholar] [CrossRef] [Green Version]
  23. Liu, H.; Long, Z.; Tian, B.; Han, F.; Fang, G.; Liu, Q.H. Two-Dimensional Reverse-Time Migration Applied to GPR With a 3-D-to-2-D Data Conversion. IEEE J. Sel. Top. Appl. Earth Obs. Remote Sens. 2017, 10, 4313–4320. [Google Scholar] [CrossRef]
Figure 1. (a) Location of the CE-5 landing site (marked by a red cross). The base map is the Lunar Reconnaissance Orbiter (LRO) Wide-Angle Camera (WAC) image mosaic. (b) The CE-5 lander captured by LRO Narrow-Angle Cameras (NAC) on 2 December 2020 (NAC image ID: NAC_DTM_CHANGE501_M1374421274LE_100CM).
Remotesensing 14 03378 g001
Figure 2. Schematic diagram of the antenna array from a side view (a) and a bottom view (b). Antennas #1 to #10 are aligned along one edge of the lander’s bottom, with the drill mounted between antennas #7 and #8. Antennas #11 and #12 are mounted separately. The longest dimension of the antenna array is 1.518 m.
Remotesensing 14 03378 g002
Figure 3. (a) Waveform of the first trace of pre-drilling observation data. The reflection from the cable–antenna interface contaminates the signal after 50 ns. (b) The radargram of pre-drilling data. (c) The radargram of one of the background measurement data. The strongest signals in the radargram are direct waves and ground-reflected waves.
Remotesensing 14 03378 g003
Figure 4. (a) Comparison of a single trace before and after background removal (BR). (b) Radargram of the observation data after processing. (c) Wiggle form of the observation data after processing. The red and green lines indicate the theoretical arriving time of direct waves and ground-reflected waves. These figures show that low-frequency system noise, direct current bias, and the direct waves in the raw signals are removed after data processing.
Remotesensing 14 03378 g004
Figure 5. (a) Imaging result of the pre-drilling data. (bd) Imaging results of the other three post-drilling data. The vertical dotted lines in these images indicate the drilling trajectory of the drill. The horizontal dashed lines in Figure 5a show the position of ground reflection. The background with low intensity represents lunar soil with uniform density, while high intensity in these figures indicates strong radar echoes from buried objects denser than lunar soil. The three post-drilling imaging results are almost identical. There is a little difference between the pre-drilling and post-drilling results.
Remotesensing 14 03378 g005
Figure 6. (a) Structure diagram of regolith under the CE-5 lander. The black color indicates the approximate extent of rocky regions in the regolith. The dotted line indicates the drilling trajectory of the drill. (b) Lunar surface image obtained by LCAM just before the lander touched the Moon. The dashed line represents the projection of antennas #1 to #10 on the lunar surface. Black arrows indicate two examples of aggregate fragments. The positions of lander center and drilling point are determined according to the work from Zheng et al. [1].
Remotesensing 14 03378 g006
Figure 7. (a,b) demonstrate the landscape near the CE-5 landing site, taken by the PCAM onboard the CE-5 lander.
Remotesensing 14 03378 g007
Figure 8. (a) Radargram of raw data simulated by FDTD. (b) Modeled data after bandpass filtering and background removal. (c) Wiggle form of the simulated raw data. (d) Wiggle form of the simulated raw data after bandpass filtering and background removal. The red and green lines indicate the theoretical arriving time of direct waves and ground-reflected waves. The simulated raw data and data after processing are comparable with the lunar data shown in Figure 4.
Remotesensing 14 03378 g008
Figure 9. (a) Imaging result of the FDTD simulation data. (b) Geometric mean of four lunar measurements illustrated in Figure 5. The positions and extent of strong radar echoes in the FDTD model are very similar to that in the lunar data, indicating that our inference of the subsurface structure of regolith at drilling site is reasonable.
Remotesensing 14 03378 g009
Figure 10. (a) Input scenario for FDTD model with an assumed boundary between regolith and bedrock at 1.5 m. (b) Imaging result of the FDTD model. Strong radar echoes can be found at the regolith/bedrock interface.
Remotesensing 14 03378 g010
Publisher’s Note: MDPI stays neutral with regard to jurisdictional claims in published maps and institutional affiliations.

