
Multimodal Fusion of Mobility Demand Data and Remote Sensing Imagery for Urban Land-Use and Land-Cover Mapping

 , , , , and
Abstract
:1. Introduction
2. Previous Work
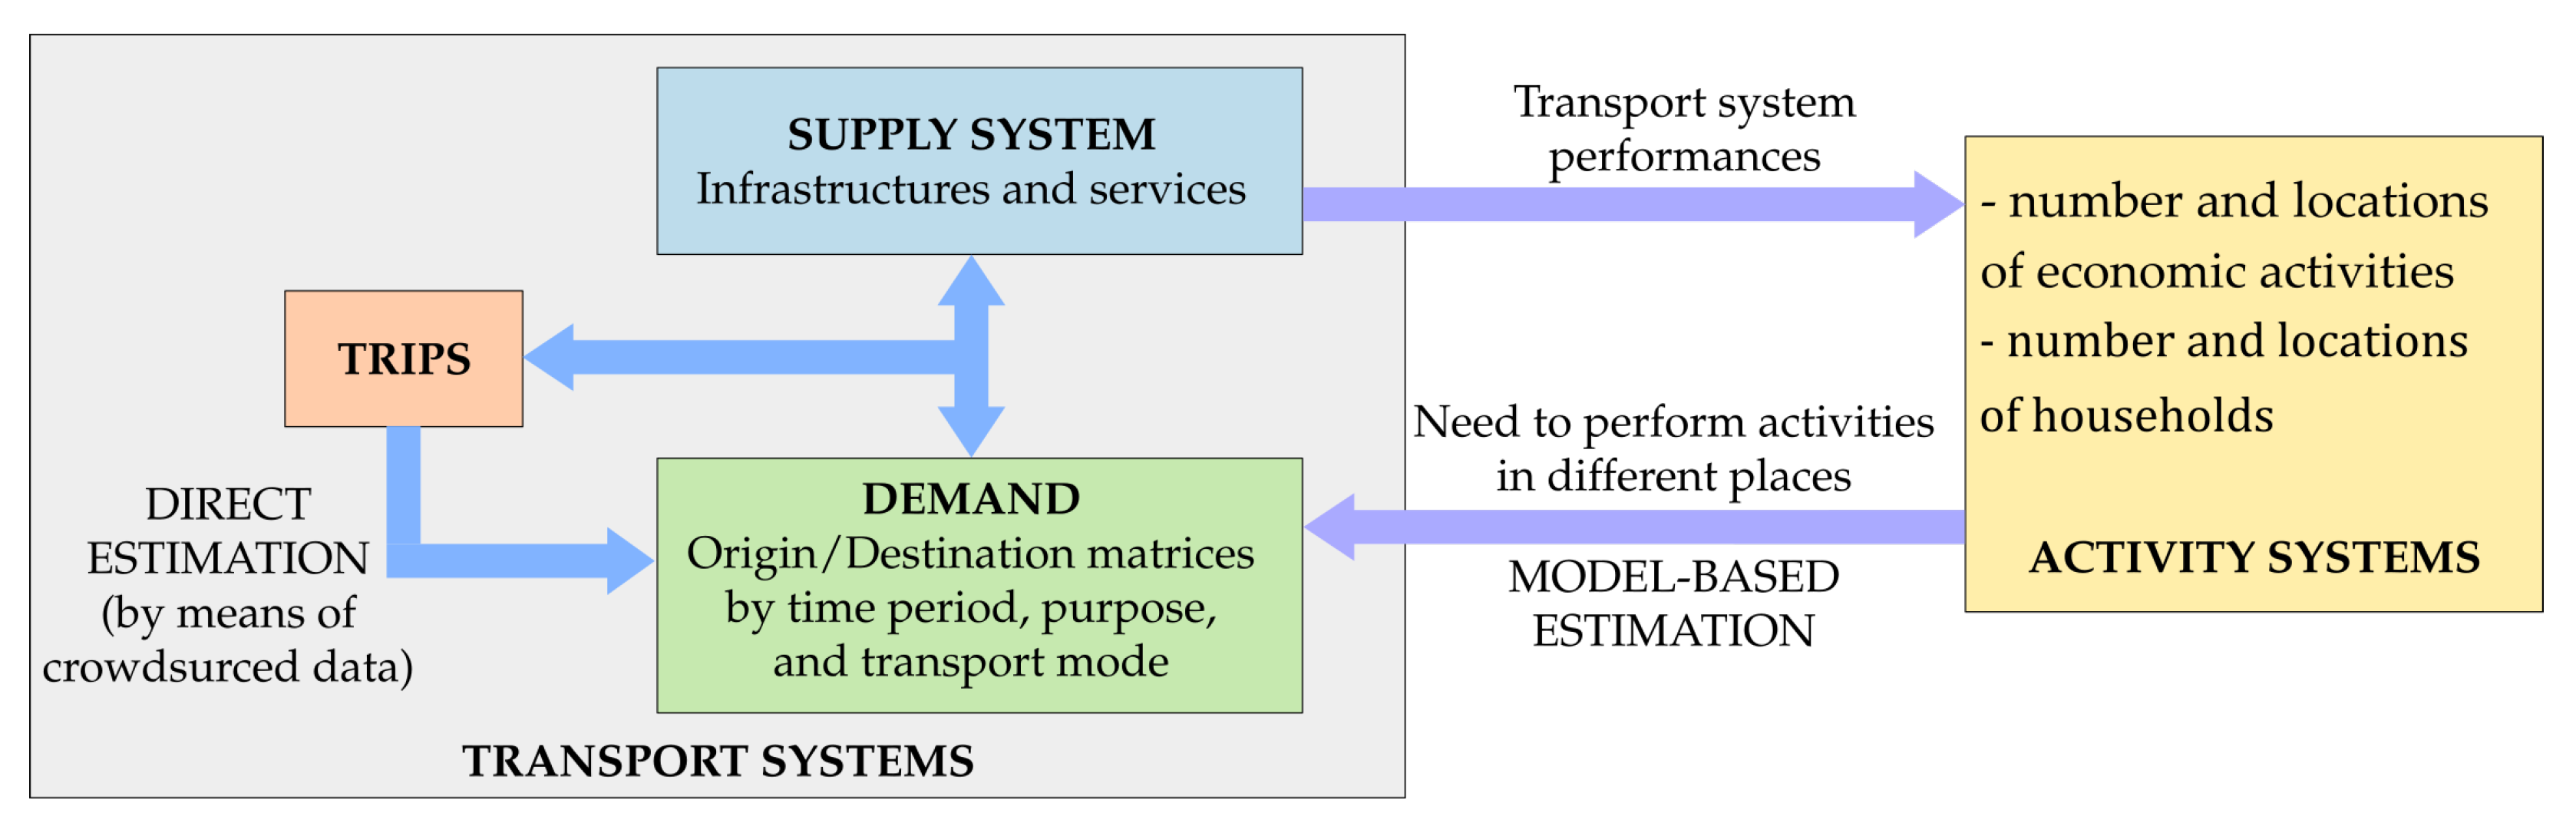
3. Basics on Transport Systems and Mobility Demand Data
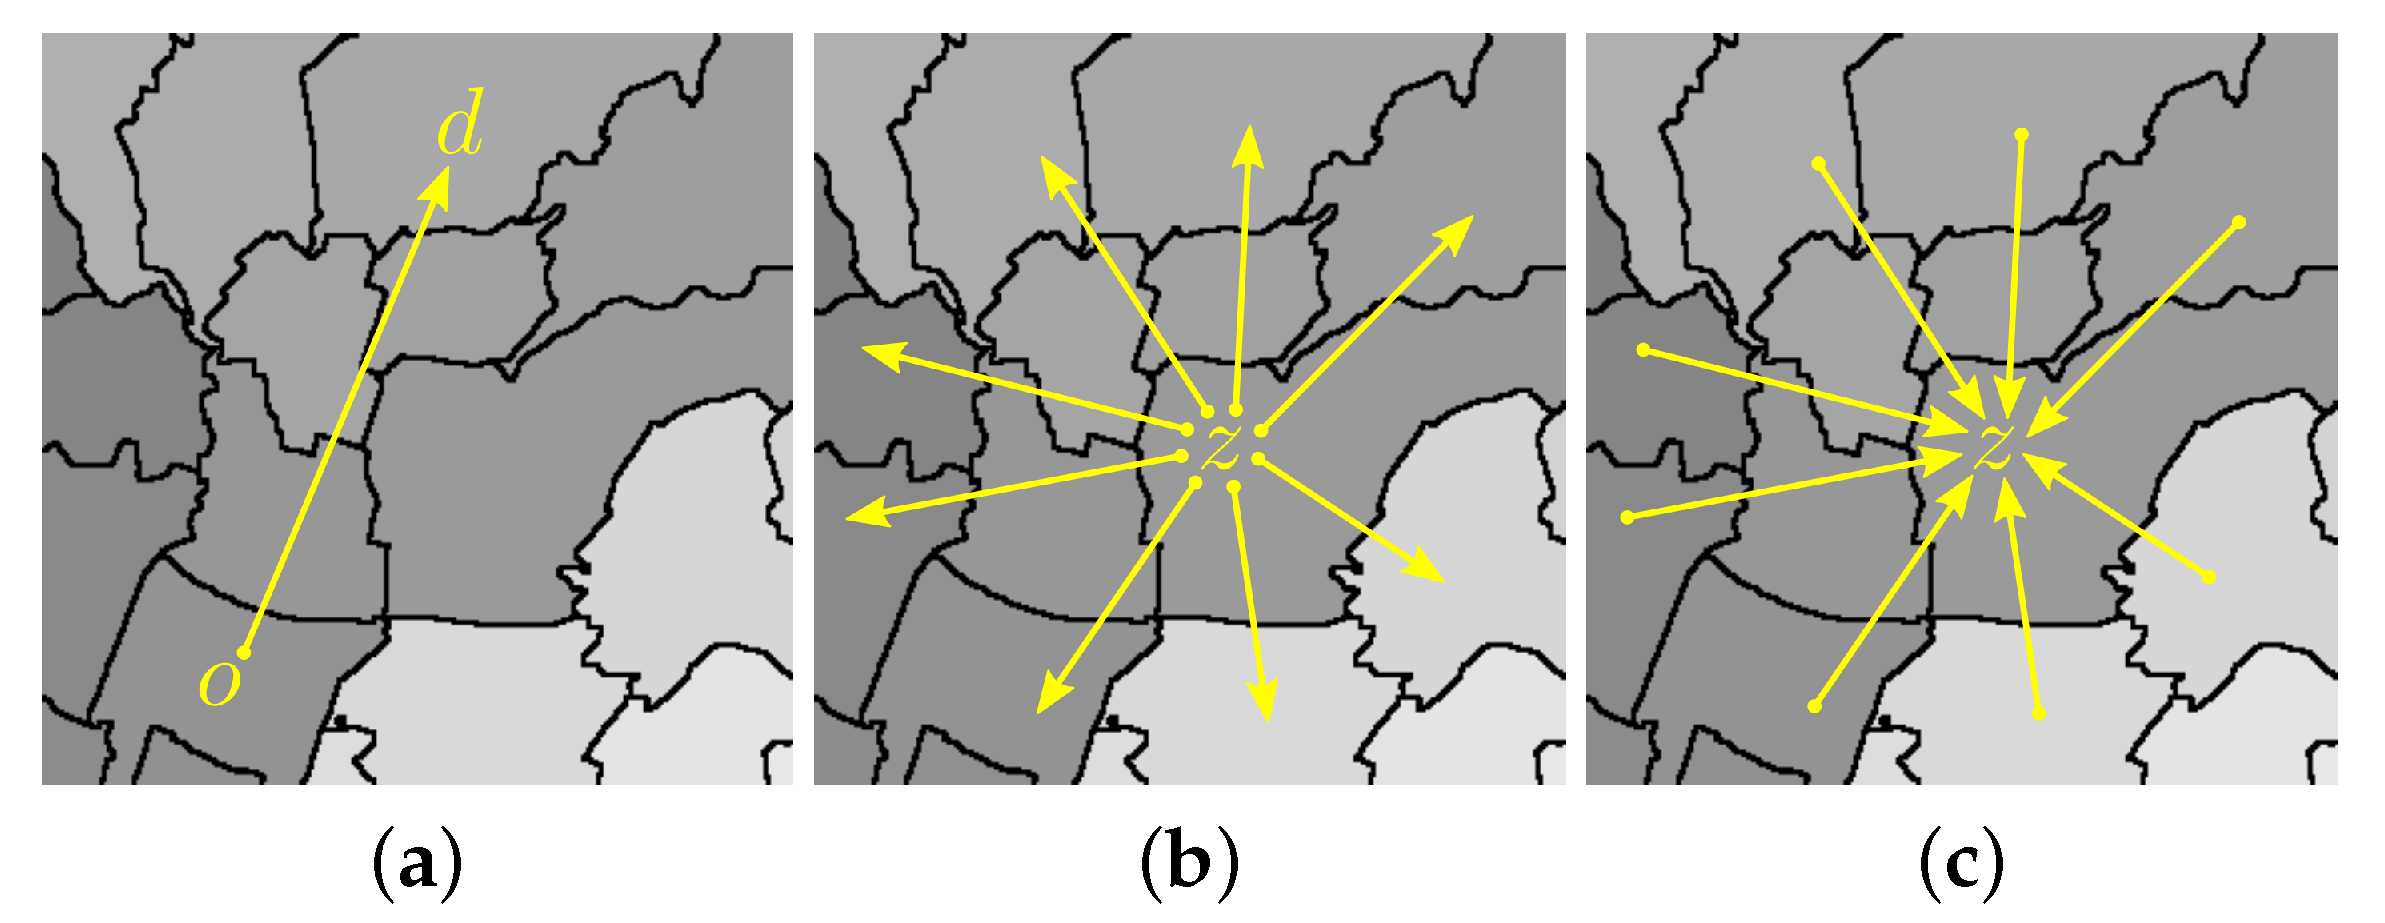
3.1. Mobility Demand Spatial Characteristics
3.2. Mobility Demand Temporal Characteristics
- long-period dynamics: they result from territorial, social, and economic changes such as the variations in the gross direct product of a country, and they essentially describe the changes of a territory and of the relevant economy over the years;
- periodic dynamics: they refer to demand values that are cyclically repeated (e.g., on a seasonal or weekly basis) and point out the different users’ needs and behaviours over different times of long periods (e.g., seasons over years or days over weeks);
- daily dynamics: they are strictly correlated with the users’ daily activities, such as living and working.
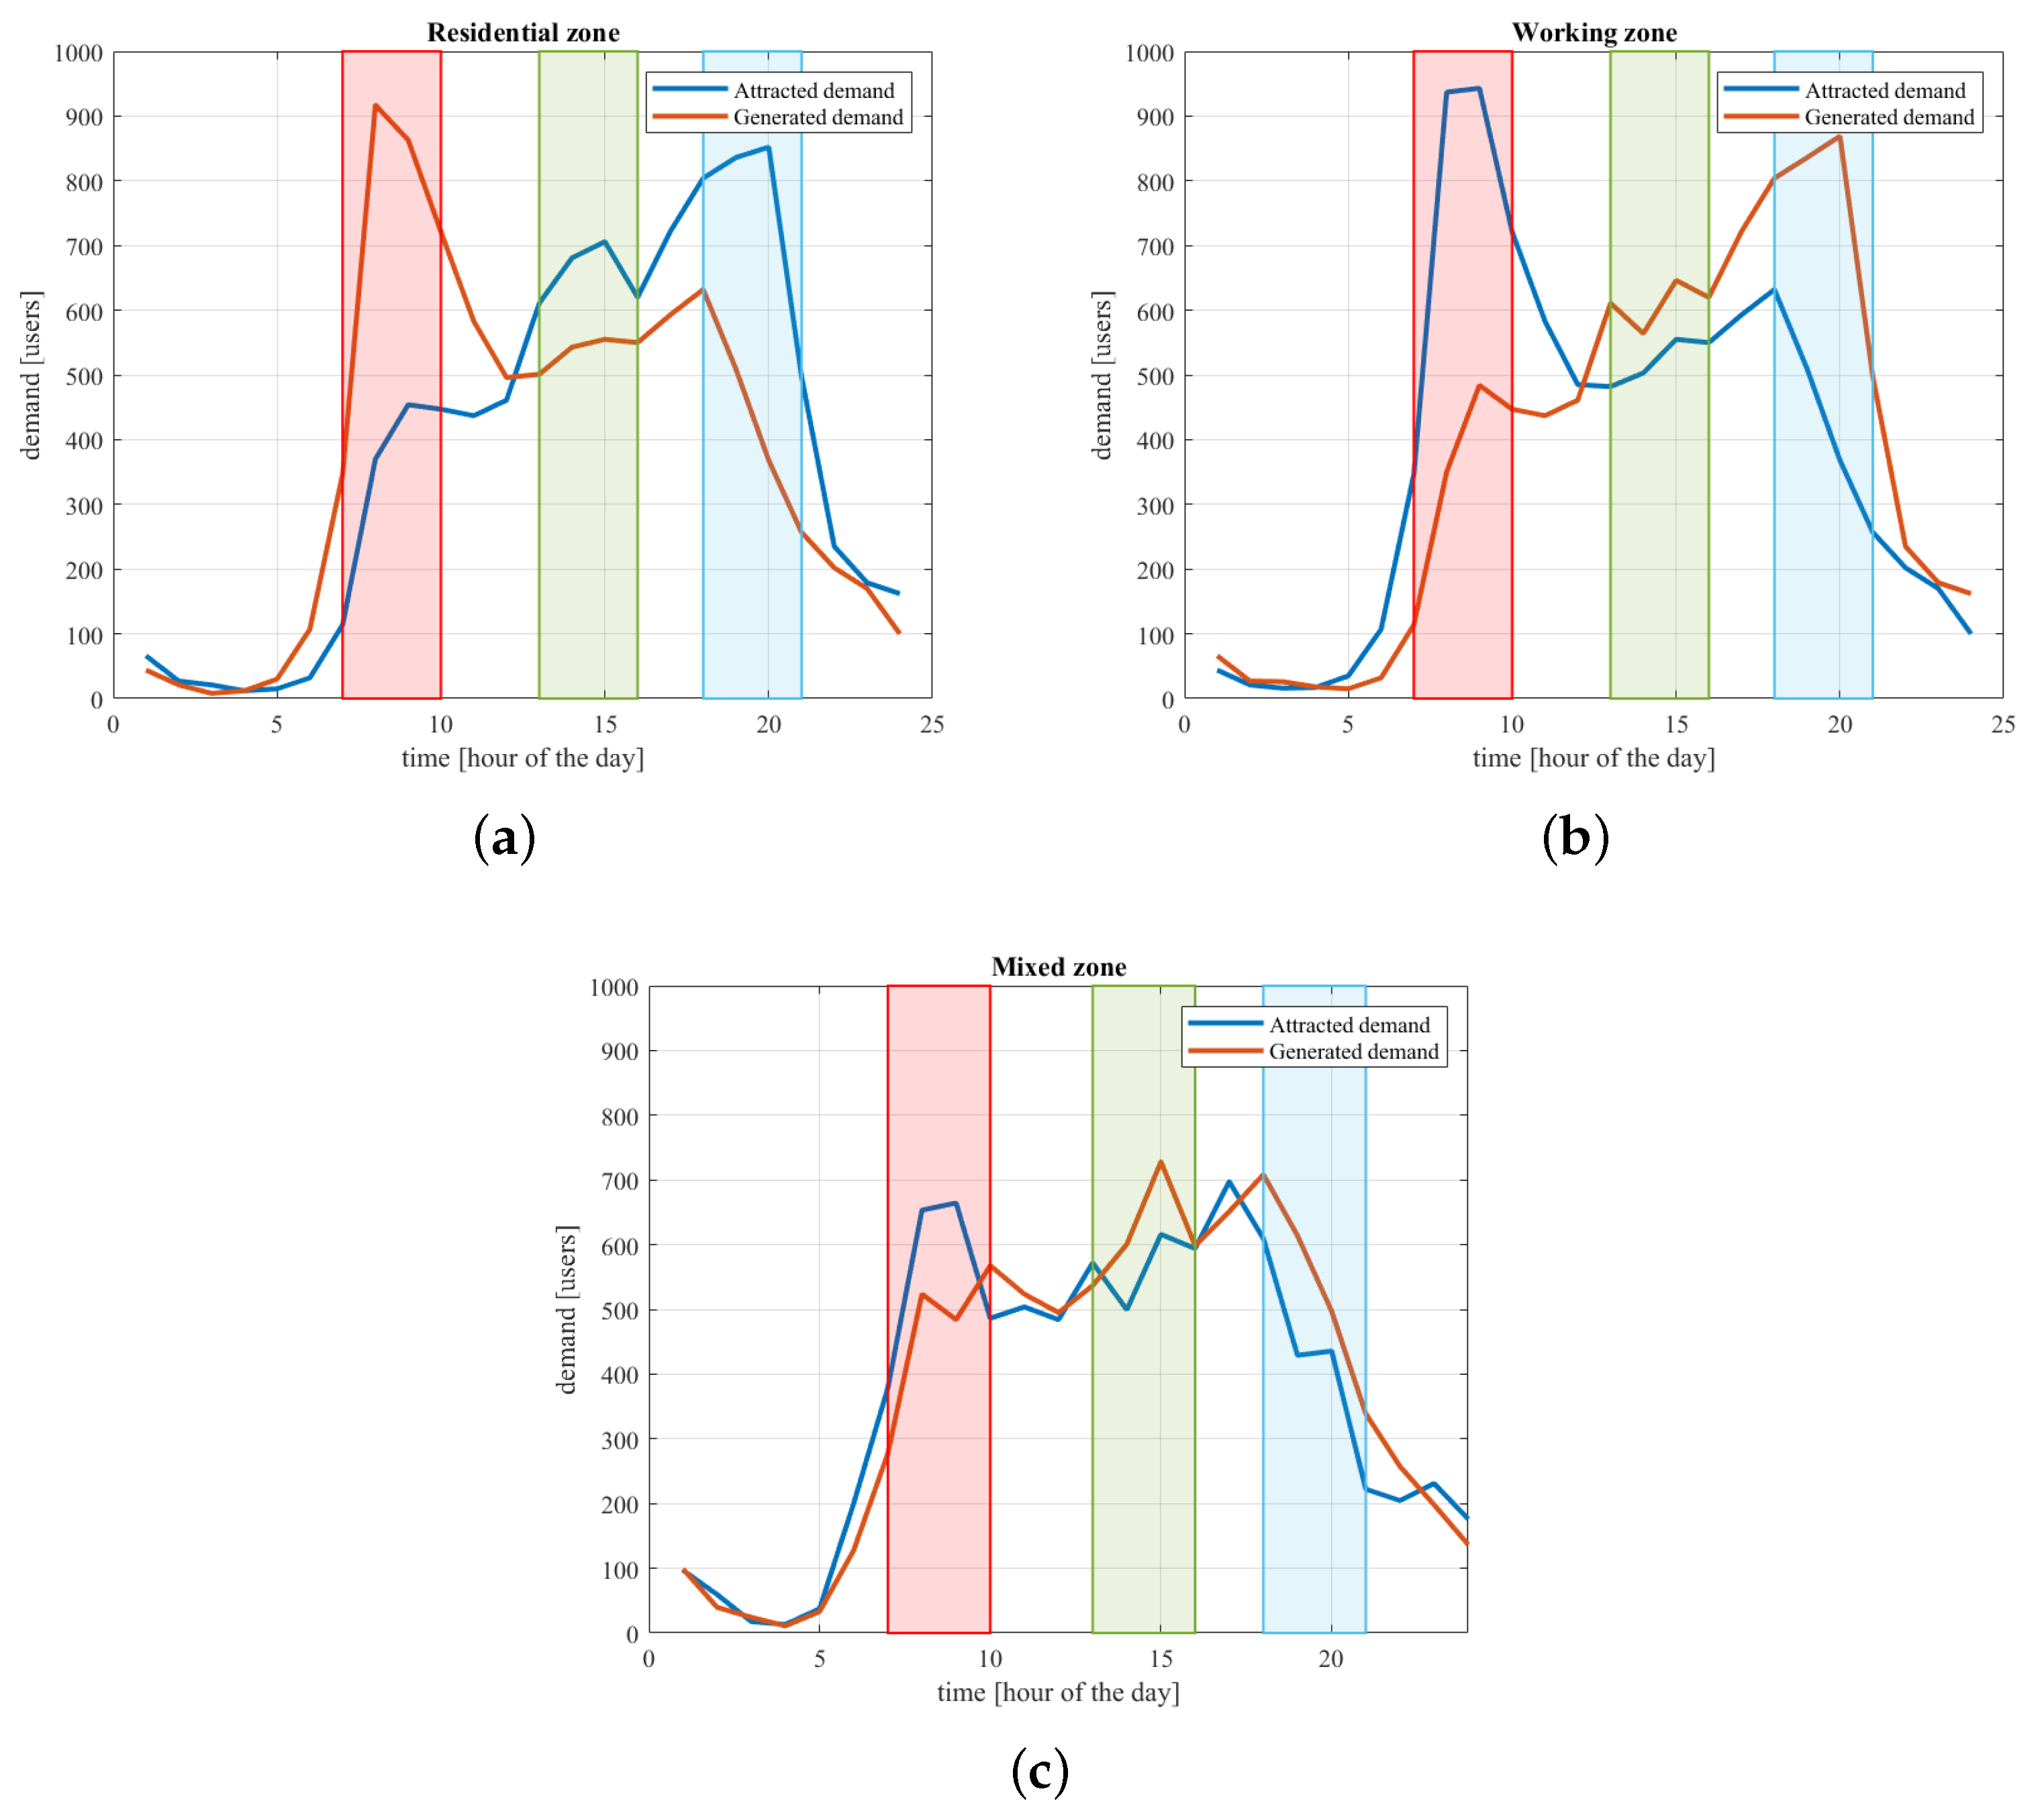
- in mainly residential zones (i.e., zones with a high density of housing), the generated demand is greater than the attracted demand—i.e., —in the morning, since people leave their houses to reach workplaces, schools, or other economic activities. Conversely, attracted demand is greater than generated demand—i.e., —in the afternoon and in the evening, when most people return home. During the other periods of the day, the generated and attracted demands are similar. An example of such differences is depicted in Figure 4a, where the hourly generated and attracted demands of a mainly residential zone are represented for a whole day.
- in mainly working areas (i.e., zones with a high density of workplaces), the attracted demand is greater than the generated demand—i.e., —in the morning when most of the people go to work, while the generated demand is greater than the attracted demand—i.e., —in the afternoon and in the evening, when most of the people return to home. During the other periods of the day, the generated and attracted demands are similar. An example of such differences is depicted in Figure 4b, where the hourly generated and attracted demands of a mainly working zone are shown for a whole day.
- in mixed zones, there is not a clear difference between the generated and attracted demands, i.e., is overall comparable to at all hours of the day, as shown in the example of Figure 4c.
3.3. Mobility Demand Modal Split
4. Materials and Methods
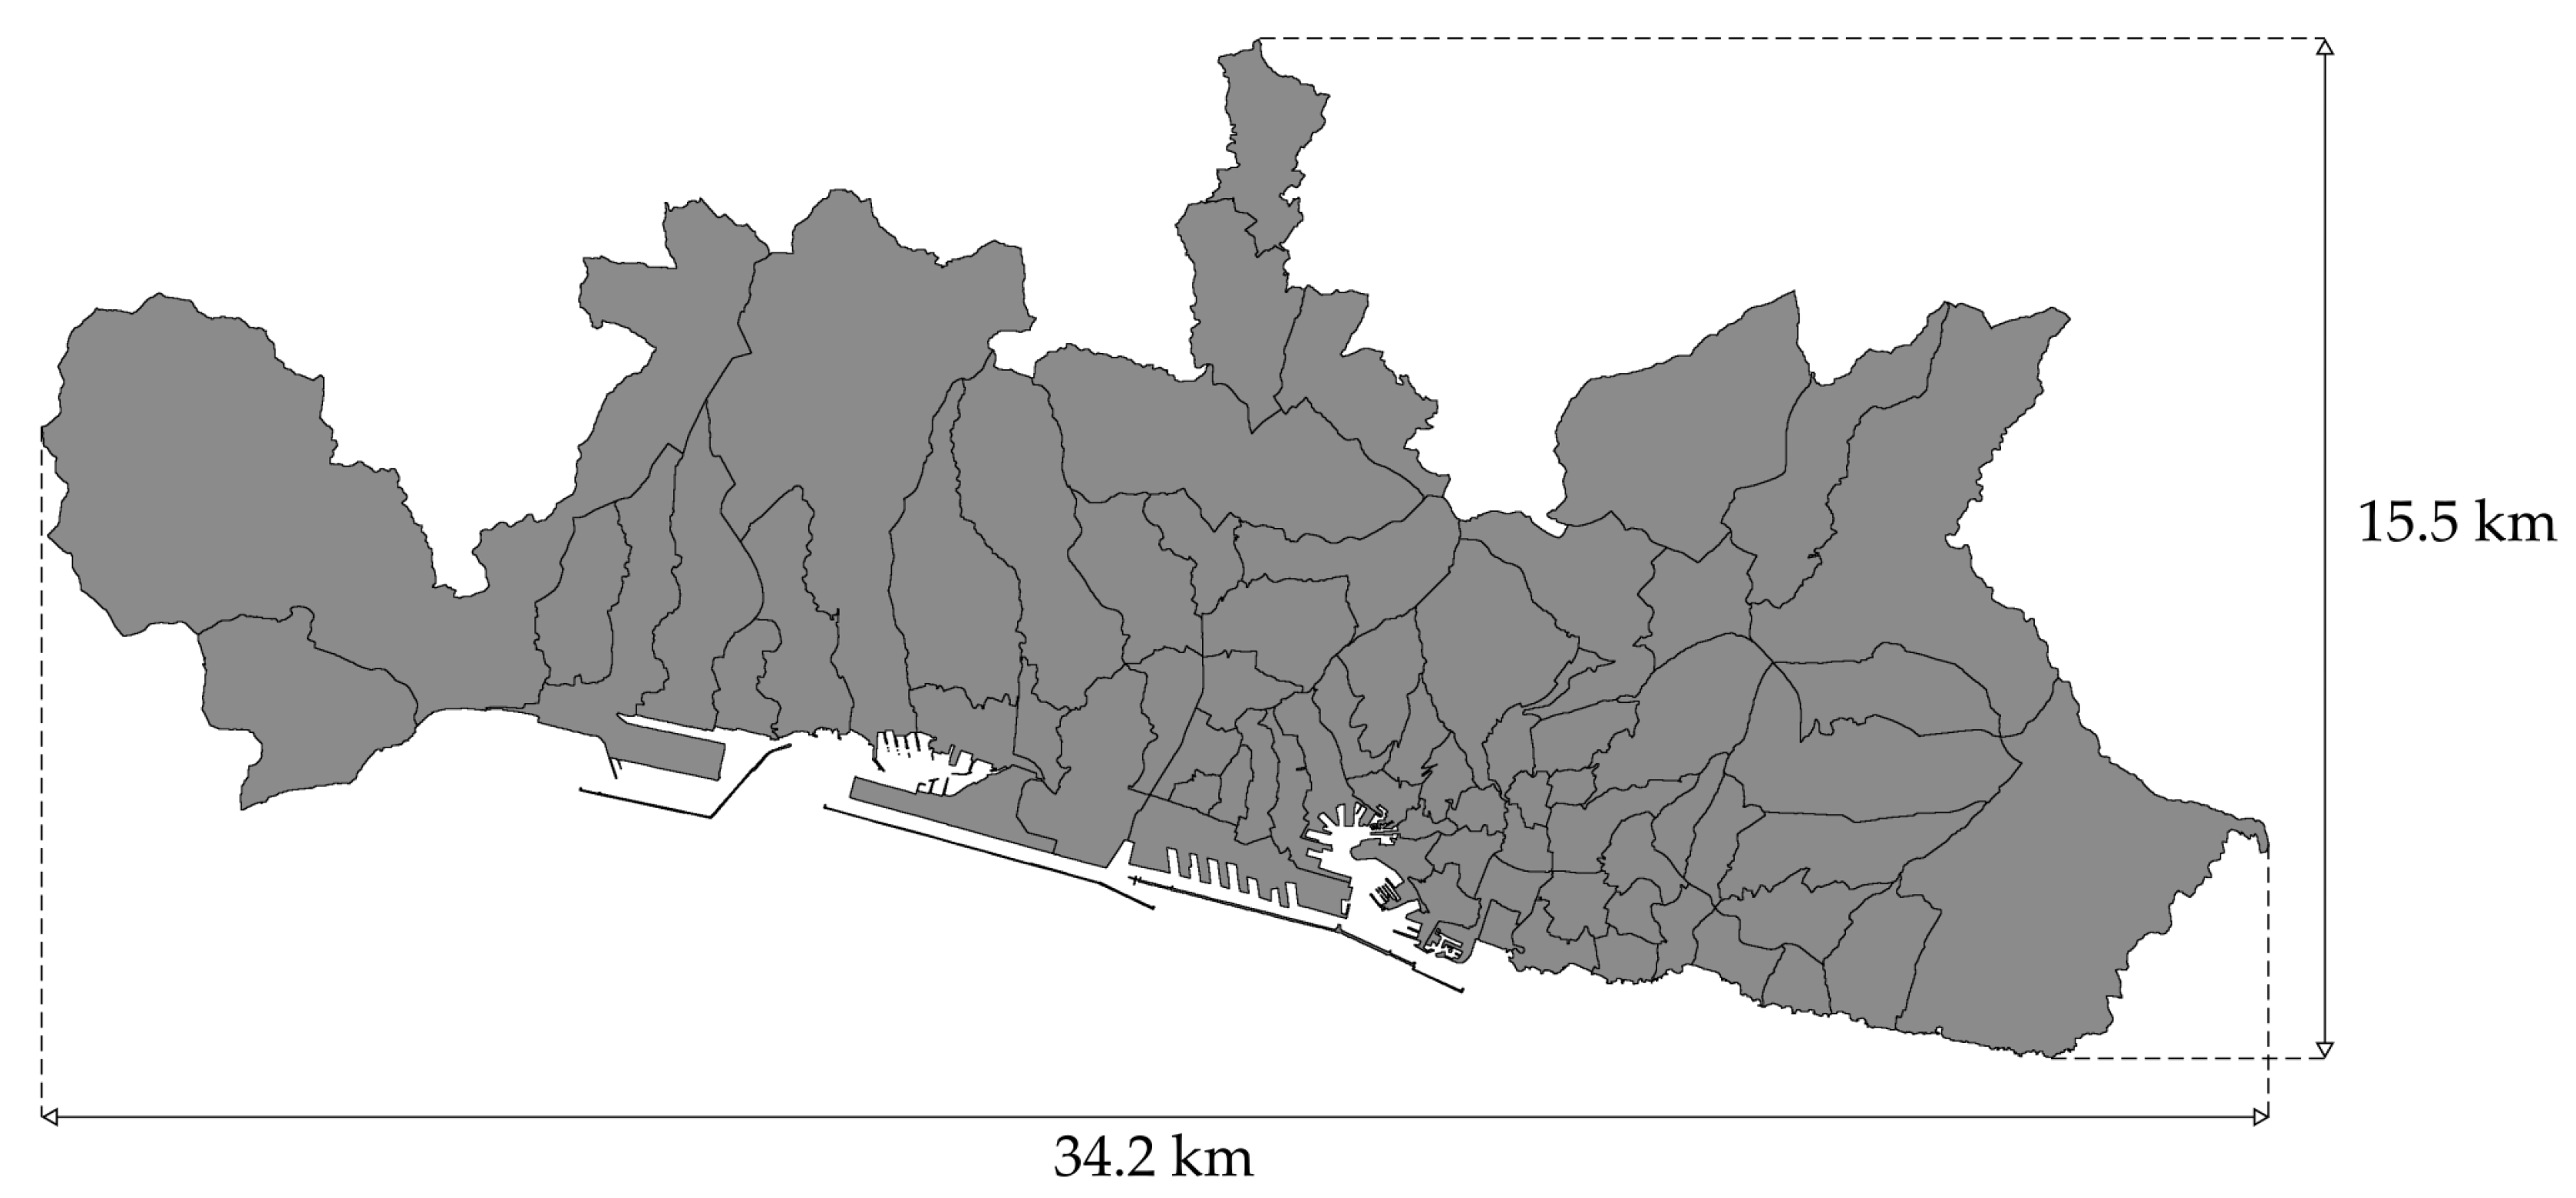
4.1. Case Study
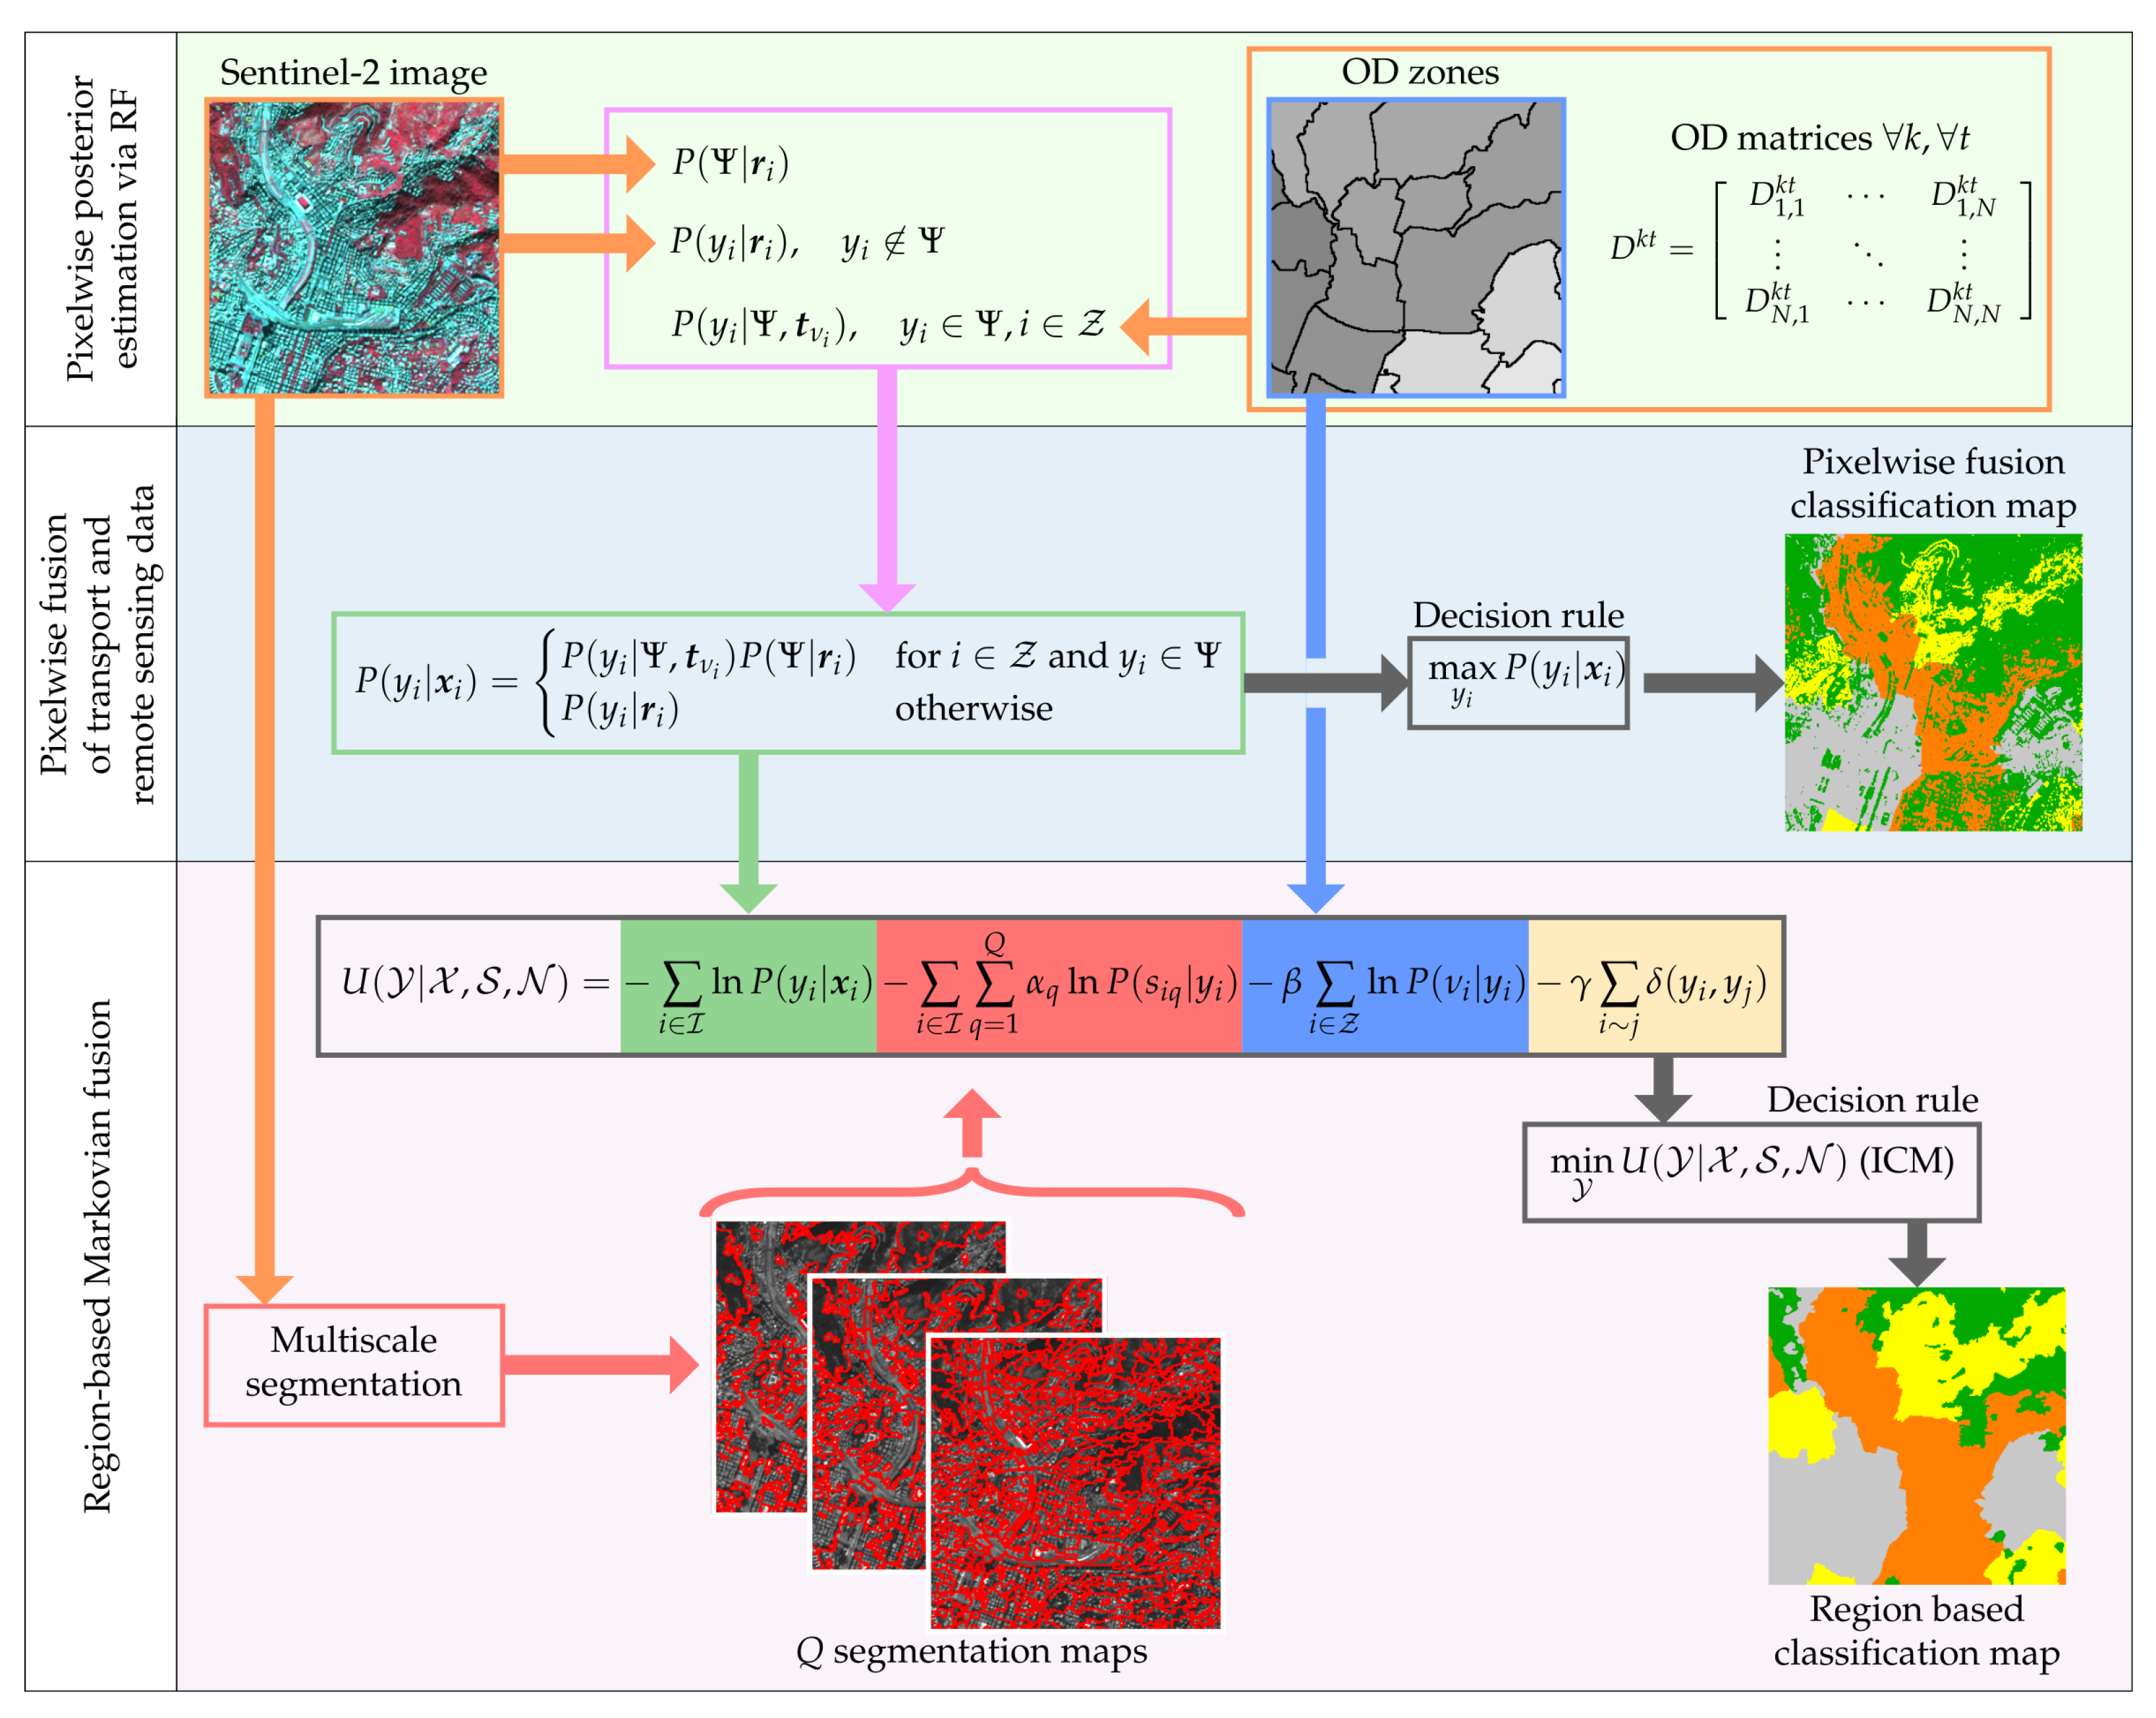
4.2. Multimodal Decision Fusion of Remote Sensing and Mobility Demand Data
- In the case of a pixel located within the OD zones (i.e., ) and of an urban land-use class (i.e., ), plugging Assumptions (6a) and (6b) in (5) yields:In this case, the pixelwise posterior of each urban land-use class is decomposed as the product of two terms, associated with the probability of the urban cover as a whole, given the remote sensing observations, and with the probability of the urban land-use class, given the transport features and the membership to the urban cover.
- In the case of a land-cover class () and of an arbitrary pixel (), Assumption (6c) implies .
- In the case of a pixel located outside the OD zones (i.e., ), only remote sensing features are available (); therefore, again.
- (a)
- a ground truth map regarding the individual land-cover classes in and the urban land cover;
- (b)
- a subset of the zones belonging to each urban land-use class.
4.3. Markovian Region-Based Multimodal Fusion of Remote Sensing and Mobility Demand Data
5. Experimental Results
- (i)
- Pixelwise classification of the remotely sensed image, using its multispectral channels as features—This is meant as a consolidated baseline for land-cover mapping. Random forest was chosen as a well-known benchmark classifier and was trained to discriminate all the classes in . The training samples for “vegetation” and “water bodies” are shown in Figure 8. Regarding the urban land-use classes, pixelwise training samples were obtained through the spatial intersection between the training regions of “urban cover” in Figure 8a and the training OD zones in Figure 7a;
- (ii)
- Pixelwise classification using not only the multispectral channels but also additional features including the normalised difference vegetation index (NDVI) and texture features—Random forest has been used in this case as well, thanks to its fully nonparametric formulation that allows the application to heterogeneous input features. Texture analysis is conducted using the well-known first-order histogram (FOH) and grey-level cooccurrence matrix (GLCM) approaches [71,72]. The FOH variance and GLCM contrast and variance features were extracted from all channels of the input Sentinel-2 image. Preliminary experiments, not reported for brevity, have been performed to tune the parameters of the FOH and GLCM texture analysis algorithms to optimise the classification results. Texture features have been found informative in the literature of land-use mapping from remote sensing imagery (e.g., [73,74]), and this experiment is aimed at discussing the behaviour of the proposed methods compared to a traditional approach to land-use classification from EO data. The training set used for this experiment is the same as in (i);
- (iii)
- Soft-majority voting on the posteriors computed by classifier (i)—In this case, for each OD zone and each urban land-use class, first, the average of the pixelwise posteriors predicted by random forest in (i) is computed. Then, each pixel of the zone is assigned by applying the MAP rule with the averaged posteriors of the urban land-use classes and with the pixelwise posteriors of the nonurban land-cover classes. Averaging is applied only to the posteriors of the urban land-use classes (and not to those of “vegetation” and “water bodies”) to take into account that the zonization is associated with the urban mobility and generally not with other land covers. The aim of this experiment is to appreciate the possible contribution of the spatial discretization associated with the OD zones within a traditional classification scheme as in (i), in comparison to the developed techniques in which mobility-related information is exploited in terms both of spatial structure and of transport demand features;
- (iv)
- Soft-majority voting as in (iii), applied here to the pixelwise posteriors obtained in (ii) from input spectral channels and additional features—While the rationale of this experiment is similar to that of (iii), here, the focus is on evaluating the possible benefit of combining a traditional land-use classification strategy with the spatial structure of mobility demand data.
6. Discussion
7. Conclusions
Author Contributions
Funding
Acknowledgments
Conflicts of Interest
References
- Weng, Q.; Quattrochi, D.; Gamba, P. (Eds.) Urban Remote Sensing; CRC Press: Boca Raton, FL, USA, 2018. [Google Scholar]
- Zhang, C.; Sargent, I.; Pan, X.; Li, H.; Gardiner, A.; Hare, J.; Atkinson, P.M. An object-based convolutional neural network (OCNN) for urban land use classification. Remote Sens. Environ. 2018, 216, 57–70. [Google Scholar] [CrossRef] [Green Version]
- Gamba, P.; Aldrighi, M. SAR data classification of urban areas by means of segmentation techniques and ancillary optical data. IEEE J. Sel. Top. Appl. Earth Obs. Remote Sens. 2012, 5, 1140–1148. [Google Scholar] [CrossRef]
- Pesaresi, M.; Huadong, G.; Blaes, X.; Ehrlich, D.; Ferri, S.; Gueguen, L.; Halkia, M.; Kauffmann, M.; Kemper, T.; Lu, L.; et al. A global human settlement layer from optical HR/VHR RS data: Concept and first results. IEEE J. Sel. Top. Appl. Earth Obs. Remote Sens. 2013, 6, 2102–2131. [Google Scholar] [CrossRef]
- Yokoya, N.; Ghamisi, P.; Xia, J.; Sukhanov, S.; Heremans, R.; Tankoyeu, I.; Bechtel, B.; Le Saux, B.; Moser, G.; Tuia, D. Open Data for Global Multimodal Land Use Classification: Outcome of the 2017 IEEE GRSS Data Fusion Contest. IEEE J. Sel. Top. Appl. Earth Obs. Remote Sens. 2018, 11, 1363–1377. [Google Scholar] [CrossRef] [Green Version]
- Hu, T.; Yang, J.; Li, X.; Gong, P. Mapping urban land use by using landsat images and open social data. Remote Sens. 2016, 8, 151. [Google Scholar] [CrossRef]
- European Commission. Mapping Guide for a European Urban Atlas; European Space Research; Tech. Rep. ITD-0421-GSELand-TN-01; European Space Agency: Frascati, Italy, 2008. [Google Scholar]
- Cascetta, E. Transportation Systems Analysis; Springer: Berlin/Heidelberg, Germany, 2009. [Google Scholar]
- Pohl, C.; van Genderen, J. Remote Sensing Image Fusion: A Practical Guide; CRC Press: Boca Raton, FL, USA, 2016. [Google Scholar]
- Moser, G.; Serpico, S.B.; Benediktsson, J.A. Land-cover mapping by markov modeling of spatial-contextual information in very-high-resolution remote sensing images. Proc. IEEE 2013, 101, 631–651. [Google Scholar] [CrossRef]
- Kato, Z.; Zerubia, J. Markov random fields in image segmentation. Found. Trends Signal Process. 2012, 5, 1–155. [Google Scholar] [CrossRef]
- Tacconi, C.; Tuscano, M.P.; Moser, G.; Sacco, N. Urban Land-Use and Land-Cover Mapping Based on the Classification of Transport Demand and Remote Sensing Data. In Proceedings of the International Geoscience and Remote Sensing Symposium (IGARSS), Honolulu, HI, USA, 26 September 2020–2 October 2020; pp. 4080–4083. [Google Scholar]
- Hussain, E.; Bhaskar, A.; Chung, E. Transit OD matrix estimation using smartcard data: Recent developments and future research challenges. Transp. Res. Part C Emerg. Technol. 2021, 125, 103044. [Google Scholar] [CrossRef]
- Moreira-Matias, L.; Gama, J.; Ferreira, M.; Mendes-Moreira, J.; Damas, L. Time-evolving O-D matrix estimation using high-speed GPS data streams. Expert Syst. Appl. 2016, 44, 275–288. [Google Scholar] [CrossRef] [Green Version]
- Ma, J.; Li, H.; Yuan, F.; Bauer, T. Deriving Operational Origin-Destination Matrices From Large Scale Mobile Phone Data. Int. J. Transp. Sci. Technol. 2013, 2, 183–204. [Google Scholar] [CrossRef] [Green Version]
- Nigro, M.; Cipriani, E.; del Giudice, A. Exploiting floating car data for time-dependent Origin–Destination matrices estimation. J. Intell. Transp. Syst. 2018, 22, 159–174. [Google Scholar] [CrossRef]
- Cienciała, A.; Sobolewska-Mikulska, K.; Sobura, S. Credibility of the cadastral data on land use and the methodology for their verification and update. Land Use Policy 2021, 102, 105204. [Google Scholar] [CrossRef]
- Jia, Y.; Ge, Y.; Ling, F.; Guo, X.; Wang, J.; Wang, L.; Chen, Y.; Li, X. Urban Land Use Mapping by Combining Remote Sensing Imagery and Mobile Phone Positioning Data. Remote Sens. 2018, 10, 446. [Google Scholar] [CrossRef] [Green Version]
- Zhao, W.; Bo, Y.; Chen, J.; Tiede, D.; Blaschke, T.; Emery, W. Exploring semantic elements for urban scene recognition: Deep integration of high-resolution imagery and OpenStreetMap (OSM). ISPRS J. Photogramm. Remote Sens. 2019, 151, 237–250. [Google Scholar] [CrossRef]
- Huang, B.; Zhao, B.; Song, Y. Urban land-use mapping using a deep convolutional neural network with high spatial resolution multispectral remote sensing imagery. Remote Sens. Environ. 2018, 214, 73–86. [Google Scholar] [CrossRef]
- Alshehhi, R.; Marpu, P.R.; Woon, W.L.; Mura, M.D. Simultaneous extraction of roads and buildings in remote sensing imagery with convolutional neural networks. ISPRS J. Photogramm. Remote Sens. 2017, 130, 139–149. [Google Scholar] [CrossRef]
- Garcia-Garcia, A.; Orts-Escolano, S.; Oprea, S.; Villena-Martinez, V.; Garcia-Rodriguez, J. A review on deep learning techniques applied to semantic segmentation. arXiv 2017, arXiv:1704.06857. [Google Scholar]
- Nogueira, K.; Penatti, O.; dos Santos, J. Towards better exploiting convolutional neural networks for remote sensing scene classification. Pattern Recognit. 2017, 61, 539–556. [Google Scholar] [CrossRef] [Green Version]
- Pastorino, M.; Moser, G.; Serpico, S.B.; Zerubia, J. Semantic Segmentation of Remote-Sensing Images Through Fully Convolutional Neural Networks and Hierarchical Probabilistic Graphical Models. IEEE Trans. Geosci. Remote Sens. 2022, 60, 1–16. [Google Scholar] [CrossRef]
- Vargas-Munoz, J.E.; Srivastava, S.; Tuia, D.; Falcão, A.X. OpenStreetMap: Challenges and Opportunities in Machine Learning and Remote Sensing. IEEE Geosci. Remote Sens. Mag. 2021, 9, 184–199. [Google Scholar] [CrossRef]
- Liu, D.; Chen, N.; Zhang, X.; Wang, C.; Du, W. Annual large-scale urban land mapping based on Landsat time series in Google Earth Engine and OpenStreetMap data: A case study in the middle Yangtze River basin. ISPRS J. Photogramm. Remote Sens. 2019, 159, 337–351. [Google Scholar] [CrossRef]
- Pan, D.; Zhang, M.; Zhang, B. A Generic FCN-Based Approach for the Road-Network Extraction From VHR Remote Sensing Images – Using OpenStreetMap as Benchmarks. IEEE J. Sel. Top. Appl. Earth Obs. Remote Sens. 2021, 14, 2662–2673. [Google Scholar] [CrossRef]
- Parekh, J.R.; Poortinga, A.; Bhandari, B.; Mayer, T.; Saah, D.; Chishtie, F. Automatic Detection of Impervious Surfaces from Remotely Sensed Data Using Deep Learning. Remote Sens. 2021, 13, 3166. [Google Scholar] [CrossRef]
- Fan, W.; Wu, C.; Jin, W. Improving Impervious Surface Estimation by Using Remote Sensed Imagery Combined With Open Street Map Points-of-Interest (POI) Data. IEEE J. Sel. Top. Appl. Earth Obs. Remote Sens. 2019, 12, 4265–4274. [Google Scholar] [CrossRef]
- Luo, N.; Wan, T.; Hao, H.; Lu, Q. Fusing High-Spatial-Resolution Remotely Sensed Imagery and OpenStreetMap Data for Land Cover Classification Over Urban Areas. Remote Sens. 2019, 11, 88. [Google Scholar] [CrossRef] [Green Version]
- Zhang, H.; Gorelick, S.M.; Zimba, P.V. Extracting Impervious Surface from Aerial Imagery Using Semi-Automatic Sampling and Spectral Stability. Remote Sens. 2020, 12, 506. [Google Scholar] [CrossRef] [Green Version]
- Wan, T.; Lu, H.; Lu, Q.; Luo, N. Classification of High-Resolution Remote-Sensing Image Using OpenStreetMap Information. IEEE Geosci. Remote Sens. Lett. 2017, 14, 2305–2309. [Google Scholar] [CrossRef]
- Jupova, K.; Bartalos, T.; Soukup, T.; Moser, G.; Serpico, S.B.; Krylov, V.; De Martino, M.; Manzke, N.; Rochard, N. Monitoring of green, open and sealed urban space. In Proceedings of the 2017 Joint Urban Remote Sensing Event, JURSE 2017, Dubai, United Arab Emirates, 6–8 March 2017. [Google Scholar]
- Zhao, Y.; Zhang, Y.; Wang, H.; Du, X.; Li, Q.; Zhu, J. Intraday Variation Mapping of Population Age Structure via Urban-Functional-Region-Based Scaling. Remote Sens. 2021, 13, 805. [Google Scholar] [CrossRef]
- Xu, M.; Cao, C.; Jia, P. Mapping Fine-Scale Urban Spatial Population Distribution Based on High-Resolution Stereo Pair Images, Points of Interest, and Land Cover Data. Remote Sens. 2020, 12, 608. [Google Scholar] [CrossRef] [Green Version]
- Chen, B.; Tu, Y.; Song, Y.; Theobald, D.; Zhang, T.; Ren, Z.; Li, X.; Yang, J.; Wang, J.; Wang, X.; et al. Mapping essential urban land use categories with open big data: Results for five metropolitan areas in the United States of America. ISPRS J. Photogramm. Remote Sens. 2021, 178, 203–218. [Google Scholar] [CrossRef]
- Pereira Galvão, R.F.; Flores Urushima, A.Y.; Hara, S.; De Jong, W. Analysis of Land Transition Features and Mechanisms in Peripheral Areas of Kyoto (1950–1960). Sustainability 2020, 12, 4502. [Google Scholar] [CrossRef]
- Khanal, N.; Uddin, K.; Matin, M.A.; Tenneson, K. Automatic Detection of Spatiotemporal Urban Expansion Patterns by Fusing OSM and Landsat Data in Kathmandu. Remote Sens. 2019, 11, 2296. [Google Scholar] [CrossRef] [Green Version]
- Yin, H.; Kong, F.; Hu, Y.; James, P.; Xu, F.; Yu, L. Assessing growth scenarios for their landscape ecological security impact, using the SLEUTH urban growth model. J. Urban Plan. Dev. 2016, 142, 1–13. [Google Scholar] [CrossRef]
- Kamarajugedda, S.A.; Lo, E.Y.M. Modelling Urban Growth for Bangkok and Assessing Linkage with Road Density and Socio-economic Indicators. Int. Arch. Photogramm. Remote Sens. Spat. Inf. Sci. 2019, XLII-4/W19, 255–262. [Google Scholar] [CrossRef] [Green Version]
- Aschwanden, G.D.; Wijnands, J.S.; Thompson, J.; Nice, K.A.; Zhao, H.; Stevenson, M. Learning to walk: Modeling transportation mode choice distribution through neural networks. Environ. Plan. B Urban Anal. City Sci. 2021, 48, 186–199. [Google Scholar] [CrossRef]
- Breiman, L. Random forests. Mach. Learn. 2001, 45, 5–32. [Google Scholar] [CrossRef] [Green Version]
- Li, S. Markov Random Field Modeling in Image Analysis, 3rd ed.; Springer: Berlin/Heidelberg, Germany, 2009. [Google Scholar]
- Geman, S.; Geman, D. Stochastic Relaxation, Gibbs Distributions, and the Bayesian Restoration of Images. IEEE Trans. Pattern Anal. Mach. Intell. 1984, PAMI-6, 721–741. [Google Scholar] [CrossRef]
- Scheunders, P.; Tuia, D.; Moser, G. Contributions of machine learning to remote sensing data analysis. In Data Processing and Analysis Methodology; Liang, S., Ed.; Comprehensive Remote Sensing; Elsevier: Amsterdam, The Netherlands, 2018; pp. 199–243. [Google Scholar]
- Li, J.; Bioucas-Dias, J.M.; Plaza, A. Spectral-spatial hyperspectral image segmentation using subspace multinomial logistic regression and Markov random fields. IEEE Trans. Geosci. Remote Sens. 2012, 50, 809–823. [Google Scholar] [CrossRef]
- Ghamisi, P.; Benediktsson, J.A.; Ulfarsson, M.O. Spectral-spatial classification of hyperspectral images based on hidden markov random fields. IEEE Trans. Geosci. Remote Sens. 2014, 52, 2565–2574. [Google Scholar] [CrossRef] [Green Version]
- Zhang, C.; Sargent, I.; Pan, X.; Gardiner, A.; Hare, J.; Atkinson, P.M. VPRS-Based regional decision fusion of CNN and MRF classifications for very fine resolution remotely sensed images. IEEE Trans. Geosci. Remote Sens. 2018, 56, 4507–4521. [Google Scholar] [CrossRef] [Green Version]
- Zheng, C.; Zhang, Y.; Wang, L. Multigranularity Multiclass-Layer Markov Random Field Model for Semantic Segmentation of Remote Sensing Images. IEEE Trans. Geosci. Remote Sens. 2021, 59, 10555–10574. [Google Scholar] [CrossRef]
- Pastorino, M.; Montaldo, A.; Fronda, L.; Hedhli, I.; Moser, G.; Serpico, S.B.; Zerubia, J. Multisensor and multiresolution remote sensing image classification through a causal hierarchical Markov framework and decision tree ensembles. Remote Sens. 2021, 13, 849. [Google Scholar] [CrossRef]
- De Giorgi, A.; Solarna, D.; Moser, G.; Tapete, D.; Cigna, F.; Boni, G.; Rudari, R.; Serpico, S.B.; Pisani, A.R.; Montuori, A.; et al. Monitoring the recovery after 2016 Hurricane Matthew in Haiti via Markovian multitemporal region-based modeling. Remote Sens. 2021, 13, 3509. [Google Scholar] [CrossRef]
- Zheng, C.; Pan, X.; Chen, X.; Yang, X.; Xin, X.; Su, L. An object-based markov random field model with anisotropic penalty for semantic segmentation of high spatial resolution remote sensing imagery. Remote Sens. 2019, 11, 2878. [Google Scholar] [CrossRef] [Green Version]
- Addesso, P.; Conte, R.; Longo, M.; Restaino, R.; Vivone, G. MAP-MRF cloud detection based on PHD filtering. IEEE J. Sel. Top. Appl. Earth Obs. Remote Sens. 2012, 5, 919–929. [Google Scholar] [CrossRef]
- Xu, L.; Wong, A.; Clausi, D.A. A novel Bayesian spatial-temporal random field model applied to cloud detection from remotely sensed imagery. IEEE Trans. Geosci. Remote Sens. 2017, 55, 4913–4924. [Google Scholar] [CrossRef]
- Benedek, C.; Shadaydeh, M.; Kato, Z.; Szirányi, T.; Zerubia, J. Multilayer Markov Random Field models for change detection in optical remote sensing images. ISPRS J. Photogramm. Remote Sens. 2015, 107, 22–37. [Google Scholar] [CrossRef] [Green Version]
- Solarna, D.; Moser, G.; Serpico, S.B. A Markovian approach to unsupervised change detection with multiresolution and multimodality SAR data. Remote Sens. 2018, 10, 1671. [Google Scholar] [CrossRef] [Green Version]
- Touati, R.; Mignotte, M.; Dahmane, M. Multimodal Change Detection in Remote Sensing Images Using an Unsupervised Pixel Pairwise-Based Markov Random Field Model. IEEE Trans. Image Process. 2020, 29, 757–767. [Google Scholar] [CrossRef]
- Jie, F.; Shi, Y.; Li, Y.; Liu, Z. Interactive region-based MRF image segmentation. In Proceedings of the 2011 4th International Congress on Image and Signal Processing, Shanghai, China, 15–17 October 2011; Volume 3, pp. 1263–1267. [Google Scholar] [CrossRef]
- Kim, C. Unsupervised Texture Segmentation of Natural Scene Images Using Region-based Markov Random Field. J. Signal Process. Syst. 2016, 83, 423–436. [Google Scholar] [CrossRef]
- Mei, T.; Zheng, C.; Zhong, S. Hierarchical region based Markov random field for image segmentation. In Proceedings of the 2011 International Conference on Remote Sensing, Environment and Transportation Engineering, Nanjing, China, 24–26 June 2011; pp. 381–384. [Google Scholar] [CrossRef]
- Solberg, A.; Taxt, T.; Jain, A. A Markov random field model for classification of multisource satellite imagery. IEEE Trans. Geosci. Remote Sens. 1996, 34, 100–113. [Google Scholar] [CrossRef]
- Felzenszwalb, P.F.; Huttenlocher, D.P. Efficient graph-based image segmentation. Int. J. Comp. Vis. 2004, 59, 167–181. [Google Scholar] [CrossRef]
- Serpico, S.B.; Moser, G. Weight parameter optimization by the Ho-Kashyap algorithm in MRF models for supervised image classification. IEEE Trans. Geosci. Remote Sens. 2006, 44, 3695–3705. [Google Scholar] [CrossRef]
- Duda, R.O.; Hart, P.E.; Stork, D.G. Pattern Classification, 2nd ed.; Wiley: Hoboken, NJ, USA, 2000. [Google Scholar]
- Koller, D.; Friedman, N. Probabilistic Graphical Models: Principles and Techniques; Adaptive Computation and Machine Learning; MIT Press: Cambridge, MA, USA, 2009. [Google Scholar]
- Li, W. Markov chain random fields for estimation of categorical variables. Math. Geol. 2007, 39, 321–335. [Google Scholar] [CrossRef]
- Li, W.; Zhang, C.; Willig, M.; Dey, D.; Wang, G.; You, L. Bayesian Markov Chain Random Field Cosimulation for Improving Land Cover Classification Accuracy. Math. Geosci. 2015, 47, 123–148. [Google Scholar] [CrossRef]
- Wang, W.; Li, W.; Zhang, C.; Zhang, W. Improving object-based land use/cover classification from medium resolution imagery by Markov chain geostatistical post-classification. Land 2018, 7, 31. [Google Scholar] [CrossRef] [Green Version]
- Li, W.; Zhang, C. Markov chain random fields in the perspective of spatial Bayesian networks and optimal neighborhoods for simulation of categorical fields. Comput. Geosci. 2019, 23, 1087–1106. [Google Scholar] [CrossRef]
- Zhang, W.; Li, W.; Zhang, C. Land cover post-classifications by Markov chain geostatistical cosimulation based on pre-classifications by different conventional classifiers. Int. J. Remote Sens. 2016, 37, 926–949. [Google Scholar] [CrossRef]
- Mokji, M.; Bakar, S.A. Gray Level Co-Occurrence Matrix Computation Based on Haar Wavelet. In Proceedings of the Computer Graphics, Imaging and Visualisation (CGIV 2007), Bangkok, Thailand, 14–17 August 2007; pp. 273–279. [Google Scholar]
- Richards, J. Remote Sensing Digital Image Analysis, 5th ed.; Springer: Berlin/Heidelberg, Germany, 2013. [Google Scholar]
- Dell’Acqua, F.; Gamba, P. Texture-based characterization of urban environments on satellite SAR images. IEEE Trans. Geosci. Remote Sens. 2003, 41, 153–159. [Google Scholar] [CrossRef]
- Myint, S.W. A Robust Texture Analysis and Classification Approach for Urban Land-Use and Land-Cover Feature Discrimination. Geocarto Int. 2001, 16, 29–40. [Google Scholar] [CrossRef]
- Prosperi, T.; Moser, G.; Sacco, N.; Rebora, F. Traffic Zones Discretization and Origin-Destination Matrix Estimation by means of Transport Demand and Satellite Data Fusion. In Proceedings of the IEEE Conference on Intelligent Transportation Systems, Proceedings, ITSC, Indianapolis, IN, USA, 19–22 September 2021; pp. 3217–3222. [Google Scholar]
- Goodfellow, I.; Bengio, Y.; Courville, A. Deep Learning; MIT Press: Cambridge, MA, USA, 2016. [Google Scholar]


| Residential ■ | Mixed ■ | Working ■ | |
|---|---|---|---|
| Producer accuracy (%) | 87.5 | 80.0 | 100 |
| User accuracy (%) | 87.5 | 85.0 | 85.0 |
| Overall accuracy (%) | 85.0 | ||
| Average accuracy (%) | 90.0 | ||
| Cohen’s | 0.78 | ||
| Producer Accuracy (%) | |||||
|---|---|---|---|---|---|
| Residential ■ | Mixed ■ | Working ■ | Vegetation ■ | Water Body ■ | |
| (i) | 34.54 | 45.77 | 23.28 | 41.90 | 99.96 |
| (ii) | 36.37 | 46.62 | 19.58 | 51.36 | 99.99 |
| (iii) | 37.18 | 63.13 | 0 | 41.90 | 99.97 |
| (iv) | 28.49 | 55.22 | 17.22 | 51.36 | 99.99 |
| Proposed pixelwise | 90.42 | 87.07 | 77.58 | 42.94 | 99.99 |
| Proposed MRF region-based | 70.71 | 88.69 | 99.99 | 99.23 | 100 |
| User Accuracy (%) | |||||
| residential ■ | mixed ■ | working ■ | vegetation ■ | water body ■ | |
| (i) | 20.33 | 17.73 | 27.23 | 99.56 | 99.97 |
| (ii) | 22.68 | 24.75 | 28.30 | 99.81 | 99.99 |
| (iii) | 38.48 | 29.67 | 0 | 99.56 | 99.97 |
| (iv) | 9.13 | 16.61 | 46.31 | 99.81 | 99.99 |
| Proposed pixelwise | 39.29 | 53.96 | 77.28 | 99.55 | 100 |
| Proposed MRF region-based | 88.18 | 84.68 | 76.04 | 100 | 100 |
| Overall Accuracy (%) | Average Accuracy (%) | Cohen’s | |||
| (i) | 50.12 | 49.09 | 0.3820 | ||
| (ii) | 54.76 | 48.44 | 0.4274 | ||
| (iii) | 52.82 | 50.79 | 0.4138 | ||
| (iv) | 49.32 | 50.46 | 0.3856 | ||
| Proposed pixelwise | 70.25 | 79.60 | 0.6286 | ||
| Proposed MRF region-based | 89.98 | 91.72 | 0.8706 | ||
Publisher’s Note: MDPI stays neutral with regard to jurisdictional claims in published maps and institutional affiliations. |
© 2022 by the authors. Licensee MDPI, Basel, Switzerland. This article is an open access article distributed under the terms and conditions of the Creative Commons Attribution (CC BY) license (https://creativecommons.org/licenses/by/4.0/).
Share and Cite
Pastorino, M.; Gallo, F.; Di Febbraro, A.; Moser, G.; Sacco, N.; Serpico, S.B. Multimodal Fusion of Mobility Demand Data and Remote Sensing Imagery for Urban Land-Use and Land-Cover Mapping. Remote Sens. 2022, 14, 3370. https://doi.org/10.3390/rs14143370
Pastorino M, Gallo F, Di Febbraro A, Moser G, Sacco N, Serpico SB. Multimodal Fusion of Mobility Demand Data and Remote Sensing Imagery for Urban Land-Use and Land-Cover Mapping. Remote Sensing. 2022; 14(14):3370. https://doi.org/10.3390/rs14143370
Chicago/Turabian StylePastorino, Martina, Federico Gallo, Angela Di Febbraro, Gabriele Moser, Nicola Sacco, and Sebastiano B. Serpico. 2022. "Multimodal Fusion of Mobility Demand Data and Remote Sensing Imagery for Urban Land-Use and Land-Cover Mapping" Remote Sensing 14, no. 14: 3370. https://doi.org/10.3390/rs14143370
APA StylePastorino, M., Gallo, F., Di Febbraro, A., Moser, G., Sacco, N., & Serpico, S. B. (2022). Multimodal Fusion of Mobility Demand Data and Remote Sensing Imagery for Urban Land-Use and Land-Cover Mapping. Remote Sensing, 14(14), 3370. https://doi.org/10.3390/rs14143370