Article

Dynamic Monitoring of Laohugou Glacier No. 12 with a Drone, West Qilian Mountains, West China

1
Qilian Observation and Research Station of Cryosphere and Ecologic Environment, State Key Laboratory of Cryospheric Science, Northwest Institute of Eco-Environment and Resources, Chinese Academy of Sciences, Lanzhou 730000, China
2
University of Chinese Academy of Sciences, Beijing 100049, China
3
Northwest Institute of Eco-Environment and Resources, Chinese Academy of Sciences, Lanzhou 730000, China
*
Author to whom correspondence should be addressed.
Remote Sens. 2022, 14(14), 3315; https://doi.org/10.3390/rs14143315
Submission received: 18 May 2022 / Revised: 15 June 2022 / Accepted: 5 July 2022 / Published: 9 July 2022

Abstract

:
Laohugou glacier No. 12 (LHG12), located in the northeast of the Qinghai–Tibet Plateau, is the largest valley glacier in the Qilian mountains. Since 1957, LHG12 has shrunk significantly. Due to the limitations of in situ observations, simulations and investigations of LHG12 have higher levels of uncertainty. In this study, consumer-level, low-altitude microdrones were used to conduct repeated photogrammetry at the lower part of LHG12, and a digital orthophoto map (DOM) and a digital surface model (DSM) with a resolution at the centimeter scale were generated, from 2017 to 2021. The dynamic parameters of the glacier were detected by artificial and automatic extraction methods. Using a combination of GNSS and drone-based data, the dynamic process of LHG12 was analyzed. The results show that the terminus of LHG12 has retreated by 194.35 m in total and by 19.44 m a−1 on average during 2008–2021. The differential ablation leading to terminus retreat distance markedly increased during the study period. In 2019–2021, the maximum annual surface velocity was 6.50 cm day−1, and during ablation season, the maximum surface velocity was 13.59 cm day−1, 52.17% higher than it is annually. The surface parameters, motion, and mass balance characteristics of the glacier had significant differences between the west and east branches. The movement in the west branch is faster than it is in the east branch. Because of the extrusion of the two ice flows, there is a region with a faster surface velocity at the ablation area. The ice thickness of LHG12 is decreasing due to intensified ablation, leading to a deceleration in the surface velocity. In large glaciers, this phenomenon is more obvious than it is in small glaciers in the Qilian mountains.

Graphical Abstract

1. Introduction

As one of the components of Earth’s climatic system, the cryosphere is the most sensitive to climate change and has a significant impact on ecosystems, the environment, and sustainable social and economic development [1,2,3]. As the most important component of the cryosphere, glaciers and ice sheets store about 70% of the freshwater resources in the world [4]. Glacier changes are a key point in glaciology research and also represent an important factor in the climate, water resources, and sea level changes [5,6,7,8,9]. Glaciers are the most important freshwater resource in the arid regions of Northwest China [10]; at the same time, glaciers are not only an important driving force but also record and act as indicators of climate change [11,12]. Due to global warming, glaciers around the world have shrunk significantly, and this is irreversible [13,14]. Over the past few decades, the area, length, and mass balance (MB) of global mountain glaciers have been reduced consistently, something that has been detected by both satellite and ground observations; however, inter-annual and regional differences can be observed [15].
The Qilian mountains are located in the northeast region of the Qinghai–Tibet Plateau and are the natural boundary of the Qinghai and the Gansu provinces. They provide a source of fresh water via the inland river, especially the Hexi corridor. They are also an important ecological barrier of the northwest region of China. In recent years, the glaciers in the Qilian Mountains have shown massive volume losses, with the contribution rate of glacier melt runoff being over the critical point [16,17]. In the Qilian mountains, there are 2683 glaciers that are 1597.81 km2 in area and 84.48 km3 in volume [18]. Previous research used ground survey or remote sensing methods to describe how glaciers in the Qilian mountains have shrunk significantly; however, because of the limitations of satellite remote sensing data, there have been some differences in terms of the study period and results, and many studies have focused on changes in glacier area [19,20,21,22,23]. Investigations of glacier volume or surface elevation changes acquired using methods, such as volume–area scaling or DSM difference estimations, still had high levels of uncertainty [24,25,26,27].
Satellite remote sensing data with global coverage can effectively monitor glacial terrain. However, temporal and ground resolutions, the cost of high-resolution data with large scales, and the influence of cloud or snow cover limit the application of satellite remote sensing in glaciology research. Drone-based monitoring can easily overcome those limitations. The potential for using drones in glaciology is huge, and drones could play a great supporting role in field-based and satellite remote sensing-based glaciology observations [28,29,30,31,32,33]. Glaciers located in high mountainous areas are always under harsh conditions, such as having a hostile climate or poor approachability, and this is a huge limitation in field observations along with inadequate labor and funding, creating great difficulties in the dynamic research on layers. Observations of Laohugou Glacier No. 12 (LHG12) are more comprehensive than others in the Qilian Mountains. Observational parameters, such as mass balance and surface velocity, among others, were investigated by glaciological methods, but because of low accessibility in the ice serac region, the mid–low part of LHG12, observation data are always interrupted [34,35]. Due to the limitations of in situ observation, the investigation of LHG12 in the Qilian mountains with a thermomechanically coupled ice flow model experienced errors at the terminus region [36]. In this study, consumer-level, low-altitude micro drones were used to conduct repeated photogrammetry at the lower part of LHG12, and a digital orthophoto map (DOM) and a digital surface model (DSM) with centimeter-scale resolution were generated. LHG12′s dynamic process was analyzed; we found that there have been significant differences in the dynamic processes between the east and west branches, and the movement in the west branch is faster than it is in the east branch, even below the confluence area. In the previous monitoring and simulation studies, the differences in dynamic processes between the east and west branch were ignored. The aim of this paper is that provide accurate data support for glacier dynamic simulations for further research.

2. Materials and Methods
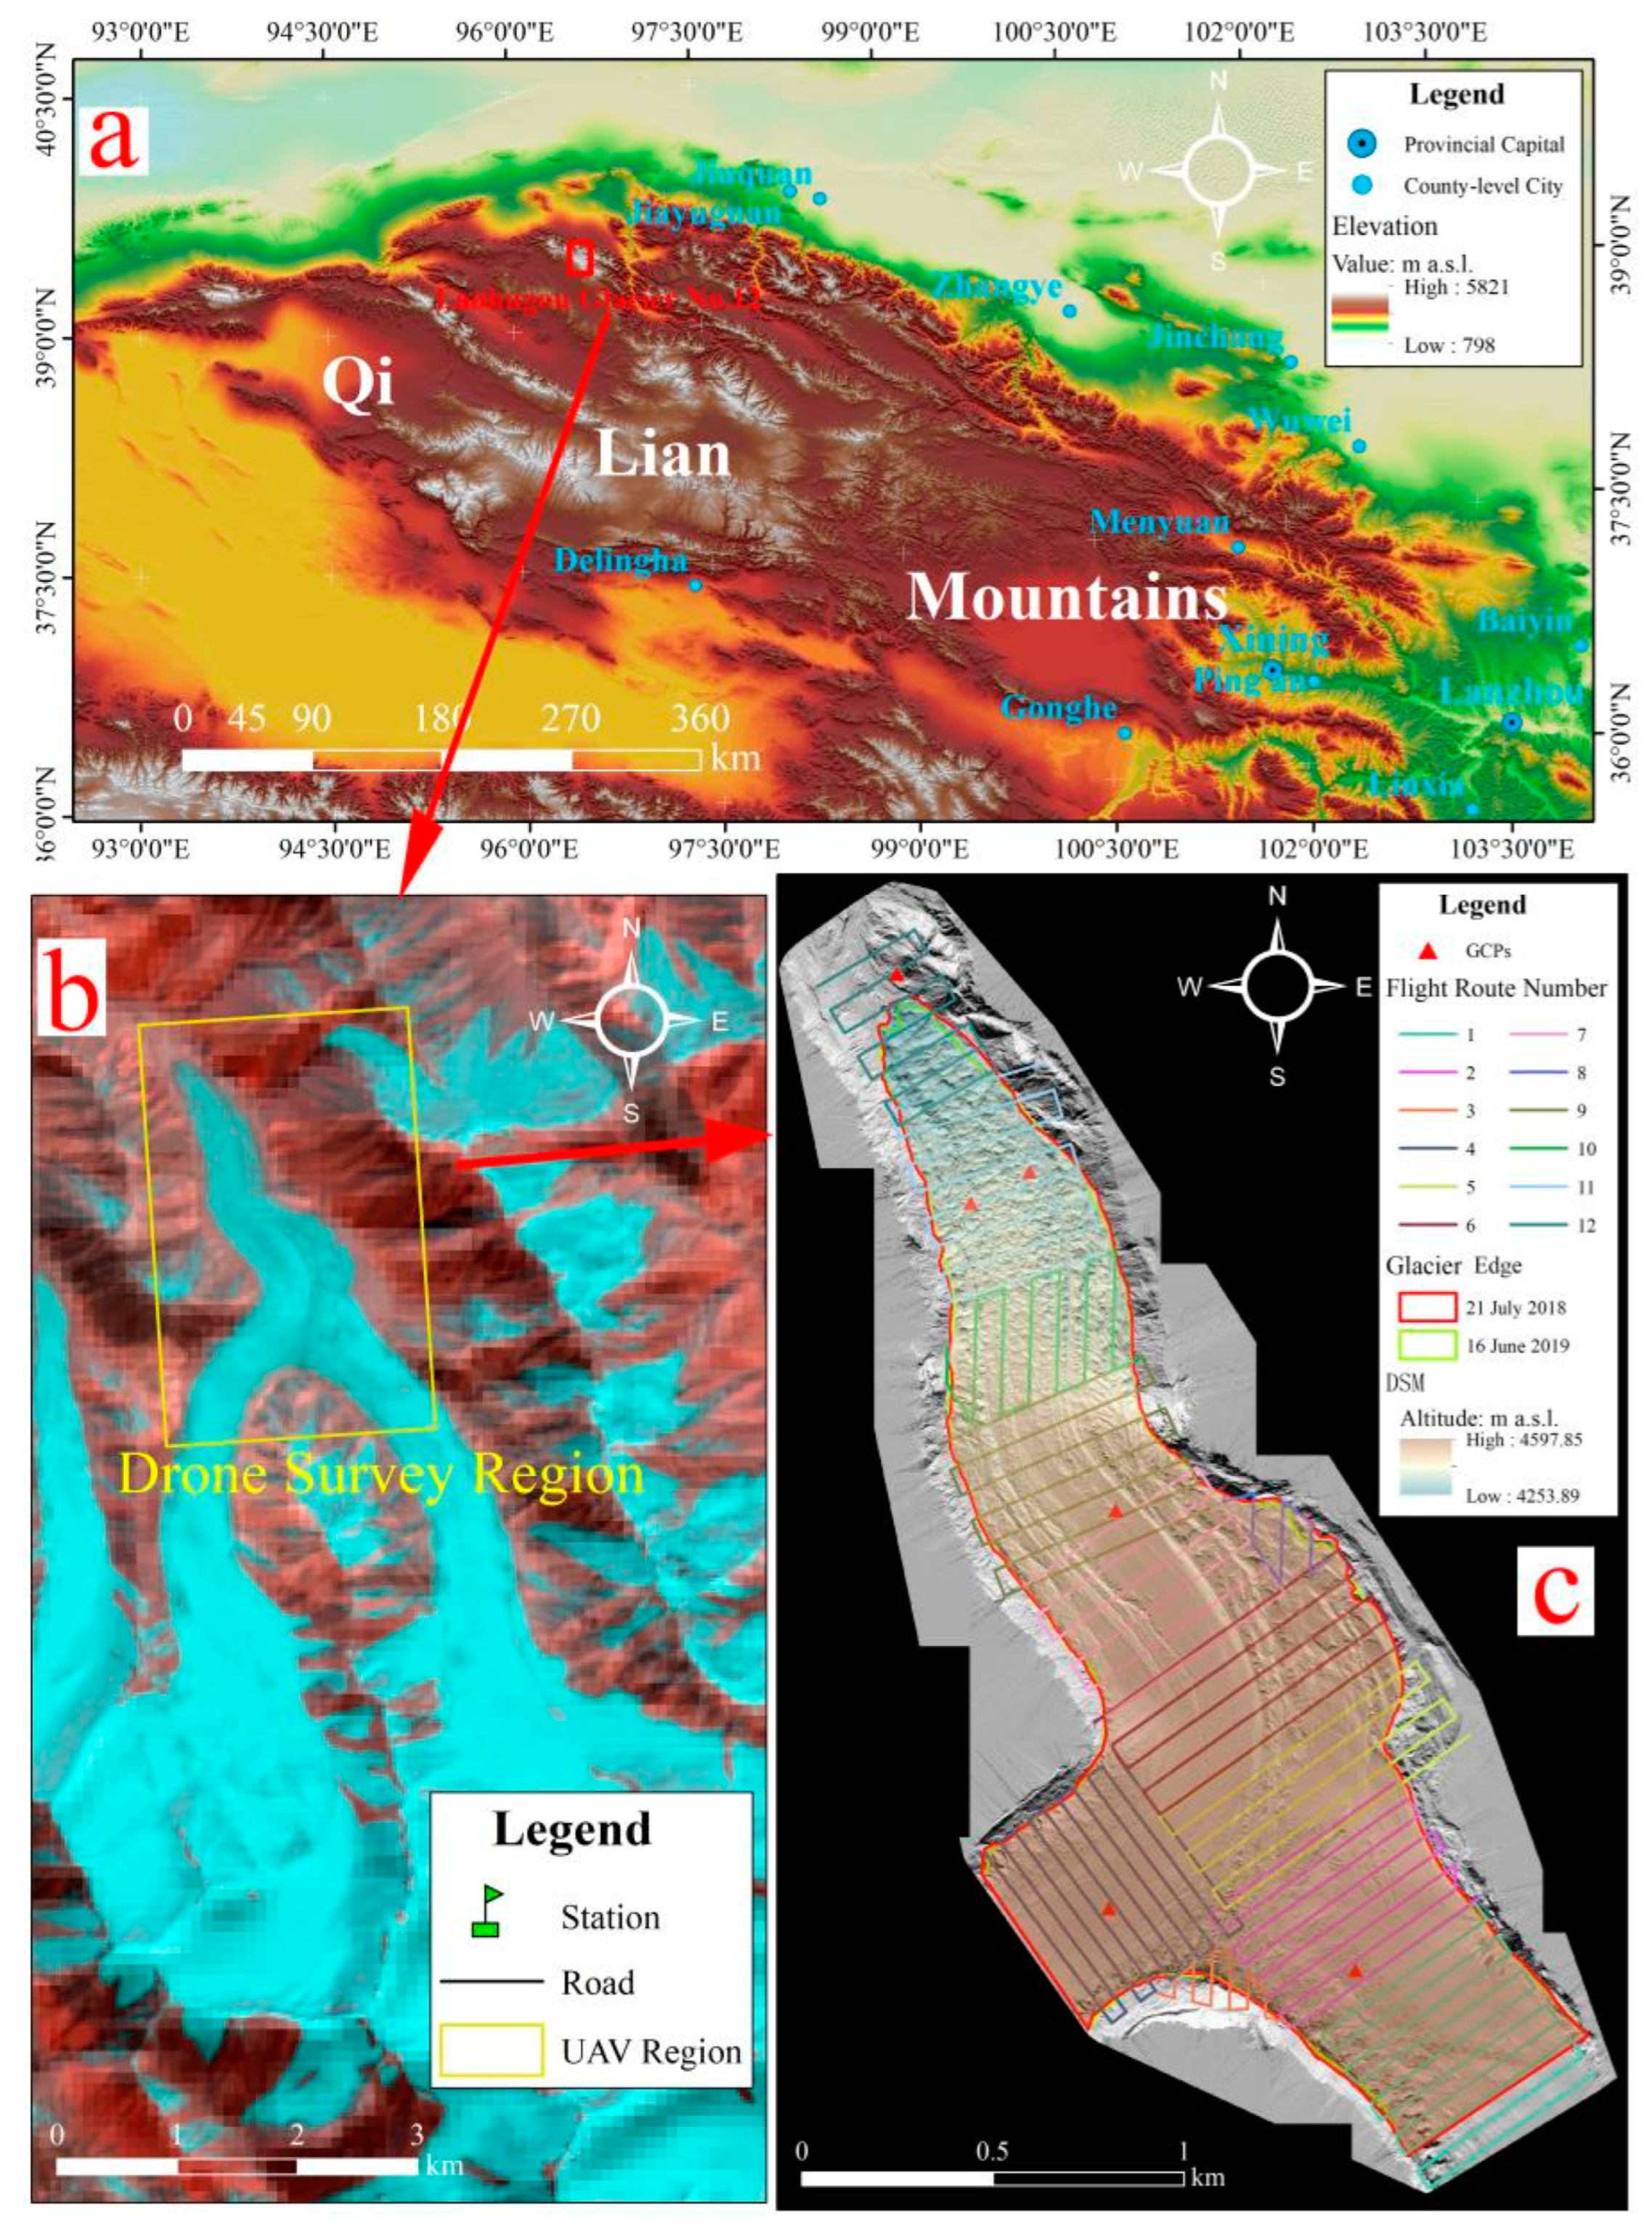
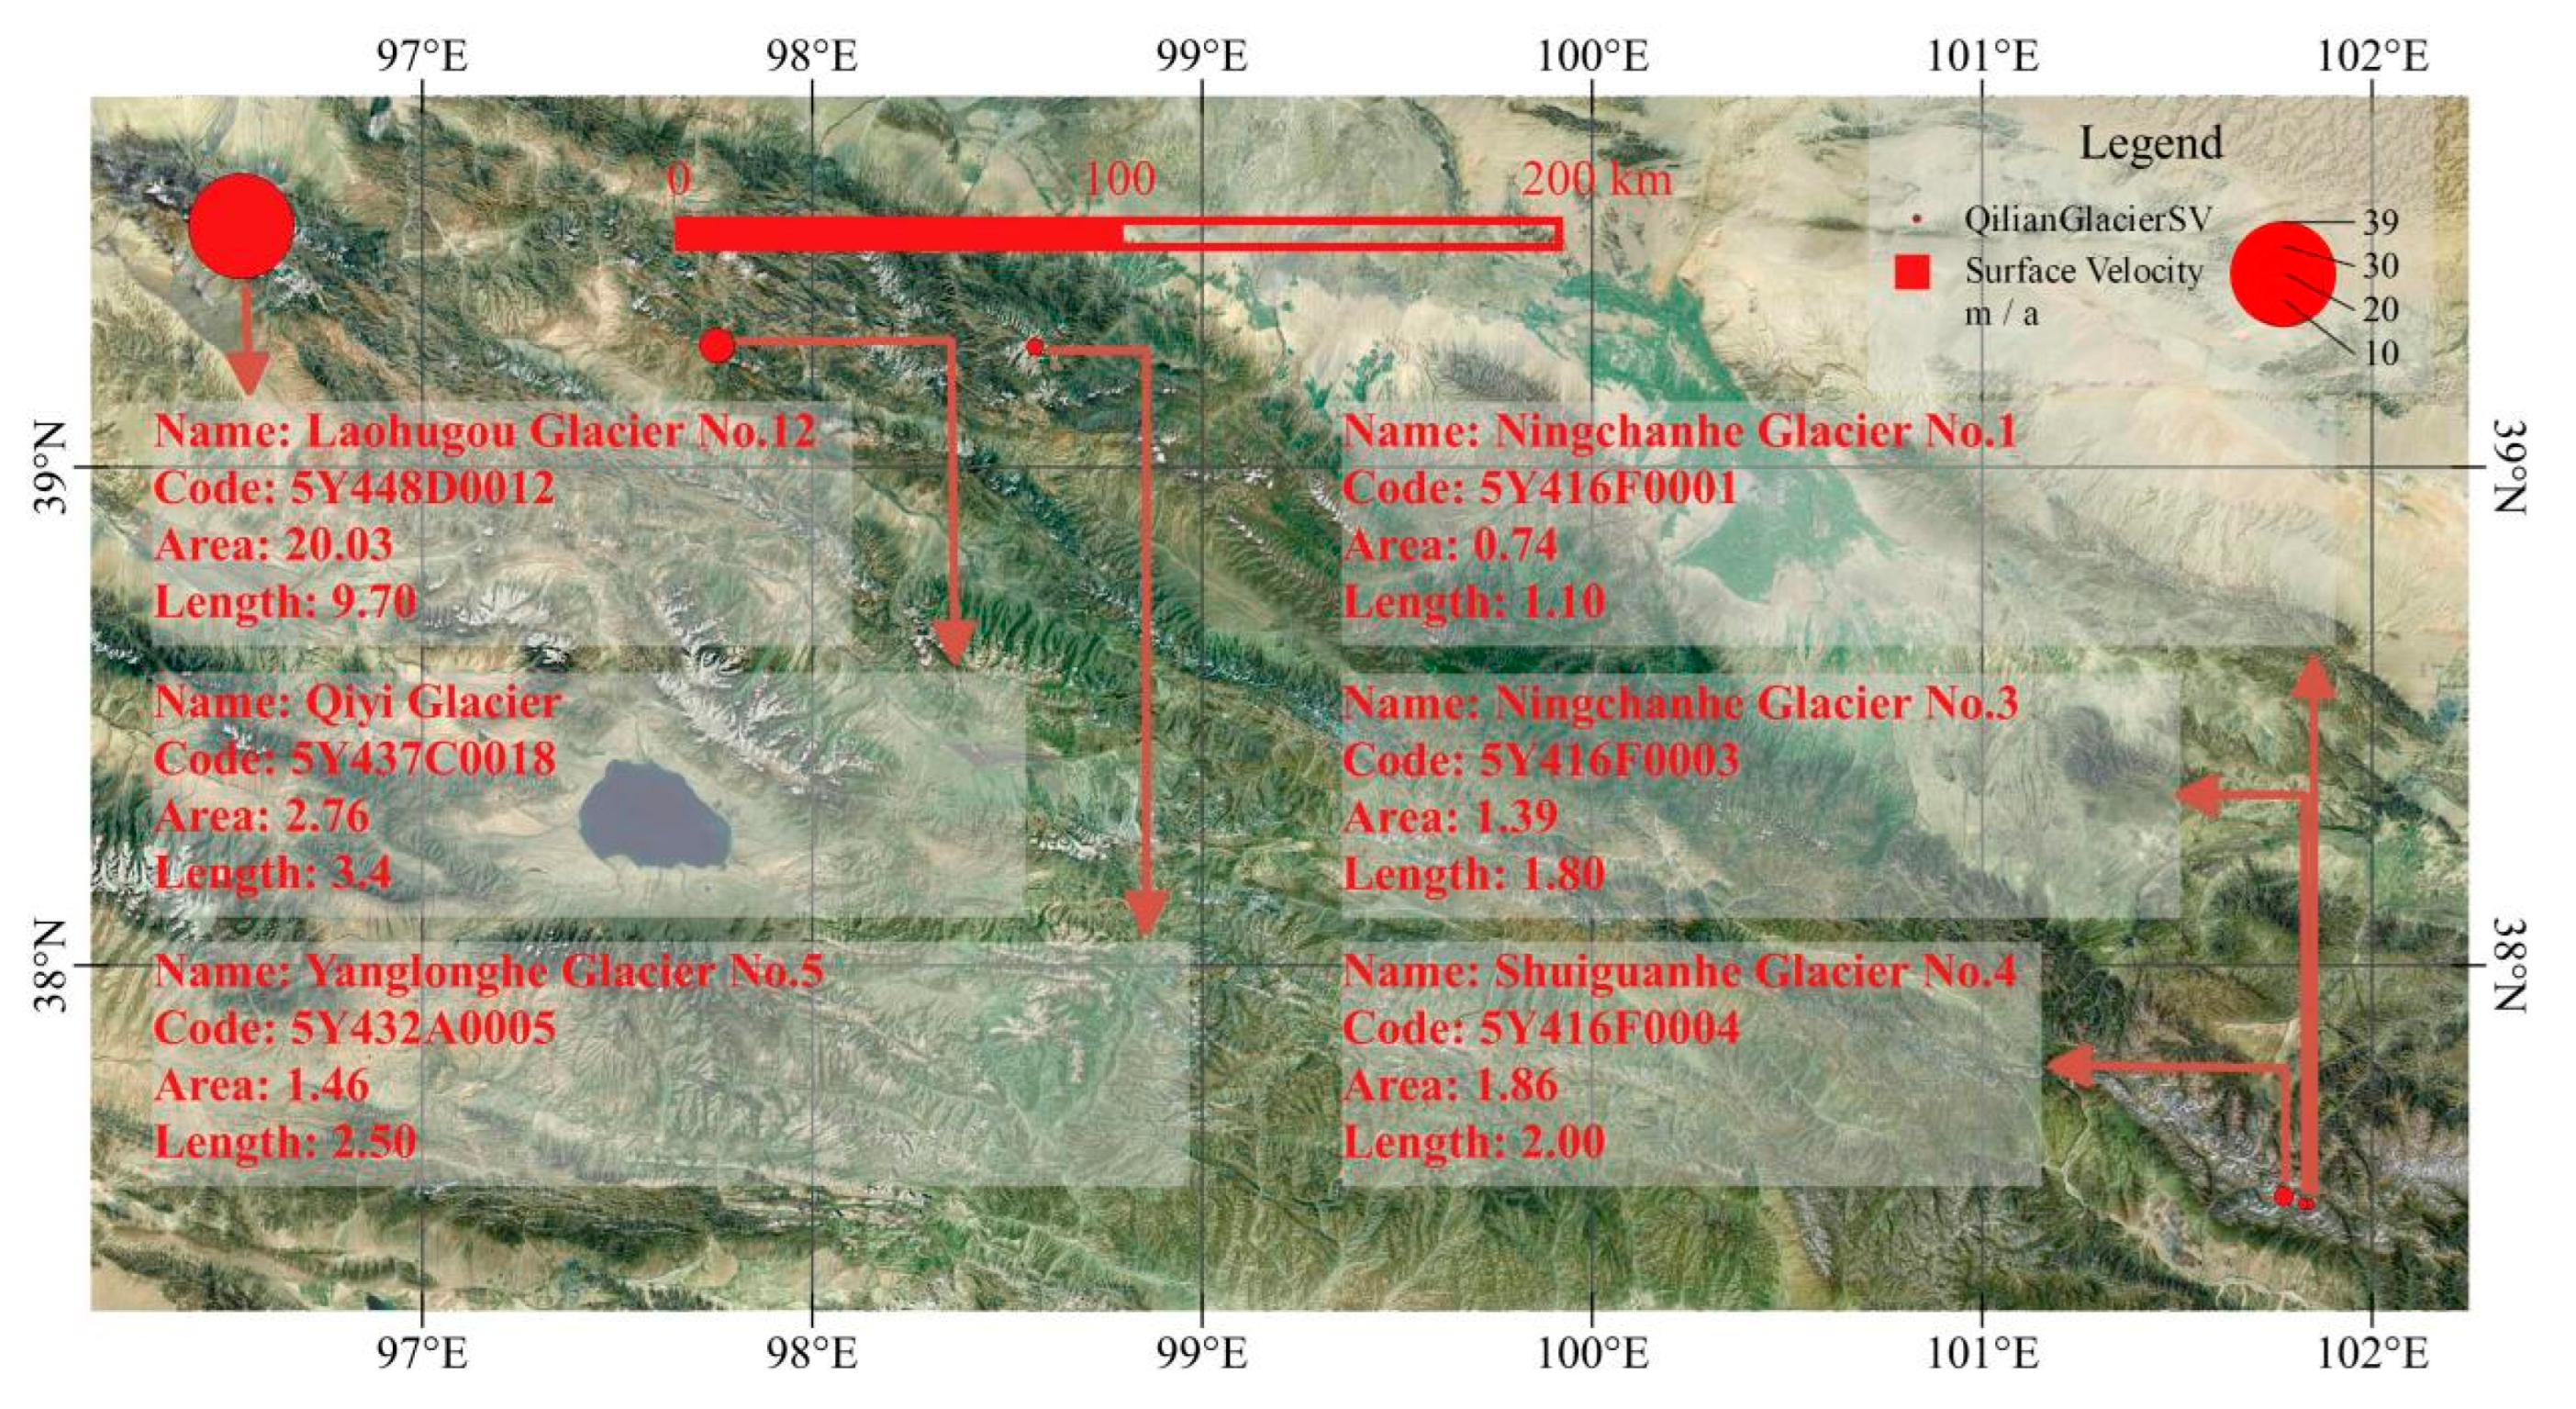
2.1. Study Area

LHG12 (glacier code: 5Y448D0012) is located in the northeast region of the Qinghai-Tibetan Plateau (Figure 1a). It is 9.7 km in length, 20.37 km2 in area, and is the largest valley glacier in the Qilian mountains [37]. LHG12 has a typical continental climate that is characterized and influenced by westerlies all year round. It is also located at 4200 m a.s.l., has a daily mean air temperature in the summer (from 1 June to 30 September) above 0 °C, and precipitation that mainly occurs from May to September. The average annual temperatures of the air and glacial surface are −2.6 °C and −6.4 °C, respectively, with 317 mm w.e. of annual precipitation. The maximum monthly precipitation was 142 mm w.e. in July, accounting for 36% of the annual precipitation in 2019 [38]. Due to increases in air temperature, especially in autumn and winter, the ice temperature and climate sensitivity of LHG12 have increased, and LHG12 has shrunk significantly since 1957 [39]. Ground-penetrating radar (GPR) data show that the bed topography of the east branch is generally more rugged than that of west branch, while the surface slopes of both tributaries are gentle; in the upper confluence area, the ice thicknesses of the east branch and west branch were 122 m and 157 m, respectively. Furthermore, due to transverse compression and convergence from the two ice flows, the ice depth is 162 m at the center of the confluence area [40].

2.2. Field Survey

PHANTOM 4 Pro (P4P) [41] and Mavic 2 Pro (M2P) [42] produced by the DJI Innovation Company were used as the image platform, and Pix4D Capture (Android edition) was used as the route-planning software. Drone observations of LHG12 started in 2017. At first, we used P4P to test the flight control, time, and altitude, and the battery capability had also been tested. To increase efficiency and reduce discharge from the lithium-ion batteries in high-altitude and low-temperature alpine areas and ensure flight safety, each flight time was not more than 13 min. At the terminus region, the effects of the ground control points (GCPs) with different numbers and distributions were tested to determine the accuracy of the drone-based photogrammetry, and an observation scheme suitable for drone-based photogrammetry at the mid–lower regions of LHG12 was determined [43]. In this study, five GCPs were deployed along the glacier’s mid-line (Figure 1c), and except for in 2017, each drone survey included 12 routes and captured about 1500 images. A total 6 drone surveys were conducted. The overlap was set to 75% in Pix4D Capture, and the wind speed was no more than a moderate breeze at every site. An overview of the flights is shown in Table 1. Images covered about 2 km2 (Figure 1c). The drone flew according to the planned routes, and captured the images automatically; meanwhile, the GCPs deployed on the surface of LHG12 in the survey region were measured by the Globe Navigation Satellite System (GNSS) receivers. The measurement accuracies of SOUTH S86 and SOUTH INNO7 GNSS receivers produced by the SOUTH [44] set in real-time kinematic (RTK) mode were ±3 cm vertically and ± 1.5 cm horizontally. GNSS was used with the RTK mode to measure the terminus position of LHG12 in the period from 2008–2013 [37] and 15 sticks (along the mid-ice flow, 6 sticks were set at the west branch surface, and 9 sticks were set at the east branch surface) that has been placed in the ice were also measured as surface velocity markers.
The ground sample distance (GSD) of the drone-based photogrammetry was dependent on flight height (H) as well as the sensor parameters and could be estimated by Functions (1) and (2) [45]. Some lens manufacturers provide the focal length (F35) as the 35 mm equivalent. It is not the 35 mm equivalent, but instead the real focal length that should be used in Pix4Dmapper. In order to find the real focal length, some computations are needed. In the case of a 4:3 ratio system, the formula for the real focal length FR is:
F R = ( F 35 · S W ) / 34.6
F35 is the focal length that corresponds to the 35 mm equivalent; FR is real focal length (mm); SW is the real sensor width. The relationship between H (m) and GSD (cm/pixel) is:
H = ( i m W · G S D · F R ) ( S W · 100 )
where imW is the image width (pixel).

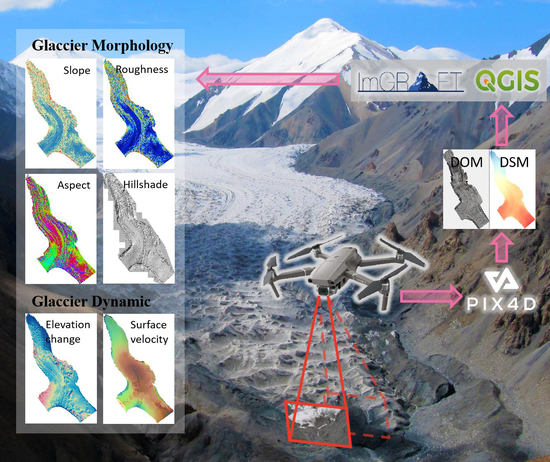
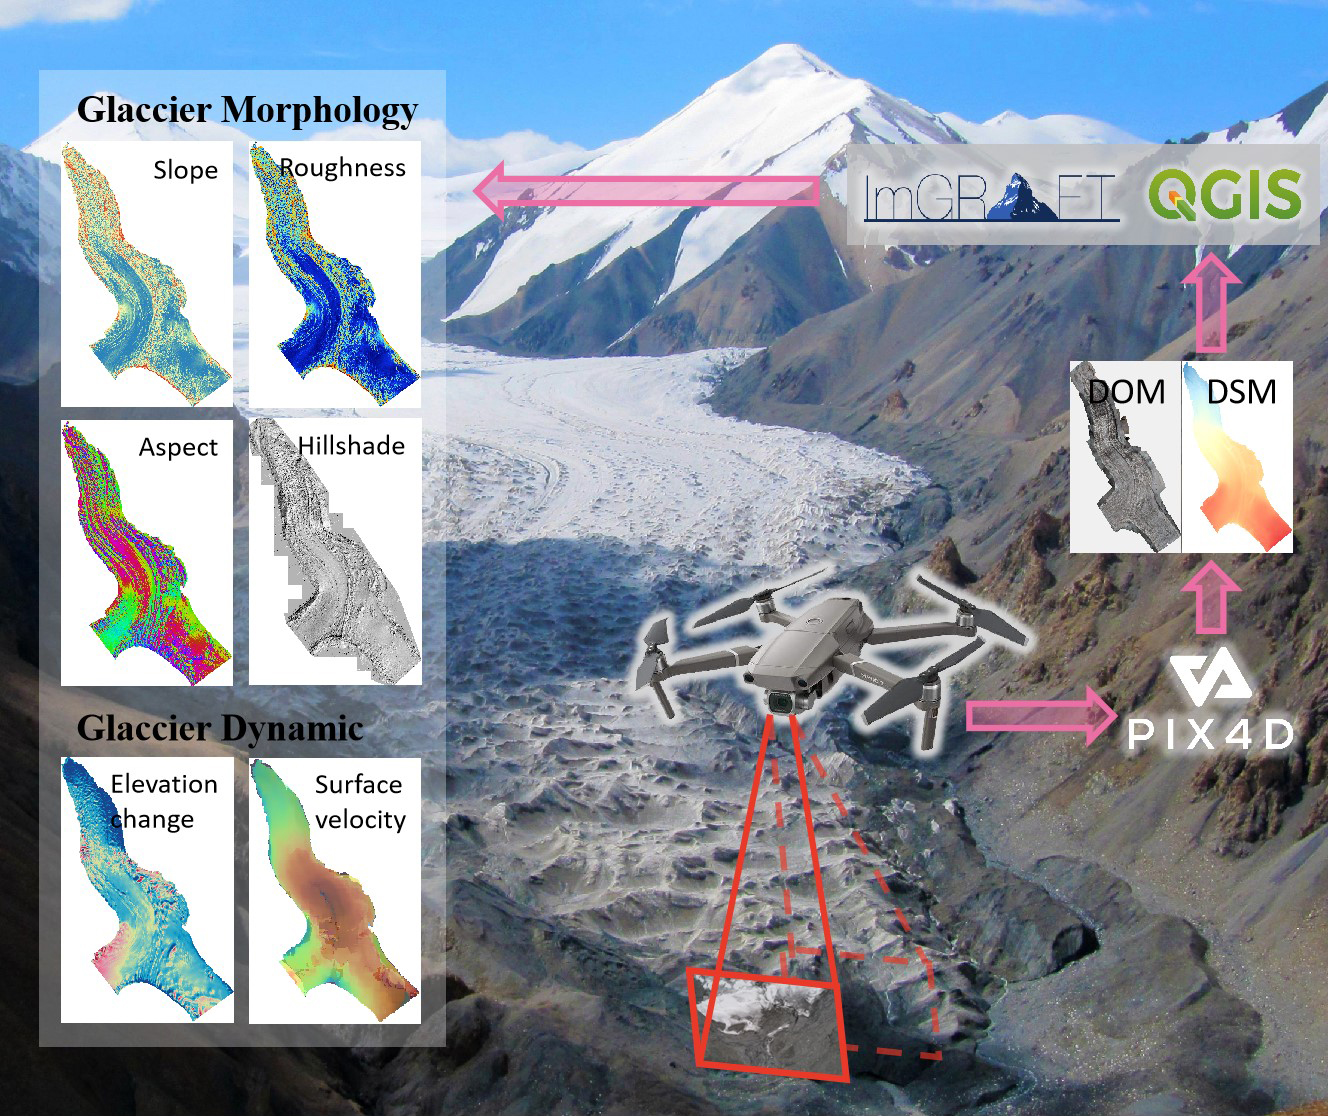
2.3. Image Processing

Five GCPs and all of the aerial photos were imported to the Pix4D Mapper software, and each GCP was marked in at least three photos. Finally, the DSM and DOM with a 5 cm GSD were acquired. The projection of the DSM and DOM was UTM 47N, and the ellipsoid of projection was WGS84. We used QGIS [46] software to process the DOM and DEM, and the glacier extent and terminus position were extracted by the DOM acquired in 2018, 2019, and 2021. For 2017, the DOM was only extracted in the terminus position. Slope, aspect, and roughness were extracted by DSM acquired in 2018, 2019, and 2021. Images were clipped by the same range layer in the survey region.

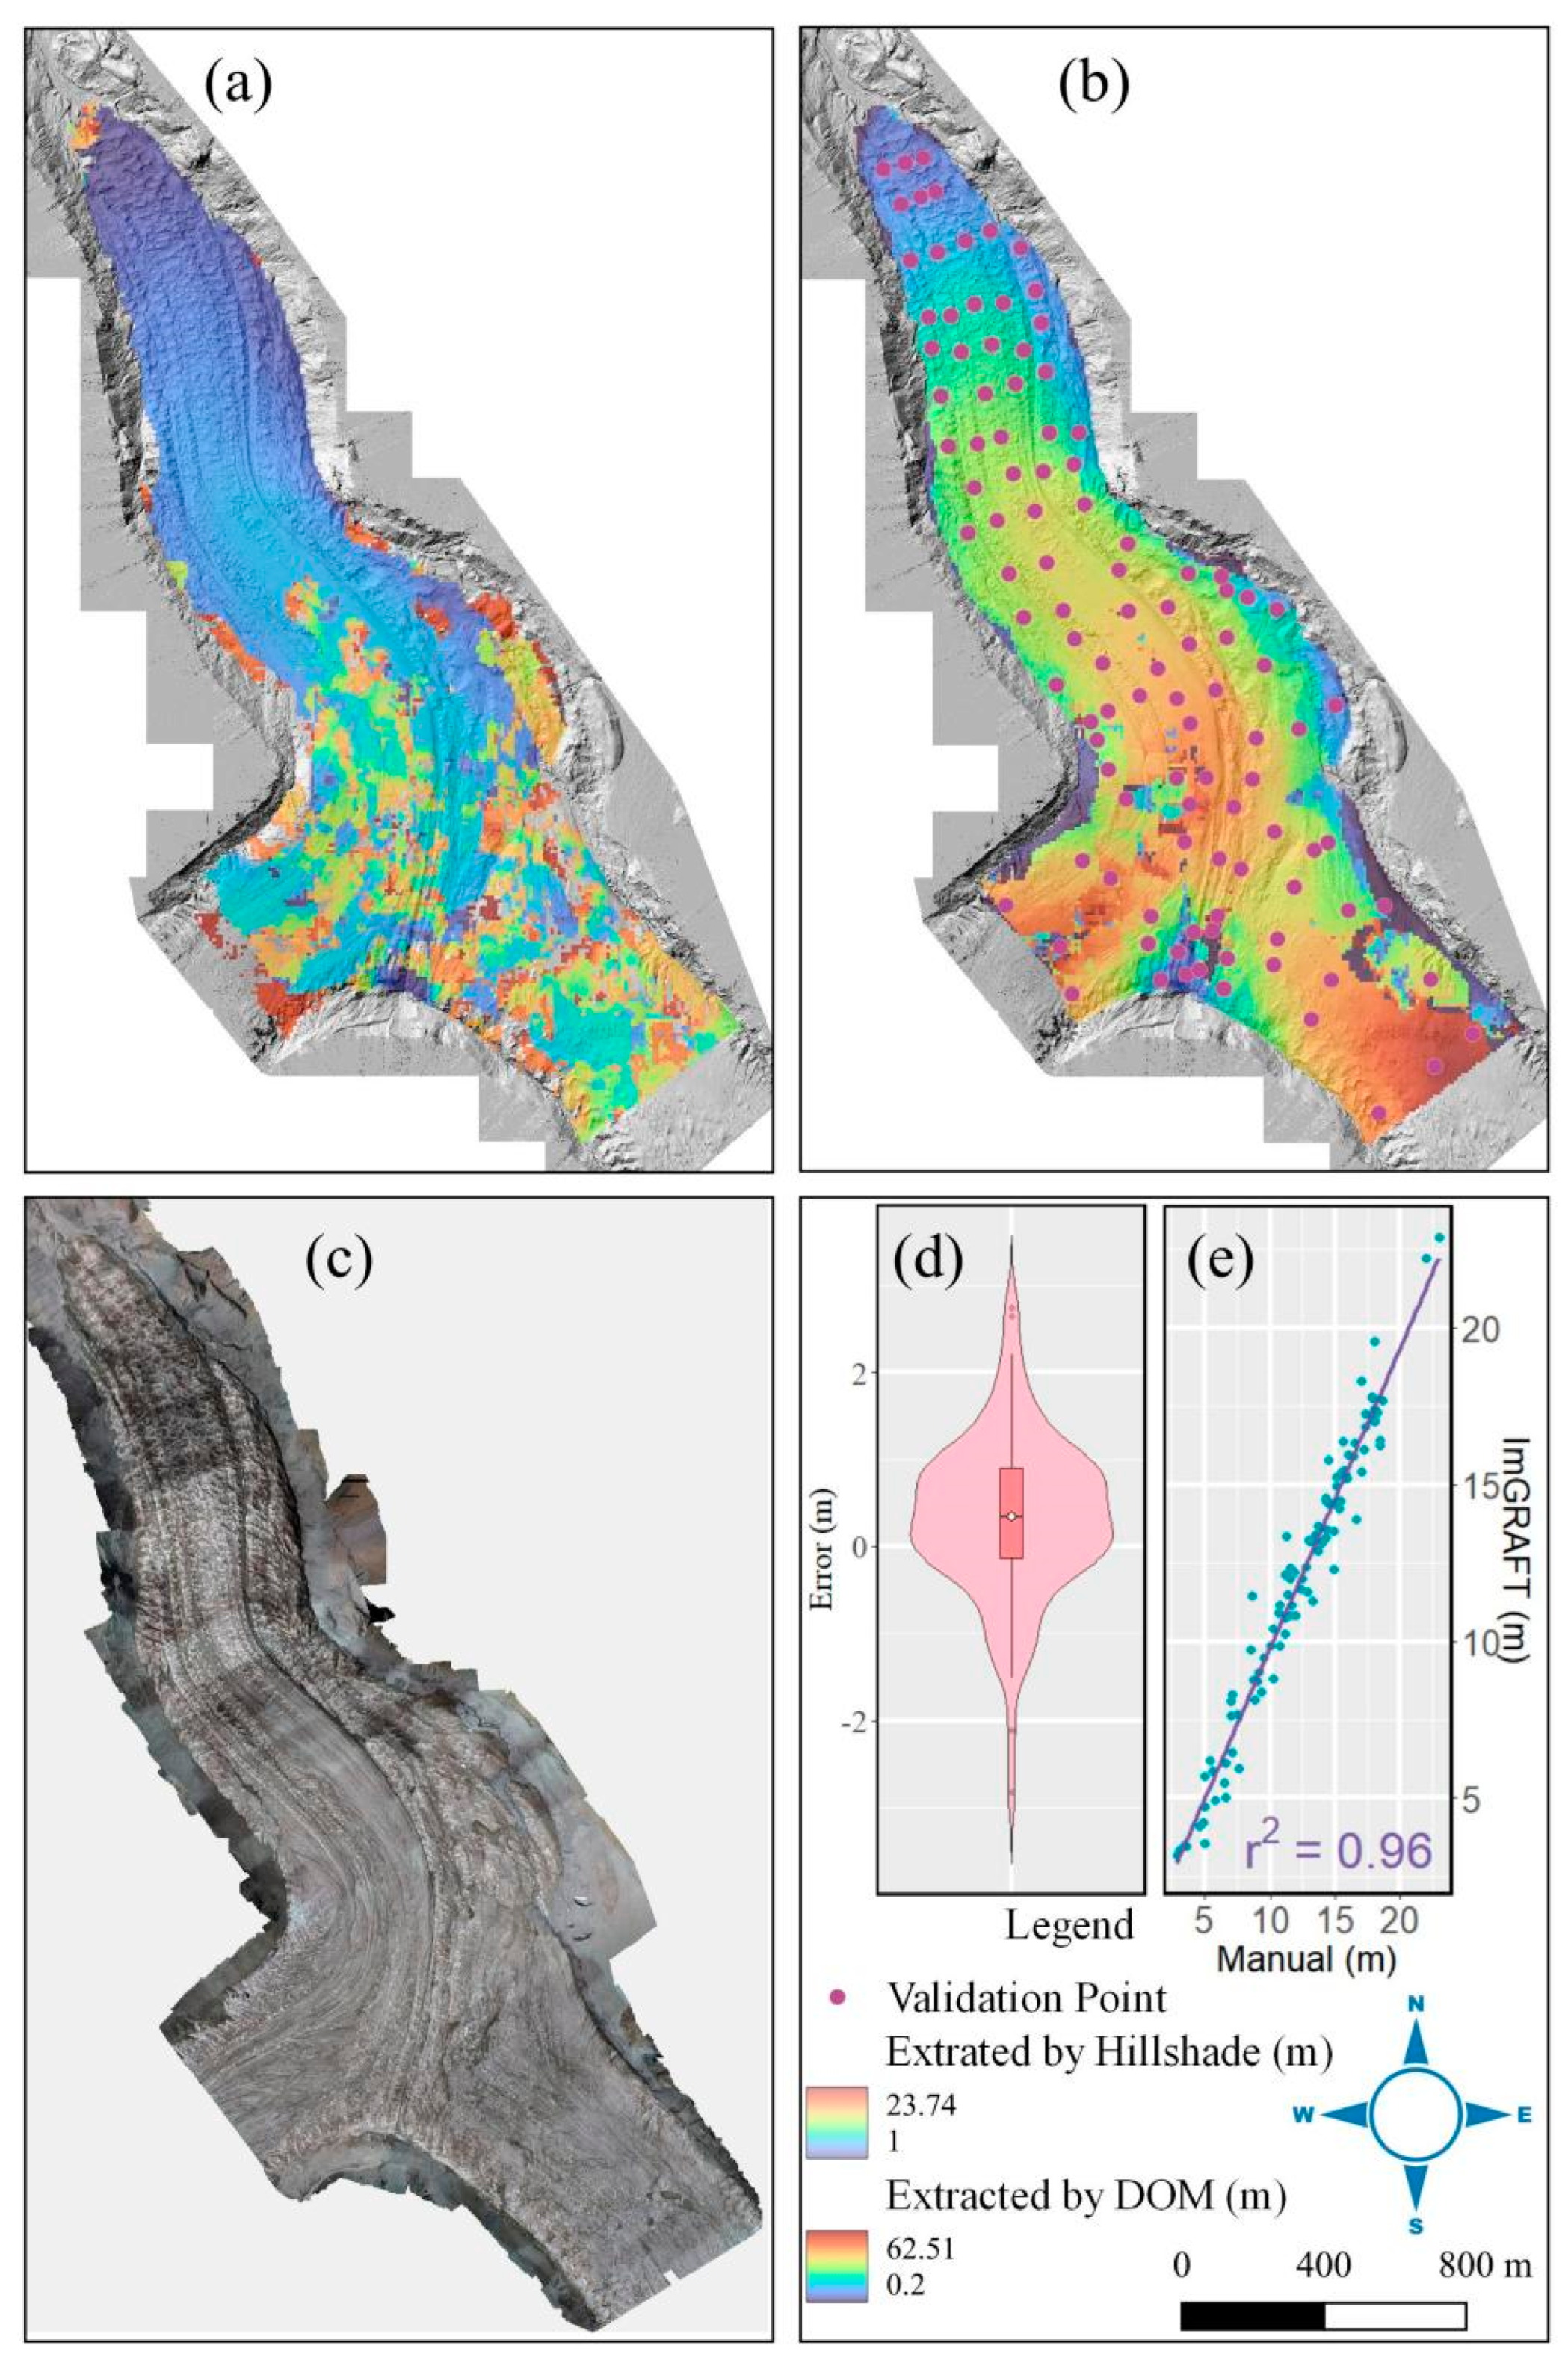
2.4. Glacier Surface Displacement Extraction

The ImGRAFT software package was used to extract the LHG12 surface displacement from July 2018 to September 2021. ImGRAFT is an open-source package that encompasses georeferencing, georectification, and terrestrial feature tracking [47]. In order to determine displacement, we used the templatematch function with the standard normalized cross-correlation (NCC) algorithm in ImGRAFT. NCC was outperformed in areas with poor visual contrast and in areas with thin clouds or changing snow conditions from one image to the next. Different illumination conditions in two images can lead to mismatches [48]. During the flight missions, the illumination conditions inevitably changed, leading to an inconsistent DOM gray scale (Figure 2c). There were also huge displacement extraction outliers (Figure 2a). To avoid this issue, hill-shade images generated by DSM were used as input. Those hill-shade images highlighted LHG12′s surface texture while avoiding different illumination conditions at the same time. However, there were still some outliers in the displacement-extracted results (Figure 2b). In those areas, the glacier surface mostly consisted of bare ice and lower roughness, leading to more outliers. Therefore, the search window size had to be big enough to include surface texture features [49]. Considering the computing capability, the images were re-sampled to a 1 m resolution, and the search window size was set to 200, while the relative distance on the ice surface was 200 m.

2.5. Meteorologic Data

In 2009, an automatic meteorological station (AWS) was deployed at 4200 m a.s.l. beyond the research station which is 1.5 km from terminus of LHG12. The AWS had air temperature (1.5 m from ground) and precipitation (T-200B) sensors connected to a data logger (CR-1000), and air temperature and precipitation data have been recorded continuously since August 2009.

2.6. Uncertainty Estimation

In order to estimate of the glacier surface displacement extraction uncertainty, 100 ground validation points (GVPs) were selected (Figure 2b), displacement was extracted by ImGRAFT, and the visual feature track was contrasted. Image pairs with a certain time interval contained information of glacial surface movement, the top of the ice serac was selected as the GVP, the coordinates of the same GVP on both of the image pairs were measured, and the displacement was calculated. The correlation between ImGRAFT and the visual feature track was relevant: R2 was 0.96 (Figure 2e), and the median was slightly positive (Figure 2d). The root mean squared error (RMSE) was used to describe the displacement extraction error, and the RMSE was ±1.69 m. Using the combined error of the GNSS-RTK measurement system, the glacier surface displacement extraction error (ErrorSV) could be calculated by Function (3):
E r r o r S V = E I m a g e 2 + E G N S S 2
EImage is the glacier surface displacement extraction error and is equal to the RMSE; EGNSS is the error of the GNSS-RTK measurement system and we determined that ErrorSV was ±1.69 m in this study.

3. Results

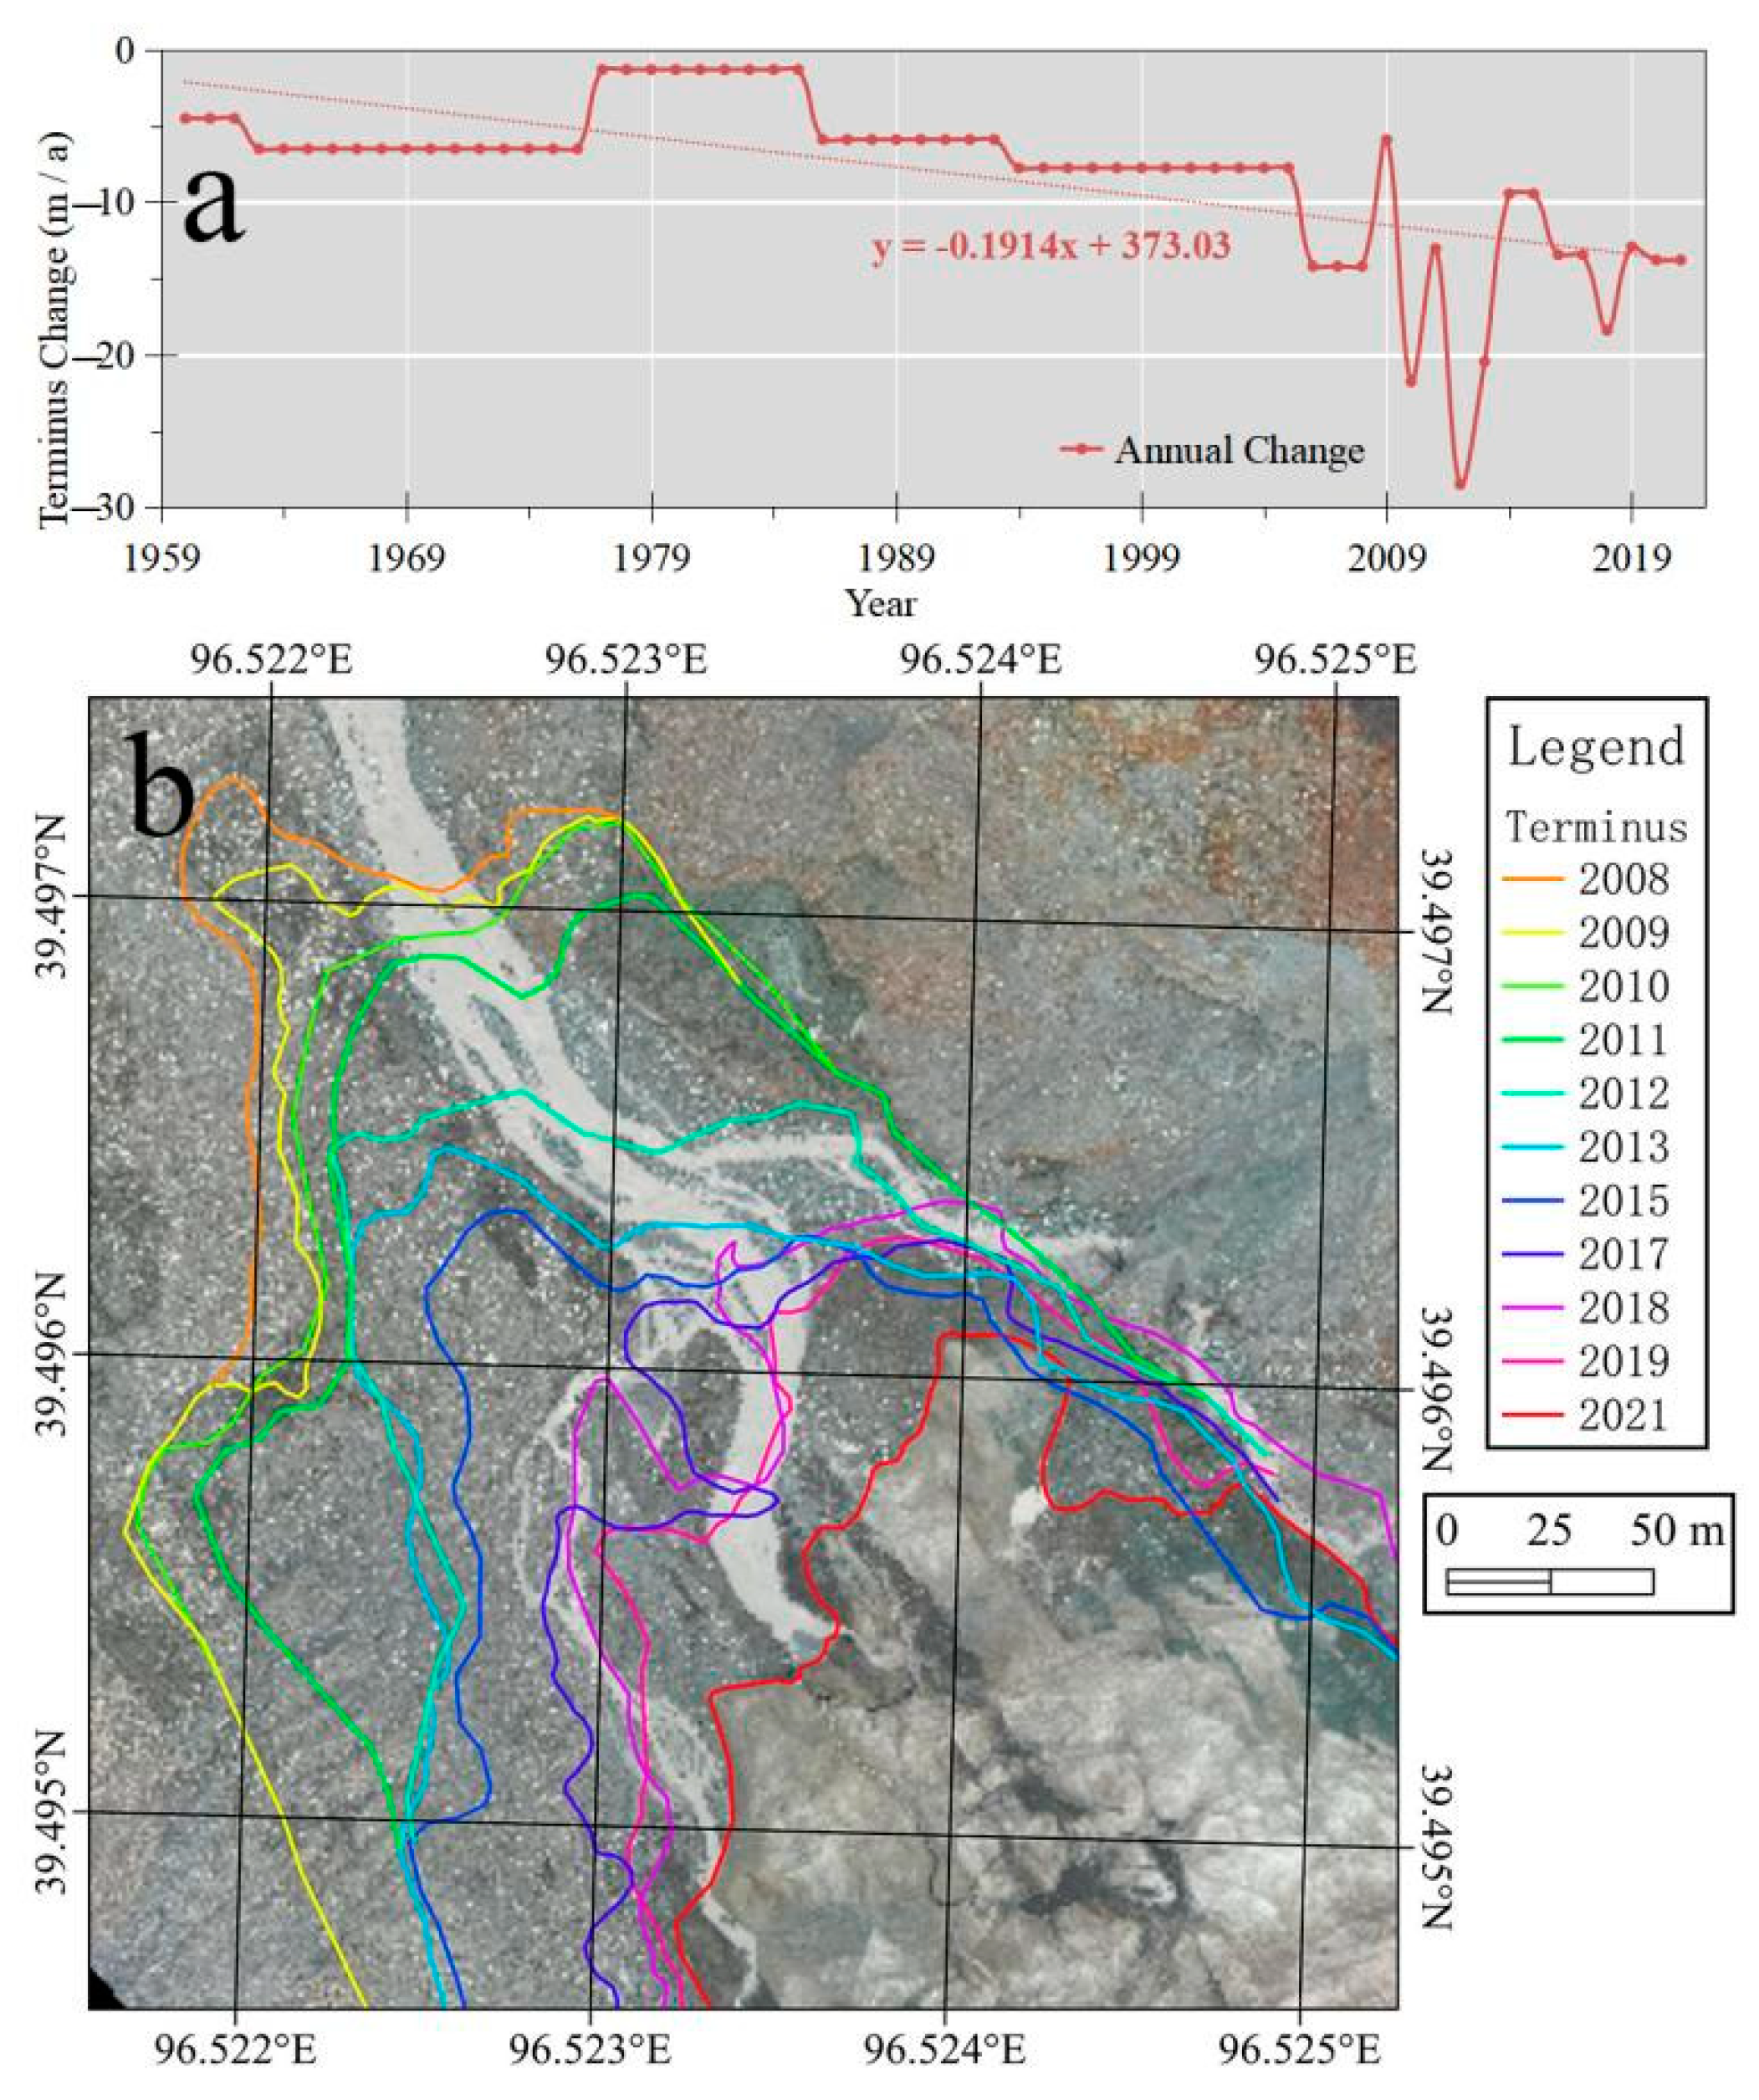
3.1. Changes in Terminus & Area

The terminus of LHG12 was briefly stable in the 1980s, and after that, it began to retreat significantly (Figure 3a) [37]. During 2008–2021, the terminus of LHG12 retreated by 194.35 m and 19.44 m a−1 on average. In some periods, such as 2009–2010, 2011–2012, 2012–2013, and 2017–2018, the glacier terminus of LHG12 retreated by more than 15 m. The morphology of the edge of the terminus changed considerably during those periods (Figure 4b). In 2015–2021, the terminus retreated by a total of 85.79 m, and in 2018–2021, the area of lower region reduced by 0.68% annually (Table 2). In ablation season, the ice surface was eroded by strong fluviation, a combination of surface moraine distribution and ice flow, which caused evident differential ablation at the mid–lower part of LHG12. At the terminus of LHG12, some regions with weak ablation remained for one to two years, turning the edge into an irregular shape similar to a “bulge”, and if this part of the ice ablated completely or separated from glacier within the next one or two years, it caused the terminus to retreat by a markedly increased distance. From 2008 to 2021, rapid terminus retreat appeared two times, in 2010 and 2015, respectively (Figure 3b), an interval of approximately five to six years. A drone image from 2021 showed that there was a new “bulge” caused by differential ablation, which might cause “rapid retreat” to occur again in the next one to two years.

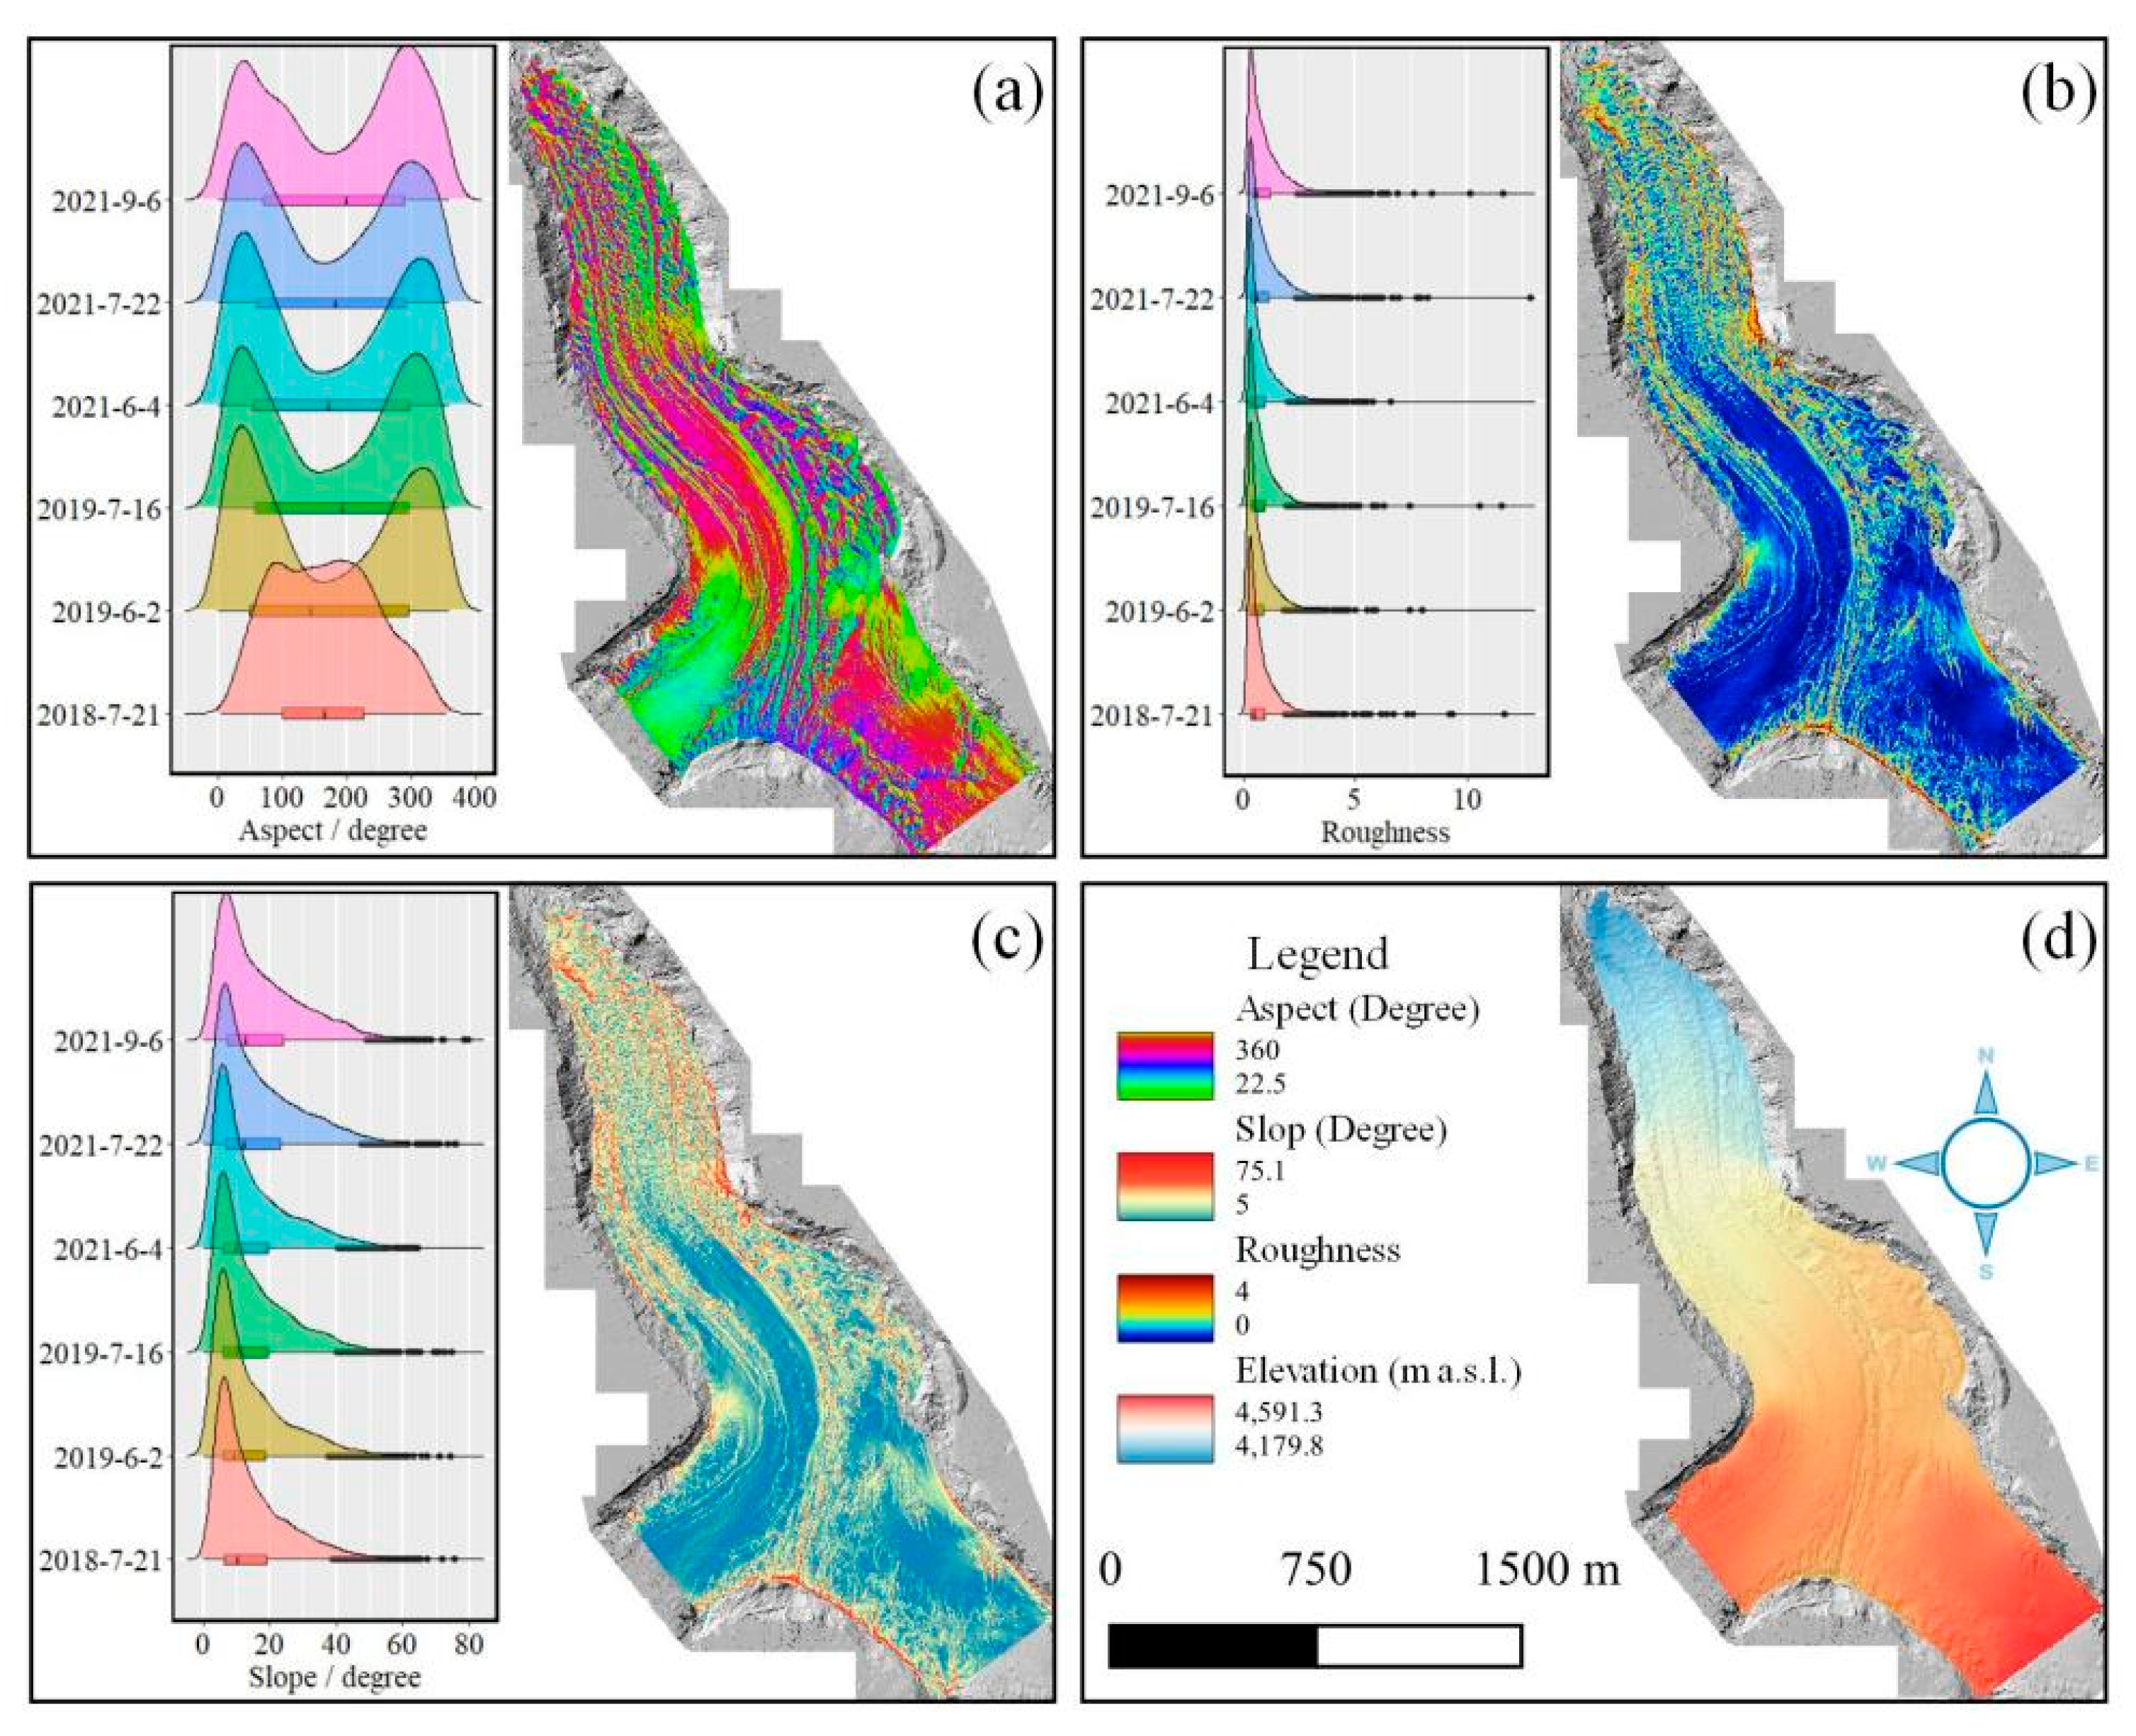
3.2. Surface Morphology

The main orientation of LHG12 was northwest, and due to differential ablation, the aspect had variation in the ice serac region (Figure 4a). The effective range of the glacial surface roughness was zero to four. In the monitoring area, the ice serac region was the roughest region, and mid–upper parts were smooth. The roughness of the east branch was higher than that of the west branch, especially near the shear line. The surface roughness of the monitoring area increased slightly in 2018–2021 (Figure 4b). The effective range of the slope was 0–45°. In 2018–2021, the average surface slope of LHG12 was 13.86–17.02°. The glacier’s slope increased significantly, and the rate of slope increase was higher in June–July than in July–September, due to strong ablation in the monitoring area (Figure 4c).

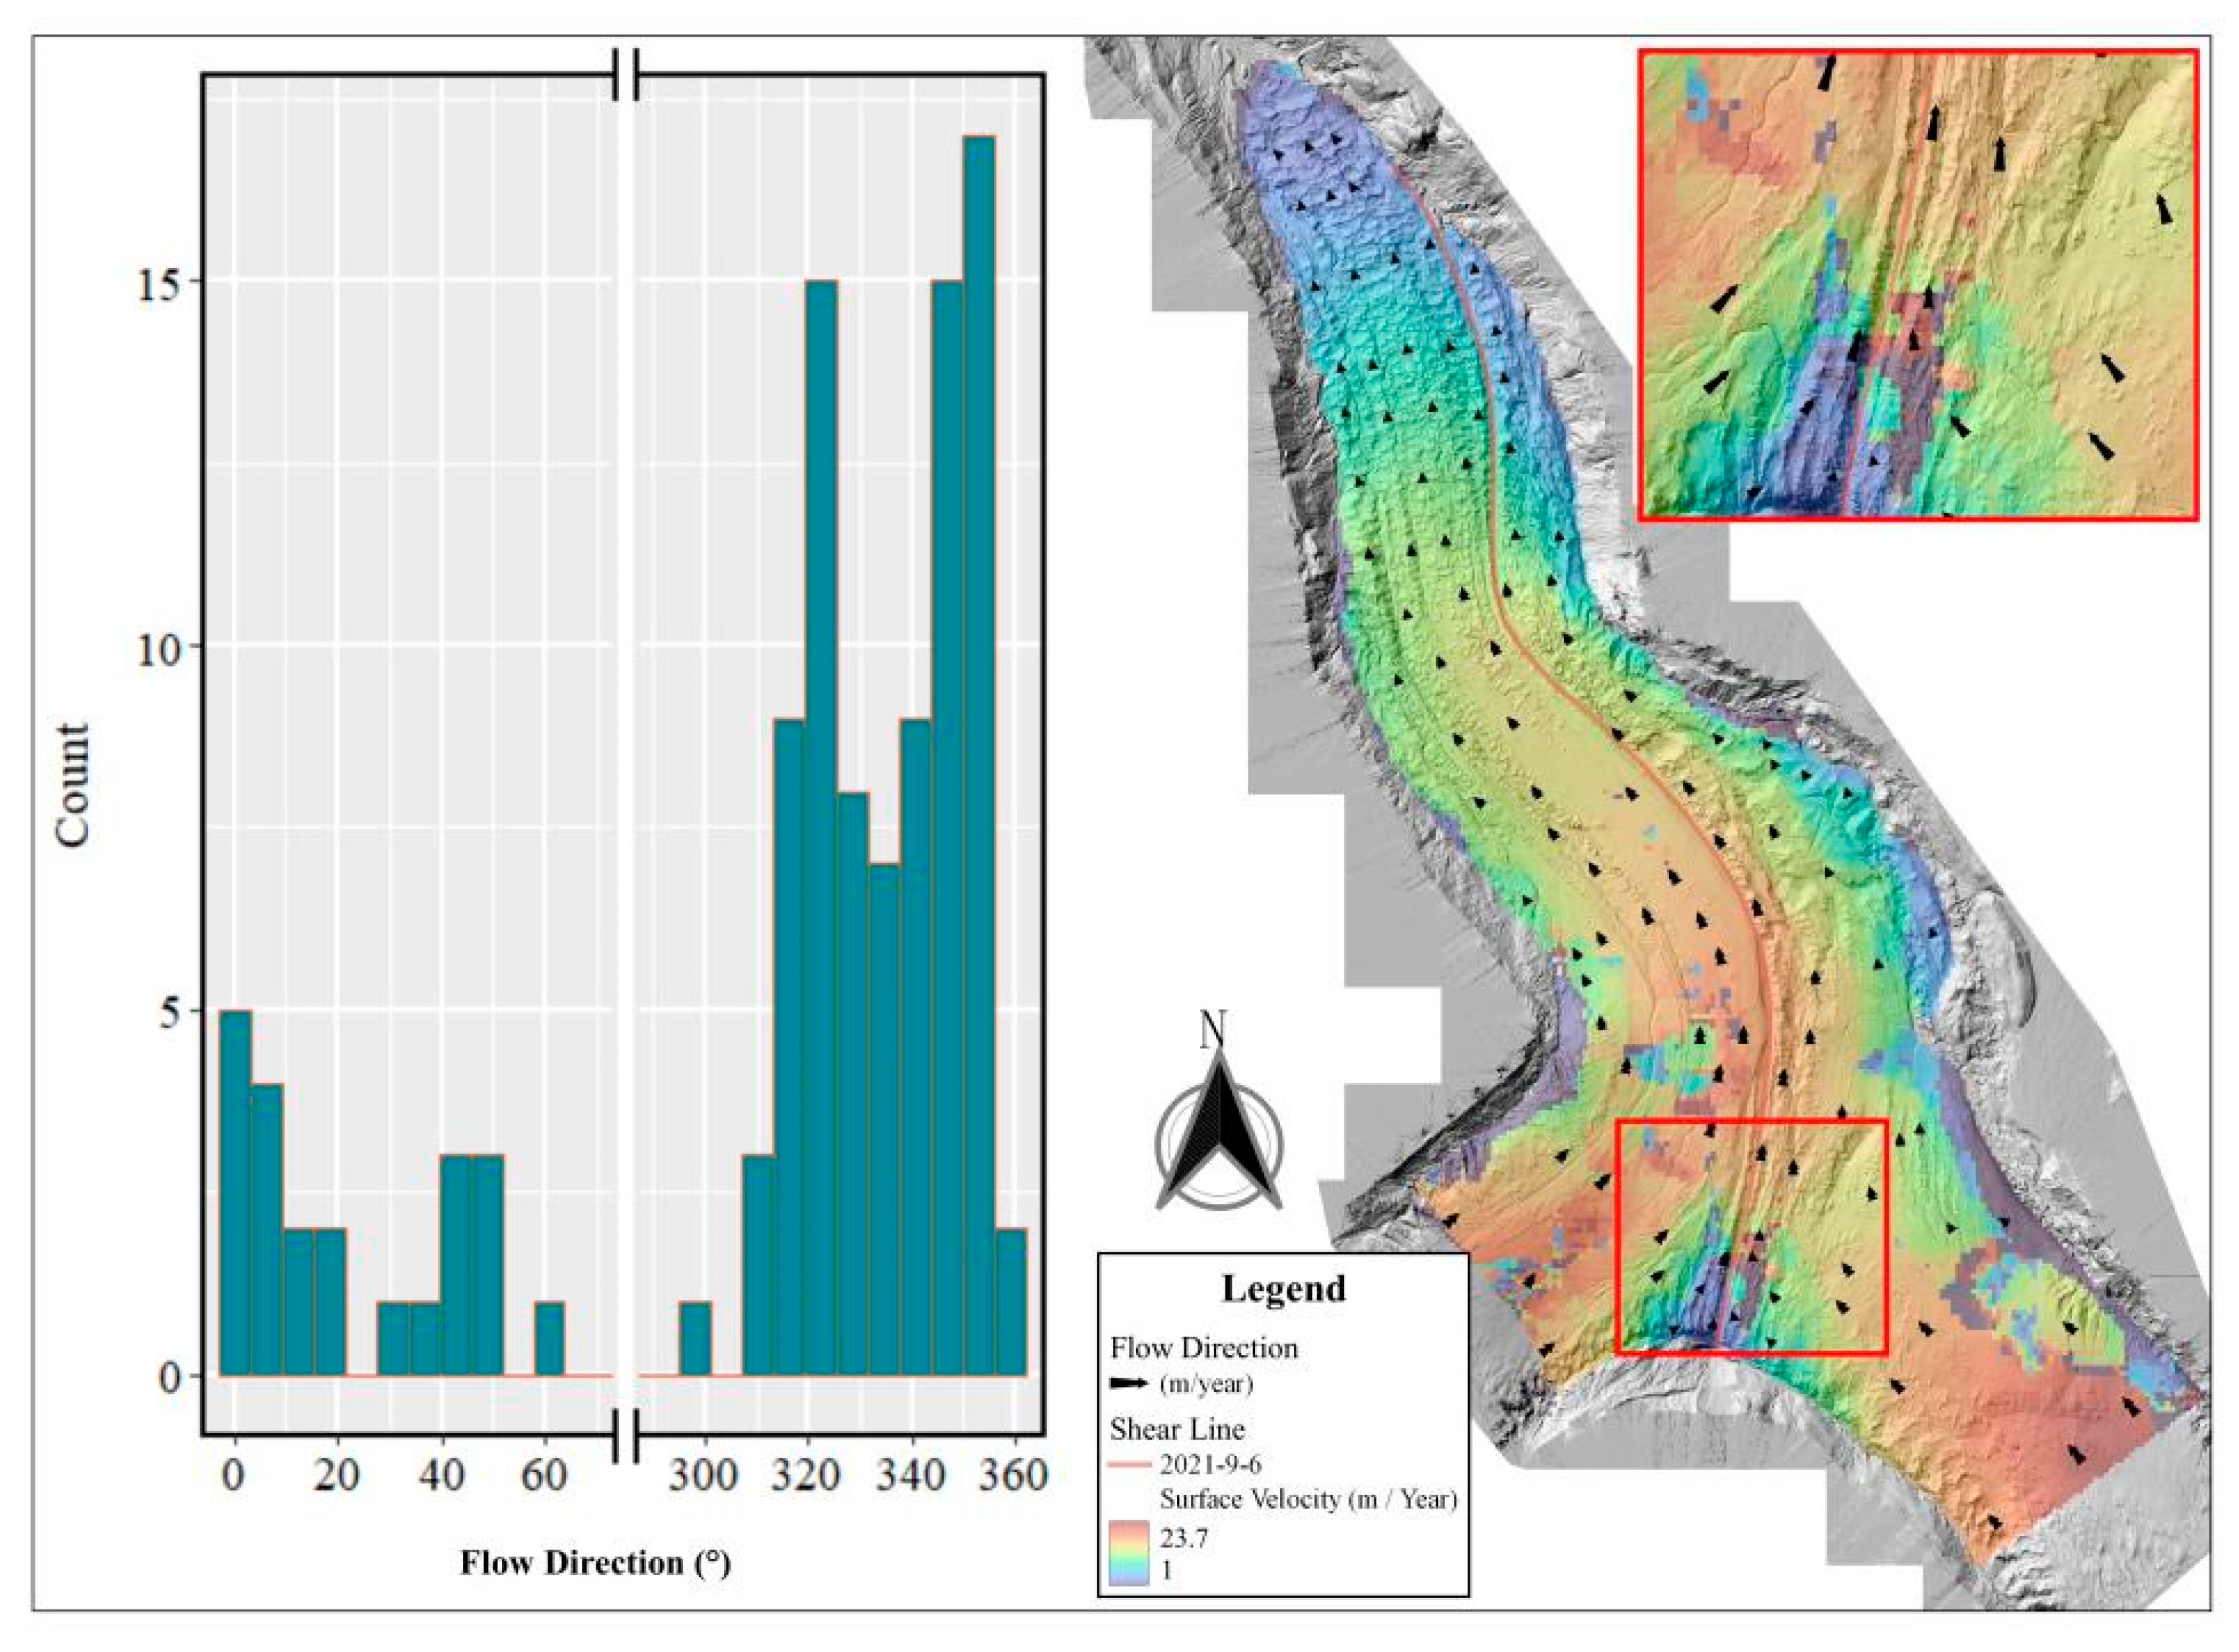
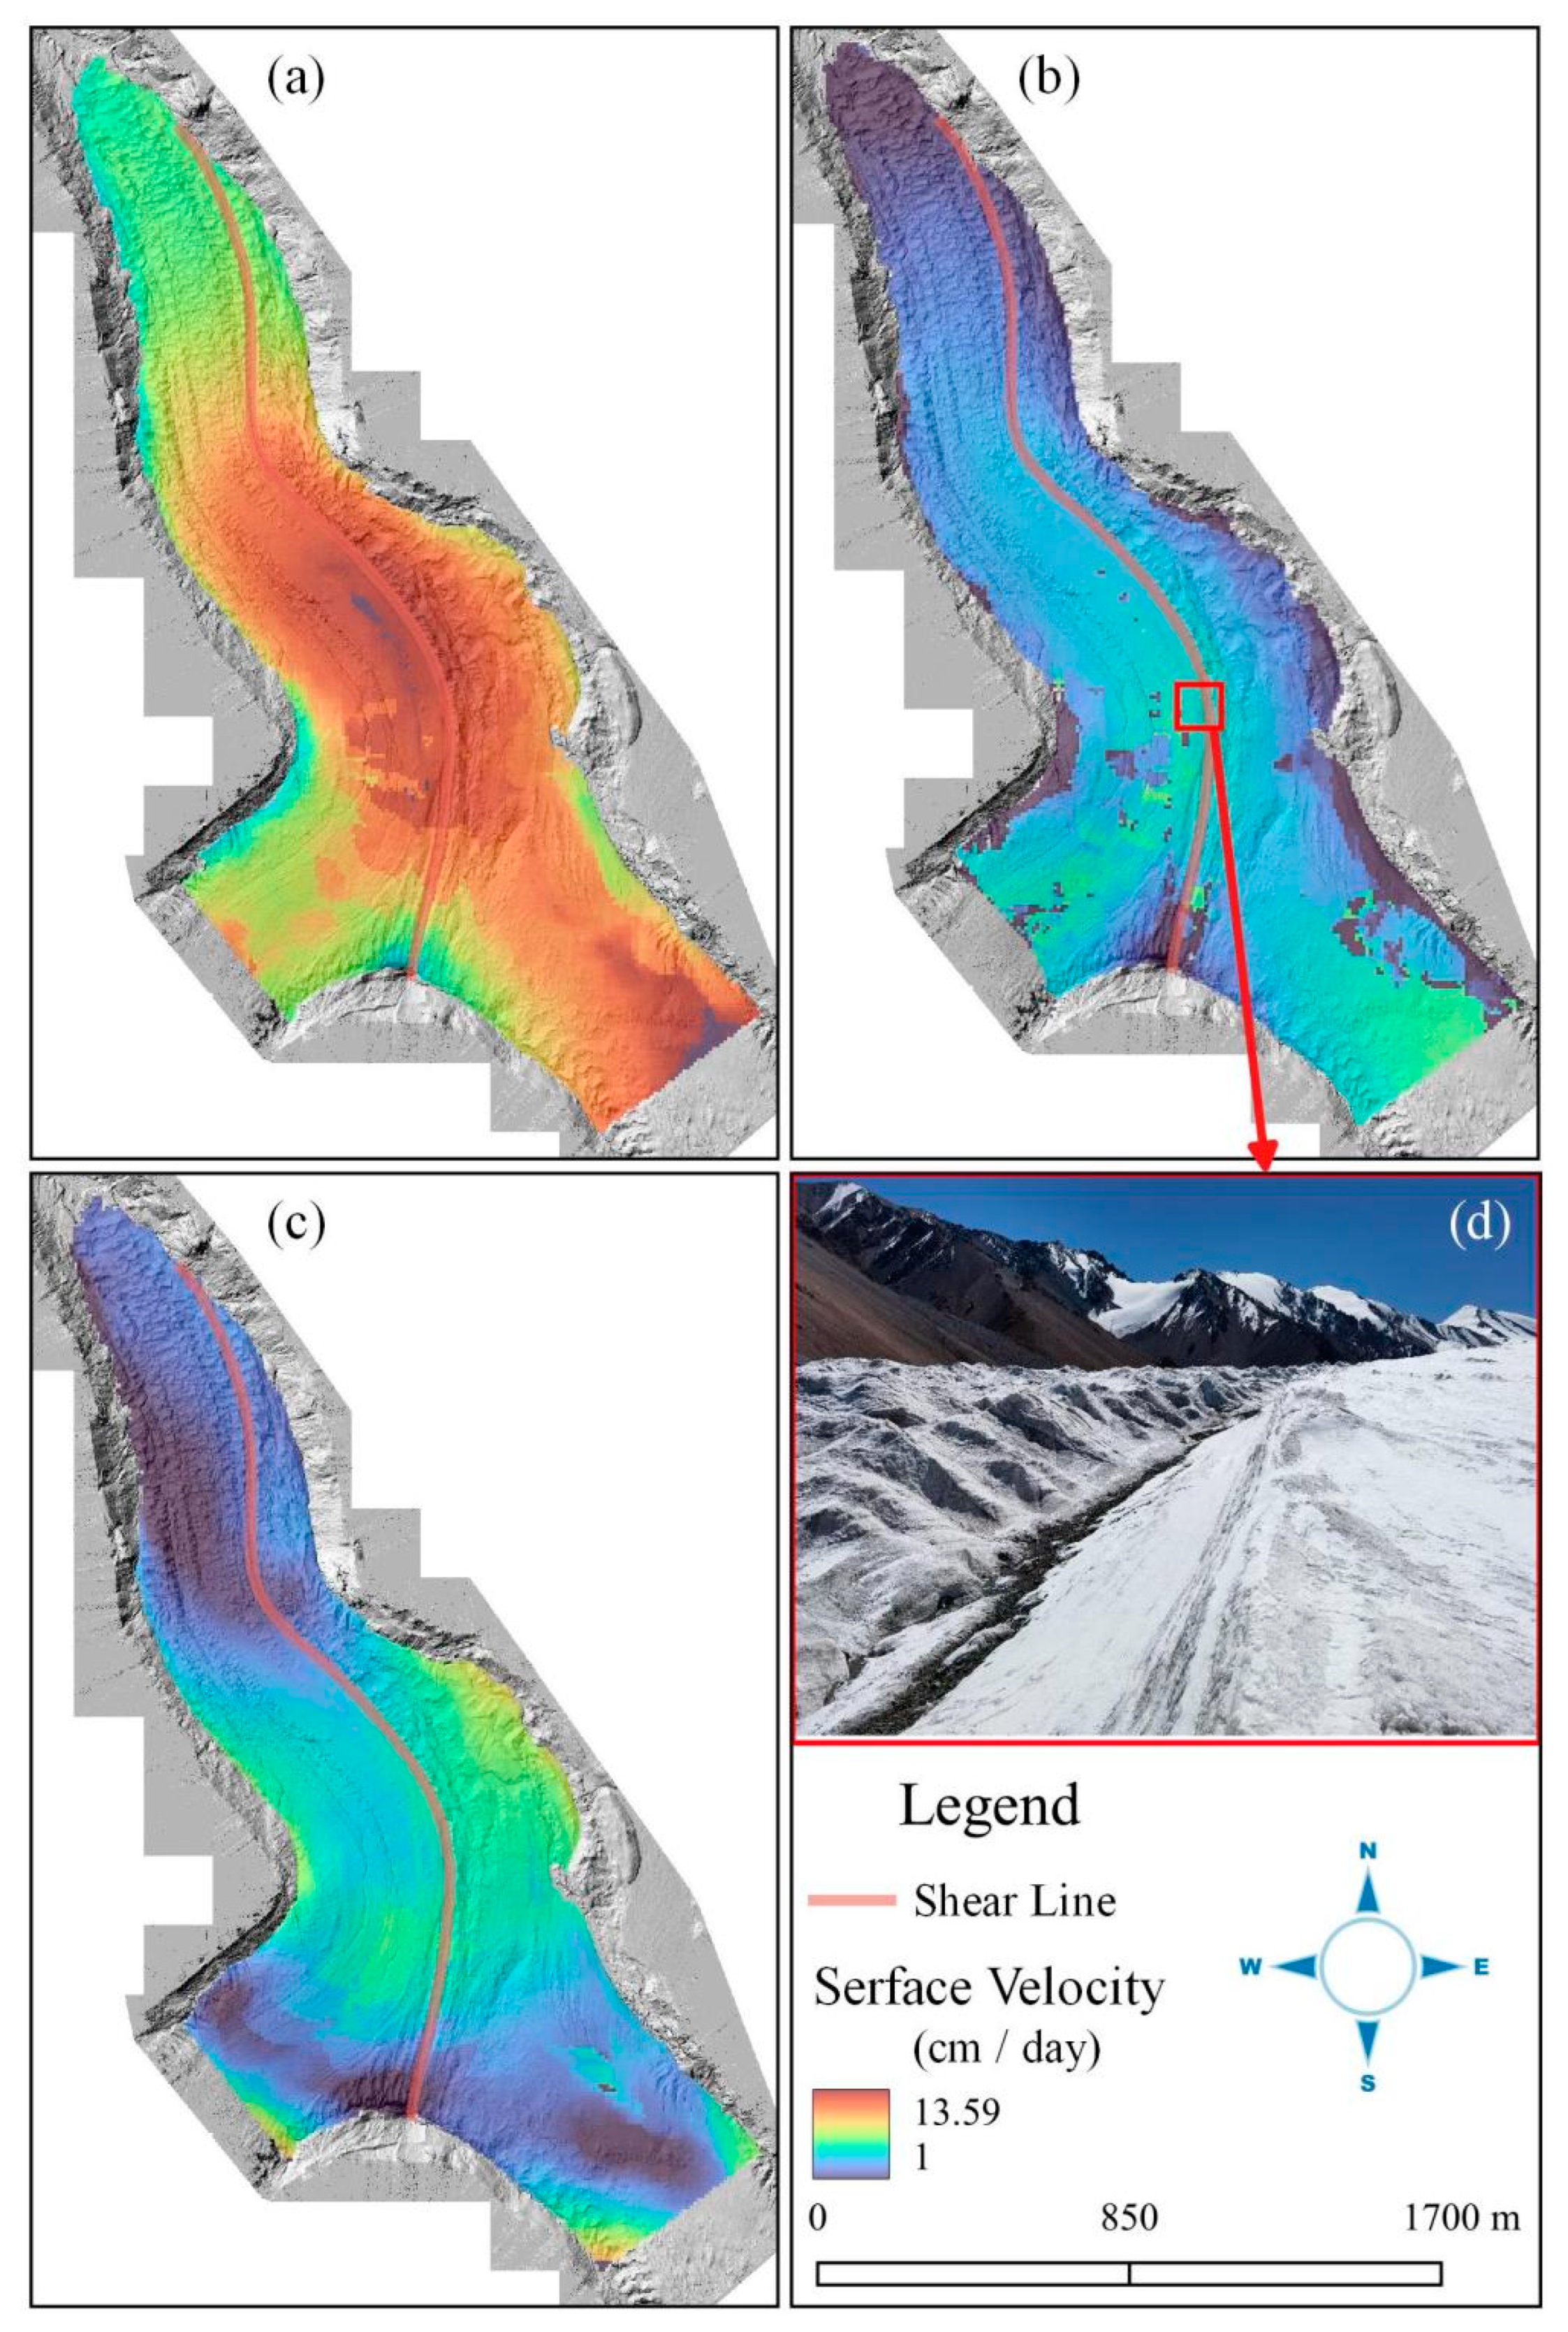
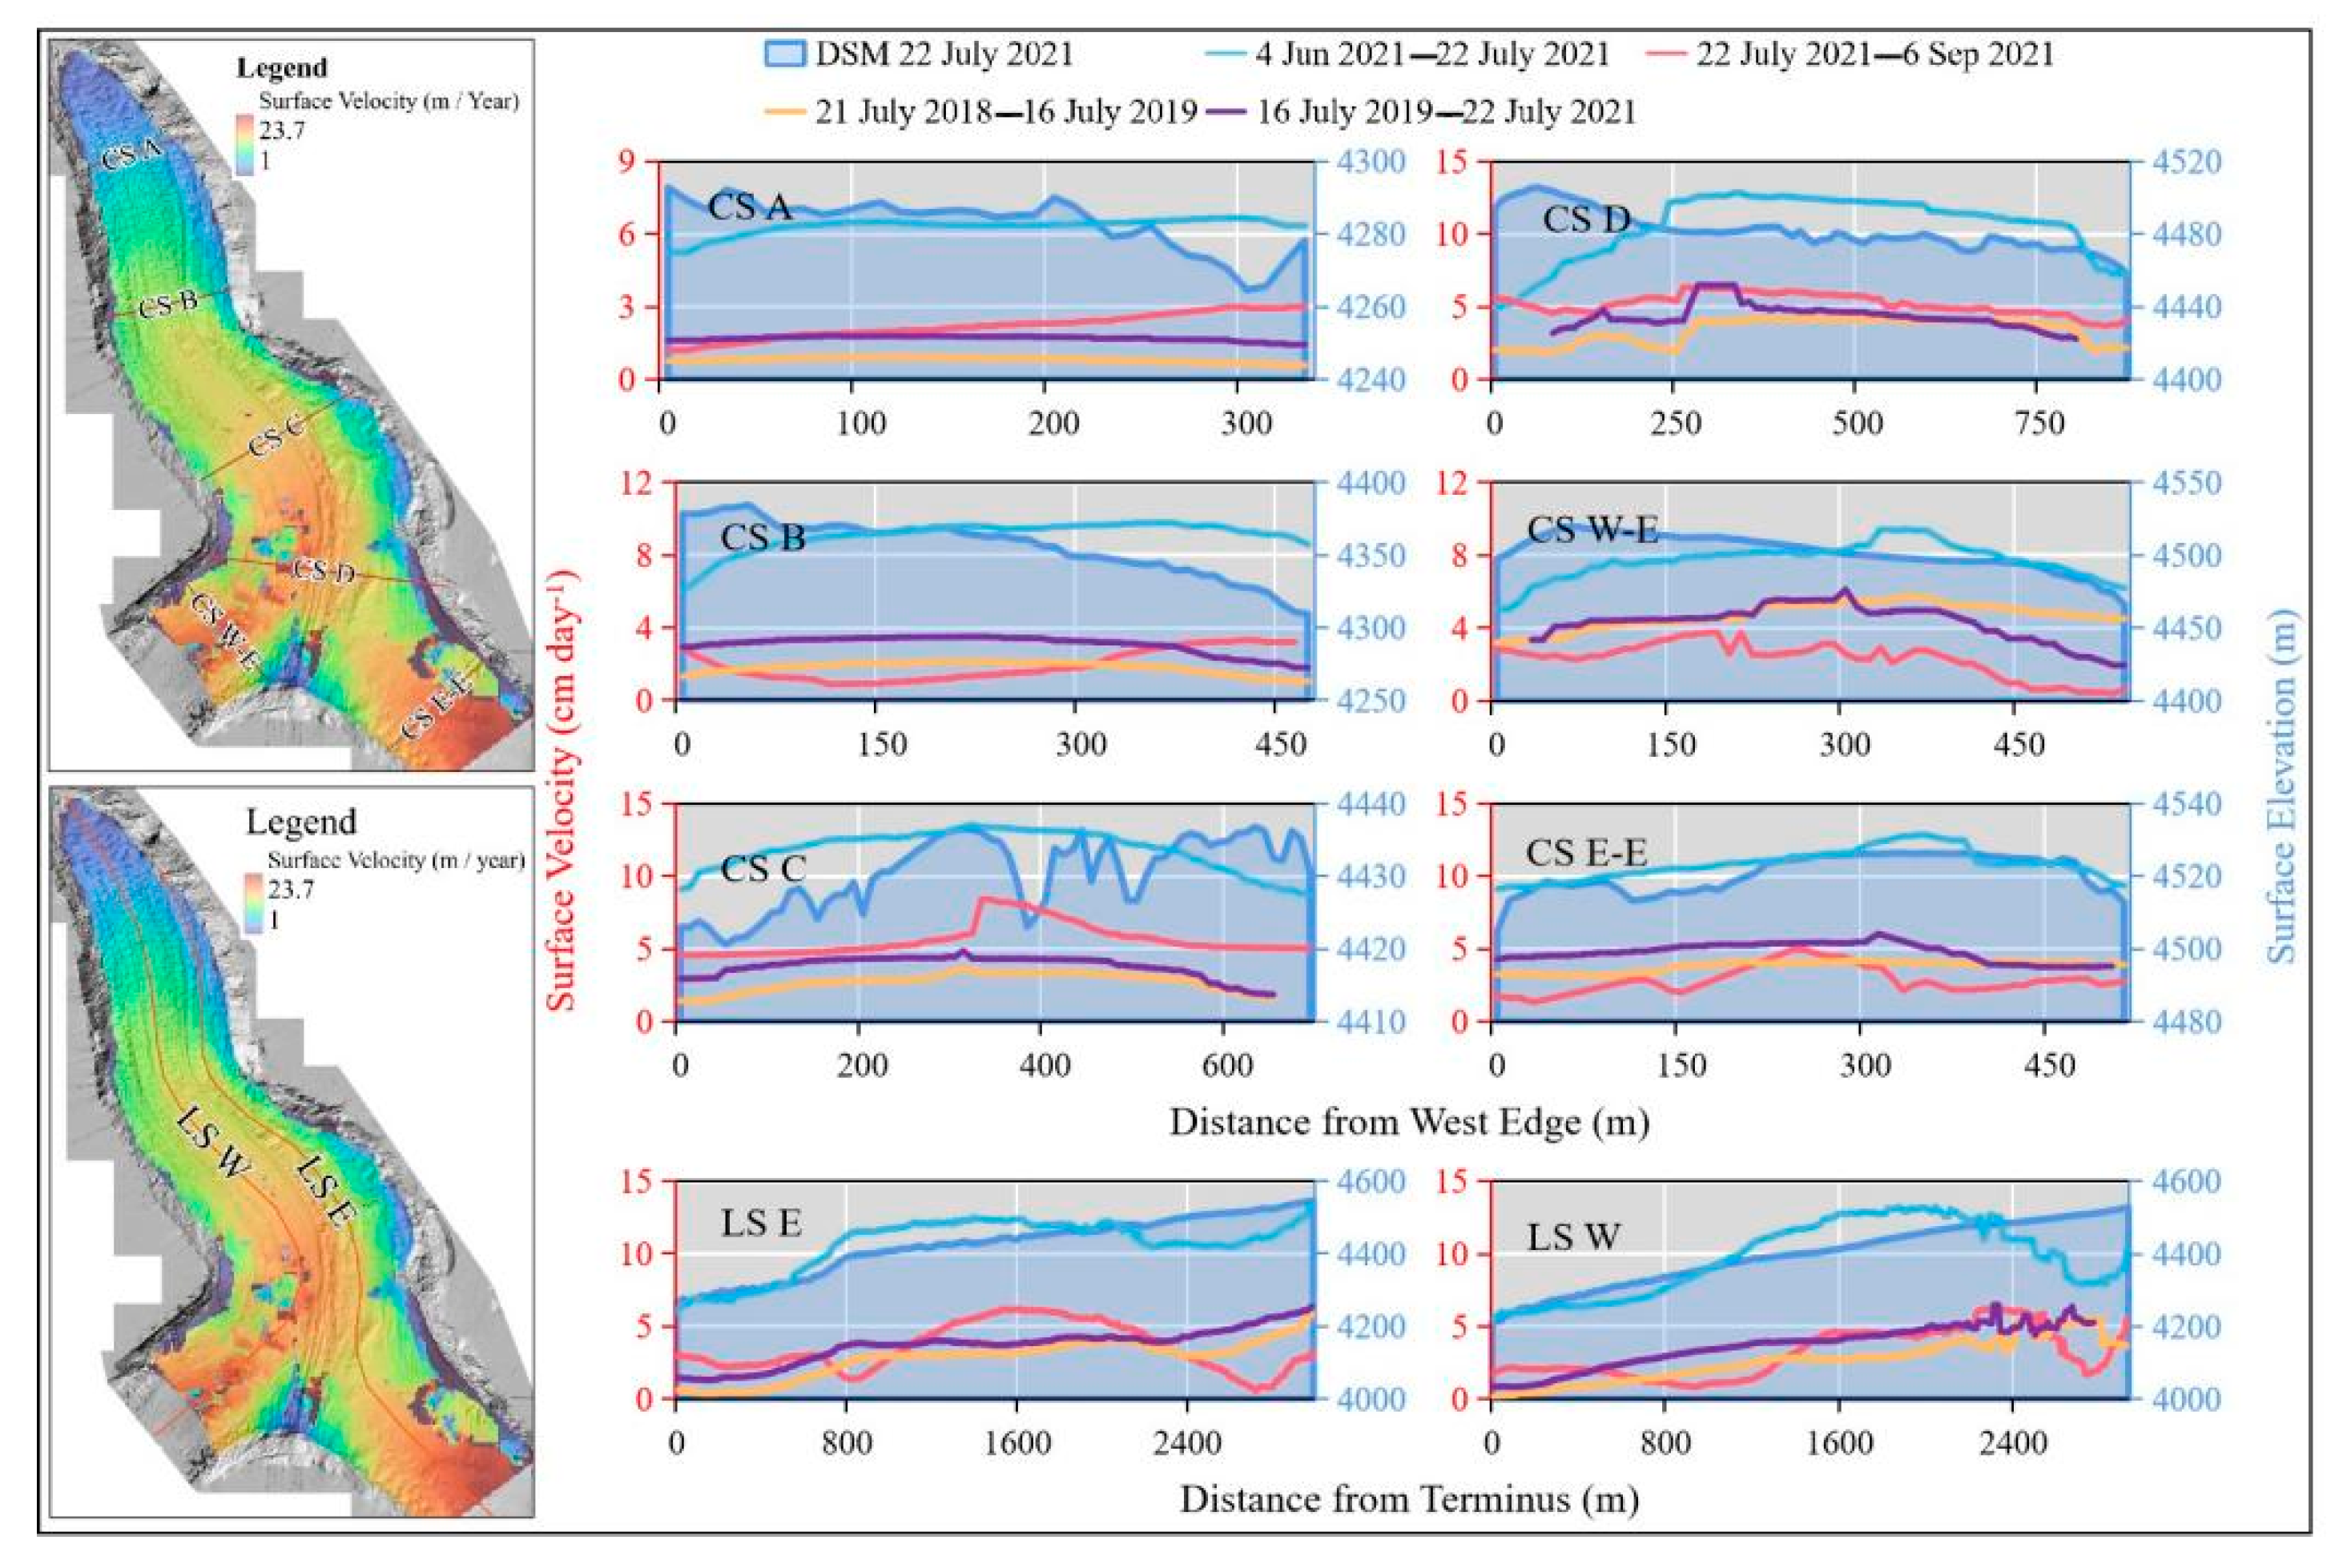
3.3. Surface Velocities

The main flow direction of LHG12 was towards the north. The confluence of the east and west ice flow had a huge influence on the ice flow direction. Above the confluence area, the azimuth of east ice flow was about 313°, the azimuth of west ice flow was about 50°, and the confluence of the two ice flows formed a shear line along the valley. Near the shear line, the flow direction of the west branch has turned 33.99 degrees to the northwest, and the flow direction of the east branch has turned 54.8 degrees to the north (Figure 5).
The glacier’s surface velocity was obviously influenced by extrusion of the two ice flows (Figure 6). From the surface velocity extracted by three drone-based measurements in 2021, it can be seen that: the maximum annual surface velocity was 6.50 cm day−1 (Figure 6b); the surface velocity accelerated during the ablation season, and the maximum was 13.59 cm day−1 (Figure 6a); the surface velocity in the summer was doubled compared to the annual, and decelerated at the end of ablation season, with a maximum surface velocity of 9.60 cm day−1. The surface velocity that was higher in the confluence area than in other areas (Figure 6c). The lower portions of the east and west branches and the middle of the confluence region were the areas with faster movement. On both sides of the shearing line, the surface velocity was different.
At the glacier surface, six cross sections (CS) perpendicular to the main flow direction and two longitude sections (LS) along the main flow directions of the east and west branches were selected, and the surface velocities of each period and altitude on 6 September 2021 were extracted according to those parameters (Figure 7). Because of factors, such as topography, there were different characteristics of surface velocity included in those parameters, but a higher surface velocity than the annual average during ablation season was a common feature of all of them. At CS A, near the terminus, the ice was thin, the surface velocity was slow, and no obvious differences were observed; at CS B, the surface velocity was slow at the edges of LHG12 and faster along the west side; at CS C, located below the confluence region, the ice flow direction changed according to the terrain. The surface velocity was higher in the middle of CS C and lower along both sides of CS C. At the east side of the glacier, the ice was squeezed by mountain, the elevation of the ice surface was increased, and the surface velocity was significantly lower; at CS D, located in the mid–upper confluence region, the west branch was squeezed by the mountain, the flow direction changed, the elevation of the western ice surface was increased, and the surface velocity was lower in the west and higher in middle and east in the summer; at CS W-E, located in the lower part of the west branch, the western elevation of the ice surface was higher than the eastern branch, but the trend in the surface velocity was the opposite; at CS E-E, located in the lower east branch, the eastern elevation of the ice surface was higher than the western elevation, and the surface velocity had the same trend. The elevation trend was gentle at LS W but rolling at LS E, and the annual surface velocities at LS W and LS E increased with altitude and fluctuated in the summer. The trends in the seasonal surface velocity and air temperature of LHG12 were more consistent (Figure 8). Movement accelerated significantly during the ablation season: it was higher than the annual speed but slowed down during the accumulation season. Because of the huge difficulty of making basal sliding observations, we could not analyze the relationship between melt water and basal sliding for LHG12 directly.
The surface velocity was observed to slow down compared to the annual rate via GNSS measurements. Due to cost and the limitations of observational means, the GNSS measurement points were mostly distributed along the eastern branch of LHG12. The maximum surface velocities of the east branch at 4750–4800 m a.s.l. were 36 m a−1, 32.4 m a−1, 26.4 m a−1, and 26.6 m a−1, in 2008–2009, 1960–1961, 2010–2011, and 2011–2013, respectively; the west branch observation points on the upper part of confluence region were located at about 4650 m a.s.l. The annual surface velocities were closer to or greater than those of the east branch; 35.6 m a−1, 32.6 m a−1, 34.7 m a−1, and 39.0 m a−1, in 1960–1961, 2008–2009, 2010–2011, and 2011–2013, respectively (Figure 9). The surface velocity of the east branch decreased, but it did not slow down as obviously in the west branch [50].

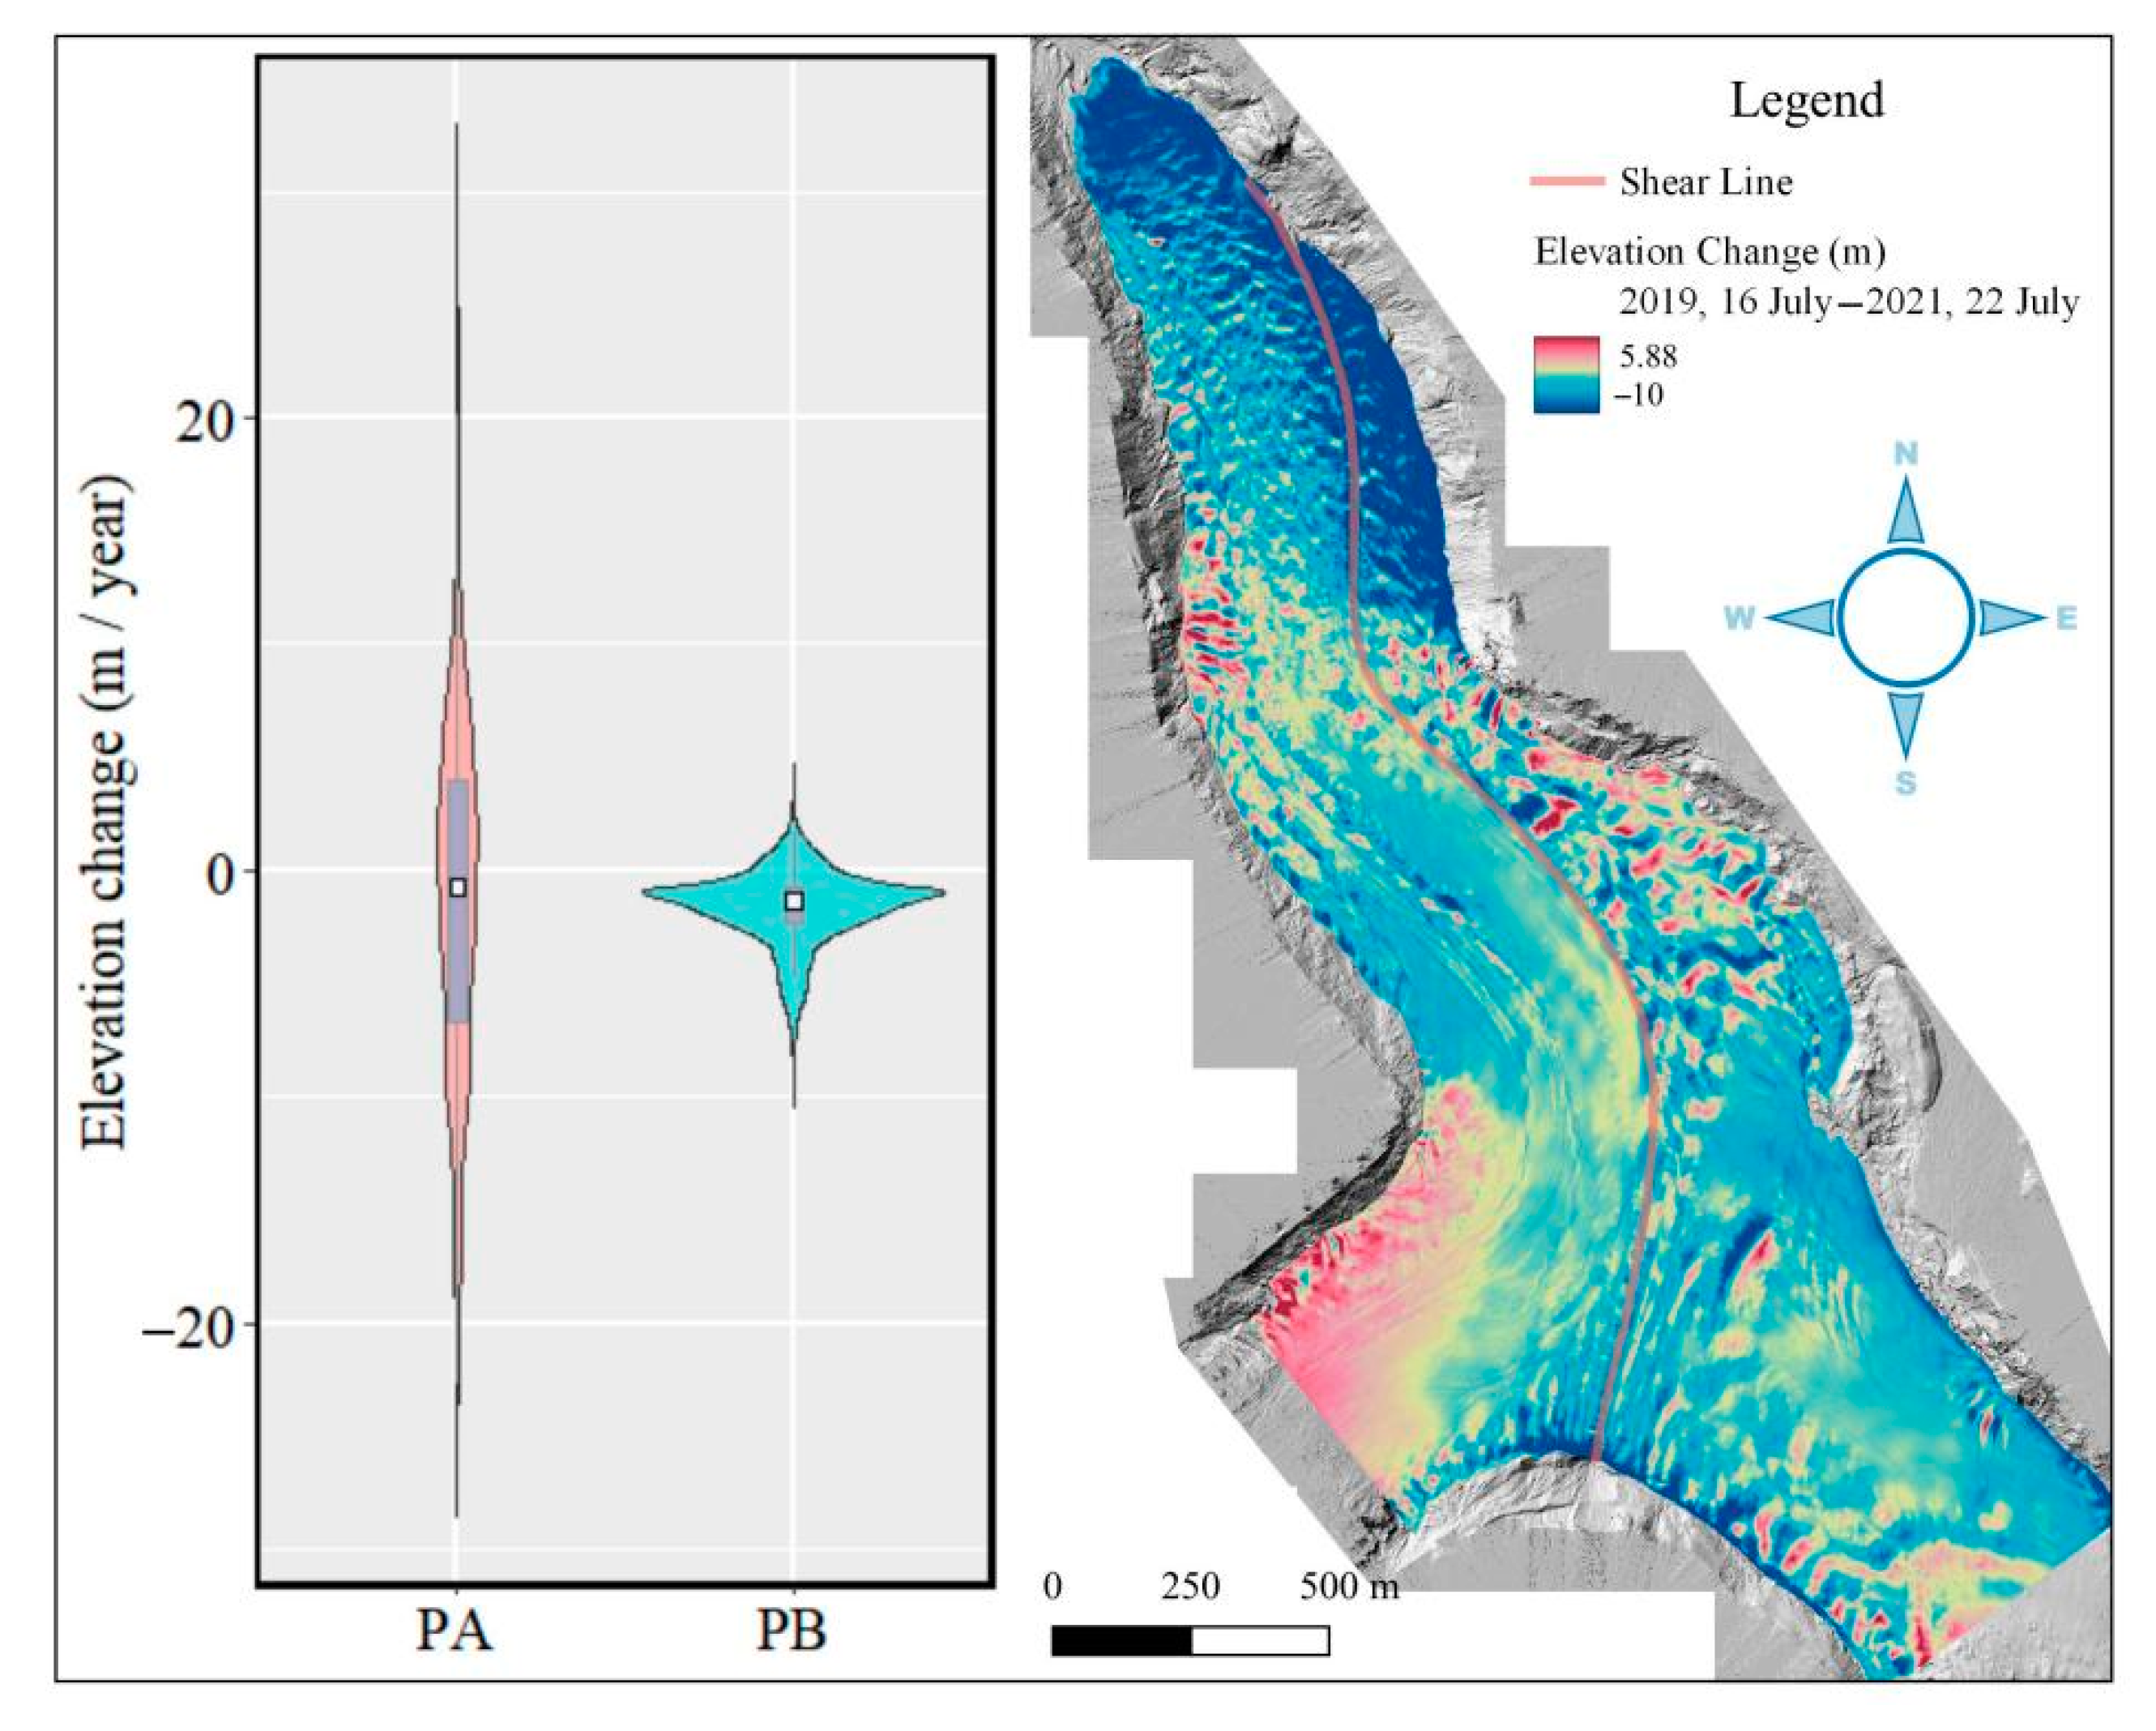
3.4. Changes of Surface Elevation

In 2018–2019, ice surface elevation of the survey area decreased by an average of 1.22 m. In 2019–2021, it by an average decreased 3.28 m, decreasing by about 1.65 m per year (Figure 10). The characteristics of surface elevation difference results were quite different between east and west branches. In the monitoring area, the area of western branch was larger than that of the eastern branch. The regions in which the elevation increased were located on the upper part of the confluence area of the western branch and the lower part of the confluence area of eastern branch. In these areas, the morphology of the eastern branch was more complex. After the east and west branches merged with each other, the eastern branch narrowed rapidly, especially in the lower part of confluence area, and the surface elevation of eastern branch increased significantly under the force of the bedrock [40]. The cross profile of the glacier is narrowed by the bedrock. The ice flow needs to get over the bedrock; meanwhile, the ice that comes from upstream has not ablated completely, which led to decelerate the surface velocity and increase the surface elevation.

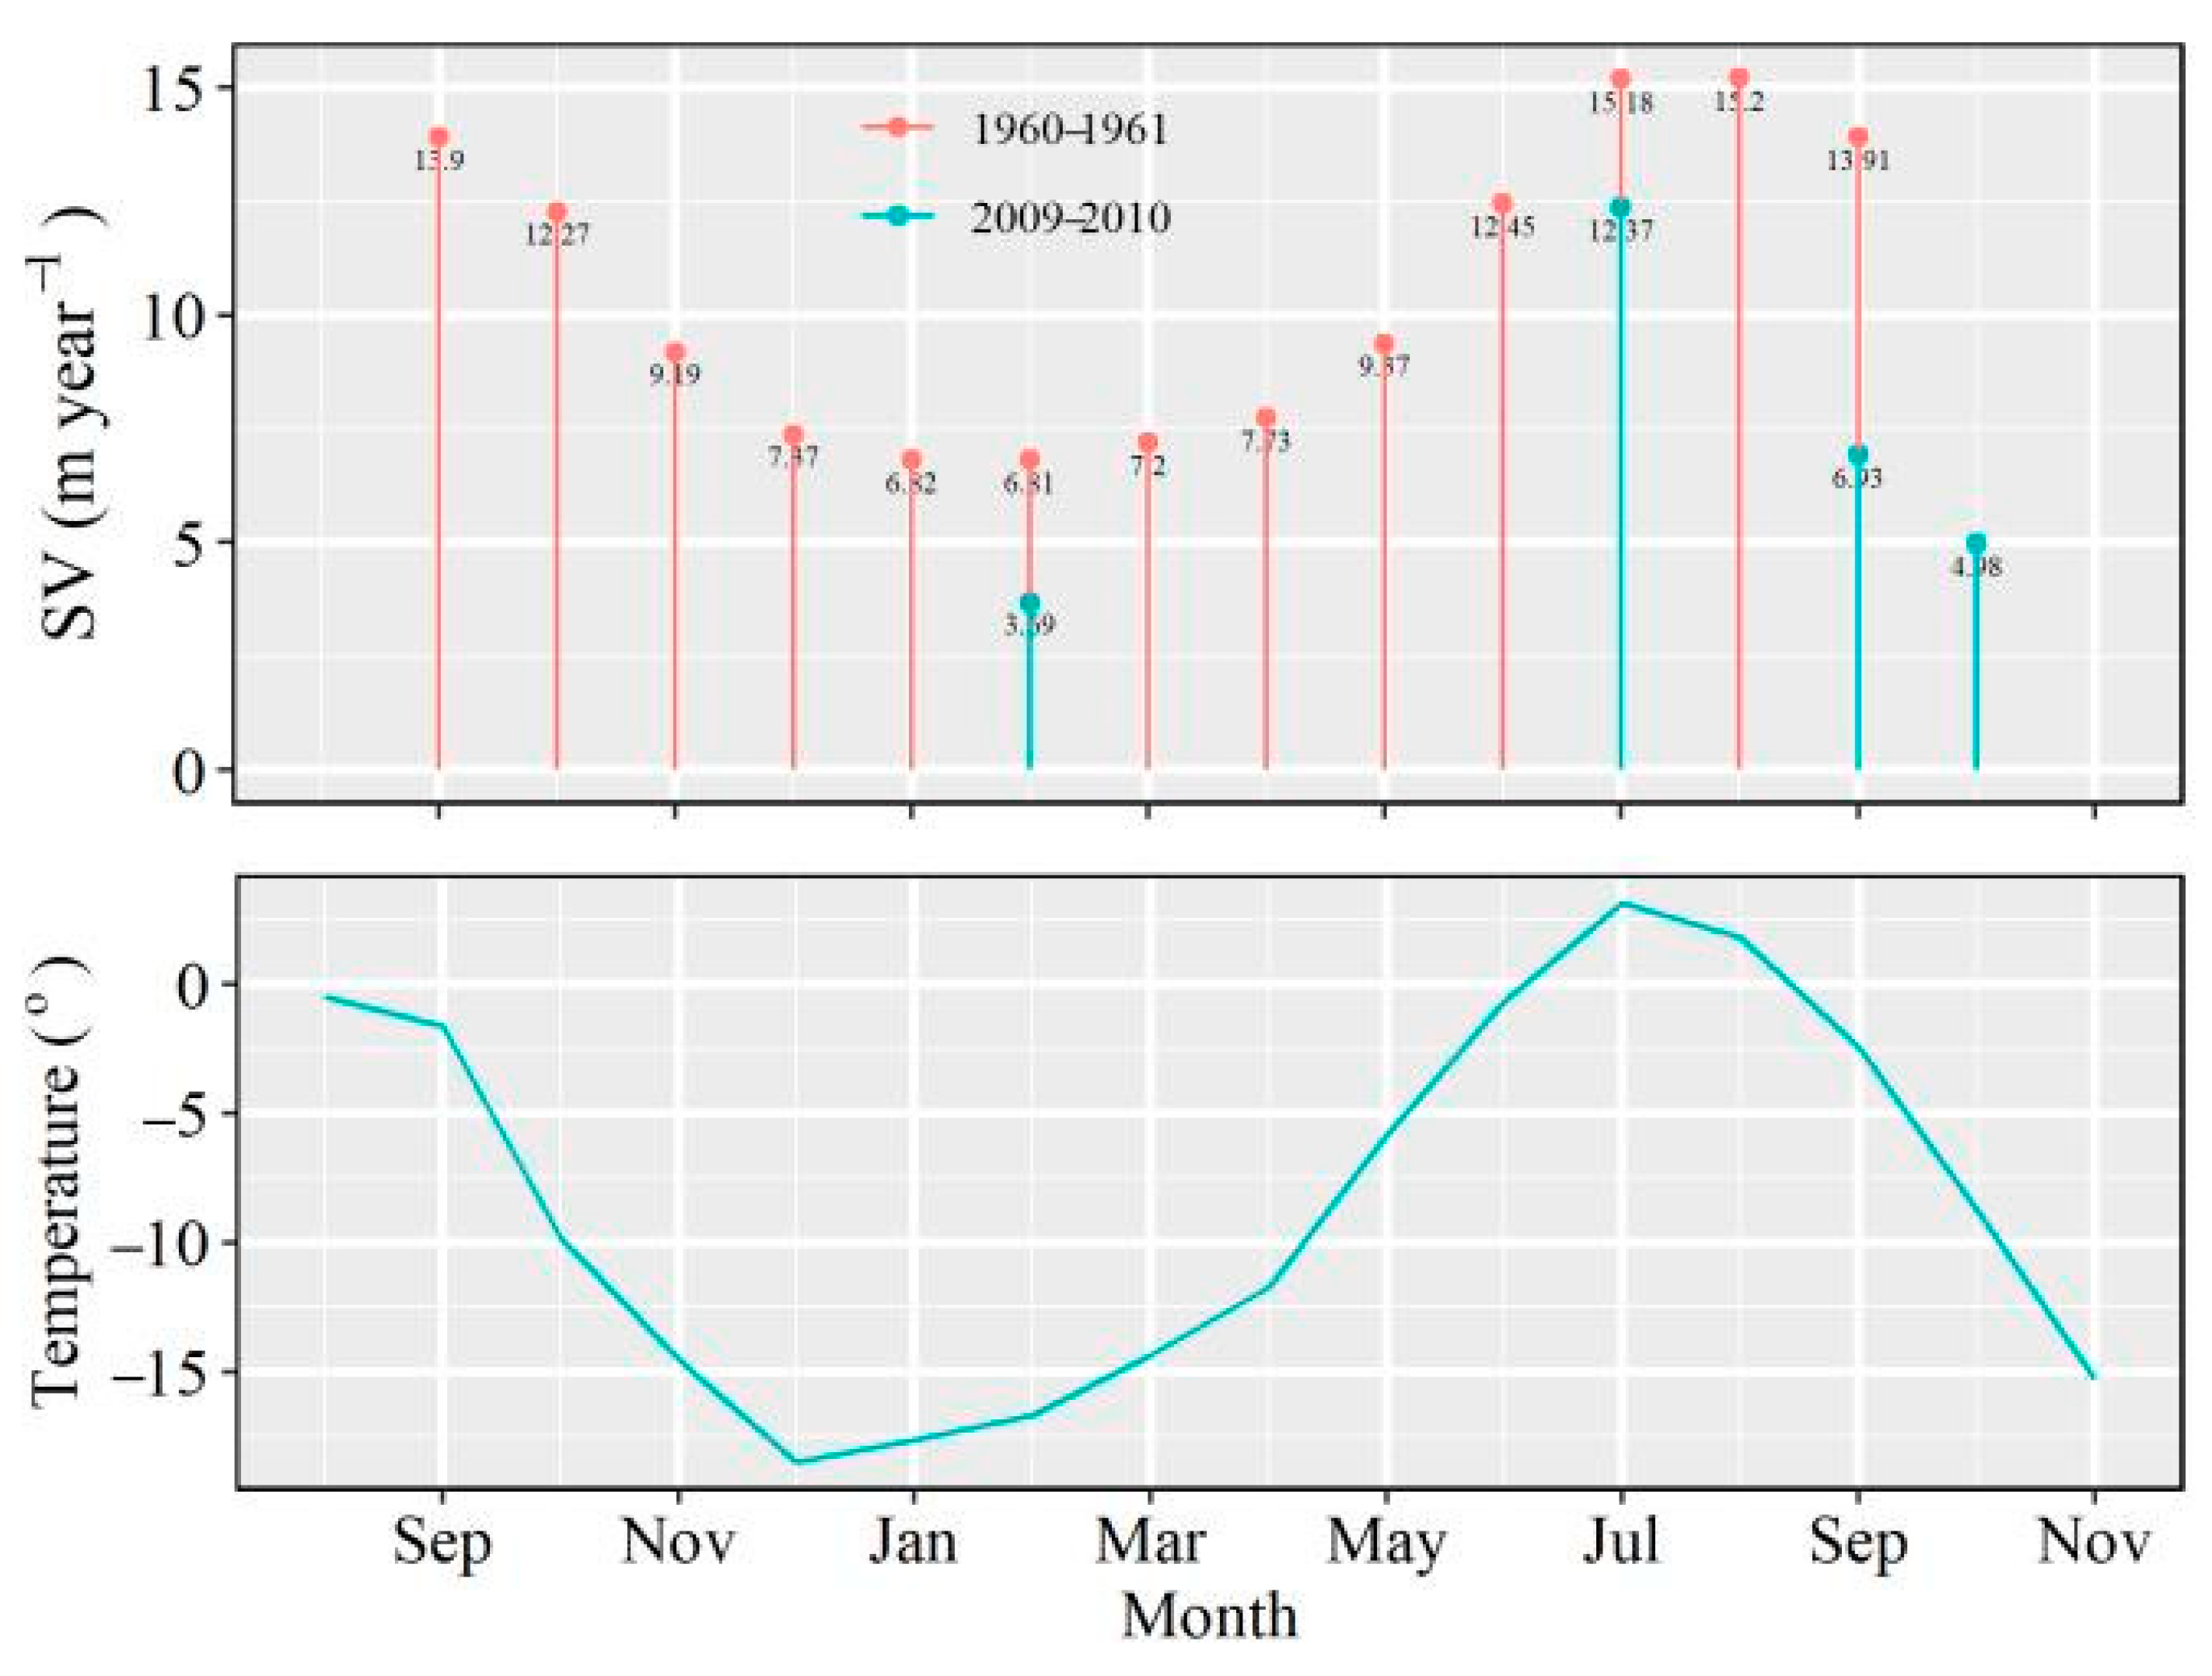
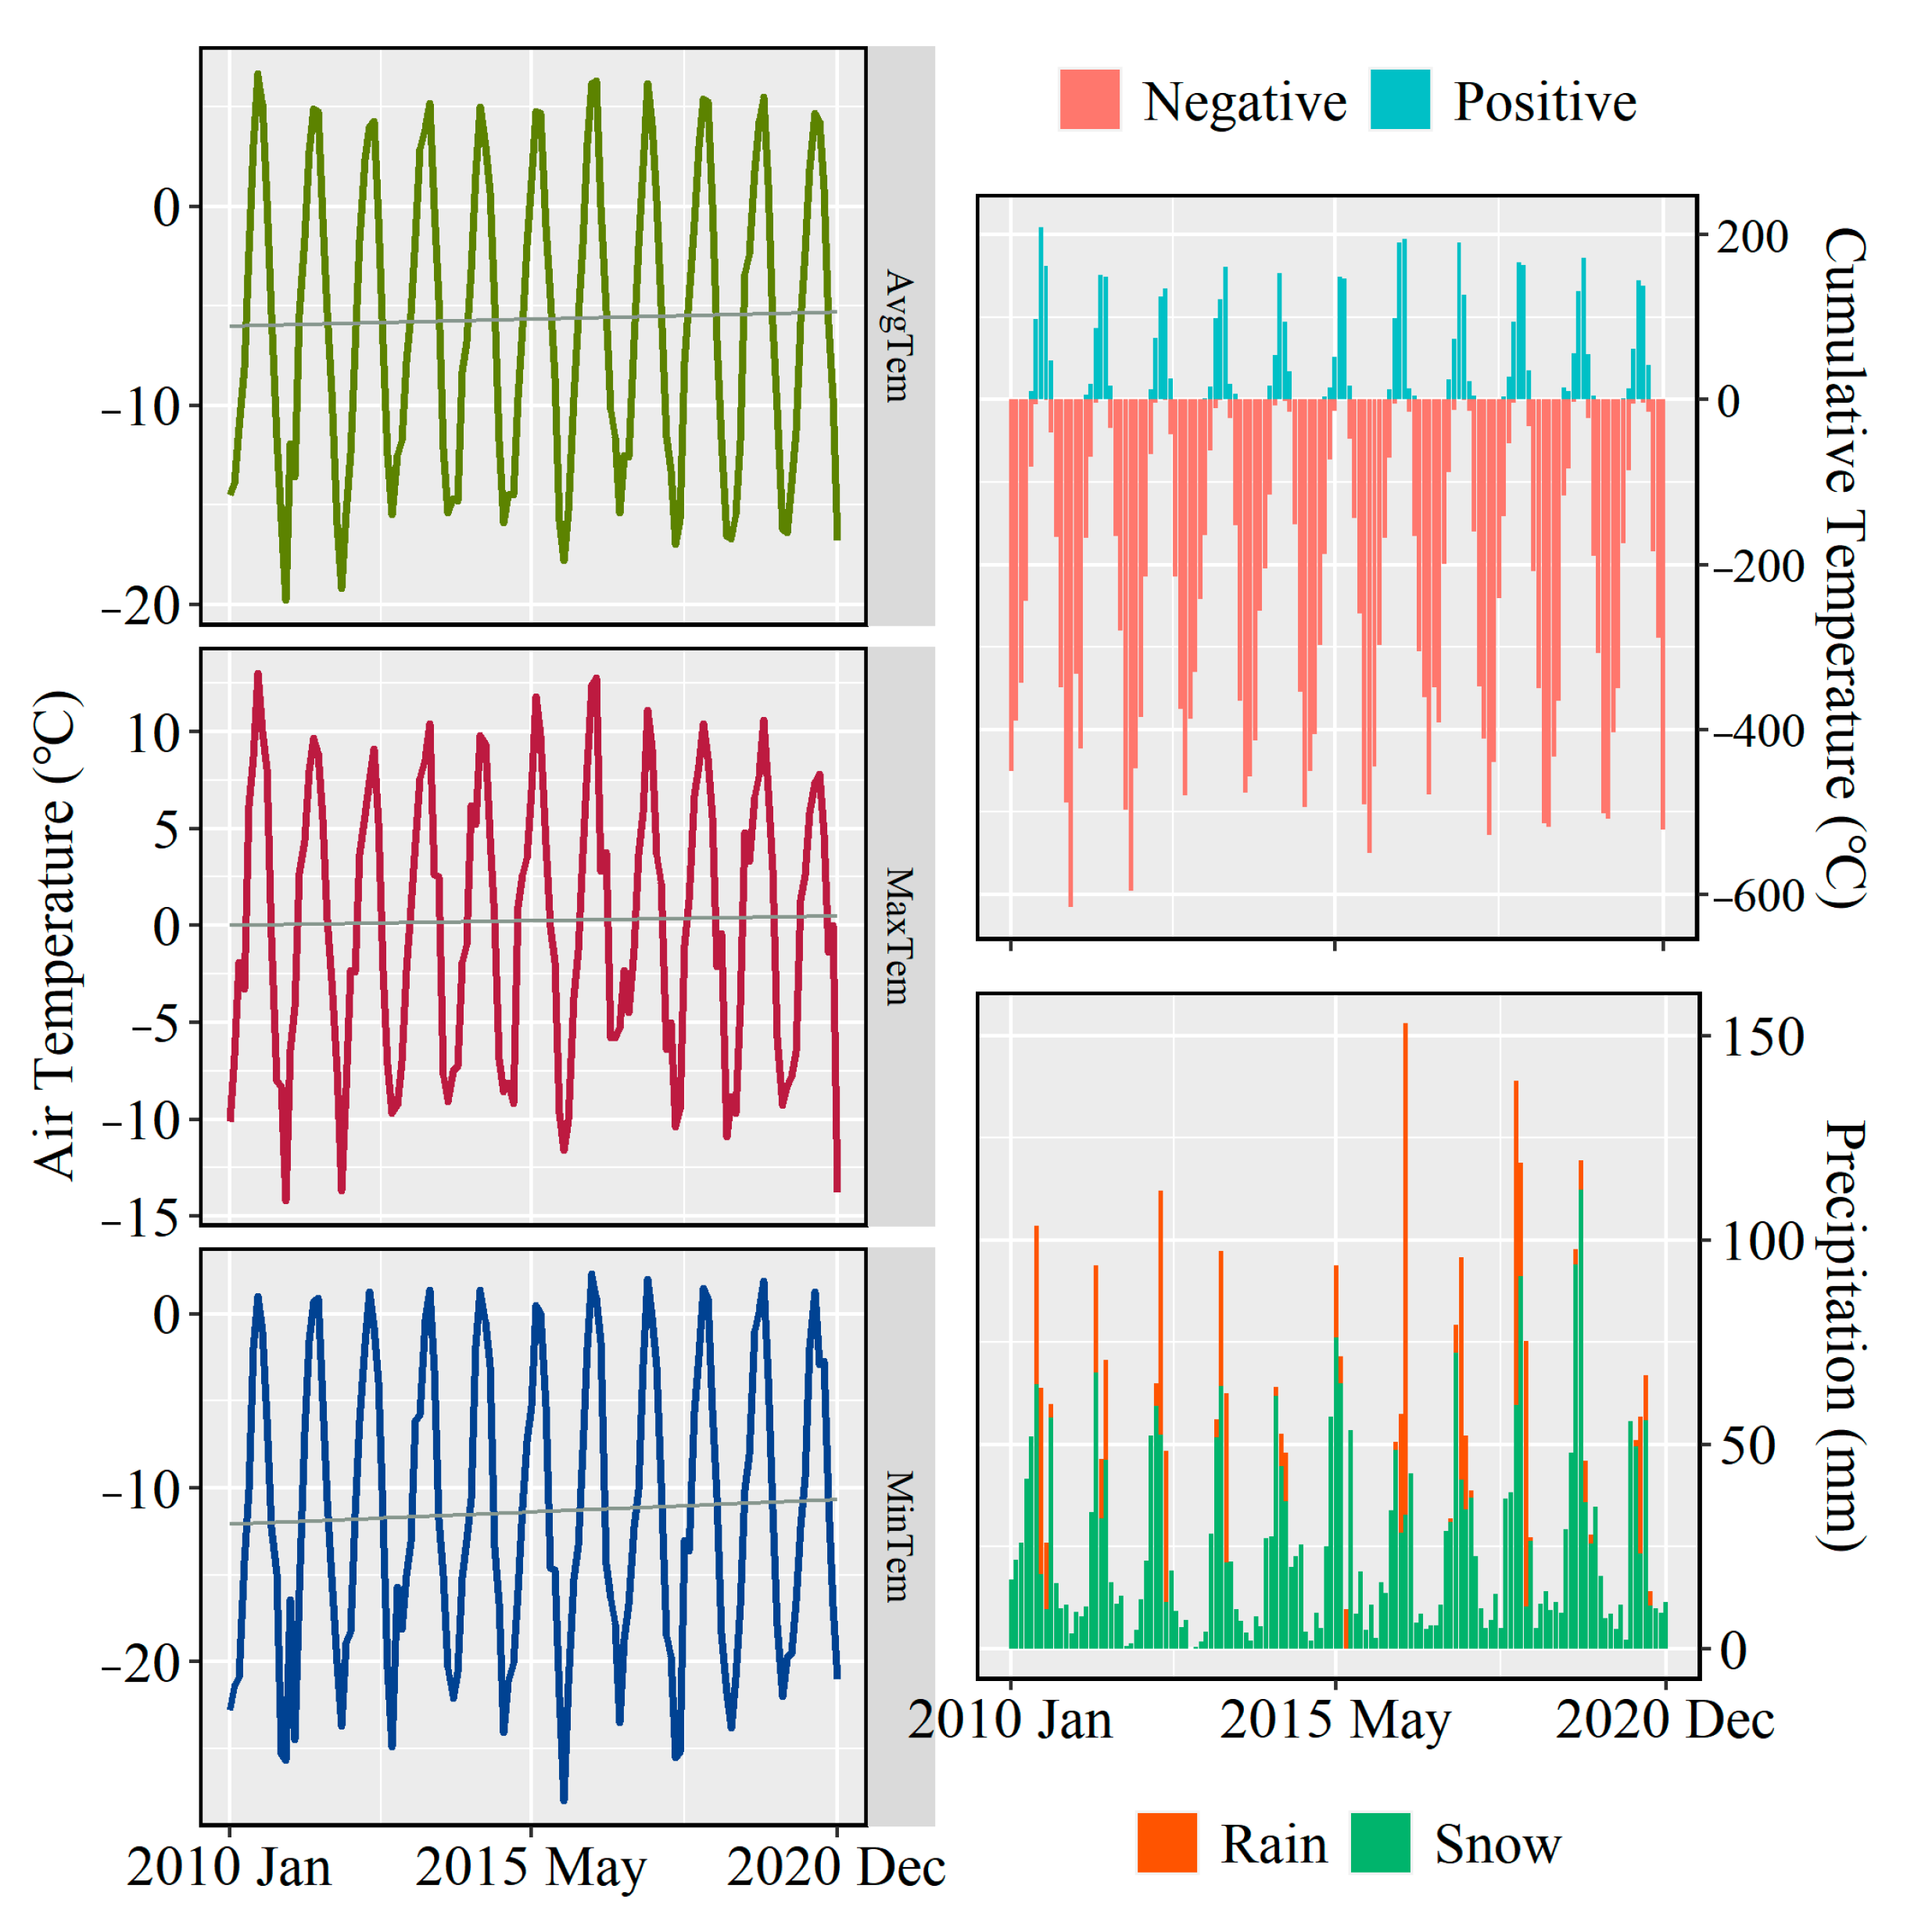
3.5. Climate Background

AWS data from Jan 2010 to Dec 2020 were analyzed in this study (Figure 11). We calculated the monthly negative and positive cumulative, minimum, maximum, and average air temperature and divided the solid and liquid precipitation by the air temperature (3.5 °C) [51]. In 2010–2021, the positive cumulative temperature increased by 0.02 °C month−1, and the negative cumulative temperature decreased by 0.14 °C month−1. This is higher than the positive cumulative temperature, as the amplitude, minimum, maximum, and average air temperature increased by 0.011 °C month−1, 0.004 °C month−1, and 0.005 °C month−1. The Summer of 2010 was the warmest, and the positive cumulative temperature was higher than it was in other years in the period of 2010–2021. Precipitation showed a slight increase of 0.04 mm month−1 in 2010–2021, but the percentage of liquid precipitation showed an obvious increase in 2010–2018.

4. Discussion

Increased air temperature, especially in the autumn and winter, could cause an increase in the borehole ice temperature and make the glacier more sensitive to climate change [39]. The AWS data show that in 2010–2021, the negative cumulative temperature had decreased and the positive cumulative temperature had increased. The variation amplitude in the negative cumulative temperature was obviously higher than it was in the positive cumulative temperature, which means that there was a serious decrease in the “cold storage” of LHG12. In 2010, 2016, and 2017, the positive cumulative temperature was higher, the negative cumulative temperature was lower, the liquid precipitation percentage was higher, and LHG12 experienced strong surface melt. Differential ablation on the surface of LHG12 may be exacerbated by supraglacial runoff and streams. In those years, there was strong ablation for a long time; therefore, a “bulge” gradually formed at the terminus of LHG12 over the next 1–2 years. This may be the main reason for the rapid retreat observed in the terminus in every few years.
In the Qilian Mountains, glaciers gradually become smaller, and the glacier surface velocity becomes slower from east to west (Figure 12). In recent decades, due to the climate warming, the glaciers in the Qilian Mountains have experienced huge mass loss, reduced ice thickness, and a reduced surface velocity. The surface velocity reduction trend observed in the large glaciers is higher than the trend observed in the small glaciers in the Qilian Mountains [52].
The dynamics of LHG12 were more complex than those of other single cirque or valley glaciers. Below the confluence region and between the two ice flows, there was a shearing surface similar to a “deep ditch” on the surface of LHG12 (Figure 6d). On both sides of the shearing line, the glacier surface parameters, motion, and mass balance characteristics represented significant differences. In previous simulations, due to the limitations of observation conditions, the ground resolution of the data or the remote sensing images, and other factors, the dynamic differences in the glacier on both sides of the shearing line were ignored. This may be the main reason for the underestimation of ice surface velocities in simulation results near the glacier terminus [36]. In further numerical simulations of glaciers, the effects of the shearing surface need to be considered seriously.
In addition, there were some limitations in the current work. First, although the DSM and DOM generated by drones had a high resolution at the centimeter scale, the area of aerial photogrammetry could not cover the entire glacier’s surface. In previous cases of drone-based glacier monitoring, there were only a few glaciers that were smaller and that had a more accessible route covering the entire area [49,57]. The images acquired by drones for those glaciers have a larger scale or are less accessible, and only the partially covered regions, such as the terminus region [32,58]. Second, because of the complex dynamics of LHG12, the MB could not be calculated from the DSM difference. Even high-precision measurements of elevation change cannot resolve the spatial patterns of mass balance across individual glaciers [59]. The DSM difference is the combination of changes in the surface MB, the englacial and basal components, and mass redistribution as a result of ice flow [60] and represents elevation change measurements integrating ice motion rather than the local signals of a specific MB [61]. As such, we need to use continuity equations to calculate the MB in further studies.

5. Conclusions

With the combination of drone-based photogrammetry and GNSS survey, DOM and DSM images with a centimeter-level ground resolution were acquired, and detailed dynamic characteristics of LHG12 were obtained. Compared to other single cirque or valley glaciers, the dynamic characteristics of LHG12 are more complex. The main conclusions are as follows:
(1)
The terminus of LHG12 retreated by 194.35 m in total and by 19.44 m a−1 on average during 2008–2021. Differential ablation may have led to changes in the morphology of the terminus edge. This caused a marked increase in the terminus’ retreat distance.
(2)
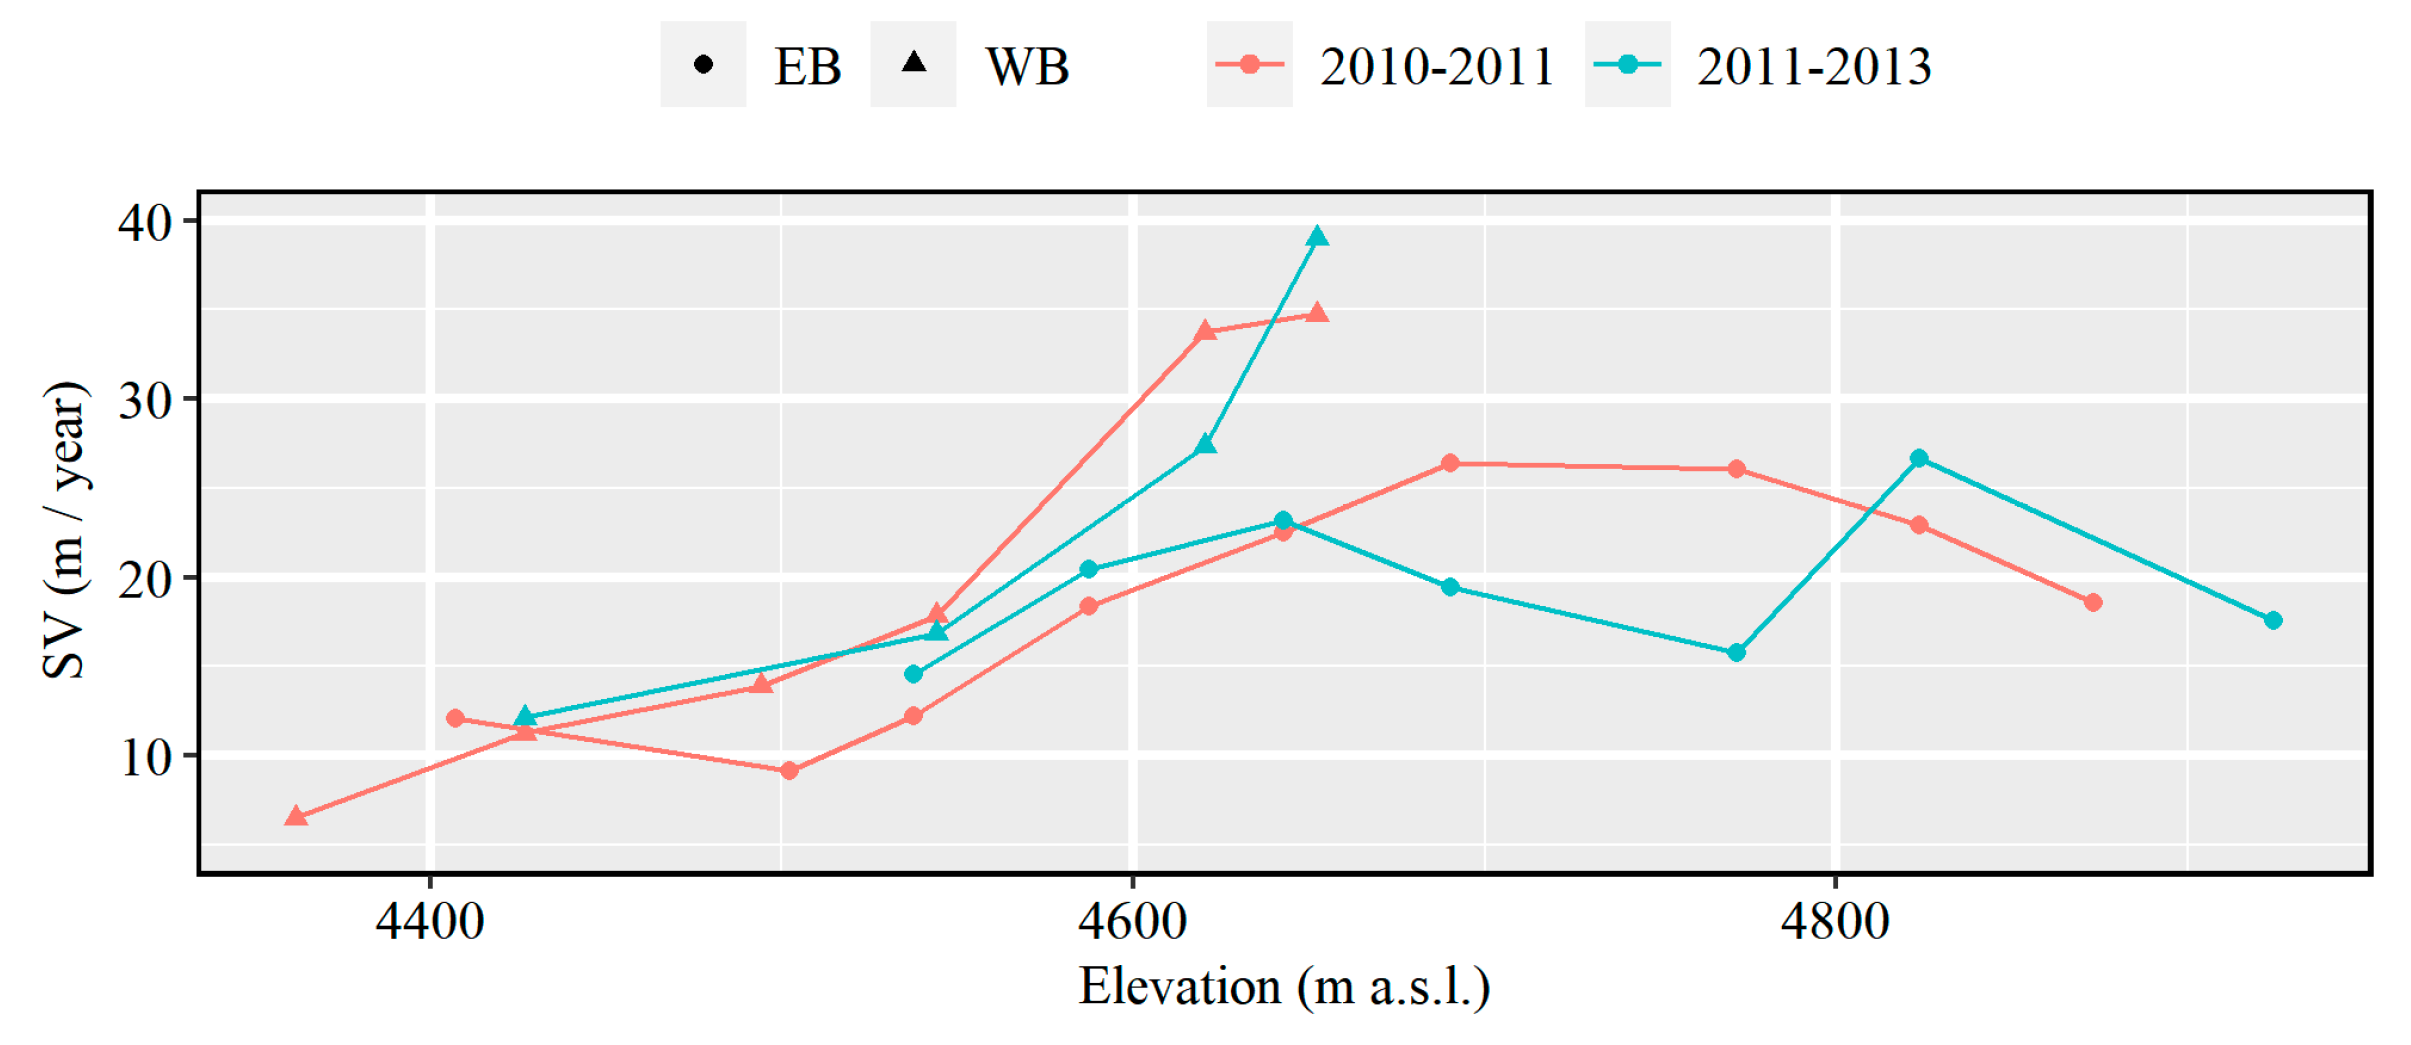
The dynamic characteristics of LHG12 were analyzed via drone-based photogrammetry, and differences in the surface velocity features between the west and east branches were found. The movement in the west branch is faster than it is in the east branch. Because of the extrusion of the two ice flows, there is a region with a faster surface velocity at the ablation area.
(3)
In 2019–2021, the maximum annual surface velocity was 6.50 cm day−1, and during ablation season, the maximum surface velocity was 13.59 cm day−1, 52.17% higher than it is annually. The surface velocity in the west branch was faster than it was in the east branch.
(4)
With the intensification of LHG12 ablation in recent decades, the ice thickness is decreasing, leading to the surface velocity decrease. This phenomenon is more obvious in large glaciers than it is in small glaciers in the Qilian mountains.

Author Contributions

All authors prepared the methodological concept of this study and the original draft and contributed to the editing of the manuscript. Conceptualization, D.Q. and Y.L. (Yushuo Liu); methodology, Y.L. (Yushuo Liu); software, Y.L. (Yushuo Liu) and Y.L. (Yanzhao Li); validation, X.Q.; formal analysis, X.Q.; investigation, Z.J., L.X. and Y.L. (Yanzhao Li); resources, Z.J., L.X. and Y.L. (Yanzhao Li); data curation, Z.J., L.X. and Y.L. (Yanzhao Li); writing—original draft preparation, Y.L. (Yushuo Liu); writing—review and editing, Y.L. (Yushuo Liu); visualization, Y.L. (Yushuo Liu). All authors have read and agreed to the published version of the manuscript.

Funding

This research was funded by the Project from the second Tibetan Plateau Scientific Expedition and Research Program (STEP), the Strategic Leading Science and technology project of Chinese Academy of Sciences and the State Key Laboratory of Cryospheric Sciences, grant numbers 2019QZKK020103, XDA2002010202 and SKLCS-ZZ-2022.

Data Availability Statement

Not applicable.

Acknowledgments

We also thanks for colleagues whose helped in filed observations worked in the Qilian Observation and research Station of Cryosphere and Ecologic Environment.

Conflicts of Interest

The authors declare no conflict of interest.

References

  1. Qin, D.; Ding, Y. Cryospheric Changes and Their Impacts:Present, Trends and Key Issues. Advabces Clim. Chang. Res. 2009, 5, 187–195. [Google Scholar] [CrossRef]
  2. Deng, G.; Tang, Z.; Hu, G.; Wang, J.; Sang, G.; Li, J. Spatiotemporal Dynamics of Snowline Altitude and Their Responses to Climate Change in the Tienshan Mountains, Central Asia, during 2001–2019. Sustainability 2021, 13, 3992. [Google Scholar] [CrossRef]
  3. Tang, Z.; Wang, X.; Deng, G.; Wang, X.; Jiang, Z.; Sang, G. Spatiotemporal variation of snowline altitude at the end of melting season across High Mountain Asia, using MODIS snow cover. Adv. Space Res. 2020, 66, 2629–2645. [Google Scholar] [CrossRef]
  4. Qin, D.; Yao, T.; Ding, Y.; Ren, J. Establishment and Significance of the Scientific System of Cryospheric Science. Bull. Chin. Acad. Sci. 2020, 35, 393–406. [Google Scholar] [CrossRef]
  5. Jansson, P.; Hock, R.; Schneider, T. The concept of glacier storage: A review. J. Hydrol. 2003, 282, 116–129. [Google Scholar] [CrossRef]
  6. Li, Z.; Li, K.; Wang, L. Study on Recent Glacier Changes and Their Impact on Water Resourcess in Xinjiang, North Westren, China. Quat. Sci. 2010, 30, 96–106. [Google Scholar] [CrossRef]
  7. Sorg, A.; Bolch, T.; Stoffel, M.; Solomina, O.; Beniston, M. Climate change impacts on glaciers and runoff in Tien Shan (Central Asia). Nat. Clim. Chang. 2012, 2, 725–731. [Google Scholar] [CrossRef]
  8. Liu, S.; Ding, Y.; Zhang, Y.; Shangguan, D.; Li, J.; Han, H.; Wang, J.; Xie, C. Impact of the glacial change on water resources in the Tarim River Basin. Acta Geogr. Sin. 2006, 61, 482–490. [Google Scholar] [CrossRef]
  9. Zhang, J.; He, X.; Shangguang, D.; Zhong, F.; Liu, S. Impact of Intensive Glacier Ablation on Arid Regions of Northwest China and Its Countermeasure. J. Glaciol. Geocryol. 2012, 34, 848–854. [Google Scholar]
  10. Liu, S.; Yao, X.; Guo, W.; Xu, J.; Shangguan, D.; Wei, J.; Bao, W.; Wu, L. The contemporary glaciers in China based on the Second Chinese Glacier Inventory. Acta Geogr. Sin. 2015, 70, 3–16. [Google Scholar] [CrossRef]
  11. Xu, C.; Li, J.; Wang, N. Climatic and environmental indications of stable oxygen isotopes in enclosed air bubbles in Tanggula ice core. J. Beijing Norm. Univ. (Nat. Sci.) 2019, 55, 145–152. [Google Scholar] [CrossRef]
  12. Tian, L.; Yao, T.; Wen, R.; Weng, Y.; Zhao, Z.; Qu, D. A primary recognition on the climatic significance of ice core isotope record in Naimona’ Nyi of west Tibetan Plateau. Quat. Sci. 2012, 32, 46–52. [Google Scholar] [CrossRef]
  13. Moon, T. Saying goodbye to glaciers. Science 2017, 356, 580–581. [Google Scholar] [CrossRef] [PubMed]
  14. Liu, S.; Wu, T.; Wang, X.; Wu, X.; Yao, X.; Liu, Q.; Zhang, Y.; Wei, J.; Zhu, X. Changes in the global cryosphere and their impacts: A review and new perspective. Sci. Cold Arid. Reg. 2020, 12, 343–354. [Google Scholar] [CrossRef]
  15. Kang, S.; Guo, W.; Zhong, X.; Xu, M. Changes in the mountain cryosphere and their impacts and adaptation measures. Clim. Chang. Res. 2020, 16, 143–152. [Google Scholar] [CrossRef]
  16. Li, X.; Gou, X.; Wang, N.; Sheng, Y.; Jin, H.; Qi, Y.; Song, X.; Hou, F.; Li, Y.; Zhao, C.; et al. Tightening ecological management facilitates green development in the Qilian Mountains. Chin. Sci. Bull. 2019, 64, 2928–2937. [Google Scholar] [CrossRef] [Green Version]
  17. Zhu, M.; Yao, T.; Thompson, L.G.; Wang, S.; Yang, W.; Zhao, H. What induces the spatiotemporal variability of glacier mass balance across the Qilian Mountains. Clim. Dyn. 2022, 1–23. [Google Scholar] [CrossRef]
  18. Sun, M.; Liu, S.; Yao, X.; Guo, W.; Xu, J. Glacier changes in the Qilian Mountains in the past half-century: Based on the revised First and Second Chinese Glacier Inventory. J. Geogr. Sci. 2018, 28, 206–220. [Google Scholar] [CrossRef] [Green Version]
  19. Liu, Y.; Qin, X.; Du, W. Changes of glacier area in the Xiying River Basin, East Qilian Mountain, China. Sci. Cold Arid. Reg. 2017, 9, 432–437. [Google Scholar] [CrossRef]
  20. Wang, P.; Li, Z.; Yu, G.; Li, H.; Wang, W.; Huai, B.; Zhou, P.; Jin, S.; Wang, L.; Zhang, H. Glacier shrinkage in the Daxue and Danghenan ranges of the western Qilian Mountains, China, from 1957 to 2010. Environ. Earth Sci. 2016, 75, 127. [Google Scholar] [CrossRef]
  21. Wang, Y.; Hou, S.; Hong, S.; Liu, Y. Glacier extent and volume change (1966-2000) on the Su-lo Mountain in northeastern Tibetan Plateau, China. J. Mt. Sci. 2008, 5, 299–309. [Google Scholar] [CrossRef]
  22. Yu, G.; Li, Z.; Wang, P. Glacier changes at the Daxue Mountain and Danghenan Mountain of west Qilian Mountains in recent 50 years. Arid. Land Geogr. 2014, 37, 299–309. [Google Scholar] [CrossRef]
  23. Wang, Y.; Li, J.; Wu, L.; Guo, L.; Li, J. Using remote sensing images to monitor the glacier changes in Qilian Mountains during 1987—2018 and analyzing the impact factors. J. Glaciol. Geocryol. 2020, 42, 344–356. [Google Scholar] [CrossRef]
  24. Bhardwaj, A.; Sam, L.; Akanksha; Martín-Torres, F.J.; Kumar, R. UAVs as remote sensing platform in glaciology: Present applications and future prospects. Remote Sens. Environ. 2016, 175, 196–204. [Google Scholar] [CrossRef]
  25. Wang, Y.; Ren, J.; Qin, D.; Qin, X. Regional Glacier Volume Changes Derived from Satellite Data: A Case Study in the Qilian Mountains. J. Glaciol. Geocryol. 2013, 35, 583–592. [Google Scholar] [CrossRef]
  26. Wang, P.; Li, Z.; Li, H.; Li, K.; Xu, C. Analysis of the relation between glacier volume change and area change in the Tianshan Mountains. J. Glaciol. Geocryol. 2017, 39, 9–15. [Google Scholar] [CrossRef]
  27. Banerjee, A. Volume-area scaling for debris-covered glaciers. J. Glaciol. 2020, 66, 880–886. [Google Scholar] [CrossRef]
  28. Radić, V.; Hock, R.; Oerlemans, J. Volume–area scaling vs flowline modelling in glacier volume projections. Ann. Glaciol. 2007, 46, 234–240. [Google Scholar] [CrossRef] [Green Version]
  29. Zhao, C.; Yang, W.; Wang, Y.; Ding, B.; Xu, X. Changes in surface elevation and velocity of Parlung No.4 glacier in southeastern Tibetan Plateau: Monitoring by UAV technology. J. Beijing Norm. Univ. (Nat. Sci.) 2020, 56, 557–565. [Google Scholar] [CrossRef]
  30. Wang, P.; Li, H.; Li, Z.; Liu, Y.; Xu, C.; Mu, J.; Zhang, H. Seasonal Surface Change of Urumqi Glacier No. 1, Eastern Tien Shan, China, Revealed by Repeated High-Resolution UAV Photogrammetry. Remote Sens. 2021, 13, 3398. [Google Scholar] [CrossRef]
  31. Ramsankaran, R.; Navinkumar, P.; Dashora, A.; Kulkarni, A. UAV-Based Survey of Glaciers in Himalayas: Challenges and Recommendations. J. Indian Soc. Remote Sens. 2021, 49, 1171–1187. [Google Scholar] [CrossRef]
  32. Jouvet, G.; van Dongen, E.; Lüthi, M.; Vieli, A. In situ measurements of the ice flow motion at Eqip Sermia Glacier using a remotely controlled unmanned aerial vehicle (UAV). Geosci. Instrum. Methods Data Syst. 2020, 9, 1–10. [Google Scholar] [CrossRef] [Green Version]
  33. Fugazza, D.; Scaioni, M.; Corti, M.; D’Agata, C.; Azzoni, R.; Cernuschi, M.; Smiraglia, C.; Diolaiuti, G. Combination of UAV and terrestrial photogrammetry to assess rapid glacier evolution and map glacier. Nat. Hazards Earth Syst. Sci. 2018, 18, 1055–1071. [Google Scholar] [CrossRef] [Green Version]
  34. Liu, Y.; Qin, X.; Du, W.; Sun, W.; Hou, D. The movement features analysis of Laohugou Glacier No. 12 in Qilian Mountains. Sci. Cold Arid. Reg. 2011, 3, 119–123. [Google Scholar] [CrossRef]
  35. Chen, J.; Kang, S.; Qin, X.; Du, W.; Sun, W.; Liu, Y. The mass-balance characteristics and sensitivities to climate variables of Laohugou Glacier No. 12, western Qilian Mountains, China. Sci. Cold Arid. Reg. 2017, 9, 543–553. [Google Scholar] [CrossRef]
  36. Wang, Y.; Zhang, T.; Ren, J.; Qin, X.; Liu, Y.; Sun, W.; Chen, J.; Ding, M.; Du, W.; Qin, D. An investigation of the thermomechanical features of Laohugou Glacier No. 12 on Qilian Shan, western China, using a two dimensional first order flow band ice flow model. Cryosphere 2018, 12, 851–866. [Google Scholar] [CrossRef] [Green Version]
  37. Liu, Y.; Qin, X.; Chen, J.; Li, Z.; Wang, J.; Du, W.; Guo, W. Variations of Laohugou Glacier No. 12 in the western Qilian Mountains, China, from 1957 to 2015. J. Mt. Sci. 2018, 15, 25–32. [Google Scholar] [CrossRef]
  38. Sun, W.; Qin, X.; Ren, J.; Yang, X.; Zhang, T.; Liu, Y.; Cui, X.; Du, W. The Surface Energy Budget in the Accumulation Zone of the Laohugou Glacier No. 12 in the Western Qilian Mountains, China, in Summer 2009. Arct. Antarct. Alp. Res. 2012, 44, 296–305. [Google Scholar] [CrossRef] [Green Version]
  39. Liu, Y.; Qin, D.; Li, Y.; Qin, X.; Li, Z.; Wang, J.; Jin, Z.; Wang, L. Changes in the Surface Elevation of the Laohugou Glacier No. 12 in Western Qilian Mountains. Front. Earth Sci. 2022, 10, 1–9. [Google Scholar] [CrossRef]
  40. Wang, Y.; Ren, J.; Qin, X.; Liu, Y.; Zhang, T.; Chen, J.; Li, Y.; Qin, D. Ice depth and glacier-bed characteristics of the Laohugou Glacier No.12, Qilian Mountains, revealed by ground-penetrating radar. J. Glaciol. Geocryol. 2016, 38, 28–35. [Google Scholar] [CrossRef]
  41. The Technical Parameters of the PHANTOM 4 Pro. Available online: https://www.dji.com/cn/phantom-4-pro/info#specs (accessed on 15 May 2022).
  42. The Technical Parameters of the MAVIC 2 Pro. Available online: https://www.dji.com/cn/mavic-2/info#specs (accessed on 15 May 2022).
  43. Liu, Y.; Qin, X.; Guo, W.; Gao, S.; Chen, J.; Wang, L.; Li, Y.; Jin, Z. Influence of the use of photogrammetric measurement precision on low-altitude micro-UAVs in the glacier region. Natl. Remote Sens. Bull 2020, 24, 161–172. [Google Scholar] [CrossRef]
  44. The Technical Parameters of the SOUTH S86 and SOUTH INNO7 GNSS. Available online: https://www.southinstrument.com (accessed on 15 May 2022).
  45. The Ground Sampling Distance (GSD) in Photogrammetry. Available online: https://support.pix4d.com/hc/en-us/articles/202559809-Ground-sampling-distance-GSD-in-photogrammetry (accessed on 15 May 2022).
  46. The Home Page of the QGIS. Available online: https://www.qgis.org (accessed on 15 May 2022).
  47. Messerli, A.; Grinsted, A. Image georectification and feature tracking toolbox: ImGRAFT. Geosci. Instrum. Methods Data Syst. 2015, 4, 23–34. [Google Scholar] [CrossRef] [Green Version]
  48. Heid, T.; Kaab, A. Evaluation of existing image matching methods for deriving glacier surface displacements globally from optical satellite imagery. Remote Sens. Environ. 2012, 118, 339–355. [Google Scholar] [CrossRef]
  49. Lamsters, K.; Ješkins, J.; Sobota, I.; Karušs, J.; Džeriņš, P. Surface Characteristics, Elevation Change, and Velocity of High-Arctic Valley Glacier from Repeated High-Resolution UAV Photogrammetry. Remote Sens. 2022, 14, 1029. [Google Scholar] [CrossRef]
  50. Huang, M.; Sun, Z. Some Flow Characteristics of Continental-Type Glaciers in China. J. Glaciol. Geocryol. 1982, 4, 35–45. [Google Scholar]
  51. Chen, R.; Kang, E.; Ding, Y. Some knowledge on China’s alpine hydrology. Adv. Water Sci. 2014, 25, 308–317. [Google Scholar] [CrossRef]
  52. Jing, Z.; Wang, K.; Liu, L. Movement and variation of four typical glaciers in the Qilian Mountains, Northwestern China. Sci. Cold Arid. Reg. 2015, 7, 206–211. [Google Scholar] [CrossRef]
  53. Wang, K.; Jing, Z.; Wu, Y.; Deng, Y. Latest survey and study of surface flow features of the Qiyi Glacier in the Qilian Mountains. J. Glaciol. Geocryol. 2014, 36, 9. [Google Scholar]
  54. Cao, B.; Wang, J.; Pan, B.; Zhang, X.; Cui, H. Surface flow velocities of the Ningchanhe No.1 and Shuiguanhe No. 4 Glaciers in the East Qilian Mountains. J. Glaciol. Geocryol. 2013, 35, 8. [Google Scholar] [CrossRef]
  55. Liu, Y.; Qin, X.; Du, W.; Zhang, X.; Chen, J.; Xie, X.; Zhang, X. An analysis of flow features of the Ningchan River Glacier No. 3 in the Qilian Mountains. J. Glaciol. Geocryol. 2013, 35, 7. [Google Scholar] [CrossRef]
  56. Cao, B.; Guan, W.; Li, K.; Pan, B.; Sun, X. High-Resolution Monitoring of Glacier Mass Balance and Dynamics with Unmanned Aerial Vehicles on the Ningchan No. 1 Glacier in the Qilian Mountains, China. Remote Sens. 2021, 13, 2735. [Google Scholar] [CrossRef]
  57. Karimi, N.; Sheshangosht, S.; Roozbahani, R. High-resolution monitoring of debris-covered glacier mass budget and flow velocity using repeated UAV photogrammetry in Iran. Geomorphology 2021, 389, 107855. [Google Scholar] [CrossRef]
  58. Che, Y.; Wang, S.; Yi, S.; Wei, Y.; Cai, Y. Summer Mass Balance and Surface Velocity Derived by Unmanned Aerial Vehicle on Debris-Covered Region of Baishui River Glacier No. 1, Yulong Snow Mountain. Remote Sens. 2020, 12, 3280. [Google Scholar] [CrossRef]
  59. Davaze, L.; Rabatel, A.; Dufour, A.; Hugonnet, R.; Arnaud, Y. Region Wide Annual Glacier Surface Mass Balance for the European Alps From 2000 to 2016. Front. Earth Sci. 2020, 8, 149. [Google Scholar] [CrossRef]
  60. Miles, E.; McCarthy, M.; Dehecq, A.; Kneib, M.; Fugger, S.; Pellicciotti, F. Health and sustainability of glaciers in High Mountain Asia. Nat. Commun. 2021, 12, 2868. [Google Scholar] [CrossRef]
  61. Berthier, E.; Vincent, C. Relative contribution of surface mass balance and ice flux changes to the accelerated thinning of Mer de Glace, French Alps, over1979-2008. J. Glaciol. 2017, 58, 501–512. [Google Scholar] [CrossRef] [Green Version]
Figure 1. Study area. (a) Location of LHG12; (b) Drone survey region; (c) Drone-based image-capture routes and distribution of GCPs.
Remotesensing 14 03315 g001
Figure 2. Method test and uncertainty estimation of surface velocity extraction of LHG12. (a) Surface velocity extracted by DSM; (b) Surface velocity extracted by hillshade images and distribution of validation points; (c) DOM acquired on 16 July 2019; (d) Surface velocity extraction errors between ImGRAFT and artificial; (e) Relativity of surface velocity extracted by ImGRAFT and artificial.
Remotesensing 14 03315 g002
Figure 3. Terminus changes of LHG12. (a) Terminus changes in 1959–2021. The data source for the period of 1959–2015 was the literature [37], and the data source for the period of 2017–2021 was drone-based DOM; (b) Terminus position from 2008 to 2021. The data source for the period of 2008–2015 was the literature [37], and the data source for the period of 2017–2021 was drone-based DOM.
Remotesensing 14 03315 g003
Figure 4. Surface morphology characteristics of LHG12. (a) Aspect, on 6 September 2021; (b) Roughness, on 6 September 2021; (c) Slope, on 6 September 2021; (d) Elevation, on 6 September 2021.
Remotesensing 14 03315 g004
Figure 5. Surface flow direction of LHG12 detected by visual feature track, 16 July 2019–22 July 2021.
Remotesensing 14 03315 g005
Figure 6. Glacier surface velocity extracted by hillshade images. (a) surface velocity on 4 June 2021–22 July 2021; (b) surface velocity on 16 July 2019–22 July 2021; (c) surface velocity on 22 July 2021–6 September 2021; (d) shear line at the confluence region.
Remotesensing 14 03315 g006
Figure 7. Seasonal surface velocity of LHG12 at cross and longitude profiles.
Remotesensing 14 03315 g007
Figure 8. Relationship between surface velocity (SV) and monthly air temperature at the confluence region (4550 m a.s.l.; the data source for the period of September 1960–September1961 was the literature [50]).
Remotesensing 14 03315 g008
Figure 9. Surface velocities of LHG12 during 2010–2013 (EB: east branch; WB: west branch).
Remotesensing 14 03315 g009
Figure 10. Changes in elevation (PA: 22 July 2018–16 July 2019; PB: 16 July 2019–22 July 2021).
Remotesensing 14 03315 g010
Figure 11. Features of temperature and precipitation of LHG12 at 4200 m a.s.l. in 2010–2021.
Remotesensing 14 03315 g011
Figure 12. Surface velocity of glaciers in the Qilian Mountains (Laohugou glacier No.12, Qiyi Glacier [52,53], Yanglonghe Glacier No.5 [50,52], Shuiguanhe Glacier No.4 [54], Ningchanhe Glacier No.3 [55], Ningchanhe Glacier No.1 [56]).
Remotesensing 14 03315 g012
Table 1. Flight information.
DateDroneFlight Height (m)SiteOverlap (%)GSD (cm)GNSS
24 August 2017P4P1203753.27SOUTH S86
21 July 2018P4P12012753.27SOUTH S86
4 June 2019P4P12012753.27SOUTH S86
16 July 2019P4P12012753.27SOUTH S86
2 June 2021M2P15012753.51SOUTH INNO7
22 July 2021M2P15012753.51SOUTH INNO7
6 September 2021M2P15012753.51SOUTH INNO7
Table 2. Area changes in the mid–low region of LHG12, 2018–2021.
YearArea (km2)Area Change (km2)Annual Change Rate (%)
20181.97
20191.96−0.01−0.51
20211.93−0.03−0.77
Publisher’s Note: MDPI stays neutral with regard to jurisdictional claims in published maps and institutional affiliations.

