
Evaluation of Drought Propagation Characteristics and Influencing Factors in an Arid Region of Northeast Asia (ARNA)


Abstract
1. Introduction
2. Materials and Methods
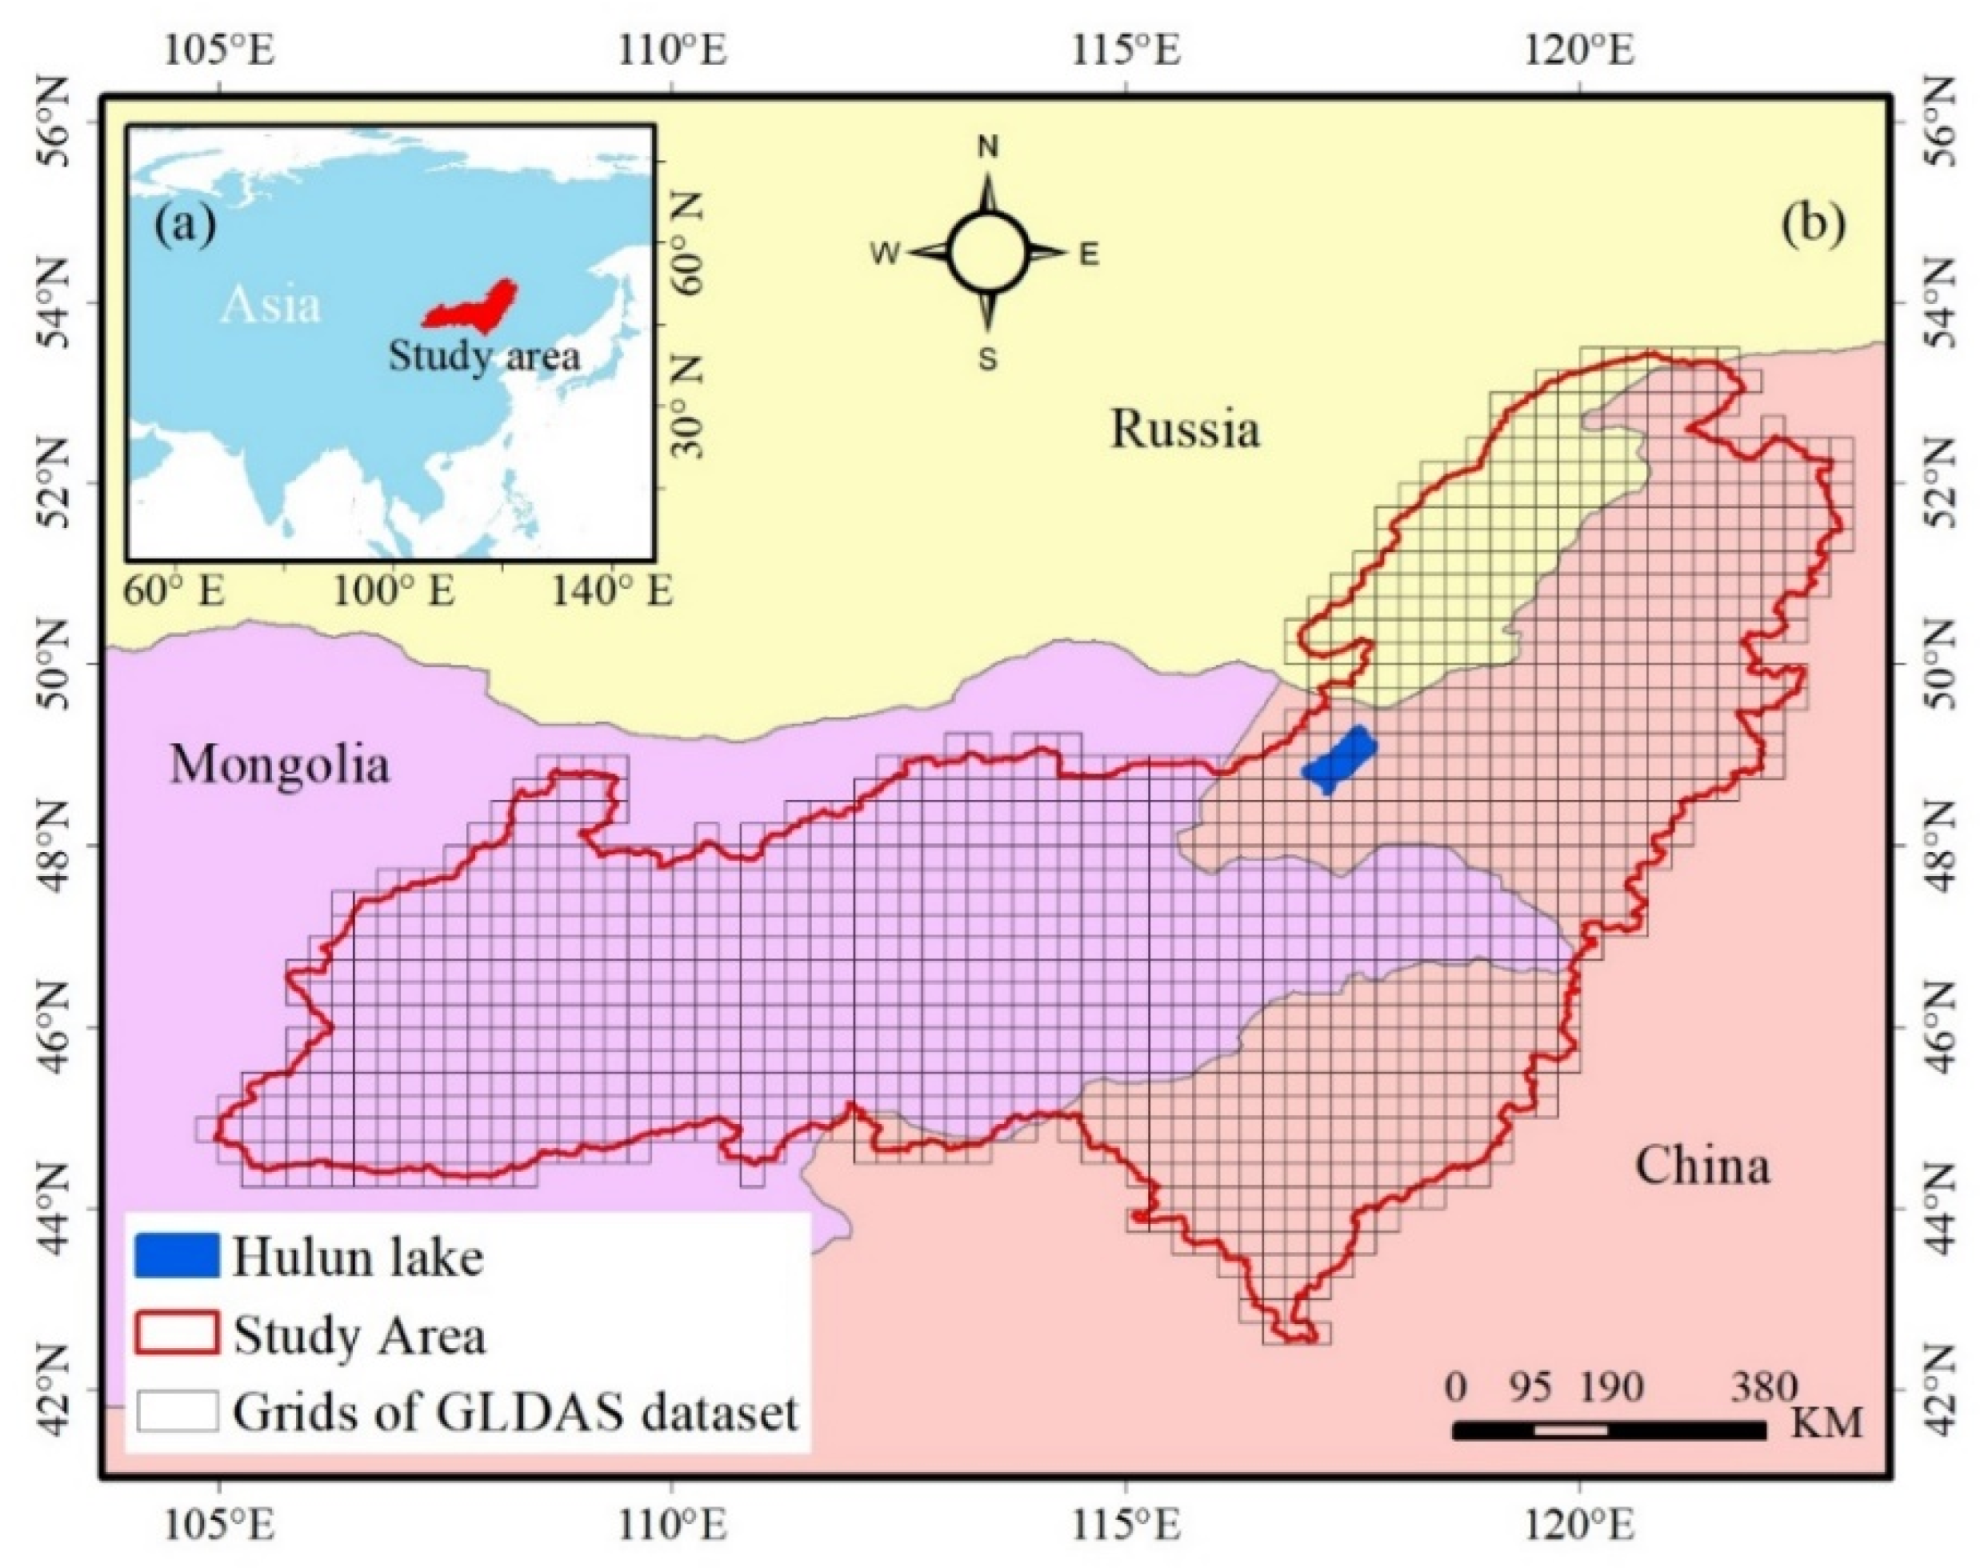
2.1. Study Area
2.2. Data
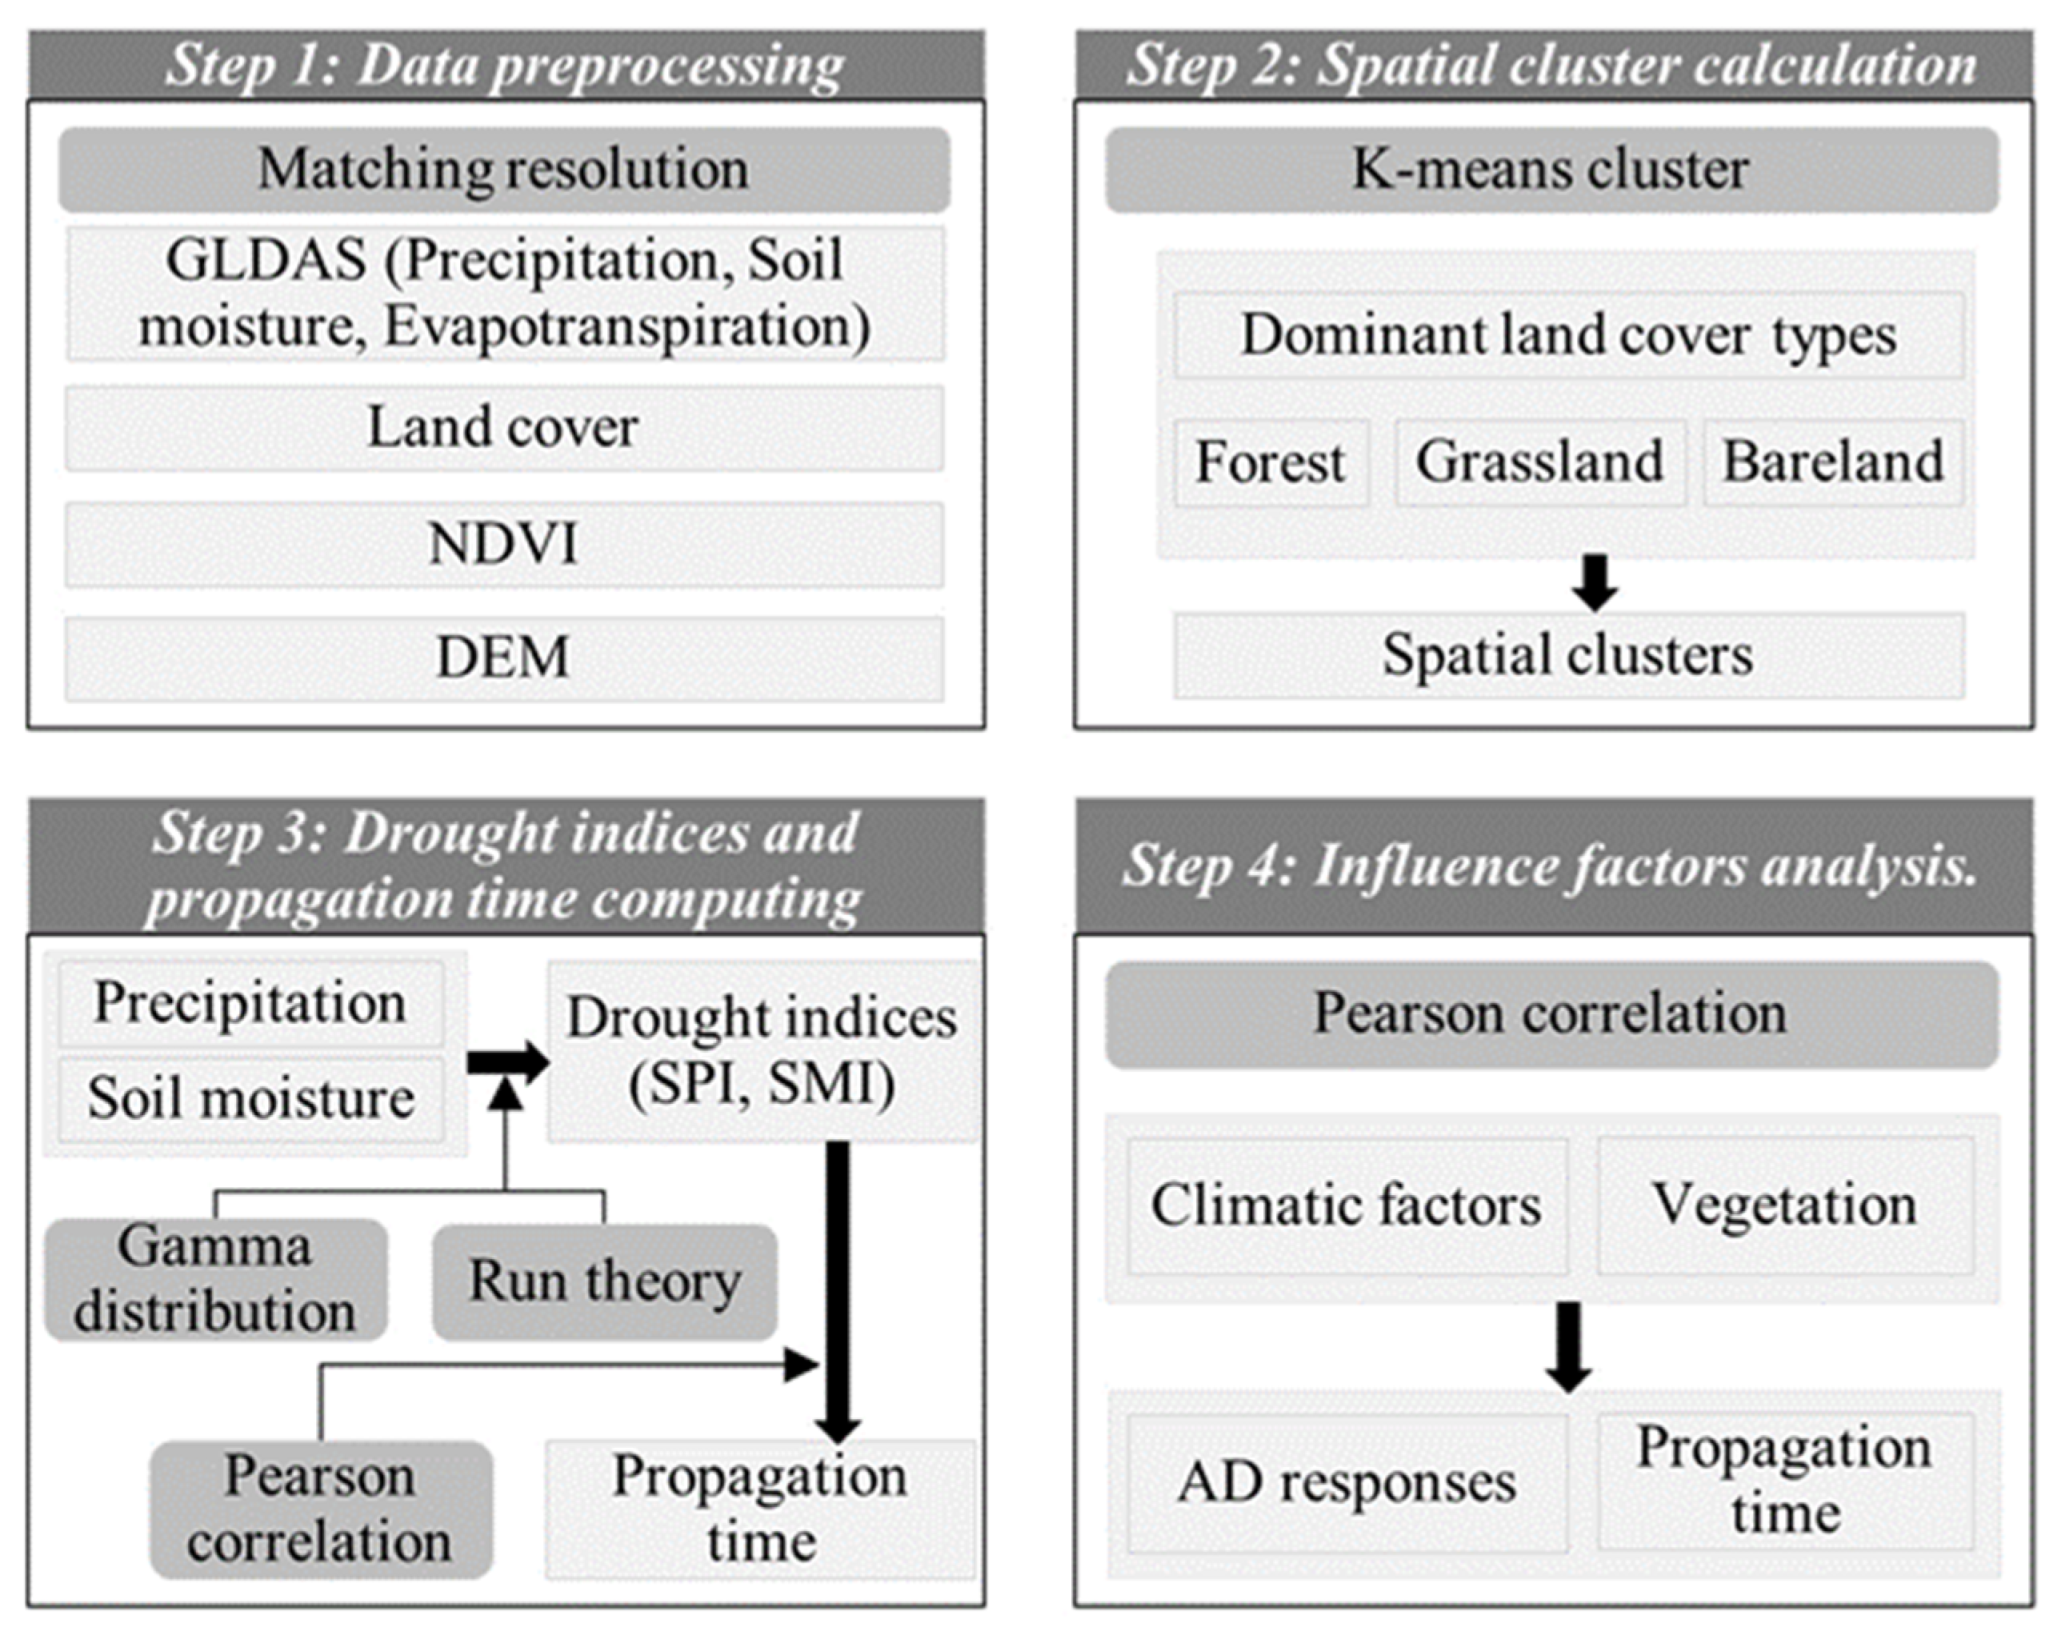
2.3. Methods
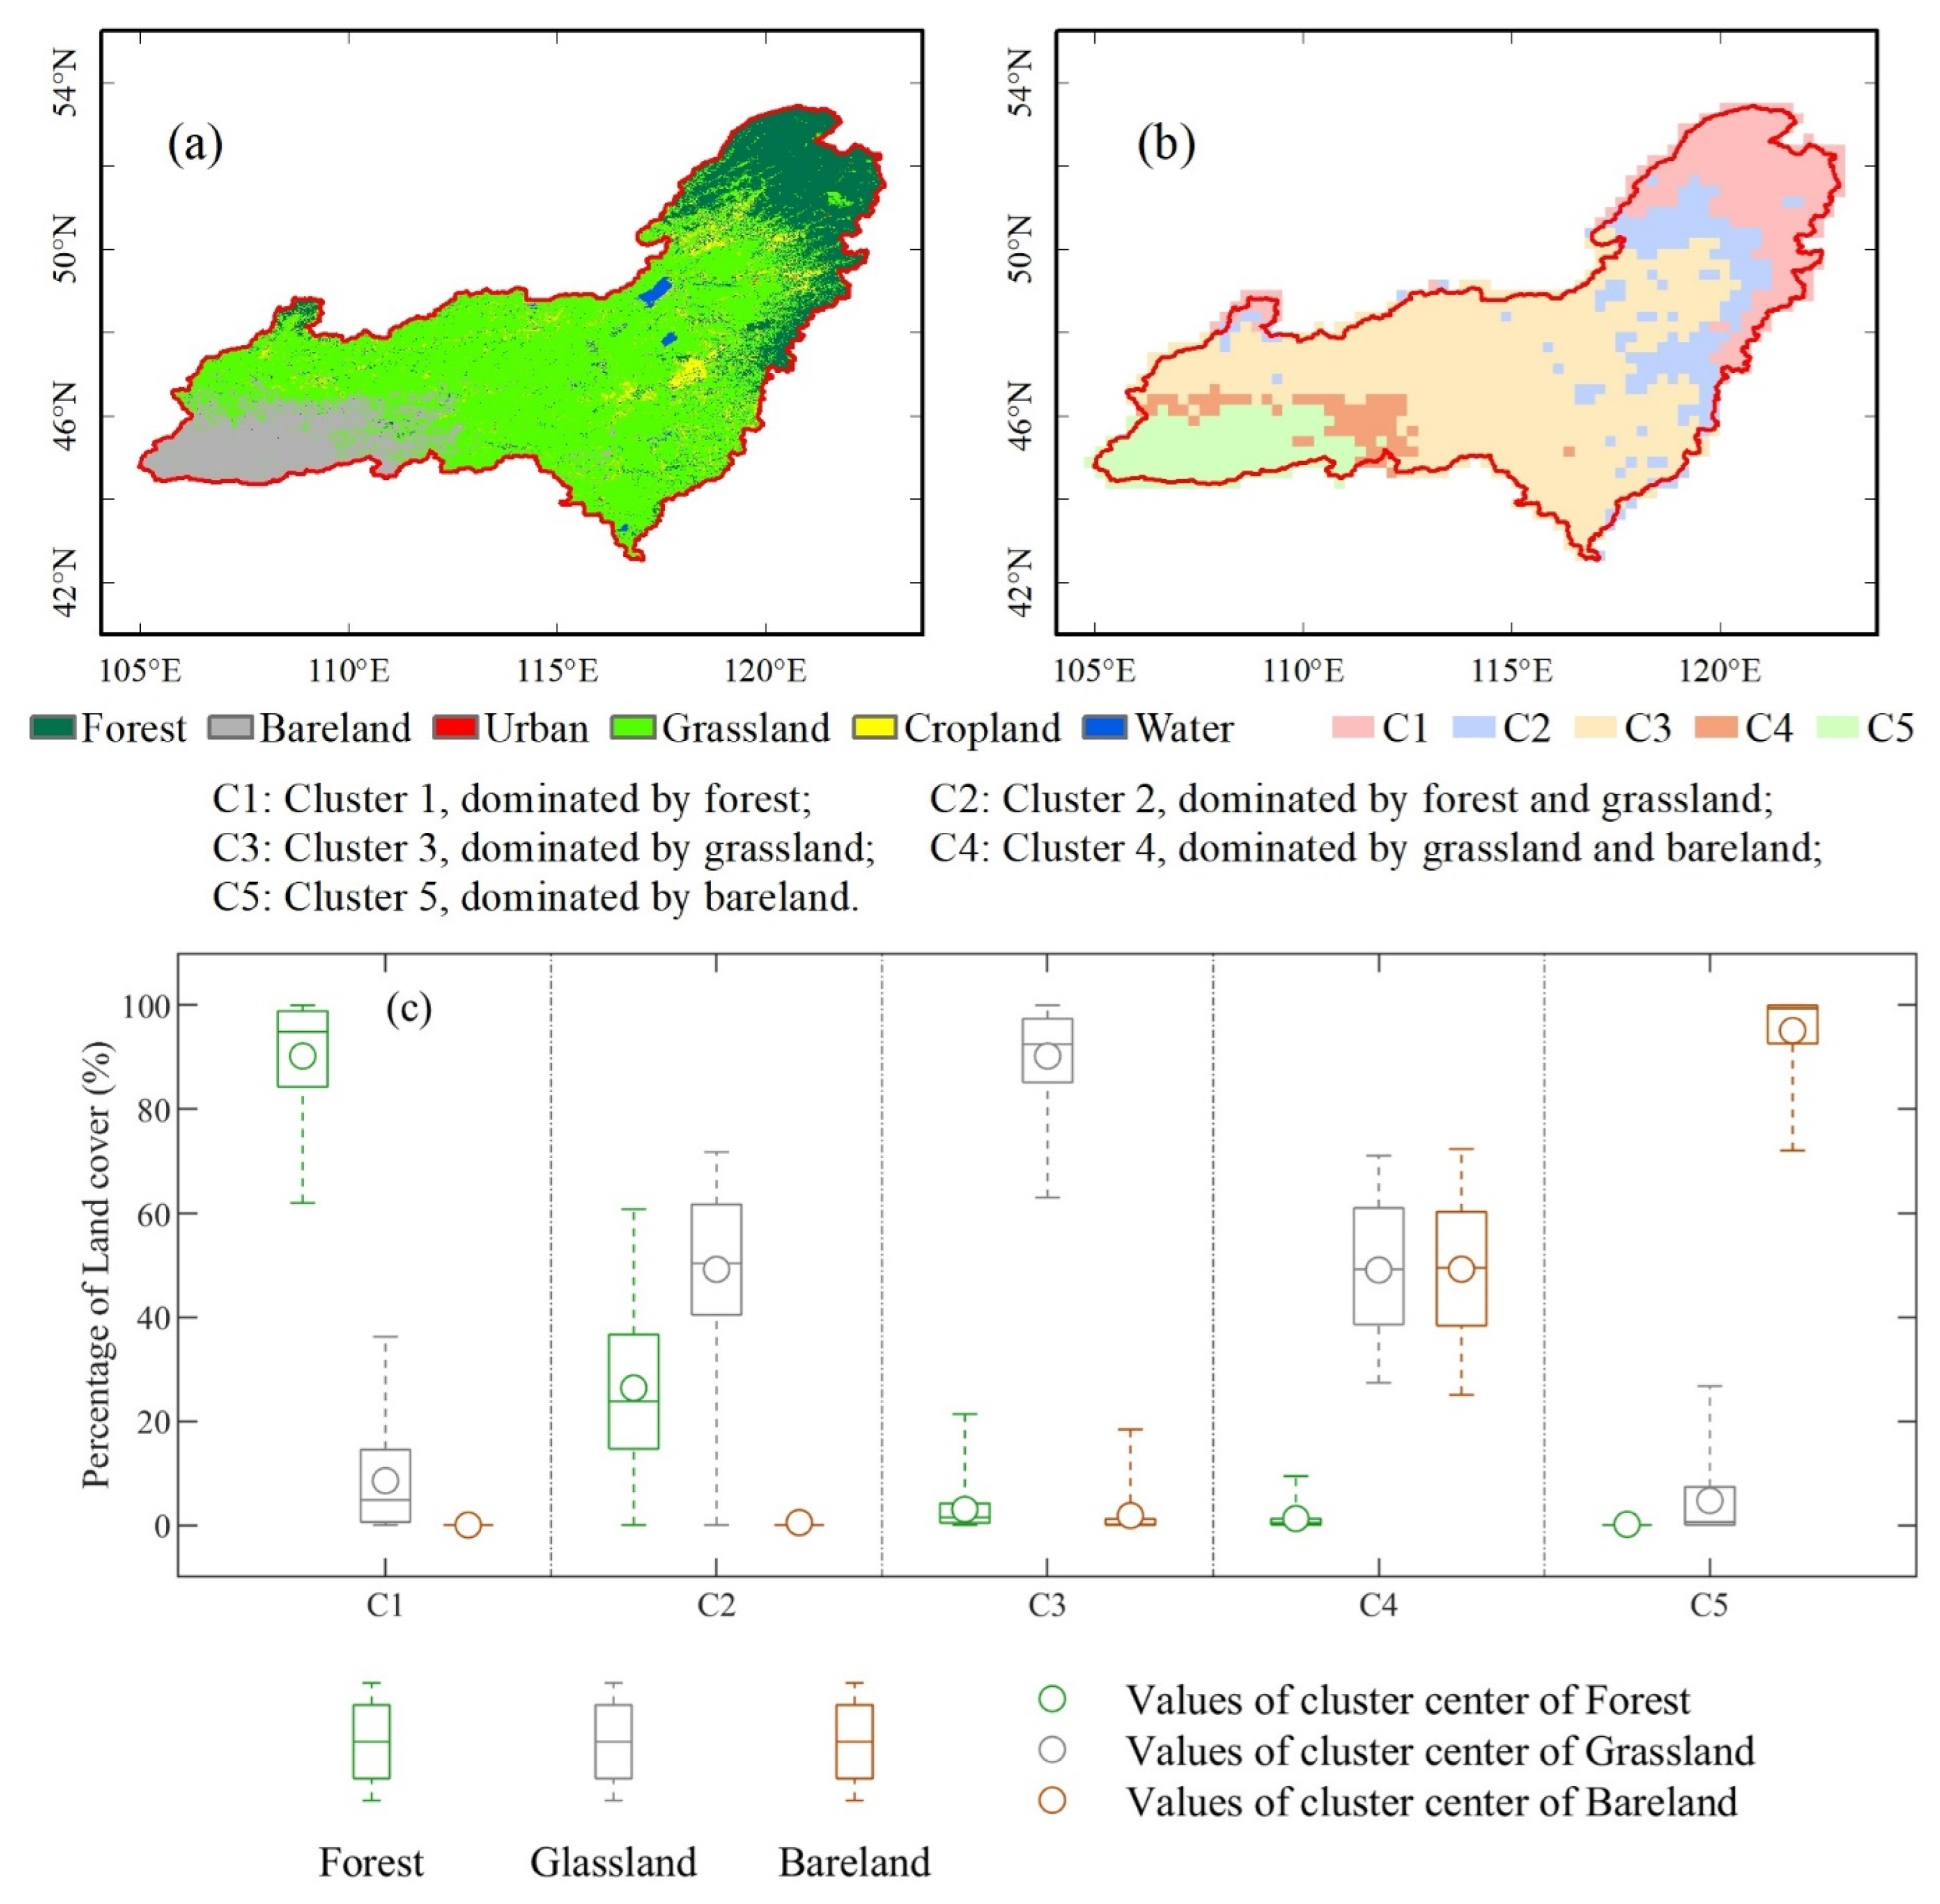
2.3.1. K-Means Cluster Analysis
2.3.2. Drought Indices and Drought Characteristics
2.3.3. Investigation of Drought Propagation Definition and Influence Factors
3. Results
3.1. Cluster Results Analysis
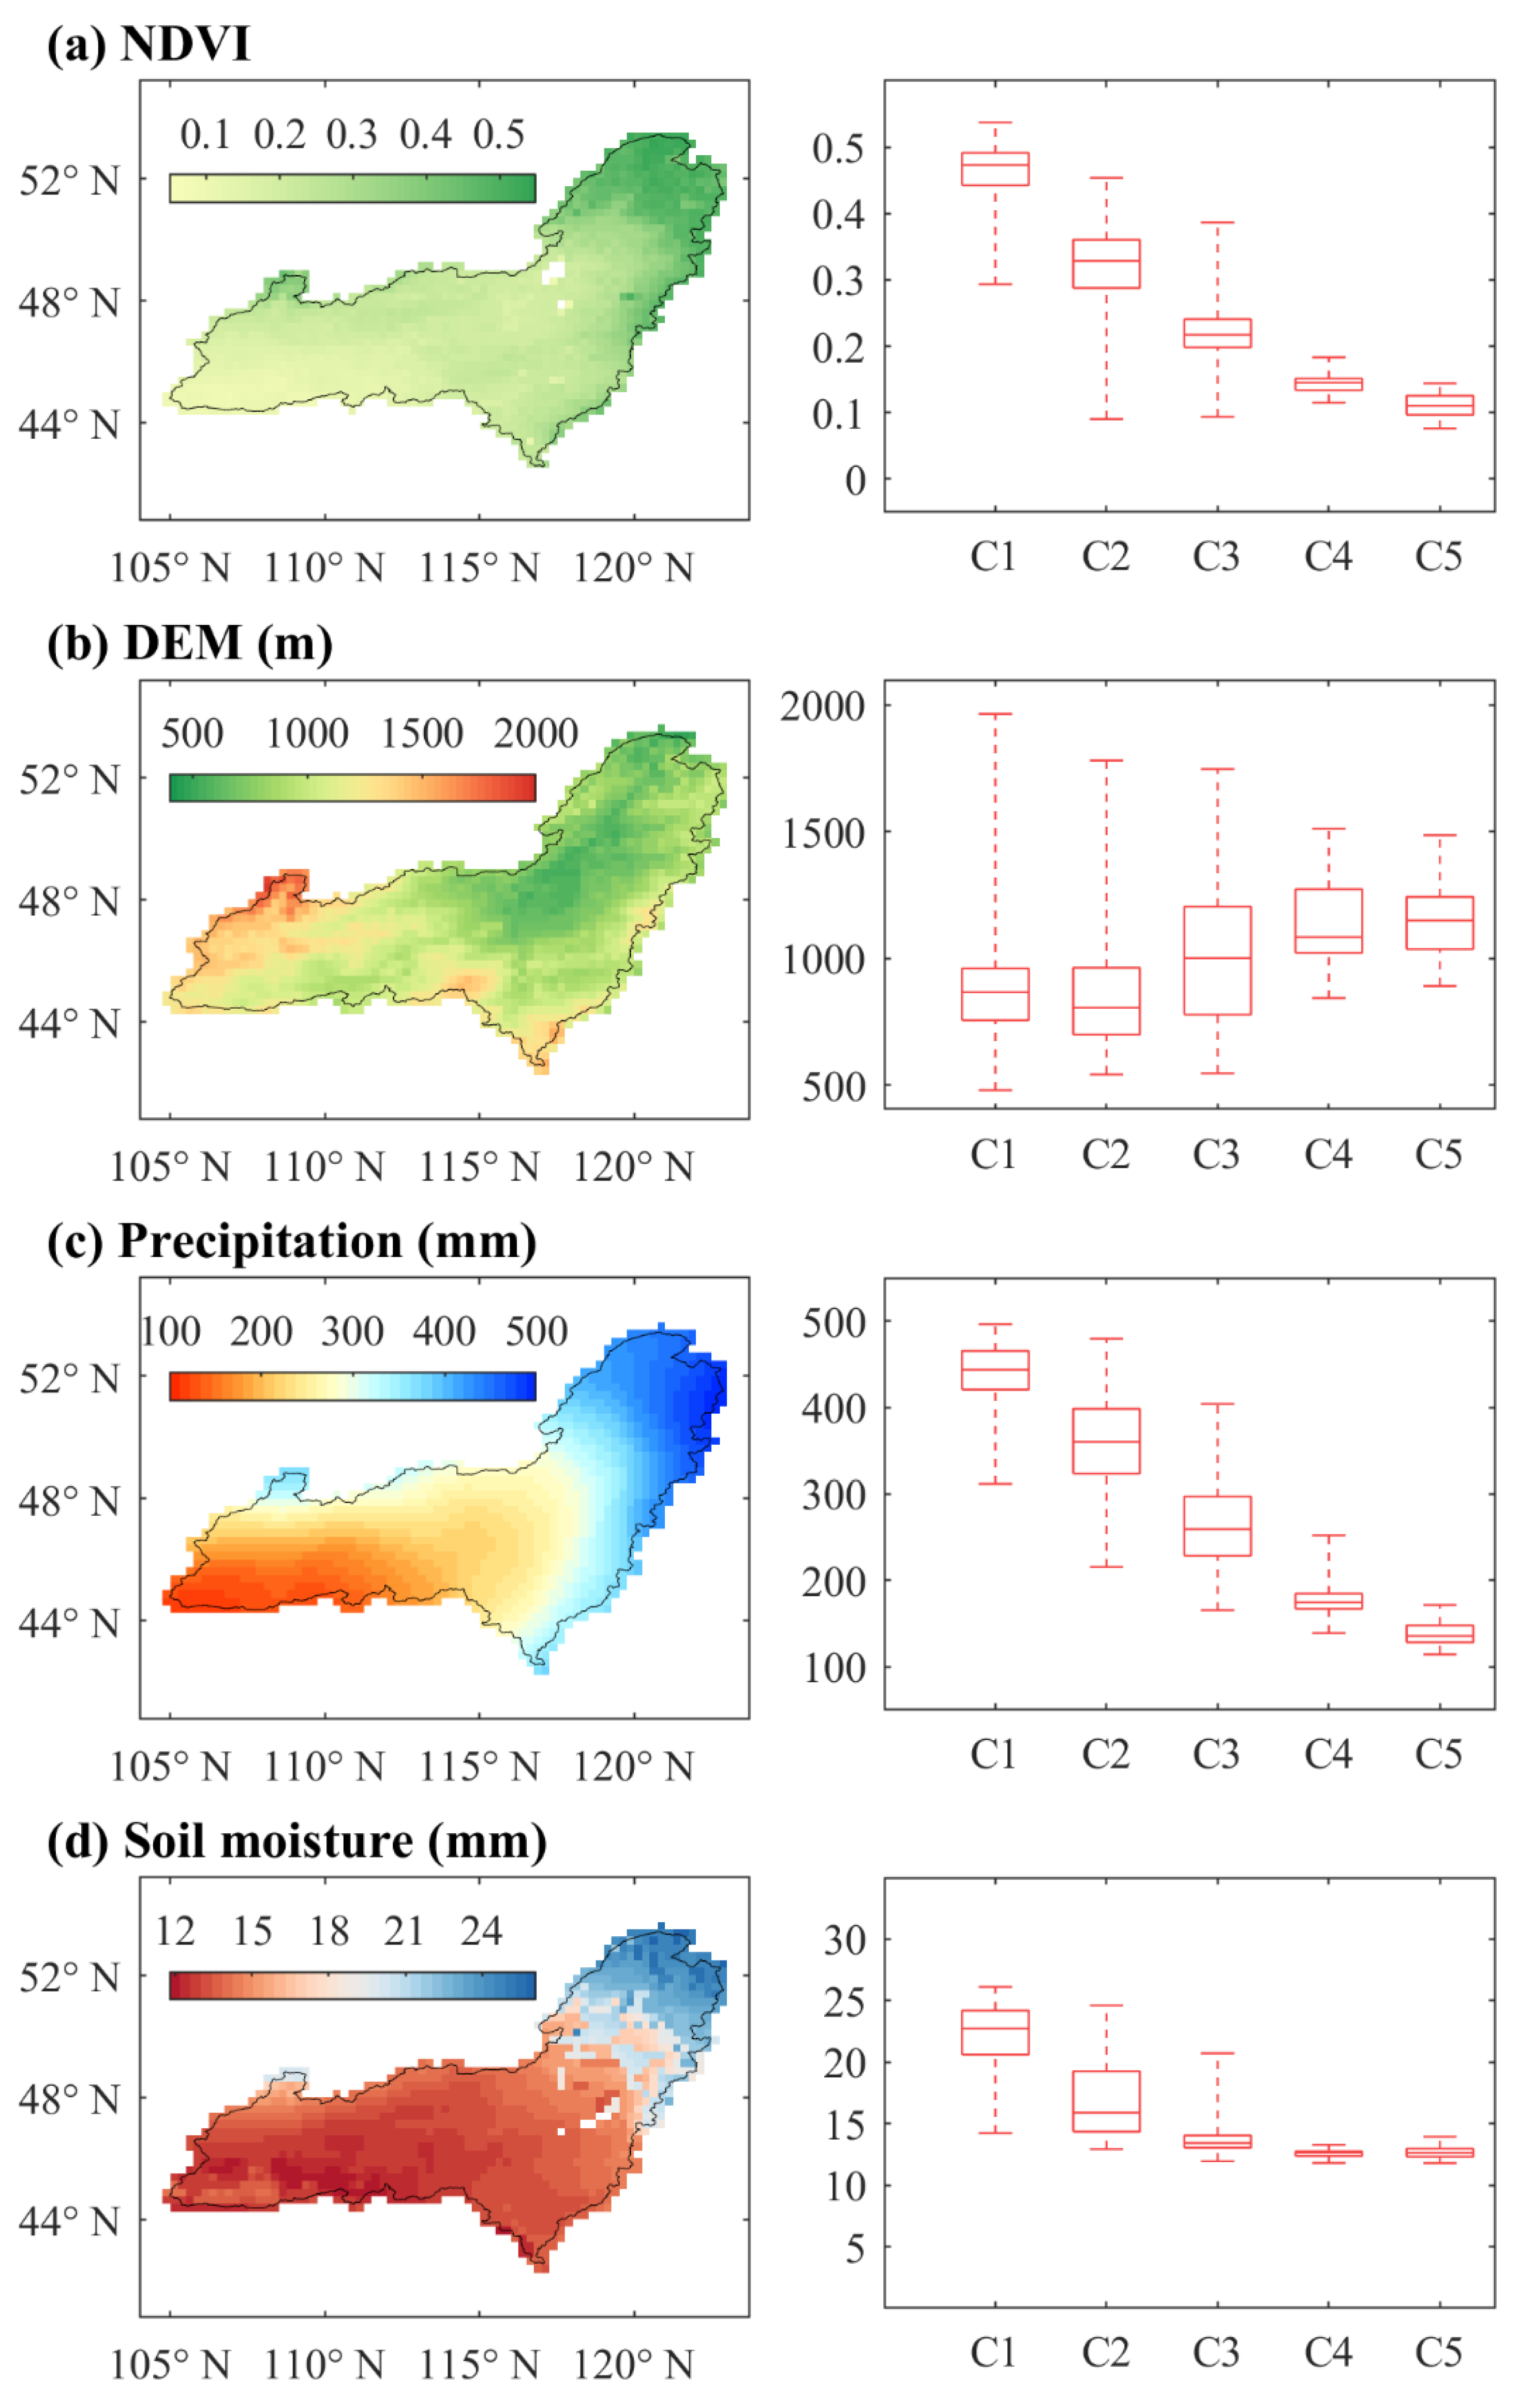
3.2. Meteorological and Underlying Surface Condition Analysis
3.3. Drought Characteristics Analysis
3.4. Drought Propagation from MD to AD
4. Discussion
4.1. The Response of AD to Climate and Vegetation
4.2. Impactors of Drought Propagation
4.3. Limitations and Prospects
5. Conclusions
Author Contributions
Funding
Data Availability Statement
Conflicts of Interest
Appendix A

References
- Mishra, A.K.; Singh, V.P. A review of drought concepts. J. Hydrol. 2010, 391, 202–216. [Google Scholar] [CrossRef]
- Ding, Y.; Gong, X.; Xing, Z.; Cai, H.; Zhou, Z.; Zhang, D.; Sun, P.; Shi, H. Attribution of meteorological, hydrological and agricultural drought propagation in different climatic regions of China. Agric. Water Manag. 2021, 255, 106996. [Google Scholar] [CrossRef]
- Song, X.; Gao, X.; Wu, P.; Zhao, X.; Zhang, W.; Zou, Y.; Siddique, K.H.M. Drought responses of profile plant-available water and fine-root distributions in apple (Malus pumila Mill.) orchards in a loessial, semi-arid, hilly area of China. Sci. Total Environ. 2020, 723, 137739. [Google Scholar] [CrossRef]
- Wang, L.; Yu, H.; Yang, M.; Yang, R.; Gao, R.; Wang, Y. A drought index: The standardized precipitation evapotranspiration runoff index. J. Hydrol. 2019, 571, 651–668. [Google Scholar] [CrossRef]
- Hao, Z.; Singh, V.P. Drought characterization from a multivariate perspective: A review. J. Hydrol. 2015, 527, 668–678. [Google Scholar] [CrossRef]
- Li, Y.; Lu, H.; Yang, K.; Wang, W.; Tang, Q.; Khem, S.; Yang, F.; Huang, Y. Meteorological and hydrological droughts in Mekong River Basin and surrounding areas under climate change. J. Hydrol. Reg. Stud. 2021, 36, 100873. [Google Scholar] [CrossRef]
- Li, L.; Song, X.; Xia, L.; Fu, N.; Feng, D.; Li, H.; Li, Y. Modelling the effects of climate change on transpiration and evaporation in natural and constructed grasslands in the semi-arid Loess Plateau, China. Agric. Ecosyst. Environ. 2020, 302, 107077. [Google Scholar] [CrossRef]
- Dai, A.; Trenberth, K.E.; Qian, T. A Global Dataset of Palmer Drought Severity Index for 1870–2002: Relationship with Soil Moisture and Effects of Surface Warming. J. Hydrometeorol. 2004, 5, 1117–1130. [Google Scholar] [CrossRef]
- Wilhite, D.A.; Glantz, M.H. Understanding: The Drought Phenomenon: The Role of Definitions. Water Int. 1985, 10, 111–120. [Google Scholar] [CrossRef]
- Gu, L.; Chen, J.; Yin, J.; Xu, C.-Y.; Chen, H. Drought hazard transferability from meteorological to hydrological propagation. J. Hydrol. 2020, 585, 124761. [Google Scholar] [CrossRef]
- Heim, R.R., Jr. A Review of Twentieth-Century Drought Indices Used in the United States. Bull. Am. Meteorol. Soc. 2002, 83, 1149–1166. [Google Scholar] [CrossRef]
- Huang, S.; Wang, L.; Wang, H.; Huang, Q.; Leng, G.; Fang, W.; Zhang, Y. Spatio-temporal characteristics of drought structure across China using an integrated drought index. Agric. Water Manag. 2019, 218, 182–192. [Google Scholar] [CrossRef]
- Zhang, Y.; Hao, Z.; Feng, S.; Zhang, X.; Xu, Y.; Hao, F. Agricultural drought prediction in China based on drought propagation and large-scale drivers. Agric. Water Manag. 2021, 255, 107028. [Google Scholar] [CrossRef]
- Martínez-Fernández, J.; González-Zamora, A.; Sánchez, N.; Gumuzzio, A.; Herrero-Jiménez, C.M. Satellite soil moisture for agricultural drought monitoring: Assessment of the SMOS derived Soil Water Deficit Index. Remote Sens. Environ. 2016, 177, 277–286. [Google Scholar] [CrossRef]
- Hao, Z.; Singh, V.P.; Xia, Y. Seasonal Drought Prediction: Advances, Challenges, and Future Prospects. Rev. Geophys. 2018, 56, 108–141. [Google Scholar] [CrossRef]
- Jiang, R.; Xie, J.; He, H.; Luo, J.; Zhu, J. Use of four drought indices for evaluating drought characteristics under climate change in Shaanxi, China: 1951–2012. Nat. Hazards 2015, 75, 2885–2903. [Google Scholar] [CrossRef]
- Muhammad, W.; Muhammad, S.; Khan, N.M.; Si, C. Hydrological drought indexing approach in response to climate and anthropogenic activities. Theor. Appl. Climatol. 2020, 141, 1401–1413. [Google Scholar] [CrossRef]
- Zheng, Y.; Zhang, X.; Yu, J.; Xu, Y.; Wang, Q.; Li, C.; Yao, X. Assessing the Joint Impact of Climatic Variables on Meteorological Drought Using Machine Learning. Front. Earth Sci. 2022, 10, 835142. [Google Scholar] [CrossRef]
- McKee, T.; Doesken, N.; Kliest, J. The relationship of drought frequency and duration to time scales. In Proceedings of the Eighth Conference on Applied Climatology, American Meteorological Society, Anaheim, CA, USA, 17–23 January 1993. [Google Scholar]
- Vicente-Serrano, S.M.; Beguería, S.; López-Moreno, J.I. A Multiscalar Drought Index Sensitive to Global Warming: The Standardized Precipitation Evapotranspiration Index. J. Clim. 2010, 23, 1696–1718. [Google Scholar] [CrossRef]
- Shukla, S.; Wood, A.W. Use of a standardized runoff index for characterizing hydrologic drought. Geophys. Res. Lett. 2008, 35, L02405. [Google Scholar] [CrossRef]
- Hao, Z.; AghaKouchak, A. A Nonparametric Multivariate Multi-Index Drought Monitoring Framework. J. Hydrometeorol. 2014, 15, 89–101. [Google Scholar] [CrossRef]
- Yang, P.; Xia, J.; Zhang, Y.; Zhan, C.; Cai, W.; Zhang, S.; Wang, W. Quantitative study on characteristics of hydrological drought in arid area of Northwest China under changing environment. J. Hydrol. 2021, 597, 126343. [Google Scholar] [CrossRef]
- Li, Q.; He, P.; He, Y.; Han, X.; Zeng, T.; Lu, G.; Wang, H. Investigation to the relation between meteorological drought and hydrological drought in the upper Shaying River Basin using wavelet analysis. Atmos. Res. 2020, 234, 104743. [Google Scholar] [CrossRef]
- Zhao, L.; Lyu, A.; Wu, J.; Hayes, M.; Tang, Z.; He, B.; Liu, J.; Liu, M. Impact of meteorological drought on streamflow drought in Jinghe River Basin of China. Chin. Geogr. Sci. 2014, 24, 694–705. [Google Scholar] [CrossRef]
- Hao, Z.; AghaKouchak, A.; Nakhjiri, N.; Farahmand, A. Global integrated drought monitoring and prediction system. Sci. Data 2014, 1, 140001. [Google Scholar] [CrossRef]
- Elfatih, A.B.E.; Yeh, P.J.-F. On the asymmetric response of aquifer water level to floods and droughts in Illinois. Water Resour. Res. 1999, 35, 1199–1217. [Google Scholar] [CrossRef]
- Apurv, T.; Sivapalan, M.; Cai, X. Understanding the Role of Climate Characteristics in Drought Propagation. Water Resour. Res. 2017, 53, 9304–9329. [Google Scholar] [CrossRef]
- Huang, S.; Li, P.; Huang, Q.; Leng, G.; Hou, B.; Ma, L. The propagation from meteorological to hydrological drought and its potential influence factors. J. Hydrol. 2017, 547, 184–195. [Google Scholar] [CrossRef]
- Zhang, T.; Su, X.; Zhang, G.; Wu, H.; Wang, G.; Chu, J. Evaluation of the impacts of human activities on propagation from meteorological drought to hydrological drought in the Weihe River Basin, China. Sci. Total Environ. 2022, 819, 153030. [Google Scholar] [CrossRef]
- Van Loon, A.F. Hydrological drought explained. WIREs Water 2015, 2, 359–392. [Google Scholar] [CrossRef]
- Zhang, X.; Hao, Z.; Singh, V.P.; Zhang, Y.; Feng, S.; Xu, Y.; Hao, F. Drought propagation under global warming: Characteristics, approaches, processes, and controlling factors. Sci. Total Environ. 2022, 838, 156021. [Google Scholar] [CrossRef]
- Van Lanen, H.A.J.; Wanders, N.; Tallaksen, L.M.; Van Loon, A.F. Hydrological drought across the world: Impact of climate and physical catchment structure. Hydrol. Earth Syst. Sci. 2013, 17, 1715–1732. [Google Scholar] [CrossRef]
- Huang, S.; Huang, Q.; Chang, J.; Leng, G.; Xing, L. The response of agricultural drought to meteorological drought and the influencing factors: A case study in the Wei River Basin, China. Agric. Water Manag. 2015, 159, 45–54. [Google Scholar] [CrossRef]
- Li, Y.; Huang, S.; Wang, H.; Zheng, X.; Huang, Q.; Deng, M.; Peng, J. High-resolution propagation time from meteorological to agricultural drought at multiple levels and spatiotemporal scales. Agric. Water Manag. 2022, 262, 107428. [Google Scholar] [CrossRef]
- Peña-Angulo, D.; Vicente-Serrano, S.M.; Domínguez-Castro, F.; Noguera, I.; Tomas-Burguera, M.; López-Moreno, J.I.; Lorenzo-Lacruz, J.; El Kenawy, A. Unravelling the role of vegetation on the different trends between climatic and hydrologic drought in headwater catchments of Spain. Anthropocene 2021, 36, 100309. [Google Scholar] [CrossRef]
- Wu, J.; Miao, C.; Zheng, H.; Duan, Q.; Lei, X.; Li, H. Meteorological and Hydrological Drought on the Loess Plateau, China: Evolutionary Characteristics, Impact, and Propagation. J. Geophys. Res. Atmos. 2018, 123, 11569–11584. [Google Scholar] [CrossRef]
- Tong, S.; Lai, Q.; Zhang, J.; Bao, Y.; Lusi, A.; Ma, Q.; Li, X.; Zhang, F. Spatiotemporal drought variability on the Mongolian Plateau from 1980–2014 based on the SPEI-PM, intensity analysis and Hurst exponent. Sci. Total Environ. 2018, 615, 1557–1565. [Google Scholar] [CrossRef]
- Narisu, N.; Bao, Y.; Yushan, B. Drought Temporal Variation Characteristics Analysis based on the PDSI Data in Mongolian Plateau. In Advances in Intelligent Systems Research, Proceedings of the 7th Annual Meeting of Risk Analysis Council of China Association for Disaster Prevention (RAC-2016), Changsha, China, 4–6 November 2016; Atlantis Press: Amsterdam, The Netherlands, 2016; pp. 844–849. [Google Scholar] [CrossRef]
- Cai, Z.; Jin, T.; Li, C.; Ofterdinger, U.; Zhang, S.; Ding, A.; Li, J. Is China’s fifth-largest inland lake to dry-up? Incorporated hydrological and satellite-based methods for forecasting Hulun lake water levels. Adv. Water Resour. 2016, 94, 185–199. [Google Scholar] [CrossRef]
- Cao, Y.; Fu, C.; Wang, X.; Dong, L.; Yao, S.; Xue, B.; Wu, H.; Wu, H. Decoding the dramatic hundred-year water level variations of a typical great lake in semi-arid region of northeastern Asia. Sci. Total Environ. 2021, 770, 145353. [Google Scholar] [CrossRef]
- Fan, C.; Song, C.; Liu, K.; Ke, L.; Xue, B.; Chen, T.; Fu, C.; Cheng, J. Century-Scale Reconstruction of Water Storage Changes of the Largest Lake in the Inner Mongolia Plateau Using a Machine Learning Approach. Water Resour. Res. 2021, 57, e2020WR028831. [Google Scholar] [CrossRef]
- Rodell, M.; Houser, P.R.; Jambor, U.; Gottschalck, J.; Mitchell, K.; Meng, C.-J.; Arsenault, K.; Cosgrove, B.; Radakovich, J.; Bosilovich, M.; et al. The Global Land Data Assimilation System. Bull. Am. Meteorol. Soc. 2004, 85, 381–394. [Google Scholar] [CrossRef]
- Min, X.; Shangguan, Y.; Huang, J.; Wang, H.; Shi, Z. Relative Strengths Recognition of Nine Mainstream Satellite-Based Soil Moisture Products at the Global Scale. Remote Sens. 2022, 14, 2739. [Google Scholar] [CrossRef]
- Ming, W.; Ji, X.; Zhang, M.; Li, Y.; Liu, C.; Wang, Y.; Li, J. A Hybrid Triple Collocation-Deep Learning Approach for Improving Soil Moisture Estimation from Satellite and Model-Based Data. Remote Sens. 2022, 14, 1744. [Google Scholar] [CrossRef]
- Zhu, Y.; Liu, Y.; Wang, W.; Singh, V.P.; Ren, L. A global perspective on the probability of propagation of drought: From meteorological to soil moisture. J. Hydrol. 2021, 603, 126907. [Google Scholar] [CrossRef]
- Chen, N.; Li, R.; Zhang, X.; Yang, C.; Wang, X.; Zeng, L.; Tang, S.; Wang, W.; Li, D.; Niyogi, D. Drought propagation in Northern China Plain: A comparative analysis of GLDAS and MERRA-2 datasets. J. Hydrol. 2020, 588, 125026. [Google Scholar] [CrossRef]
- Harris, I.; Osborn, T.J.; Jones, P.; Lister, D. Version 4 of the CRU TS monthly high-resolution gridded multivariate climate dataset. Sci. Data 2020, 7, 109. [Google Scholar] [CrossRef]
- Ding, Y.; Xu, J.; Wang, X.; Peng, X.; Cai, H. Spatial and temporal effects of drought on Chinese vegetation under different coverage levels. Sci. Total Environ. 2020, 716, 137166. [Google Scholar] [CrossRef]
- Choudhury, A.; Dutta, D.; Bera, D.; Kundu, A. Regional variation of drought parameters and long-term trends over India using standardized precipitation evapotranspiration index. J. Environ. Manag. 2021, 296, 113056. [Google Scholar] [CrossRef]
- Santos, J.F.; Pulido-Calvo, I.; Portela, M.M. Spatial and temporal variability of droughts in Portugal. Water Resour. Res. 2010, 46, W03503. [Google Scholar] [CrossRef]
- Yang, Y.; Gan, T.Y.; Tan, X. Spatiotemporal changes of drought characteristics and their dynamic drivers in Canada. Atmos. Res. 2020, 232, 104695. [Google Scholar] [CrossRef]
- Macqueen, J. Some methods for classification and analysis of multivariate observations. In Proceedings of the Fifth Berkeley Symposium on Mathematical Statistics and Probability: Weather Modification; University of California Press: Berkeley, CA, USA, 1967. [Google Scholar]
- Fooladi, M.; Golmohammadi, M.H.; Safavi, H.R.; Singh, V.P. Fusion-based framework for meteorological drought modeling using remotely sensed datasets under climate change scenarios: Resilience, vulnerability, and frequency analysis. J. Environ. Manag. 2021, 297, 113283. [Google Scholar] [CrossRef] [PubMed]
- Jing, J.; Ke, S.; Li, T.; Wang, T. Energy method of geophysical logging lithology based on K-means dynamic clustering analysis. Environ. Technol. Innov. 2021, 23, 101534. [Google Scholar] [CrossRef]
- Xu, H.; Ma, C.; Lian, J.; Xu, K.; Chaima, E. Urban flooding risk assessment based on an integrated k-means cluster algorithm and improved entropy weight method in the region of Haikou, China. J. Hydrol. 2018, 563, 975–986. [Google Scholar] [CrossRef]
- Xu, Y.; Zhang, X.; Hao, Z.; Singh, V.P.; Hao, F. Characterization of agricultural drought propagation over China based on bivariate probabilistic quantification. J. Hydrol. 2021, 598, 126194. [Google Scholar] [CrossRef]
- Angelidis, P.; Maris, F.; Kotsovinos, N.; Hrissanthou, V. Computation of Drought Index SPI with Alternative Distribution Functions. Water Resour. Manag. 2012, 26, 2453–2473. [Google Scholar] [CrossRef]
- Yevjevich, V. Objective Approach to Definitions and Investigations of Continental Hydrologic Droughts, An. Ph.D. Thesis, Colorado State University, Fort Collins, CO, USA, 1967. [Google Scholar]
- Yao, N.; Li, Y.; Lei, T.; Peng, L. Drought evolution, severity and trends in mainland China over 1961–2013. Sci. Total Environ. 2018, 616–617, 73–89. [Google Scholar] [CrossRef]
- Guo, H.; Bao, A.; Liu, T.; Jiapaer, G.; Ndayisaba, F.; Jiang, L.; Kurban, A.; Maeyer, P.D. Spatial and temporal characteristics of droughts in Central Asia during 1966–2015. Sci. Total Environ. 2018, 624, 1523–1538. [Google Scholar] [CrossRef] [PubMed]
- Zhai, J.; Mondal, S.K.; Fischer, T.; Wang, Y.; Su, B.; Huang, J.; Tao, H.; Wang, G.; Ullah, W.; Uddin, M.J. Future drought characteristics through a multi-model ensemble from CMIP6 over South Asia. Atmos. Res. 2020, 246, 105111. [Google Scholar] [CrossRef]
- Wang, T.; Tu, X.; Singh, V.P.; Chen, X.; Lin, K. Global data assessment and analysis of drought characteristics based on CMIP6. J. Hydrol. 2021, 596, 126091. [Google Scholar] [CrossRef]
- Van Loon, A.F.; Rangecroft, S.; Coxon, G.; Breña Naranjo, J.A.; Van Ogtrop, F.; Van Lanen, H.A.J. Using paired catchments to quantify the human influence on hydrological droughts. Hydrol. Earth Syst. Sci. 2019, 23, 1725–1739. [Google Scholar] [CrossRef]
- Xu, Y.; Zhang, X.; Wang, X.; Hao, Z.; Singh, V.P.; Hao, F. Propagation from meteorological drought to hydrological drought under the impact of human activities: A case study in northern China. J. Hydrol. 2019, 579, 124147. [Google Scholar] [CrossRef]
- Van Dijk, A.I.J.M.; Beck, H.E.; Crosbie, R.S.; Jeu, R.A.M.D.; Liu, Y.Y.; Podger, G.M.; Timbal, B.; Viney, N.R. The Millennium Drought in southeast Australia (2001–2009): Natural and human causes and implications for water resources, ecosystems, economy, and society. Water Resour. Res. 2013, 49, 1040–1057. [Google Scholar] [CrossRef]
- Yang, Y.; Shang, S.; Jiang, L. Remote sensing temporal and spatial patterns of evapotranspiration and the responses to water management in a large irrigation district of North China. Agric. For. Meteorol. 2012, 164, 112–122. [Google Scholar] [CrossRef]
- Wang, Y.; Fu, B.; Liu, Y.; Li, Y.; Feng, X.; Wang, S. Response of vegetation to drought in the Tibetan Plateau: Elevation differentiation and the dominant factors. Agric. For. Meteorol. 2021, 306, 108468. [Google Scholar] [CrossRef]
- Han, Z.; Huang, S.; Huang, Q.; Leng, G.; Wang, H.; Bai, Q.; Zhao, J.; Ma, L.; Wang, L.; Du, M. Propagation dynamics from meteorological to groundwater drought and their possible influence factors. J. Hydrol. 2019, 578, 124102. [Google Scholar] [CrossRef]
- Frauenfeld, O.W.; Zhang, T.; Barry, R.G.; Gilichinsky, D. Interdecadal changes in seasonal freeze and thaw depths in Russia. J. Geophys. Res. Atmos. 2004, 109, D05101. [Google Scholar] [CrossRef]
- Gevaert, A.I.; Veldkamp, T.I.E.; Ward, P.J. The effect of climate type on timescales of drought propagation in an ensemble of global hydrological models. Hydrol. Earth Syst. Sci. 2018, 22, 4649–4665. [Google Scholar] [CrossRef]
- Li, H.; Li, Y.; Shen, W.; Li, Y.; Lin, J.; Lu, X.; Xu, X.; Jiang, J. Elevation-Dependent Vegetation Greening of the Yarlung Zangbo River Basin in the Southern Tibetan Plateau, 1999–2013. Remote Sens. 2015, 7, 16672–16687. [Google Scholar] [CrossRef]
- Yao, J.; Yang, Q.; Mao, W.; Zhao, Y.; Xu, X. Precipitation trend–Elevation relationship in arid regions of the China. Glob. Planet. Chang. 2016, 143, 1–9. [Google Scholar] [CrossRef]
- Van Loon, A.F.; Tijdeman, E.; Wanders, N.; van Lanen, H.A.J.; Teuling, A.J.; Uijlenhoet, R. How climate seasonality modifies drought duration and deficit. J. Geophys. Res. Atmos. 2014, 119, 4640–4656. [Google Scholar] [CrossRef]
- Zhou, K.; Li, J.; Zhang, T.; Kang, A. The use of combined soil moisture data to characterize agricultural drought conditions and the relationship among different drought types in China. Agric. Water Manag. 2021, 243, 106479. [Google Scholar] [CrossRef]
- Teuling, A.J.; Van Loon, A.F.; Seneviratne, S.I.; Lehner, I.; Aubinet, M.; Heinesch, B.; Bernhofer, C.; Grünwald, T.; Prasse, H.; Spank, U. Evapotranspiration amplifies European summer drought. Geophys. Res. Lett. 2013, 40, 2071–2075. [Google Scholar] [CrossRef]
- Yinglan, A.; Wang, G.; Liu, T.; Shrestha, S.; Xue, B.; Tan, Z. Vertical variations of soil water and its controlling factors based on the structural equation model in a semi-arid grassland. Sci. Total Environ. 2019, 691, 1016–1026. [Google Scholar] [CrossRef]
- Liu, Q.; Zhang, J.; Zhang, H.; Yao, F.; Bai, Y.; Zhang, S.; Meng, X.; Liu, Q. Evaluating the performance of eight drought indices for capturing soil moisture dynamics in various vegetation regions over China. Sci. Total Environ. 2021, 789, 147803. [Google Scholar] [CrossRef]


Publisher’s Note: MDPI stays neutral with regard to jurisdictional claims in published maps and institutional affiliations. |
© 2022 by the authors. Licensee MDPI, Basel, Switzerland. This article is an open access article distributed under the terms and conditions of the Creative Commons Attribution (CC BY) license (https://creativecommons.org/licenses/by/4.0/).
Share and Cite
Li, C.; Zhang, X.; Yin, G.; Xu, Y.; Hao, F. Evaluation of Drought Propagation Characteristics and Influencing Factors in an Arid Region of Northeast Asia (ARNA). Remote Sens. 2022, 14, 3307. https://doi.org/10.3390/rs14143307
Li C, Zhang X, Yin G, Xu Y, Hao F. Evaluation of Drought Propagation Characteristics and Influencing Factors in an Arid Region of Northeast Asia (ARNA). Remote Sensing. 2022; 14(14):3307. https://doi.org/10.3390/rs14143307
Chicago/Turabian StyleLi, Chong, Xuan Zhang, Guodong Yin, Yang Xu, and Fanghua Hao. 2022. "Evaluation of Drought Propagation Characteristics and Influencing Factors in an Arid Region of Northeast Asia (ARNA)" Remote Sensing 14, no. 14: 3307. https://doi.org/10.3390/rs14143307
APA StyleLi, C., Zhang, X., Yin, G., Xu, Y., & Hao, F. (2022). Evaluation of Drought Propagation Characteristics and Influencing Factors in an Arid Region of Northeast Asia (ARNA). Remote Sensing, 14(14), 3307. https://doi.org/10.3390/rs14143307