Article

Evaluation of Global Fraction of Absorbed Photosynthetically Active Radiation (FAPAR) Products at 500 m Spatial Resolution

State Key Laboratory of Remote Sensing Science, Faculty of Geographical Science, Beijing Normal University, Beijing 100875, China
*
Author to whom correspondence should be addressed.
Remote Sens. 2022, 14(14), 3304; https://doi.org/10.3390/rs14143304
Submission received: 11 May 2022 / Revised: 23 June 2022 / Accepted: 6 July 2022 / Published: 8 July 2022

Abstract

:
The fraction of absorbed photosynthetically active radiation (FAPAR) is a key biophysical variable directly associated with the photosynthetic activity of plants. Several global FAPAR products with different spatial resolutions have been generated from remote sensing data, and much work has focused on validating them. However, those studies have primarily evaluated global FAPAR products at a spatial resolution of 1 km or more, whereas few studies have evaluated the global 500 m resolution FAPAR product distributed in recent years. Furthermore, there are a few FAPAR products, including black-sky, white-sky and blue-sky FAPAR datasets, and almost no studies have evaluated these products. In this article, three global FAPAR products at 500 m resolution, namely MODIS (only black-sky FAPAR), MUSES and EBR (black-sky, white-sky and blue-sky FAPAR) were compared to evaluate their temporal and spatial discrepancies and direct validation was conducted to compare these FAPAR products with the FAPAR values derived from the high-resolution reference maps from the Validation of Land European Remote Sensing Instrument (VALERI) and Implementing Multi-Scale Agricultural Indicators Exploiting Sentinels (IMAGINES) projects. The results showed that the MUSES FAPAR product exhibited the best spatial integrity, whereas the MODIS and EBR FAPAR products had many missing pixels in the equatorial rainforest regions and at high latitudes in the Northern Hemisphere. The MODIS, MUSES and EBR FAPAR products were generally consistent in their spatial patterns. However, a relatively large discrepancy among these FAPAR products was present in the equatorial rainforest regions and the middle and high latitude regions where the main vegetation type was forest. The differences between the black-sky and white-sky FAPAR datasets at the global scale were significant. In January, the MUSES and EBR black-sky FAPAR values were larger than their white-sky FAPAR values in the region north of 30° north latitude but they were smaller than their white-sky FAPAR values in the region south of 30° north latitude. In July, the MUSES and EBR black-sky FAPAR values were lower than their white-sky FAPAR values in the region north of 30° south latitude and they were larger than their white-sky FAPAR values in the region south of 30° south latitude. The temporal profiles of the MUSES FAPAR product were continuous and smooth, whereas those of the MODIS and EBR FAPAR products showed many fluctuations, particularly during the growing seasons. Direct validation indicated that the MUSES FAPAR product had the best accuracy (R2 = 0.6932, RMSE = 0.1495) compared to the MODIS FAPAR product (R2 = 0.6202, RMSE = 0.1710) and the EBR FAPAR product (R2 = 0.5746, RMSE = 0.1912).

1. Introduction

The fraction of absorbed photosynthetically active radiation (FAPAR) is defined as the fraction of solar radiation absorbed by living vegetation in the 400–700 nm spectral range [1]. Depending on the relative contributions of direct and diffuse irradiances, FAPAR estimates may be related to just direct solar radiation (black-sky FAPAR), diffuse radiation (white-sky FAPAR), or it may include both direct and diffuse radiation (blue-sky FAPAR). FAPAR is a key biophysical variable that is directly related to the productivity of living vegetation. It is considered one of the Essential Climate Variables (ECVs), playing a key role in the energy balance of ecosystems [2]. Additionally, FAPAR can be used as a critical input variable in many ecological and climate models [3,4,5,6] or as an additional constraint during assimilation [7]. Furthermore, the long time series of FAPAR products can be applied to monitor vegetation state, to detect drought events [8], in phenology [9,10] and so on.
The values of FAPAR can be derived from ground measurement and remote sensing data. The FAPAR values derived from ground measurements have some limitations, such as their short time scale and small spatial coverage. Remote sensing is the only feasible way to estimate the FAPAR values on a large scale over long periods of time. Many algorithms have been developed to retrieve FAPAR values from remote sensing data, and several global FAPAR products have been generated from remote sensing data acquired by the Moderate Resolution Imaging Spectroradiometer (MODIS) [11], the Medium Resolution Imaging Spectrometer (MERIS) [12], the Sea-viewing Wide Field-of-view Sensor (SeaWiFS) [13], the SPOT/VEGETATION [14,15], the Multi-angle Imaging SpectroRadiometer (MISR) [16] and the Earth Polychromatic Imaging Camera (EPIC) [17,18]. The spatial resolutions of these products are approximately 1 km or above. However, many applications, including crop yield estimations and ecological environment monitoring, require high-quality FAPAR products with higher spatial resolution. Therefore, new versions of these products have been produced in recent years, and their spatial resolution has been improved, such as the most recent (Collection 6) MODIS FAPAR product and the MUltiscale Satellite remotE Sensing (MUSES) FAPAR product. The MODIS and MUSES FAPAR products have achieved a spatial resolution of 500 m. Other research groups have published new global FAPAR products, such as the energy balance residual method-based (EBR) FAPAR product [19]. The EBR FAPAR product has also achieved a spatial resolution of 500 m. Furthermore, the MUSES and EBR FAPAR products provide black-sky, white-sky and blue-sky FAPAR datasets simultaneously.
Many studies have analyzed the discrepancies among the existing FAPAR products and evaluated their accuracy [20,21,22,23]. Xiao et al. [20] reported that the global land surface satellite (GLASS), MODIS, Geoland2/BioPar version 1 (GEOV1) and SeaWiFS FAPAR products exhibited similar spatial distribution patterns, but some discrepancies existed in equatorial forest regions and areas around 50–60°N latitude. Meanwhile, Xiao et al. [20] also reported that GLASS FAPAR values were more accurate than other products when compared with the FAPAR values derived from the ground measurements of the Validation of Land European Remote sensing Instrument (VALERI) project (http://w3.avignon.inra.fr/valeri/; accessed on 10 May 2022). A comparison among GEOV1, MODIS and CYCLOPES FAPAR products at 1 km spatial resolution was conducted by Camacho et al. [21] and it was demonstrated that the GEOV1 FAPAR product exhibited reasonable spatial distribution and good seasonality profiles, and it showed good performance for bare areas and dense forests. Tao et al. [22] compared five global FAPAR products: MODIS, MISR, MERIS, SeaWiFS and GEOV1. Their results showed that MODIS, MISR and GEOV1 were in great agreement with each other, as well as MERIS and SeaWiFS, but the difference between the two groups could be up to 0.1.
The studies described above focused on the evaluation of global FAPAR products. Other evaluations focused on FAPAR products in local areas [24,25,26,27,28]. For example, D’Odorico et al. [24] focused on comparisons of the JRC-TIP (Joint Research Centre Two-stream Inversion Package) FAPAR product derived from the MODIS [29], the European Space Agency (ESA) JRC FAPAR product obtained using the MEdium Resolution Imaging Spectrometer (MERIS) Global Vegetation Index (MGVI) [12] and the MODIS FAPAR product [30] over Europe, and they demonstrated that these FAPAR products had consistent spatial distributions overall but there were large differences in magnitude (as large as 0.1). Martínez et al. [26] assessed four FAPAR products derived from MODIS, SEVIRI and MERIS (TOAVEG and MGVI algorithms) over the Iberian Peninsula and found that the differences among these FAPAR products over this area were mainly in terms of temporal variations and absolute values. Additionally, some studies evaluated FAPAR products for different vegetation types [31,32]. Serbin et al. [32] evaluated the performance of the MODIS FAPAR product across forests with different ages in northern Manitoba, Canada and found that the MODIS FAPAR product overestimated FAPAR values for the youngest forests but underestimated FAPAR values for the oldest forests.
Existing studies have focused on evaluating FAPAR products at spatial resolutions of 1 km or more, whereas few studies have evaluated the latest global FAPAR products at a spatial resolution of 500 m. Furthermore, these existing studies evaluated FAPAR products without distinguishing the black-sky, white-sky and blue-sky FAPAR datasets. Currently, almost no research has examined the black-sky, white-sky or blue-sky FAPAR datasets separately and described the differences among them at the global scale to enable effective application.
In this study, the black-sky, white-sky and blue-sky FAPAR datasets from MUSES and EBR products were compared to assess their temporal and spatial differences. The black-sky dataset from the latest MODIS FAPAR product was also examined for comparison. Furthermore, the three black-sky FAPAR datasets were compared with the FAPAR values derived from ground measurements.

2. Materials and Methods

2.1. Data

2.1.1. MUSES FAPAR Product

Xiao et al. [20] developed a method to estimate blue-sky FAPAR values using the transmittance of photosynthetically active radiation (PAR) through the entire canopy, which can be calculated from the corresponding canopy leaf area index (LAI) values and other information. The method is efficient and was used to generate the GLASS FAPAR product at the spatial resolution of 0.05° and 1 km from the GLASS LAI product to ensure physical consistency between LAI and FAPAR retrievals.
Similar to the estimate of the blue-sky FAPAR values, the black-sky and white-sky FAPAR values can be calculated according to the transmittance of direct and diffuse PAR through the entire canopy, respectively. Therefore, the method developed by Xiao et al. [20] was refined to generate a new version of the global FAPAR product (denoted by MUSES for clarification in this study). The MUSES FAPAR product includes three datasets: black-sky FAPAR, white-sky FAPAR and blue-sky FAPAR. The MUSES FAPAR product has a spatial resolution of 500 m and a temporal resolution of 8 days. It is provided in a sinusoidal projection and spans 2000 to 2019. The performance of the MUSES FAPAR product was evaluated in this study.

2.1.2. EBR FAPAR Product

Liu et al. [19] developed an algorithm to generate global black-sky, white-sky and blue-sky FAPAR products. Firstly, based on a non-linear spectral mixture model (NSM), the snow-free soil albedo was derived using the surface visible (VIS) albedo (MCD43A3), LAI (MCD15A2H) and clumping index (CI) [33] products. Secondly, the black-sky and white-sky FAPAR were retrieved based on the energy balance residual (EBR) principle with the help of data including MODIS surface VIS albedo (MCD43A3), LAI (MCD15A2H) and CI products, as well as the above snow-free soil albedo data. The EBR FAPAR product is provided in a sinusoidal projection at a spatial resolution of 500 m and a temporal resolution of 8 days.

2.1.3. MODIS FAPAR Product

Since the MODIS FAPAR product was produced in 2000, the MODIS science team has been updating the product. The latest version (Collection 6) of the MODIS FAPAR product was released to the public in August of 2015 [34]. The Collection 6 MODIS FAPAR product is provided in a sinusoidal projection. It has two datasets at a spatial resolution of 500 m: MCD15A2H and MCD15A3H. The MCD15A2H FAPAR product has a temporal resolution of 8 days, whereas the MCD15A3H FAPAR product has a temporal resolution of 4 days. In this study, the MCD15A2H FAPAR product was used for evaluation.
The MODIS FAPAR retrieval algorithm consists of a main algorithm and a backup algorithm [30]. The main algorithm is based on look-up tables simulated through a three-dimensional radiative transfer model. The backup algorithm estimates the FAPAR values on the basis of biome-specific FAPAR-NDVI relationships. When the main algorithm fails, the backup algorithm is used to estimate FAPAR values. The quality of the FAPAR values derived by the backup algorithm is poor due to residual clouds and poor atmosphere correction [35]. Consequently, only the MODIS FAPAR values retrieved by the main algorithm were used in the performance evaluation, except the spatial integrity comparison for the MODIS FAPAR product in our study. Because the inversion algorithm considers only direct solar radiation, the MODIS FAPAR product corresponds to the instantaneous black-sky FAPAR at the time of the Terra overpass (10:30 AM).

2.1.4. High-Resolution FAPAR Reference Maps

To validate the biophysical parameter products derived from remote sensing data, such as LAI and FAPAR products, the VALERI project during 2001–2005 (http://w3.avignon.inra.fr/valeri; accessed on 10 May 2022) and the Implementing Multi-Scale Agricultural Indicators Exploiting Sentinels (IMAGINES) project during 2013–2016 (http://fp7-imagines.eu/; accessed on 10 May 2022) conducted field experiments to collect digital hemispherical photos (DHP) at several sites with different biome types. The DHPs were processed with CanEye software to derive FAPAR ground measurements. Then, an empirical transfer function between high spatial resolution reflectance data and FAPAR ground measurements was constructed to derive high-resolution FAPAR reference maps for each site.
Over the VALERI sites, the FAPAR values correspond to the instantaneous black-sky FAPAR at 10:00 AM. Over the IMAGINES sites, only part of the sites’ FAPAR corresponded to the instantaneous black-sky values at 10:00 AM, whereas the FAPAR values over other sites corresponded to the daily integrated black-sky FAPAR. Considering that instantaneous FAPAR at the time of the satellite overpass (around 10:00 AM) is a good approximation of daily integrated black-sky FAPAR [21,36], the instantaneous and daily integrated black-sky FAPAR values of high-resolution reference maps at the VALERI and IMAGINES sites were chosen to evaluate the MODIS, MUSES and EBR black-sky FAPAR products. Consequently, 58 high-resolution FAPAR reference maps over 36 VALERI and IMAGINES sites were used in this study.
For the VALERI sites, the high resolution FAPAR reference maps are over a 3 × 3 km region, and the high resolution FAPAR reference maps at all VALERI sites except for the Fundulea and Gnangara sites have a spatial resolution of 20 m. The spatial resolution of the FAPAR reference map for the Fundulea site is 10 m, whereas the spatial resolution of the FAPAR reference map for the Gnangara site is 30 m. For the IMAGINES sites, the high resolution FAPAR reference maps are over a 5 × 5 km region, and the high resolution FAPAR reference maps at all IMAGINES sites except for the SouthWest_1 (DOY = 191, 207), Mayo_Alfalfa and Mayo_Shurb sites have a spatial resolution of 30 m. The high resolution FAPAR reference maps for the SouthWest_1 (DOY = 191, 207), Mayo_Alfalfa and Mayo_Shurb sites have a spatial resolution of 10 m.
These high-resolution FAPAR reference maps were aggregated to the same spatial resolution as that of the FAPAR products, approximatively 500 m. A summary with main characteristics of the selected sites and their mean FAPAR values of a 500 × 500 m region can be found in Table 1.

2.2. Methods

2.2.1. Spatial and Temporal Consistency Analysis

For comparison of the spatial consistencies, the MODIS, MUSES and EBR FAPAR products were aggregated to the monthly products through computing the average of the high quality FAPAR values in a month. The average was calculated only if there were 3 or 4 high quality FAPAR values in the month. Then, global maps of the MODIS, MUSES and EBR FAPAR products in January and July of 2016 were produced in this study. For comparison of the differences between the black-sky and white-sky FAPAR datasets of the MUSES and EBR products, their global difference maps in January and July of 2016 were also constructed. The histograms of the three FAPAR products in July of 2016 in the northern and southern hemispheres were calculated to analyze the distribution of each product. Additionally, the histogram of these FAPAR products for each vegetation type according to the MODIS land cover type product (MCD12Q1) in the year 2016 were also calculated. Only the pixels where all the products provided FAPAR values were used to create the histograms.
For evaluation of the temporal consistencies, the time series curves of the three FAPAR products from 2002 to 2017 at seven sites (Table 1) with different biome types were compared. The black-sky FAPAR profiles were also compared with the mean values derived from the high-resolution FAPAR reference maps to analyze the precision of each product in the time series.

2.2.2. Direct Validation

Direct validation refers to comparing the MODIS, MUSES and EBR FAPAR values with FAPAR values derived from the high-resolution FAPAR reference maps. Because of the different spatial resolutions between them, the method proposed by Morisette et al. [37] was adopted to validate the MODIS, MUSES and EBR FAPAR products in this study. The high-resolution FAPAR reference maps were re-projected onto the sinusoidal projection, which was used by the FAPAR products. Meanwhile, the high-resolution FAPAR reference maps were aggregated to the same spatial resolution as the FAPAR products by the spatial-average method. Additionally, owing to the differences in time between the FAPAR products and ground measurements, the FAPAR products adjacent to the time of ground measurements were processed by the linear interpolation method to obtain the FAPAR values with the same time as the ground measurements in this study. The performances of the three black-sky FAPAR products were quantified with coefficient of determination (R2) and root mean square error (RMSE).

3. Results

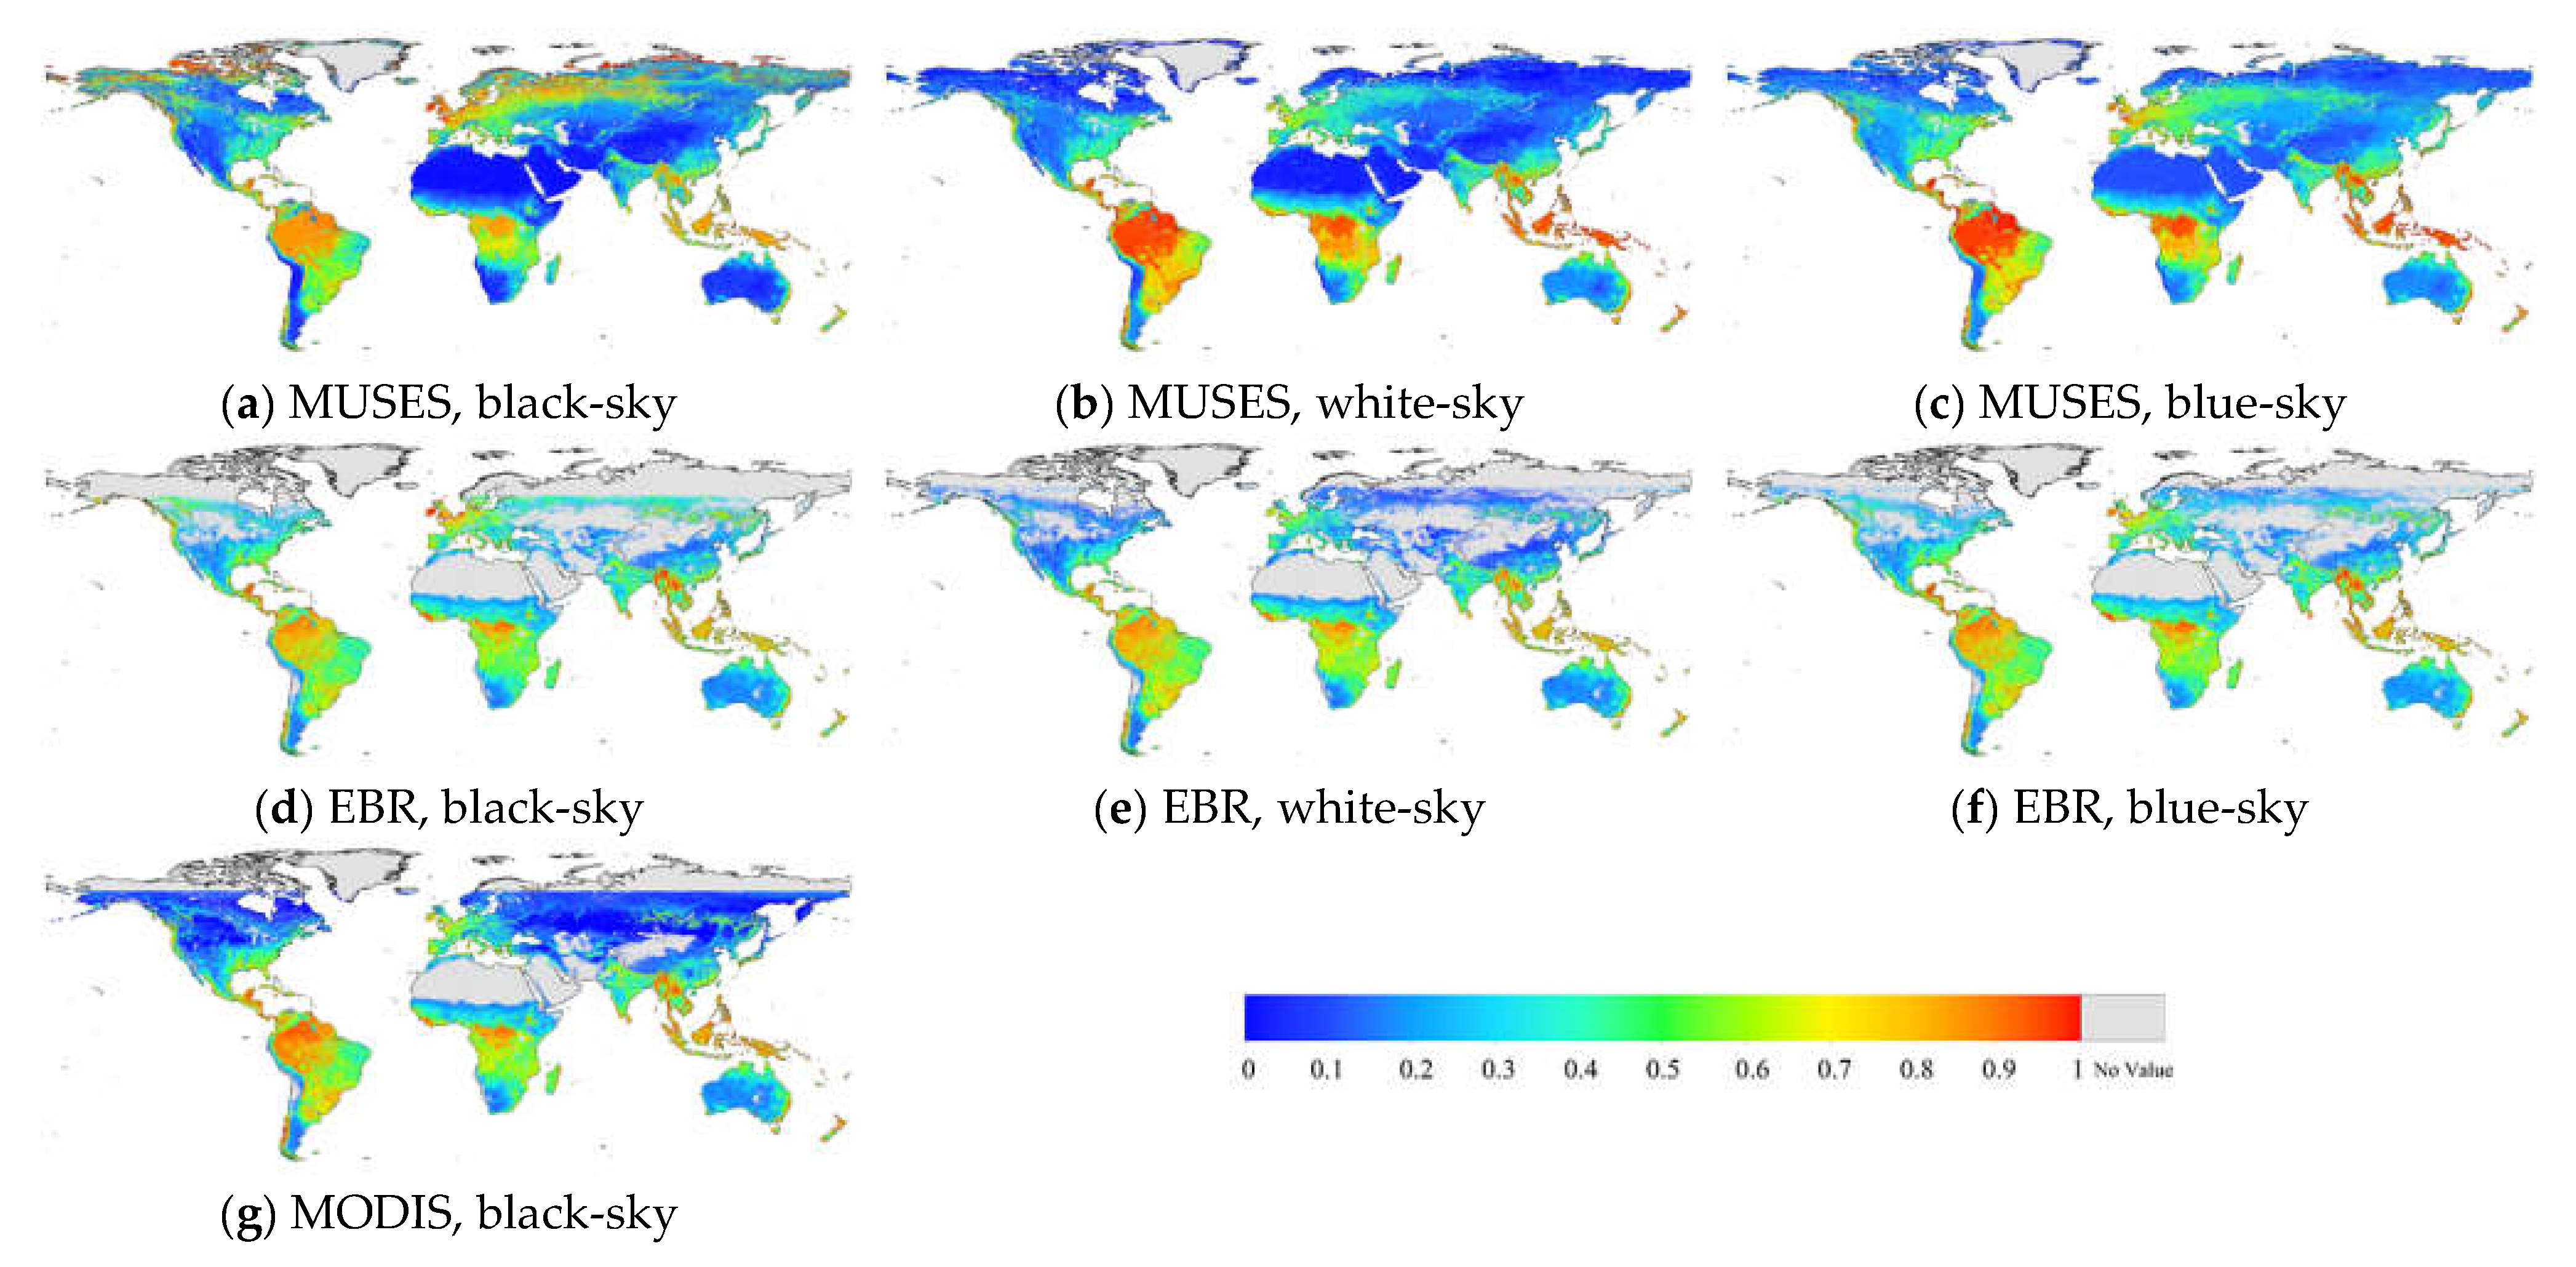
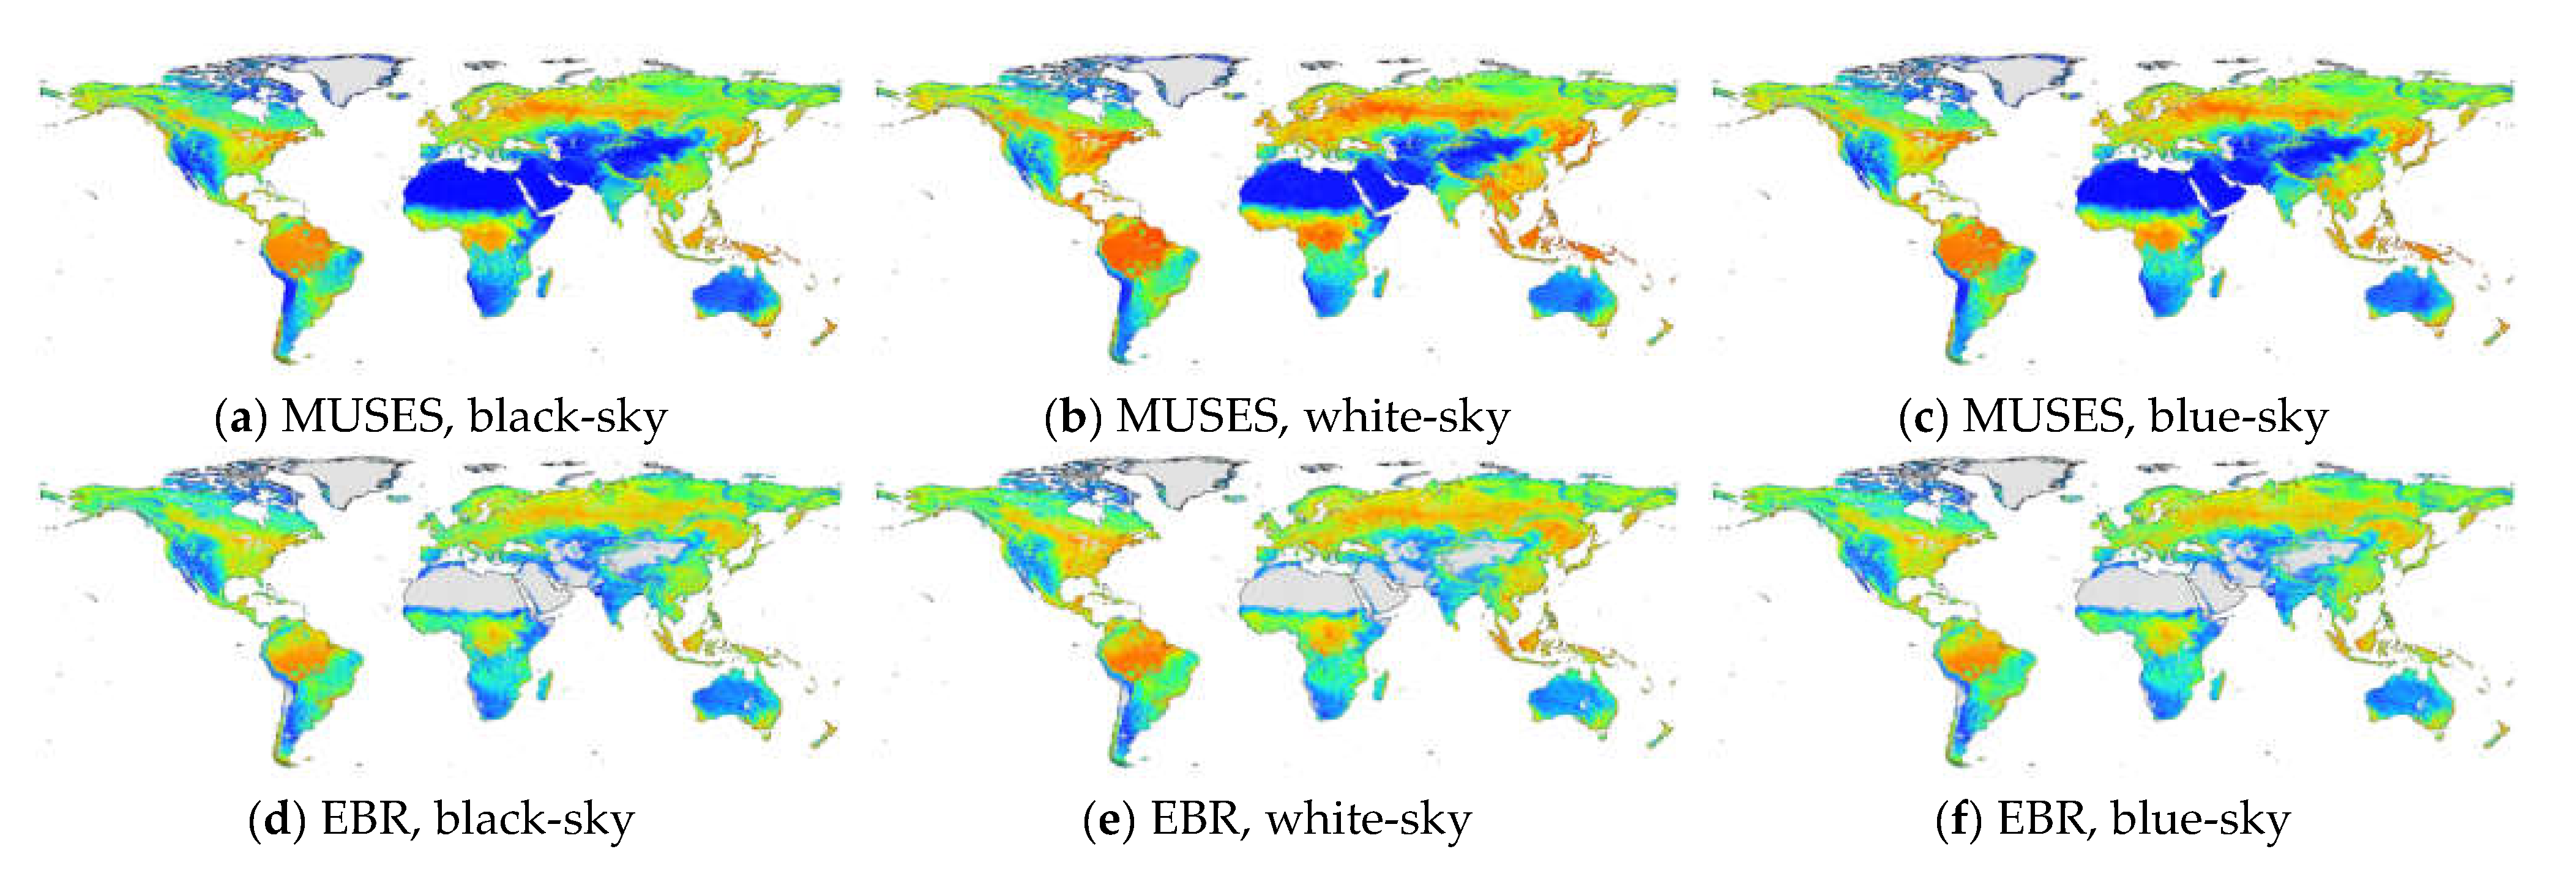
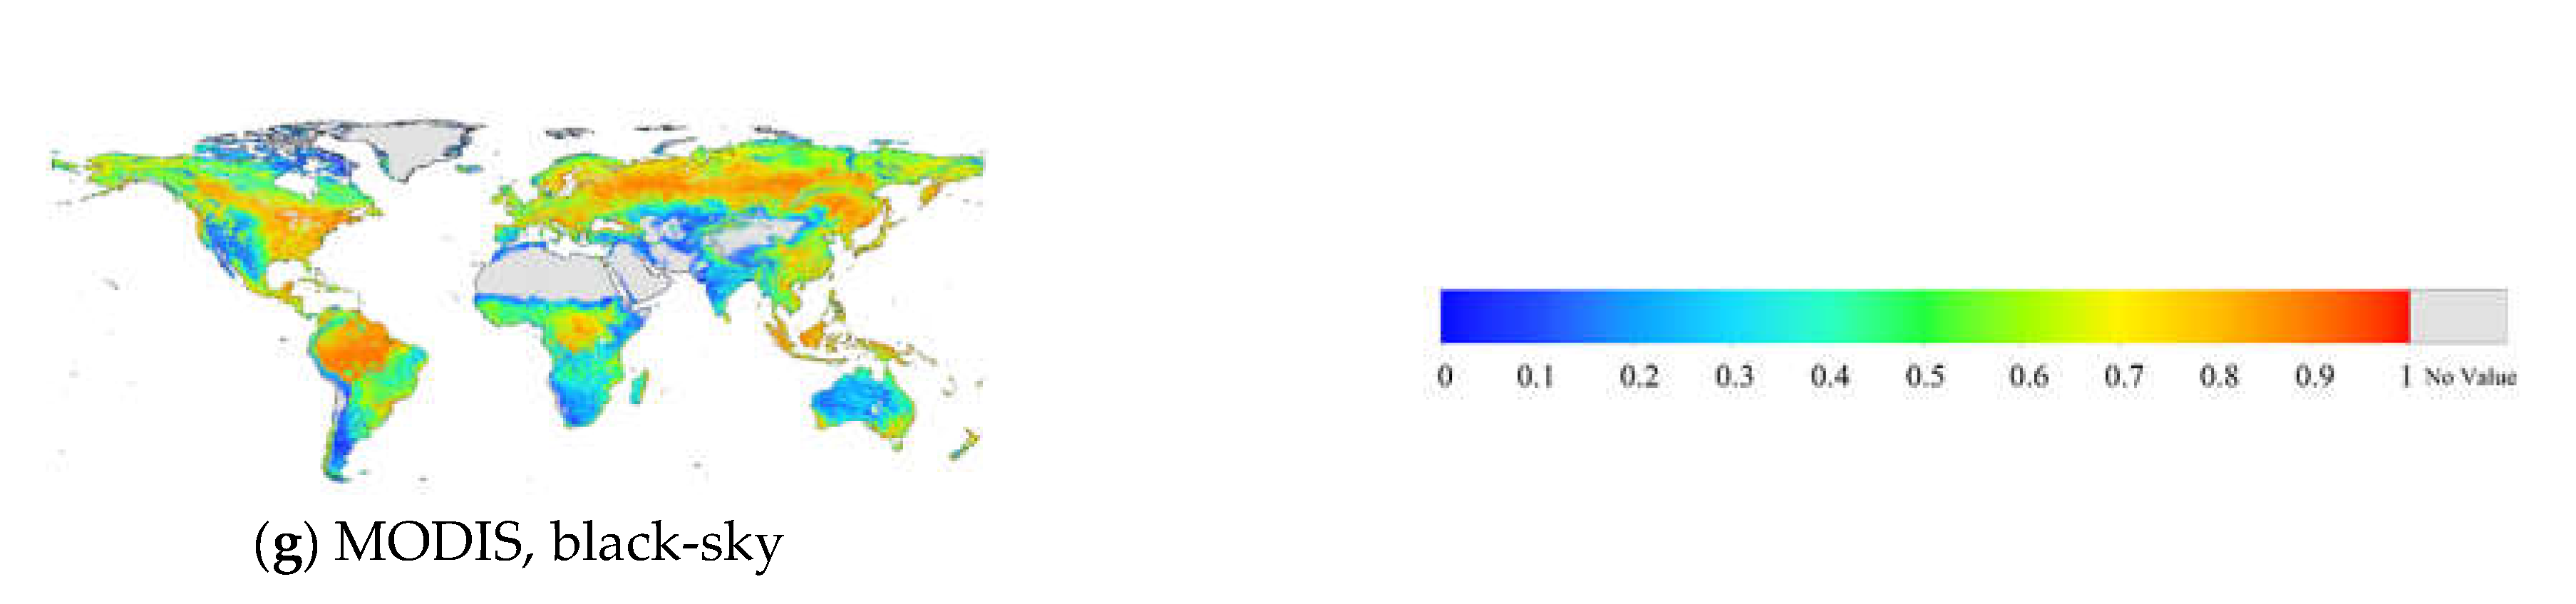
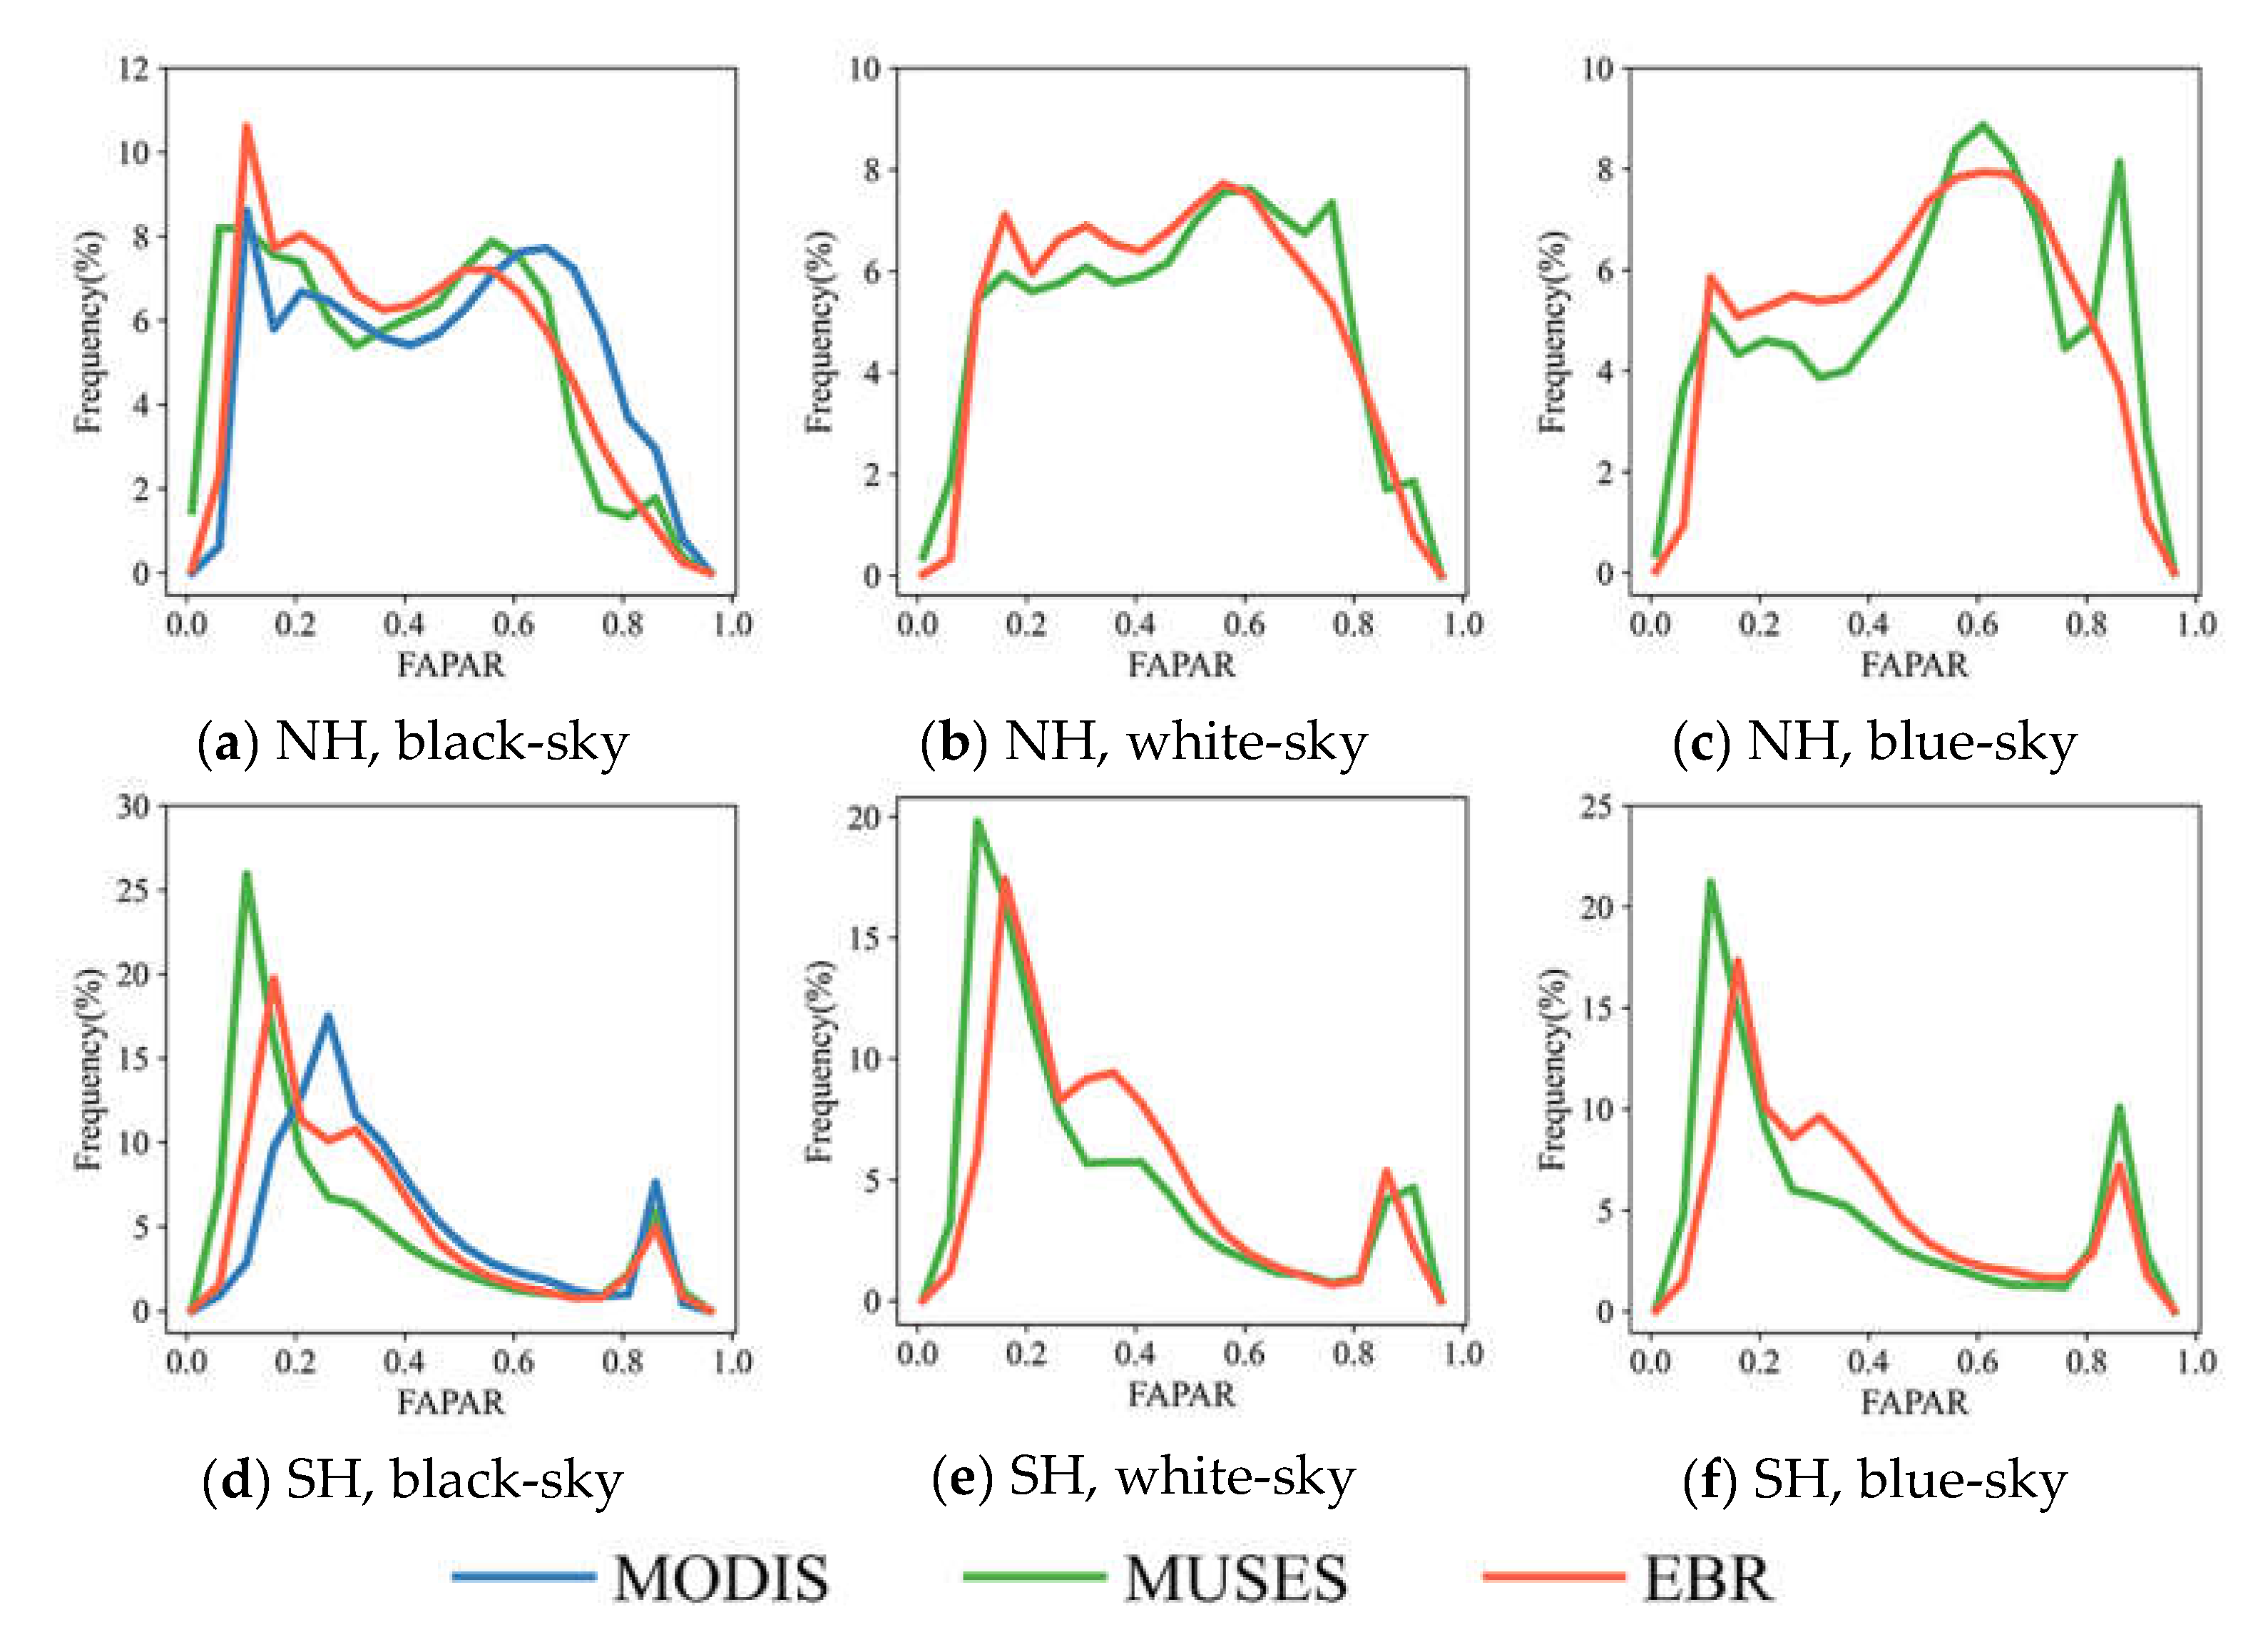
3.1. Spatial Consistency

The global maps of the MUSES, EBR and MODIS FAPAR products in January and July of 2016 are shown in Figure 1 and Figure 2, respectively. Areas masked in gray correspond to pixels with missing FAPAR values. Because of clouds, the MODIS and EBR FAPAR products have many pixels with missing FAPAR values. In January, there are some pixels with missing values in rainforest regions and high latitude regions of the northern hemisphere for the MODIS and EBR FAPAR products, but the EBR FAPAR product has more pixels with missing values. The rate of pixels with missing FAPAR values for the EBR FAPAR product is nearly 50% in these regions. In July, the pixels with missing values for the MODIS and EBR FAPAR products are concentrated in rainforest areas. However, there are few pixels with missing values for the MUSES FAPAR products, because their retrieval algorithm used the spatially and temporally complete LAI product [20].
Figure 1 and Figure 2 demonstrate similar spatial patterns among the MUSES, EBR and MODIS FAPAR products. In January, higher FAPAR values are found in the equatorial forest areas, whereas lower FAPAR values are found in the middle and high latitudes of the northern hemisphere. In July, higher values are distributed in equatorial forest regions and in the regions around 50–60°N, whereas lower FAPAR values are distributed in sparsely vegetated areas.
However, discrepancies among these FAPAR products are evident in some areas. In January, the MODIS black-sky FAPAR product exhibits significantly higher values (approximately 0.9) than the MUSES and EBR black-sky FAPAR products in the rainforest region near the equator, and the EBR black-sky FAPAR values (approximately 0.75) are slightly lower than the MUSES black-sky FAPAR values (approximately 0.8) in this region (Figure 1). In the regions around 60°N, the MUSES FAPAR product has the largest black-sky FAPAR values, followed by the EBR FAPAR product, and the MODIS FAPAR product has the smallest black-sky FAPAR values (between 0 and 0.1). In Australia, the MUSES black-sky FAPAR values (approximately 0.1) are lower than the MODIS and EBR black-sky FAPAR values (approximately 0.2). For white-sky FAPAR products in Figure 1, the MUSES white-sky FAPAR values (approximately 0.9) are higher than the EBR white-sky FAPAR values (approximately 0.8) in tropical rainforests near the equator. A similar distribution is observed in the MUSES and EBR blue-sky FAPAR products.
In July, the MODIS black-sky FAPAR values are generally the largest, followed by the MUSES black-sky FAPAR values, and the EBR black-sky FAPAR values are the smallest over the regions around 50–60°N (Figure 2). The MODIS and MUSES black-sky FAPAR values (approximately 0.8) are larger than the EBR black-sky FAPAR values (approximately 0.7) in tropical rainforests near the equator. However, in Australia, the MODIS and EBR black-sky FAPAR values (approximately 0.3) are larger than the MUSES black-sky FAPAR values (approximately 0.1). For the white-sky and blue-sky FAPAR products, the MUSES white-sky and blue-sky FAPAR values are significantly higher than the corresponding EBR white-sky and blue-sky FAPAR values in tropical rainforests near the equator and in middle and high latitudes of the northern hemisphere.
For comparison of the differences in the black-sky and white-sky products, the global maps of differences between the black-sky and white-sky FAPAR values of the MUSES and EBR products are shown in Figure 3. Discrepancies between the black-sky and white-sky FAPAR values for the MUSES and EBR products are evident. In January, the MUSES black-sky FAPAR values are larger than the MUSES white-sky FAPAR values in the region north of 30° north latitude (Figure 3a). The higher the latitude, the larger the differences in the FAPAR values. In high latitude regions, the differences could be as much as 0.5. However, the MUSES black-sky FAPAR values are smaller than the MUSES white-sky FAPAR values in the region south of 30° north latitude. The differences are generally as much as 0.25, except in the equatorial rainforest region and Australia, where the differences are generally 0.1. A similar distribution of the differences between the EBR black-sky and white-sky FAPAR values is observed in Figure 3c. However, the differences for the EBR FAPAR product (approximately 0.1 for most pixels) are lower than those for the MUSES FAPAR product. In July, the MUSES and EBR black-sky FAPAR values are lower compared with their white-sky values in the region north of 30° south latitude and are larger than their white-sky FAPAR values in the region south of 30° south latitude (Figure 3b,d). However, the differences between the MUSES black-sky and white-sky values (approximately 0.2) are slightly larger than those between the EBR black-sky and white-sky values (approximately 0.1).
Figure 4 shows histograms of the MODIS, MUSES and EBR FAPAR products in July of 2016 in the northern and southern hemispheres. The histogram distributions of the MODIS, MUSES and EBR black-sky FAPAR products in the northern hemisphere are similar (Figure 4a). Most FAPAR values of three products are between 0.1 and 0.7. The histogram distributions of the three products show two peaks in the southern hemisphere (Figure 4d). The first peak position of the MODIS FAPAR product is around 0.3, whereas those of the MUSES and EBR FAPAR products are around 0.1 and 0.2, respectively. The second peak positions for the three products are all around 0.85. However, the frequency of the MODIS FAPAR product at this peak is higher than those of the MUSES and EBR FAPAR products. Similar histogram distributions of the MUSES and EBR white-sky FAPAR products in the northern hemisphere are shown in Figure 4b. However, the frequencies of the MUSES white-sky FAPAR values between 0.1 and 0.6 are lower than those of the EBR white-sky FAPAR values, and frequencies of the MUSES white-sky FAPAR values between 0.7 and 0.8 are larger than those of the EBR white-sky FAPAR values. Figure 4c shows that the histograms of the MUSES and EBR blue-sky FAPAR values in the northern hemisphere are slightly different. The frequency of the MUSES blue-sky FAPAR product is significantly higher than that of the EBR blue-sky FAPAR product when the FAPAR value is 0.9. In contrast, the frequencies of the EBR blue-sky FAPAR values between 0.1 and 0.5 are higher than those of the MUSES blue-sky FAPAR values. In the southern hemisphere, the white-sky and blue-sky FAPAR values of the MUSES and EBR products have histogram distributions similar to the MUSES and EBR black-sky FAPAR values. The histograms of the white-sky and blue-sky FAPAR values of the MUSES and EBR products have two peaks in almost the same positions, although the frequencies of these FAPAR values are different.
Figure 5 shows frequency histograms of the MODIS, MUSES and EBR products for different vegetation types in July 2016. The frequency histograms of the MODIS, MUSES and EBR products for grasses/cereal crops are shown in Figure 5a. It is observed that the histograms of the MODIS, MUSES and EBR black-sky FAPAR values show good agreement. The histograms of the MODIS, MUSES and EBR black-sky FAPAR values have nearly the same peak positions (approximately 0.1), but the frequency of the MUSES black-sky FAPAR values at the peak position is slightly higher than those of the EBR and MODIS black-sky values. Furthermore, the frequency distributions of the MUSES white-sky and blue-sky FAPAR values also show good agreement with those of the EBR white-sky and blue-sky values.
For broadleaf crops, most black-sky, white-sky and blue-sky FAPAR values are between 0.1 and 0.8. The histograms of the MUSES black-sky, white-sky and blue-sky FAPAR values are bimodal, but the histograms of the black-sky, white-sky and blue-sky FAPAR values for the MODIS and EBR products have only one peak.
For shrubs, all histograms of the black-sky, white-sky and blue-sky FAPAR values for the MODIS, MUSES and EBR products have two peaks. The frequency of the MUSES black-sky FAPAR values at the first peak position (around 0.1) is higher than those of the EBR and MODIS black-sky FAPAR values. Similarly, the frequencies of the MUSES white-sky and blue-sky FAPAR values at the first peak position are also higher than those of the EBR white-sky and blue-sky FAPAR values. However, the frequencies of the black-sky values for the MODIS, MUSES and EBR products and the frequencies of the white-sky and blue-sky FAPAR values for the MUSES and EBR products at the second peak positions (around 0.6) are similar.
For the savannas biome type, the frequency distributions of the black-sky, white-sky and blue-sky FAPAR values for the MUSES, MODIS and EBR products have similar shapes with one peak. The peak position of the MUSES black-sky FAPAR values (around 0.6) is smaller than that of the MODIS black-sky FAPAR values (around 0.7) but larger than that of the EBR black-sky FAPAR values (around 0.5). The peak positions of the MUSES white-sky and blue-sky FAPAR values are larger than those of the EBR white-sky and blue-sky FAPAR values. Moreover, the frequencies of the MUSES white-sky and blue-sky FAPAR values at the peak position are higher than those of the corresponding EBR white-sky and blue-sky FAPAR values. Therefore, the MUSES white-sky and blue-sky FAPAR values are generally larger than the corresponding EBR white-sky and blue-sky FAPAR values for the savannas biome type.
For evergreen broadleaf forests, the MUSES, MODIS and EBR FAPAR products have similar frequency distribution histograms with narrow peaks. The MUSES black-sky, white-sky and blue-sky FAPAR values have the same peak positions (approximately 0.9) as the corresponding EBR black-sky, white-sky and blue-sky FAPAR values. However, the peak position of the MODIS black-sky FAPAR values (approximately 0.9) is higher than those of the MUSES and EBR black-sky values (approximately 0.85). The frequencies of the MODIS and MUSES black-sky FAPAR values at the peak positions are significantly higher than those of the EBR black-sky FAPAR values, and the frequencies of the MUSES white-sky and blue-sky FAPAR values at the peak positions are also significantly higher than the corresponding frequencies of the EBR white-sky and blue-sky FAPAR values. Thus, the MODIS and MUSES black-sky FAPAR values are generally larger than the EBR black-sky FAPAR values, and the MUSES white-sky and blue-sky FAPAR values are usually larger than the corresponding EBR white-sky and blue-sky FAPAR values.
For the deciduous broadleaf forest biome type, the frequency distributions of the MUSES and MODIS black-sky FAPAR values are highly consistent, with a narrow peak around 0.85. The histogram of the EBR black-sky FAPAR values exhibits a single-peaked distribution with the peak position around 0.8, but frequency of the EBR black-sky FAPAR values at the peak position is smaller than those of the MODIS and MUSES black-sky FAPAR values. The histograms of the MUSES and EBR white-sky and blue-sky FAPAR values also show unimodal distributions, but the peak positions of the MUSES white-sky and blue-sky FAPAR values are higher than the corresponding peak positions of the EBR white-sky and blue-sky values, and the frequencies of the MUSES white-sky and blue-sky values at the peak positions are significantly larger than the corresponding frequencies of the EBR white-sky and blue-sky FAPAR values. Therefore, for deciduous broadleaf forests, the MODIS and MUSES black-sky FAPAR values are generally larger than the EBR black-sky FAPAR values, and the MUSES white-sky and blue-sky FAPAR values are generally larger than the corresponding EBR white-sky and blue-sky FAPAR values.
For evergreen needleleaf forests, the MODIS, MUSES and EBR FAPAR values are between 0.2 and 0.9 and show unimodal frequency distributions. The frequency distribution of the MODIS black-sky FAPAR values is consistent with that of the MUSES black-sky FAPAR values. However, the peak position of the EBR black-sky FAPAR values (approximately 0.6) is smaller than those of the MODIS and MUSES black-sky FAPAR values (approximately 0.8). In addition, the peak positions of the EBR white-sky and blue-sky FAPAR values are also smaller than the corresponding peak positions of MUSES white-sky and blue-sky FAPAR values. Therefore, the MODIS and MUSES black-sky FAPAR values are generally larger than the EBR black-sky FAPAR values, and the MUSES white-sky and blue-sky FAPAR values are generally larger than the corresponding EBR white-sky and blue-sky FAPAR values.
For deciduous needleleaf forests, only one peak is found in the frequency distribution histograms of the MODIS, MUSES and EBR FAPAR values. The MUSES black-sky, white-sky and blue-sky FAPAR values have the same peak positions as the corresponding EBR black-sky, white-sky and blue-sky FAPAR values. The peak position of the MODIS black-sky FAPAR values (approximately 0.9) is larger than those of the EBR and MUSES black-sky FAPAR values (approximately 0.8).

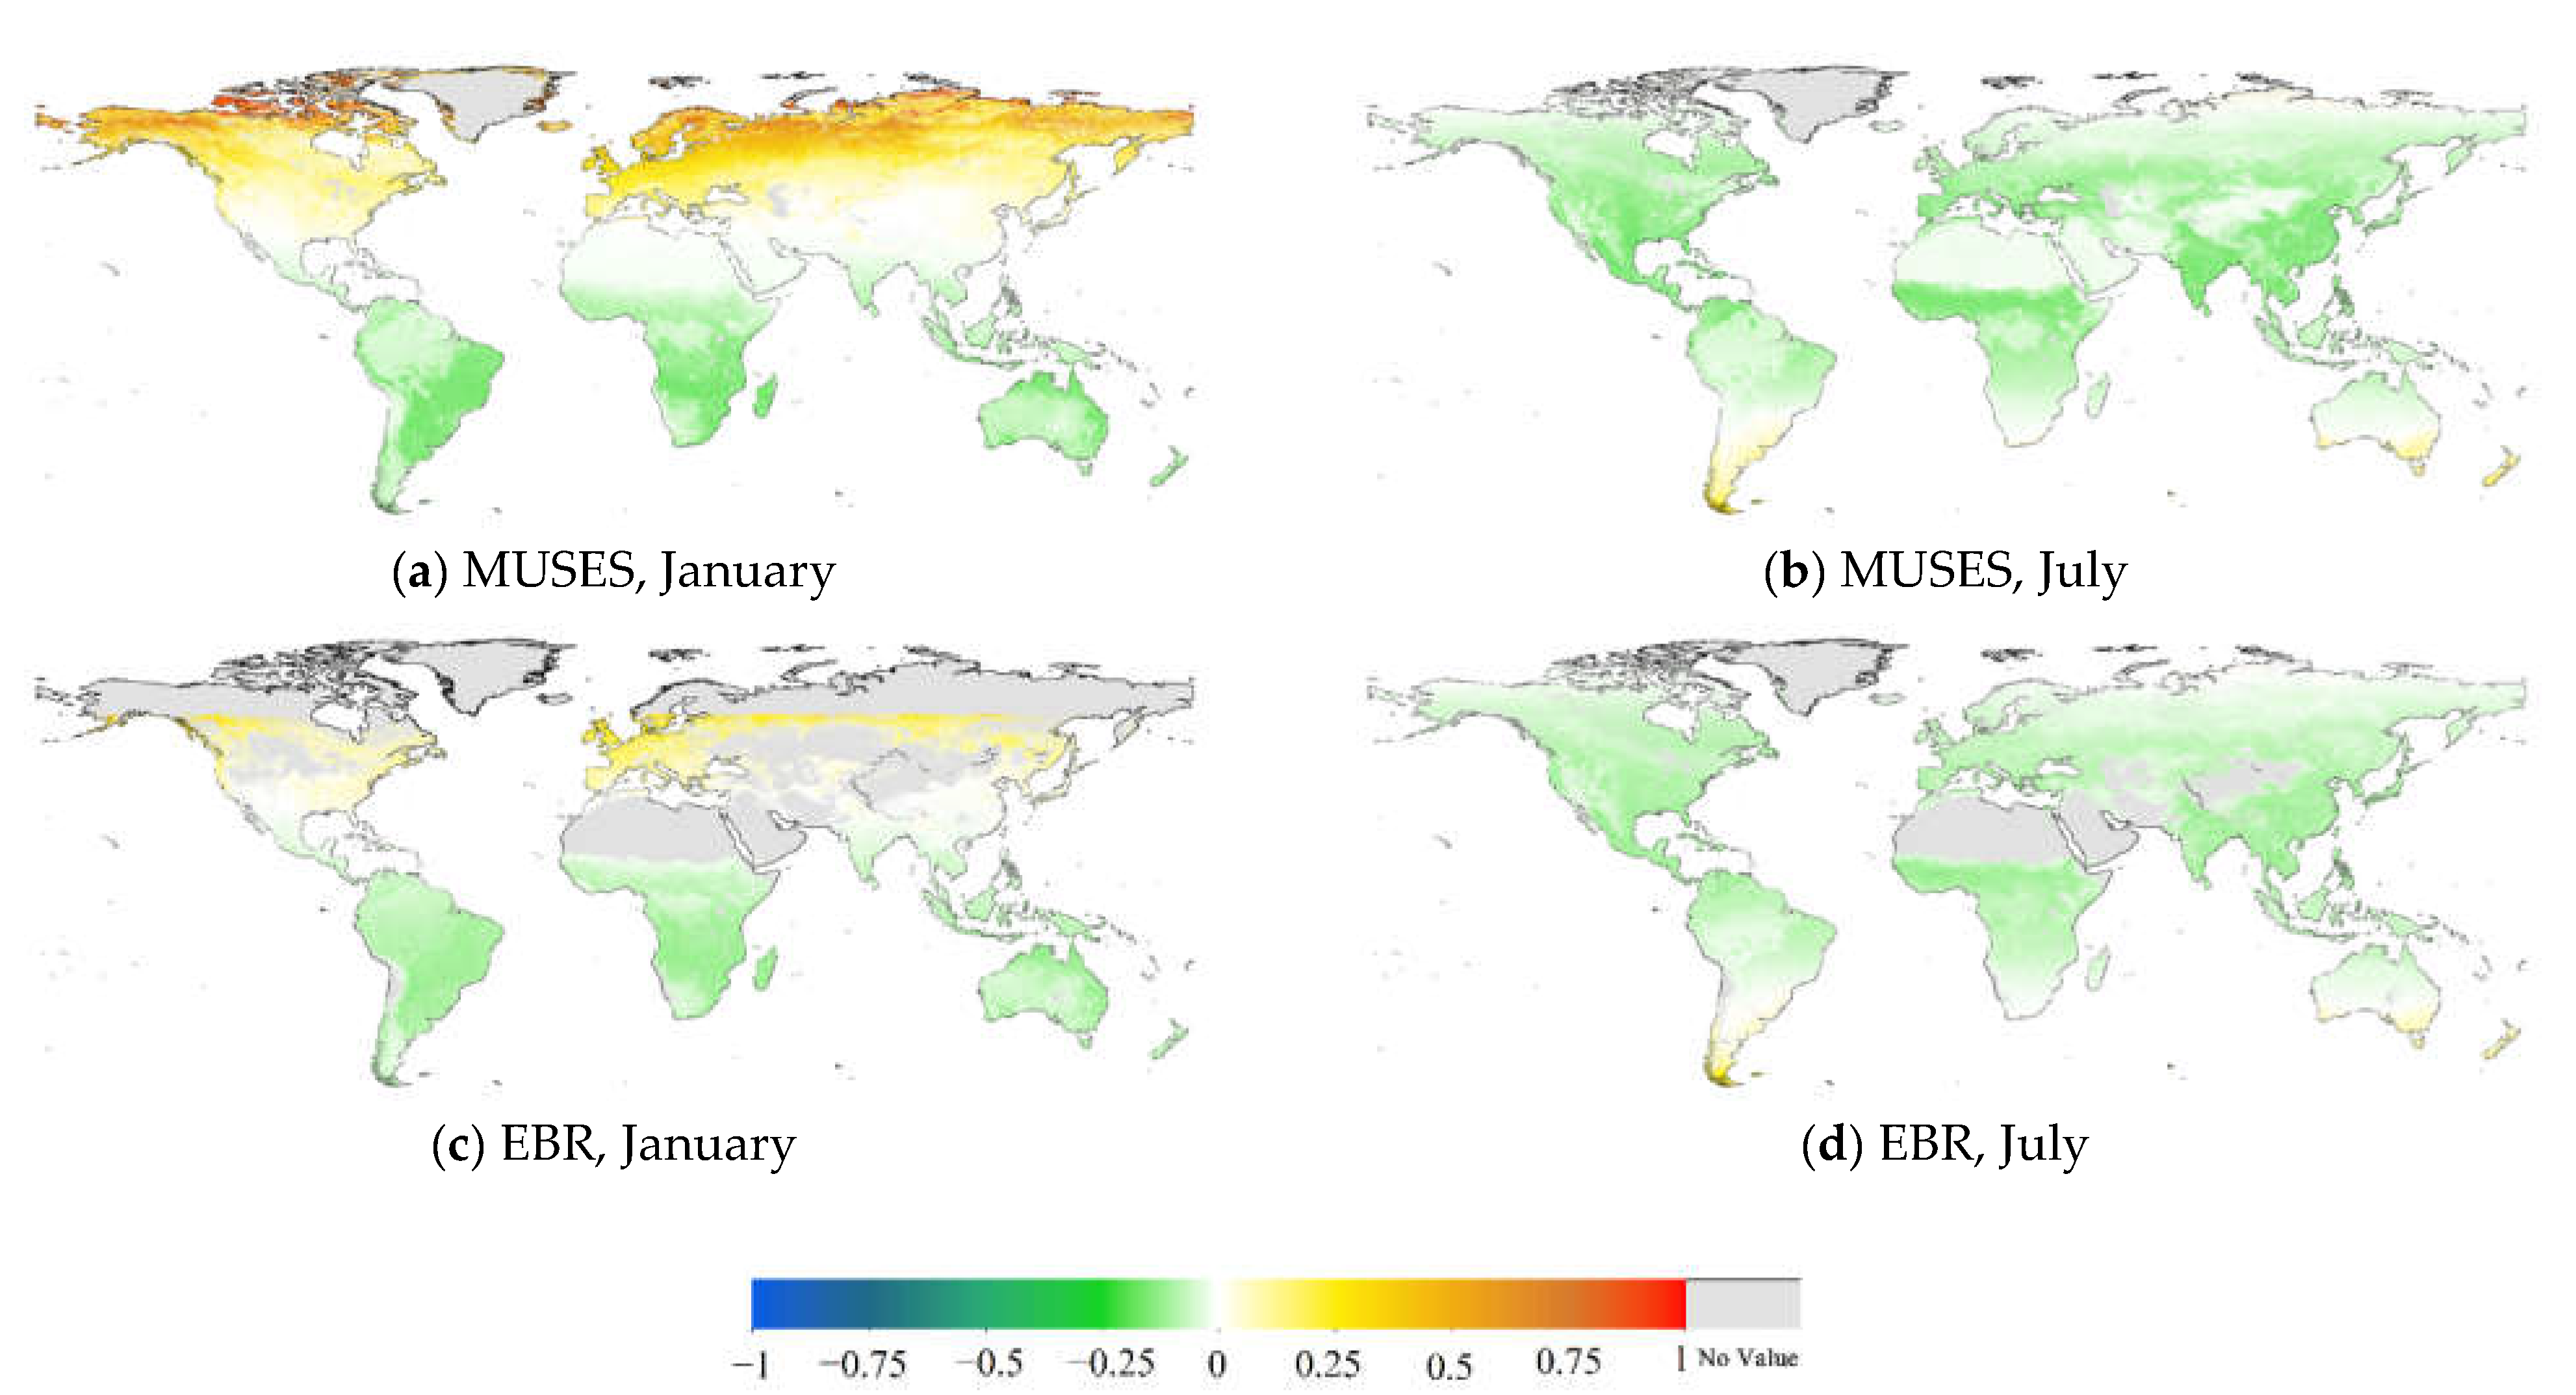
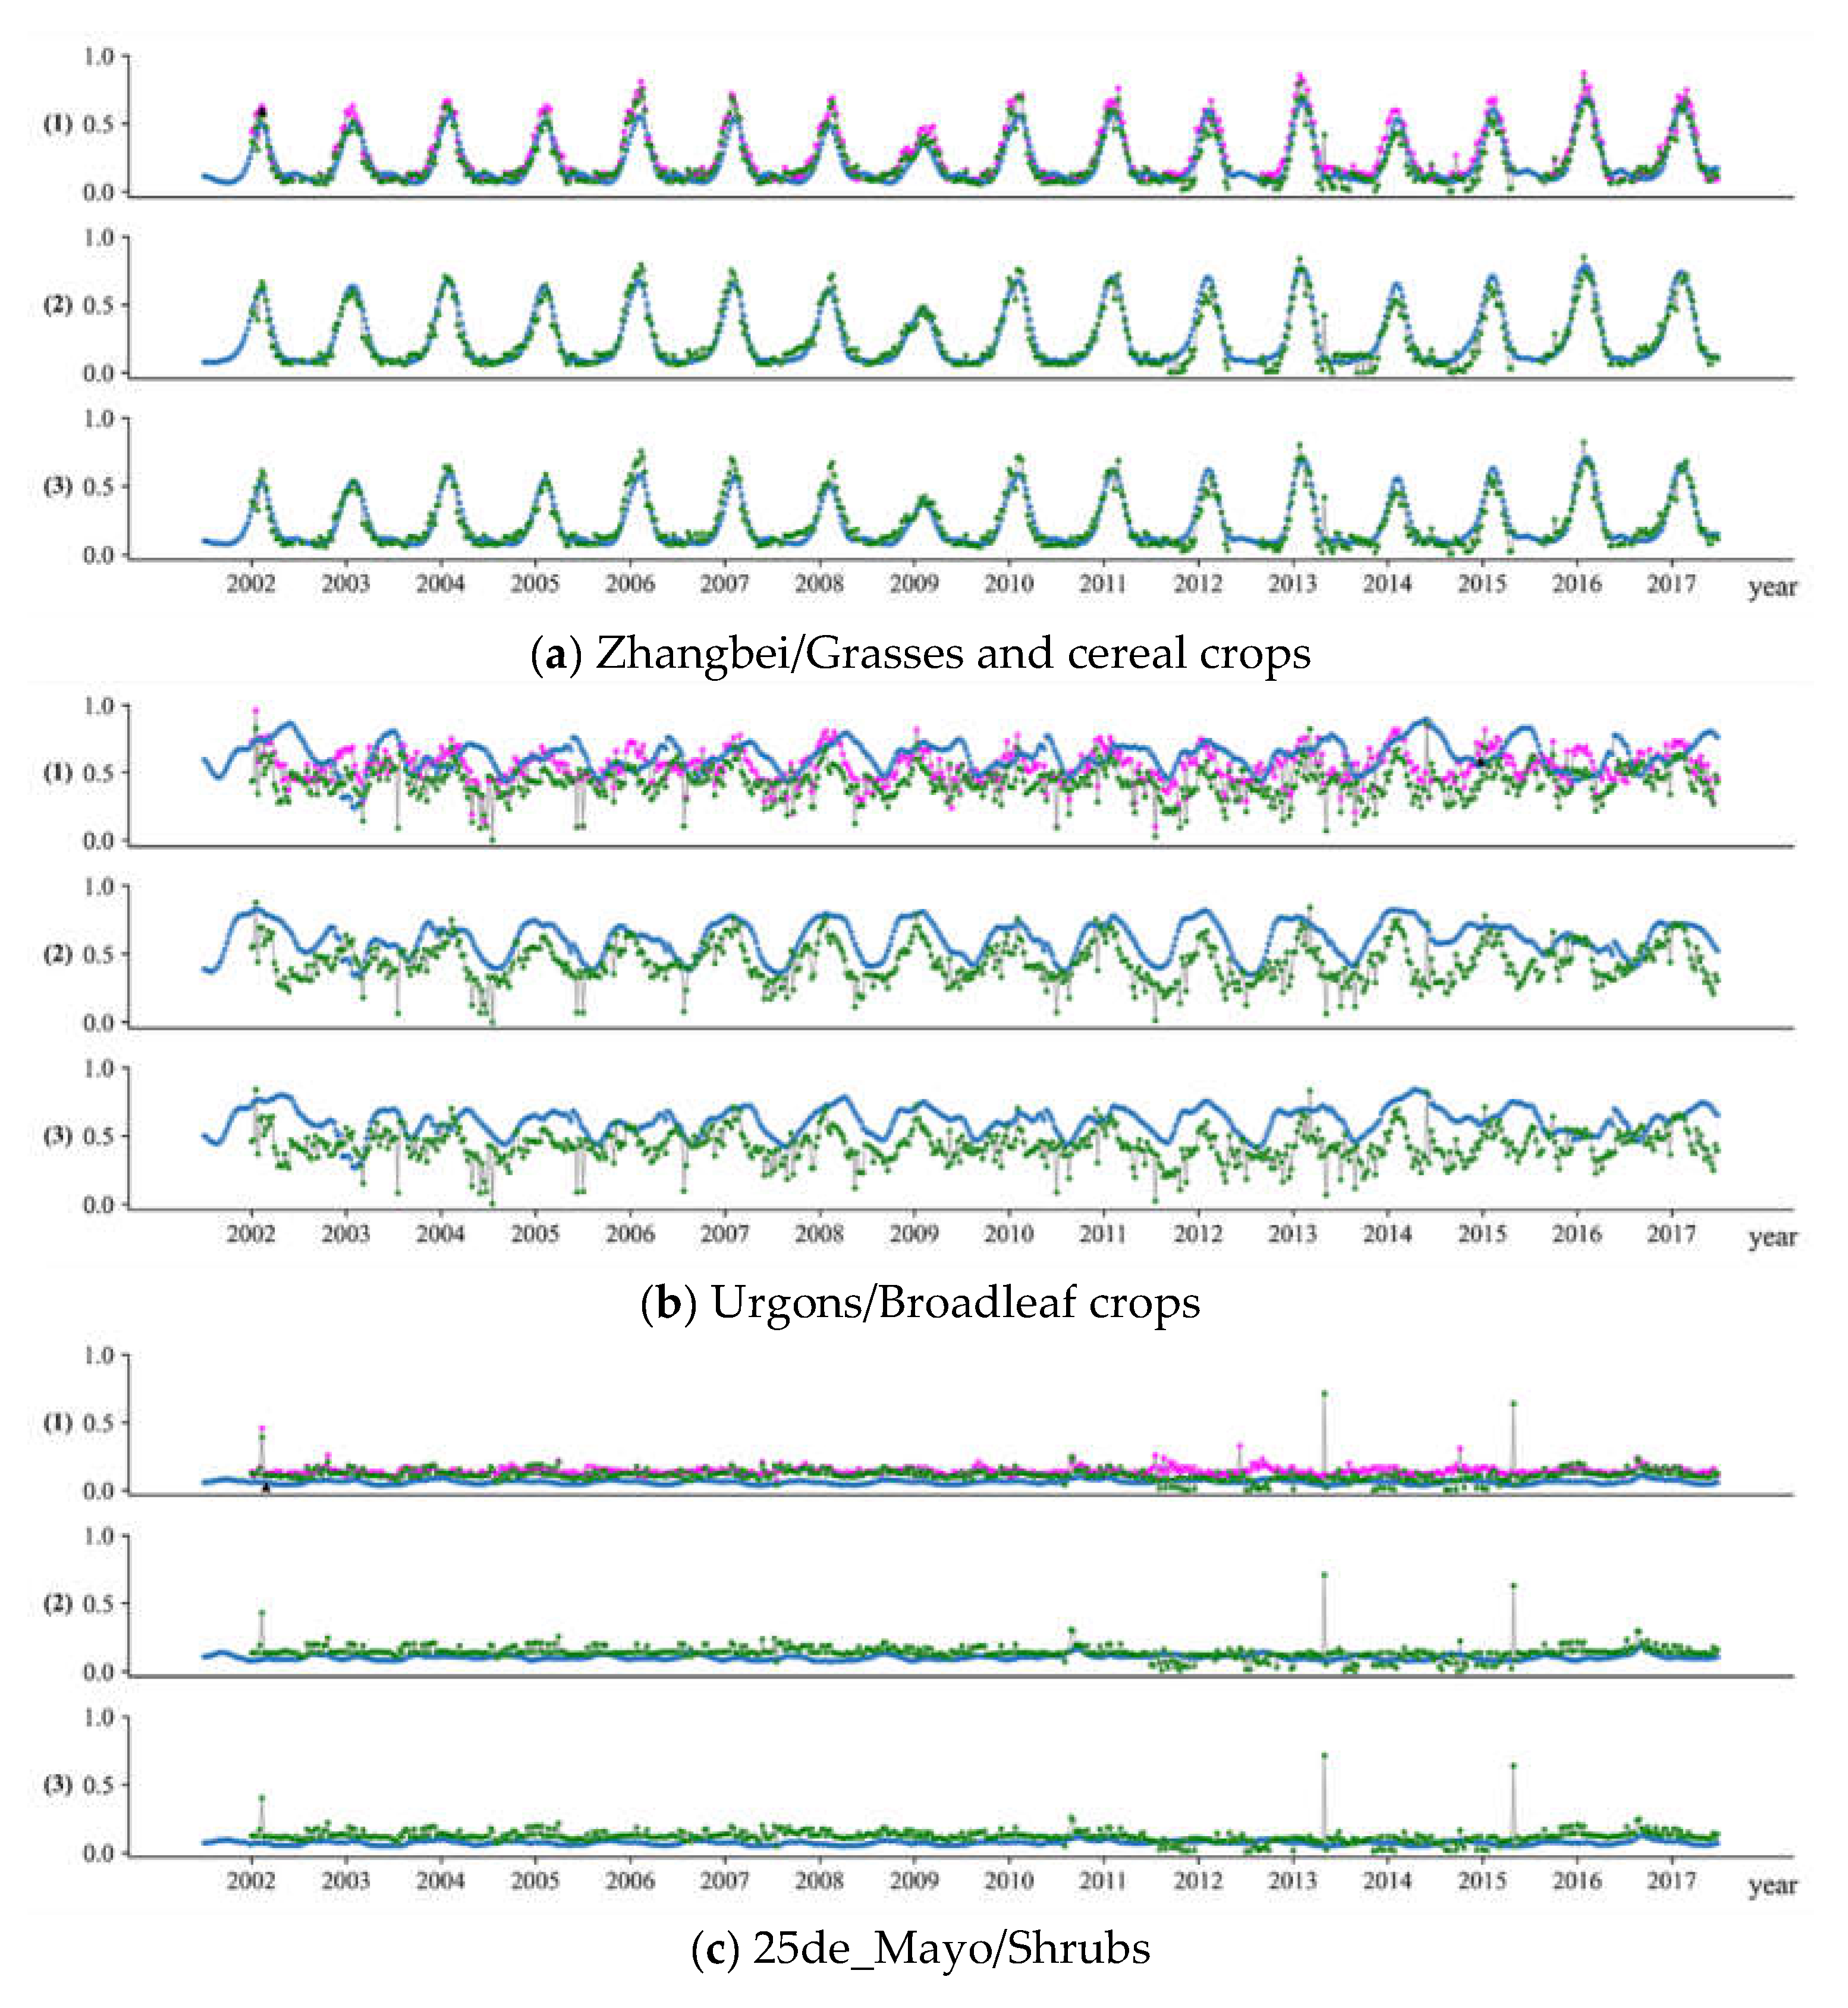
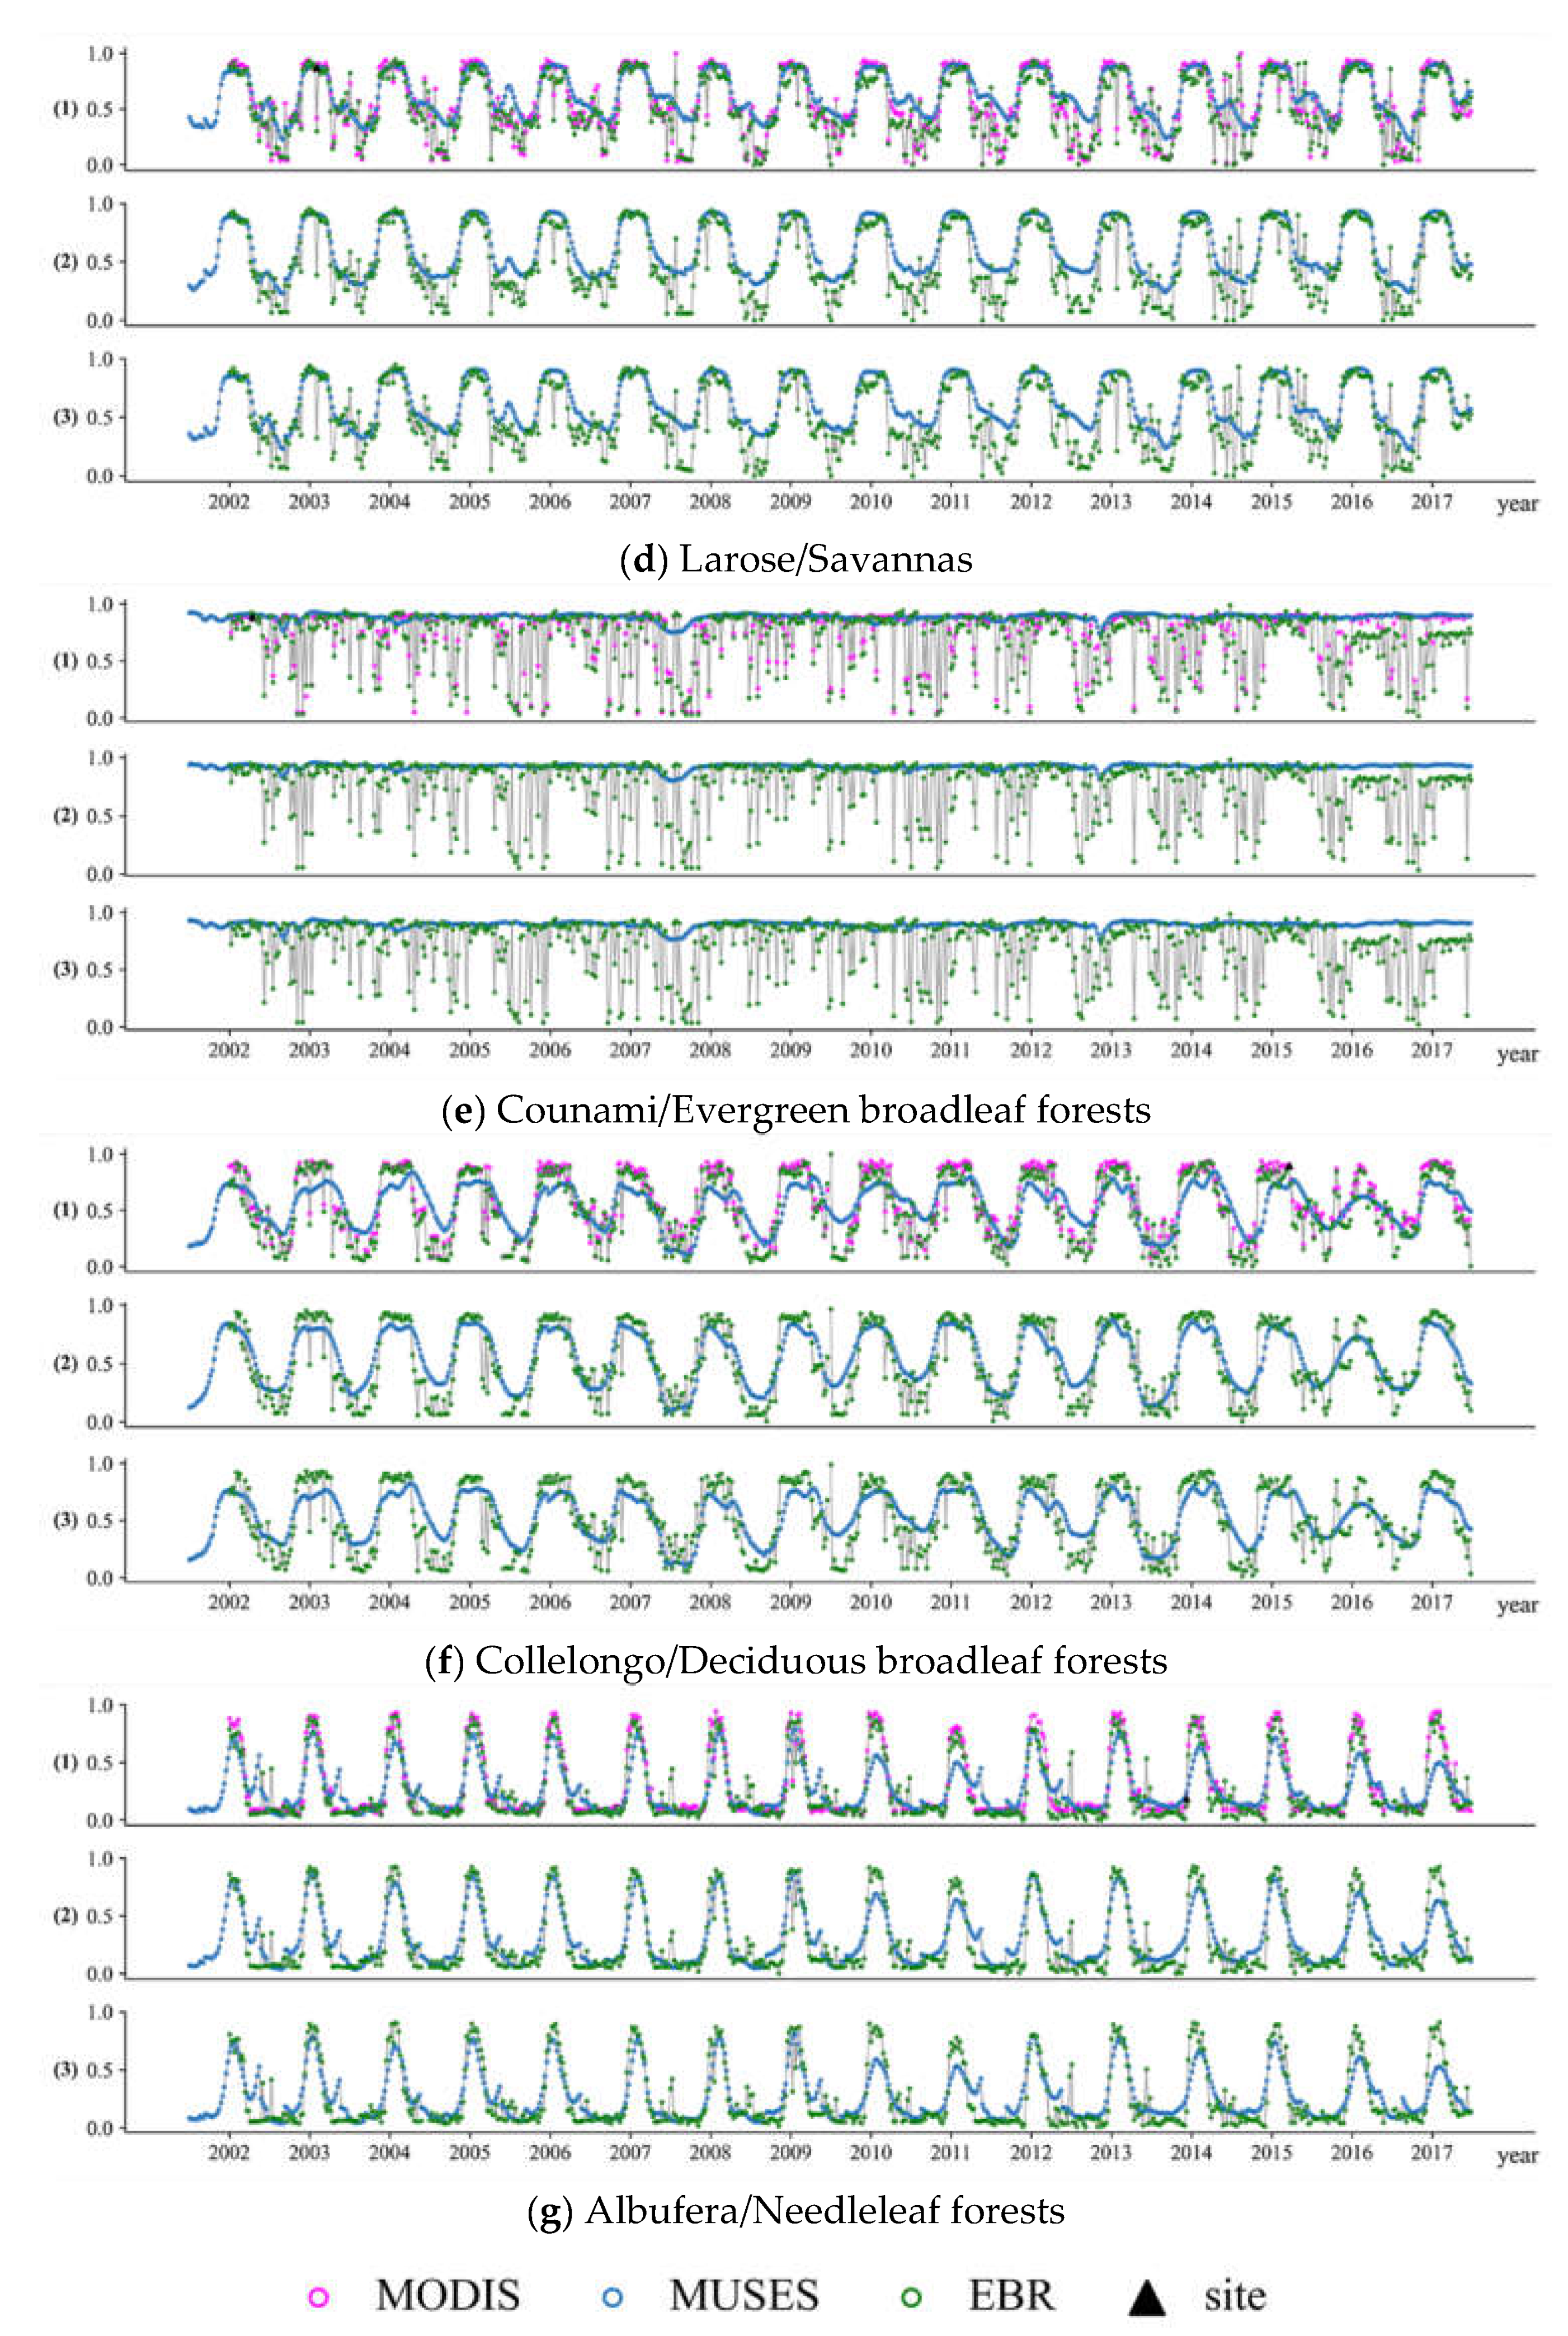
3.2. Temporal Consistency

Figure 6 displays temporal profiles of the MUSES, MODIS and EBR FAPAR products from 2002 to 2017 over seven sites with different biome types. The time series curves of the black-sky, white-sky and blue-sky FAPAR values are shown in upper, middle and lower panels, respectively, for each site in Figure 6. Among these sites, the MUSES FAPAR product shows the best temporal continuity. The profiles of the MODIS and EBR FAPAR products have missing FAPAR values in some sites, such as at Collelongo site. In addition, the profiles of the MODIS and EBR FAPAR values show some fluctuations, particularly during the growing seasons, whereas the temporal profiles of the MUSES FAPAR values are smooth, because the temporally smooth LAI product was used in the retrieval algorithm of the MUSES FAPAR products [9].
Figure 6a displays the time series curves of the MODIS, MUSES and EBR FAPAR values at the Zhangbei site with the biome type of grasses/cereal crops. Across the black-sky, white-sky or blue-sky FAPAR values, the MODIS, MUSES and EBR products achieve excellent agreement and show similar temporal trajectories and seasonal cycles. However, the MODIS black-sky FAPAR values and the EBR black-sky, white-sky and blue-sky FAPAR values are slightly higher than the corresponding MUSES black-sky, white-sky and blue-sky FAPAR values during the growing seasons. The MODIS and EBR black-sky FAPAR values are close to the FAPAR values derived from the high-resolution FAPAR reference maps in 2002.
Figure 6b shows the MODIS, MUSES and EBR FAPAR temporal trajectories at the Urgons site with the broadleaf crop biome type. The MODIS and EBR FAPAR profiles show dramatic fluctuations, whereas the MUSES FAPAR have continuous trajectories. The MODIS and MUSES FAPAR values are generally larger than the EBR FAPAR values. Compared with the blue-sky FAPAR values, the black-sky and white-sky FAPAR values can better reflect seasonal changes of crops. It can also be observed that the MODIS and EBR black-sky FAPAR values show earlier growing seasons than the MUSES black-sky FAPAR values, whereas the MUSES and EBR white-sky FAPAR values show the same growing seasons. In addition, the MODIS and MUSES black-sky FAPAR values show better agreement with the FAPAR value derived from the high-resolution FAPAR reference map than the EBR black-sky FAPAR value.
Figure 6c shows the temporal profiles of the MODIS, MUSES and EBR FAPAR values at the 25de_Mayo site where the vegetation type is shrubs. The MODIS, MUSES and EBR FAPAR profiles show no clear seasonal changes. The MODIS and EBR FAPAR products have some fluctuations, whereas the MUSES FAPAR profiles are smooth. The MODIS, MUSES and EBR FAPAR values at this site are generally very small, between 0.1 and 0.4. Compared with the MODIS and EBR black-sky FAPAR values, the MUSES black-sky FAPAR values are closer to the FAPAR value derived from the high-resolution FAPAR reference map at this site.
For savannas, the temporal trajectories of the MODIS, MUSES and EBR FAPAR values over the Larose site are displayed in Figure 6d. The MODIS, MUSES and EBR FAPAR values show similar seasonal variations. However, the MODIS and EBR FAPAR values show dramatic fluctuations during non-growing seasons. The MUSES FAPAR values are higher than the MODIS and EBR FAPAR values, especially during non-growing seasons. Compared with the MODIS and EBR black-sky FAPAR values, the MUSES black-sky FAPAR values agree better with the FAPAR value derived from the high-resolution FAPAR reference map at this site.
Figure 6e shows the time series curves of the MODIS, MUSES and EBR FAPAR values at the Counami site. The vegetation type of this site is evergreen broadleaf forests. The MUSES FAPAR values are between 0.7 and 0.8 and exhibit nearly flat profiles throughout the years. However, the temporal profiles of the MODIS and EBR FAPAR values show dramatic fluctuations that are inconsistent with the growth characteristics of the evergreen broadleaf forests. The MODIS, MUSES and EBR black-sky values all agree well with the FAPAR values derived from the high-resolution FAPAR reference maps at this site.
The temporal profiles of the MODIS, MUSES and EBR FAPAR values at the Collelongo site with the biome type of deciduous broadleaf forests are shown in Figure 6f. Some MODIS and EBR FAPAR values are missing at this site. The profiles of the MODIS and EBR FAPAR values show many fluctuations during growing and non-growing seasons. The MUSES FAPAR values are smaller than the MODIS and EBR FAPAR values during the growing seasons but are larger than the MODIS and EBR FAPAR values during the non-growing seasons. Compared with the MODIS and EBR black-sky FAPAR values, the MODIS and EBR black-sky FAPAR values are closer to the FAPAR values derived from the high-resolution FAPAR reference maps at this site.
Figure 6g shows temporal profiles of the MODIS, MUSES and EBR FAPAR values at the Albufera site with the needleleaf forest biome type. In general, the three FAPAR products show similar seasonal variations. The MUSES black-sky, white-sky and blue-sky FAPAR values (around 0.6) are smaller than the corresponding black-sky, white-sky and blue-sky FAPAR values of the MODIS and EBR products (around 0.9), particularly in 2010, 2011, 2016 and 2017. The MUSES, MODIS and EBR black-sky FAPAR values are close to the FAPAR value derived from the high-resolution FAPAR reference map in 2014.

3.3. Direct Validation

Scatterplots of the MODIS, MUSES and EBR black-sky FAPAR values versus the FAPAR values derived from the high-resolution FAPAR reference maps from the VALERI and IMAGINES projects are shown in Figure 7. Compared with the FAPAR values derived from the high-resolution FAPAR reference maps, the MODIS FAPAR values were generally overestimated, whereas the EBR product were generally underestimated. The MUSES black-sky FAPAR values were slightly overestimated for low FAPAR values but were underestimated for high FAPAR values. Compared to the MODIS and EBR black-sky FAPAR values, the scatters for the MUSES black-sky FAPAR values against the FAPAR values derived from the high-resolution FAPAR reference maps are distributed more closely around 1:1 line, which demonstrates that the MUSES black-sky FAPAR values achieve better agreement with the FAPAR values derived from the high-resolution FAPAR reference maps. Overall, the accuracy of the MUSES black-sky FAPAR product (R2 = 0.6932 and RMSE = 0.1495) against the FAPAR values derived from the high-resolution FAPAR reference maps outperforms those of the MODIS (R2 = 0.6202 and RMSE = 0.1710) and EBR (R2 = 0.5746 and RMSE = 0.1912) black-sky FAPAR products.

4. Discussion

Although many studies have compared the existing FAPAR products, these studies have focused on evaluating FAPAR products at spatial resolutions of 1 km or more, and few studies have evaluated the latest global FAPAR products at a spatial resolution of 500 m. Furthermore, these existing studies evaluated FAPAR products without distinguishing the black-sky, white-sky and blue-sky FAPAR datasets. D’Odorico et al. [24] evaluated the performance of JRC-TIP, ESA/JRC MGVI and MODIS FAPAR products over Europe for the year 2011. The JRC-TIP FAPAR product is defined as the instantaneous FAPAR under diffuse illumination by a green canopy, whereas the ESA/JRC MGVI and MODIS FAPAR products correspond to the instantaneous FAPAR under direct illumination by a green canopy. Similar comparisons among FAPAR products were reported by many studies [20,26]. In this study, we evaluated the performance of the latest MODIS, MUSES and EBR global FAPAR products at a spatial resolution of 500 m. The black-sky, white-sky and blue-sky FAPAR datasets from the MODIS, MUSES and EBR products were separately compared to evaluate their spatial and temporal discrepancies. The discrepancies of the black-sky, white-sky or blue-sky FAPAR datasets among the MODIS, MUSES and EBR products (Figure 1 and Figure 2) are partly explained by the different algorithm assumption used in each product [24].
In this study, the differences between the black-sky and white-sky FAPAR datasets were also evaluated at the global scale. It is found that the black-sky FAPAR values were larger than the white-sky FAPAR values in the region north of 30° north latitude in January (Figure 3a,c) and in the region south of 30° south latitude in July (Figure 3b,d), whereas the black-sky FAPAR values were smaller than the white-sky FAPAR values in the region south of 30° north latitude in January (Figure 3a,c) and in the region north of 30° south latitude in July (Figure 3b,d). The spatial distribution of the differences between black-sky and white-sky FAPAR values in January and July was because the absorption of direct light by canopy is significantly affected by solar altitude angle, whereas the absorption of diffuse light is insensitive to the solar altitude angle [38].
In Figure 7, the MODIS, MUSES and EBR black-sky FAPAR values were compared with the FAPAR values derived from the high-resolution FAPAR reference maps to evaluate the accuracy of these FAPAR products. The results demonstrate that the MUSES black-sky FAPAR product provides the greatest accuracy against the FAPAR values derived from the high-resolution FAPAR reference maps compared to the MODIS and EBR black-sky FAPAR products. The results also demonstrate that the MODIS FAPAR product provides better accuracy than the EBR black-sky FAPAR product. However, Liu et al. [19] reported that the EBR black-sky FAPAR product was more accurate than the MODIS FAPAR product. The difference may be caused by the following reasons: (1) The spatial resolution of the GEOV1 FAPAR product is 1 km and that of the MODIS and EBR FAPAR products is 500 m. So, in the study of Liu et al., the MODIS, GEOV1 and EBR FAPAR products were validated using the mean values for an area of 3 km × 3 km. However, in our study, we used the mean values for an area of 500 m × 500 m. (2) The 27 high-resolution FAPAR reference maps covering 22 VALERI sites were used to validate the GEOV1, MODIS and EBR FAPAR products in the study of Liu et al. However, 58 high-resolution FAPAR reference maps over 36 sites from the VALERI and IMAGINES projects were used to validate the MUSES, MODIS and EBR FAPAR products in our study. Therefore, the sites used for validation are not consistent in the two studies.

5. Conclusions

Three global 500 m resolution FAPAR products—MODIS (with only black-sky FAPAR), MUSES and EBR (black-sky, white-sky and blue-sky FAPAR) products—have been produced in recent years. The performance of the three FAPAR products is evaluated in this study. The methods include cross-comparison of the three FAPAR products to evaluate the spatial and temporal consistency of these FAPAR products and direct validation among the MODIS, MUSES and EBR black-sky FAPAR values and the FAPAR values derived from the high-resolution reference maps. The EBR FAPAR product has the most missing values, followed by the MODIS FAPAR product, and the MUSES FAPAR product has the fewest missing values. The MODIS, MUSES and EBR FAPAR products are generally consistent in their spatial patterns. However, a relatively large discrepancy among these products is observed in the equatorial rainforest regions and the middle and high latitude regions, where the main vegetation type is forest. The temporal profiles of the MUSES FAPAR product are smooth, whereas those of the MODIS and EBR FAPAR products show some fluctuations, particularly during the growing seasons. When compared with the FAPAR values derived from the high-resolution reference maps, the MUSES black-sky FAPAR product shows better accuracy than the MODIS and EBR black-sky FAPAR products. In summary, the MUSES FAPAR product shows the best performance among the three global FAPAR products. However, the evaluation analyses of these global FAPAR products were limited by the ground measurements from the VALERI and IMAGINES projects. In recent years, more and more field measurement experiments are conducted and have acquired multi-temporal ground measurement for FAPAR product validation. In the near future, the authors will perform more extensive validation and analysis of these global FAPAR products.

Author Contributions

Conceptualization, Z.X. and Y.Z.; methodology, Z.X. and Y.Z.; software, Y.Z. and J.L.; formal analysis, Y.Z., Z.X., H.Y. and J.S.; data curation, Y.Z. and J.L.; writing—original draft preparation, Y.Z.; writing—review and editing, Z.X. and Y.Z. All authors have read and agreed to the published version of the manuscript.

Funding

This research was funded in part by the National Natural Science Foundation of China under Grant 41771359 and in part by the Water Conservancy Science and Technology Project of Jiangxi Province under Grant 202023ZDKT10.

Acknowledgments

The authors would like to thank the VALERI and IMAGINES projects for providing high-resolution FAPAR reference maps.

Conflicts of Interest

The authors declare no conflict of interest.

References

  1. Gower, S.T.; Kucharik, C.J.; Norman, J.M. Direct and Indirect Estimation of Leaf Area Index, fAPAR, and Net Primary Production of Terrestrial Ecosystems. Remote Sens. Environ. 1999, 70, 29–51. [Google Scholar] [CrossRef]
  2. Secretariat, G. Systematic observation requirements for satellite-based products for climate. In GCOS Implementation Plan; GCOS Secretariat: Geneva, Switzerland, 2006. [Google Scholar]
  3. Kaminski, T.; Knorr, W.; Scholze, M.; Gobron, N.; Pinty, B.; Giering, R.; Mathieu, P.P. Consistent assimilation of MERIS FAPAR and atmospheric CO2 into a terrestrial vegetation model and interactive mission benefit analysis. Biogeosciences 2012, 9, 3173–3184. [Google Scholar] [CrossRef] [Green Version]
  4. Maselli, F.; Chiesi, M.; Fibbi, L.; Moriondo, M. Integration of remote sensing and ecosystem modelling techniques to estimate forest net carbon uptake. Int. J. Remote Sens. 2008, 29, 2437–2443. [Google Scholar] [CrossRef]
  5. Prince, S.D.; Goward, S.N. Global Primary Production: A Remote Sensing Approach. J. Biogeogr. 1995, 22, 815–835. [Google Scholar] [CrossRef]
  6. Running, S.W.; Nemani, R.R.; Heinsch, F.A.; Zhao, M.; Reeves, M.; Hashimoto, H. A Continuous Satellite-Derived Measure of Global Terrestrial Primary Production. Bioscience 2004, 54, 547–560. [Google Scholar] [CrossRef]
  7. Rayner, P.J.; Scholze, M.; Knorr, W.; Kaminski, T.; Giering, R.; Widmann, H. Two decades of terrestrial carbon fluxes from a carbon cycle data assimilation system (CCDAS). Glob. Biogeochem. Cycles 2005, 19, GB2026. [Google Scholar] [CrossRef] [Green Version]
  8. Gobron, N.; Pinty, B.; Mélin, F.; Taberner, M.; Verstraete, M.M.; Belward, A.; Lavergne, T.; Widlowski, J.L. The state of vegetation in Europe following the 2003 drought. Int. J. Remote Sens. 2005, 26, 2013–2020. [Google Scholar] [CrossRef]
  9. Gonsamo, A.; Chen, J.M.; Price, D.T.; Kurz, W.A.; Wu, C. Land surface phenology from optical satellite measurement and CO2 eddy covariance technique. J. Geophys. Res. Biogeosci. 2012, 117, G03032. [Google Scholar] [CrossRef]
  10. Verstraete, M.M.; Gobron, N.; Aussedat, O.; Robustelli, M.; Pinty, B.; Widlowski, J.-L.; Taberner, M. An automatic procedure to identify key vegetation phenology events using the JRC-FAPAR products. Adv. Space Res. 2008, 41, 1773–1783. [Google Scholar] [CrossRef]
  11. Myneni, R.B.; Hoffman, S.; Knyazikhin, Y.; Privette, J.L.; Glassy, J.; Tian, Y.; Wang, Y.; Song, X.; Zhang, Y.; Smith, G.R.; et al. Global products of vegetation leaf area and fraction absorbed PAR from year one of MODIS data. Remote Sens. Environ. 2002, 83, 214–231. [Google Scholar] [CrossRef] [Green Version]
  12. Gobron, N.; Pinty, B.; Verstraete, M.; Govaerts, Y. The MERIS Global Vegetation Index (MGVI): Description and preliminary application. Int. J. Remote Sens. 1999, 20, 1917–1927. [Google Scholar] [CrossRef]
  13. Gobron, N.; Mélin, F.; Pinty, B.; Verstraete, M.M.; Widlowski, J.L.; Bucini, G. A global vegetation index for SeaWiFS: Design and applications. In Remote Sensing and Climate Modeling: Synergies and Limitations; Beniston, M., Verstraete, M.M., Eds.; Springer: Dordrecht, The Netherlands, 2001; pp. 5–21. [Google Scholar] [CrossRef]
  14. Baret, F.; Hagolle, O.; Geiger, B.; Bicheron, P.; Miras, B.; Huc, M.; Berthelot, B.; Niño, F.; Weiss, M.; Samain, O.; et al. LAI, fAPAR and fCover CYCLOPES global products derived from VEGETATION: Part 1: Principles of the algorithm. Remote Sens. Environ. 2007, 110, 275–286. [Google Scholar] [CrossRef] [Green Version]
  15. Baret, F.; Weiss, M.; Lacaze, R.; Camacho, F.; Makhmara, H.; Pacholcyzk, P.; Smets, B. GEOV1: LAI and FAPAR essential climate variables and FCOVER global time series capitalizing over existing products. Part 1: Principles of development and production. Remote Sens. Environ. 2013, 137, 299–309. [Google Scholar] [CrossRef]
  16. Knyazikhin, Y.; Martonchik, J.V.; Diner, D.J.; Myneni, R.B.; Verstraete, M.; Pinty, B.; Gobron, N. Estimation of vegetation canopy leaf area index and fraction of absorbed photosynthetically active radiation from atmosphere-corrected MISR data. J. Geophys. Res. Earth Surf. 1998, 103, 32239–32256. [Google Scholar] [CrossRef] [Green Version]
  17. Yang, B.; Knyazikhin, Y.; Mõttus, M.; Rautiainen, M.; Stenberg, P.; Yan, L.; Chen, C.; Yan, K.; Choi, S.; Park, T.; et al. Estimation of leaf area index and its sunlit portion from DSCOVR EPIC data: Theoretical basis. Remote Sens. Environ. 2017, 198, 69–84. [Google Scholar] [CrossRef] [Green Version]
  18. Knyazikhin, Y.; Song, W.; Yang, B.; Mõttus, M.; Rautiainen, M.; Park, T. Earth System Data Record from DSCOVR EPIC Observations: Product Description and Analyses; OpenBU: Boston, MA, USA, 2018. [Google Scholar]
  19. Liu, L.; Zhang, X.; Xie, S.; Liu, X.; Song, B.; Chen, S.; Peng, D. Global White-Sky and Black-Sky FAPAR Retrieval Using the Energy Balance Residual Method: Algorithm and Validation. Remote Sens. 2019, 11, 1004. [Google Scholar] [CrossRef] [Green Version]
  20. Xiao, Z.; Liang, S.; Sun, R.; Wang, J.; Jiang, B. Estimating the fraction of absorbed photosynthetically active radiation from the MODIS data based GLASS leaf area index product. Remote Sens. Environ. 2015, 171, 105–117. [Google Scholar] [CrossRef]
  21. Camacho, F.; Cernicharo, J.; Lacaze, R.; Baret, F.; Weiss, M. GEOV1: LAI, FAPAR essential climate variables and FCOVER global time series capitalizing over existing products. Part 2: Validation and intercomparison with reference products. Remote Sens. Environ. 2013, 137, 310–329. [Google Scholar] [CrossRef]
  22. Tao, X.; Liang, S.; Wang, D. Assessment of five global satellite products of fraction of absorbed photosynthetically active radiation: Intercomparison and direct validation against ground-based data. Remote Sens. Environ. 2015, 163, 270–285. [Google Scholar] [CrossRef]
  23. Weiss, M.; Baret, F.; Garrigues, S.; Lacaze, R. LAI and fAPAR CYCLOPES global products derived from VEGETATION. Part 2: Validation and comparison with MODIS collection 4 products. Remote Sens. Environ. 2007, 110, 317–331. [Google Scholar] [CrossRef]
  24. D’Odorico, P.; Gonsamo, A.; Pinty, B.; Gobron, N.; Coops, N.; Mendez, E.; Schaepman, M.E. Intercomparison of fraction of absorbed photosynthetically active radiation products derived from satellite data over Europe. Remote Sens. Environ. 2014, 142, 141–154. [Google Scholar] [CrossRef]
  25. Fensholt, R.; Sandholt, I.; Rasmussen, M.S. Evaluation of MODIS LAI, fAPAR and the relation between fAPAR and NDVI in a semi-arid environment using in situ measurements. Remote Sens. Environ. 2004, 91, 490–507. [Google Scholar] [CrossRef]
  26. Martínez, B.; Camacho, F.; Verger, A.; García-Haro, F.J.; Gilabert, M.A. Intercomparison and quality assessment of MERIS, MODIS and SEVIRI FAPAR products over the Iberian Peninsula. Int. J. Appl. Earth Obs. Geoinf. 2013, 21, 463–476. [Google Scholar] [CrossRef]
  27. McCallum, I.; Wagner, W.; Schmullius, C.; Shvidenko, A.; Obersteiner, M.; Fritz, S.; Nilsson, S. Comparison of four global FAPAR datasets over Northern Eurasia for the year 2000. Remote Sens. Environ. 2010, 114, 941–949. [Google Scholar] [CrossRef]
  28. Meroni, M.; Atzberger, C.; Vancutsem, C.; Gobron, N.; Baret, F.; Lacaze, R.; Eerens, H.; Leo, O. Evaluation of Agreement Between Space Remote Sensing SPOT-VEGETATION fAPAR Time Series. IEEE Trans. Geosci. Remote Sens. 2013, 51, 1951–1962. [Google Scholar] [CrossRef]
  29. Pinty, B.; Clerici, M.; Andredakis, I.; Kaminski, T.; Taberner, M.; Verstraete, M.M.; Gobron, N.; Plummer, S.; Widlowski, J.L. Exploiting the MODIS albedos with the Two-stream Inversion Package (JRC-TIP): 2. Fractions of transmitted and absorbed fluxes in the vegetation and soil layers. J. Geophys. Res. Earth Surf. 2011, 116, D09106. [Google Scholar] [CrossRef] [Green Version]
  30. Knyazikhin, Y.; Martonchik, J.V.; Myneni, R.B.; Diner, D.J.; Running, S.W. Synergistic algorithm for estimating vegetation canopy leaf area index and fraction of absorbed photosynthetically active radiation from MODIS and MISR data. J. Geophys. Res. Earth Surf. 1998, 103, 32257–32275. [Google Scholar] [CrossRef] [Green Version]
  31. Claverie, M.; Vermote, E.F.; Weiss, M.; Baret, F.; Hagolle, O.; Demarez, V. Validation of coarse spatial resolution LAI and FAPAR time series over cropland in southwest France. Remote Sens. Environ. 2013, 139, 216–230. [Google Scholar] [CrossRef]
  32. Serbin, S.P.; Ahl, D.E.; Gower, S.T. Spatial and temporal validation of the MODIS LAI and FPAR products across a boreal forest wildfire chronosequence. Remote Sens. Environ. 2013, 133, 71–84. [Google Scholar] [CrossRef]
  33. Jiao, Z.; Dong, Y.; Schaaf, C.B.; Chen, J.M.; Román, M.; Wang, Z.; Zhang, H.; Ding, A.; Erb, A.; Hill, M.J.; et al. An algorithm for the retrieval of the clumping index (CI) from the MODIS BRDF product using an adjusted version of the kernel-driven BRDF model. Remote Sens. Environ. 2018, 209, 594–611. [Google Scholar] [CrossRef]
  34. Myneni, R.; Knyazikhin, Y.; Park, T. MCD15A2H MODIS/Terra+Aqua Leaf Area Index/FPAR 8-day L4 Global 500m SIN Grid V006; [Data set]. 2015. Available online: https://lpdaac.usgs.gov/products/mcd15a2hv006/ (accessed on 10 May 2022).
  35. Wenze, Y.; Bin, T.; Dong, H.; Rautiainen, M.; Shabanov, N.V.; Wang, Y.; Privette, J.L.; Huemmrich, K.F.; Fensholt, R.; Sandholt, I.; et al. MODIS leaf area index products: From validation to algorithm improvement. IEEE Trans. Geosci. Remote Sens. 2006, 44, 1885–1898. [Google Scholar] [CrossRef]
  36. Mõttus, M.; Sulev, M.; Baret, F.; Lopez-Lozano, R.; Reinart, A. Photosynthetically active radiation: Measurement and modeling. In Solar Energy; Springer: New York, NY, USA, 2013; pp. 140–169. [Google Scholar]
  37. Morisette, J.T.; Baret, F.; Privette, J.L.; Myneni, R.B.; Nickeson, J.E.; Garrigues, S.; Shabanov, N.V.; Weiss, M.; Fernandes, R.A.; Leblanc, S.G.; et al. Validation of global moderate-resolution LAI products: A framework proposed within the CEOS land product validation subgroup. IEEE Trans. Geosci. Remote Sens. 2006, 44, 1804–1817. [Google Scholar] [CrossRef] [Green Version]
  38. Cao, R.; Shen, M.; Chen, J.; Tang, Y. A simple method to simulate diurnal courses of PAR absorbed by grassy canopy. Ecol. Indic. 2014, 46, 129–137. [Google Scholar] [CrossRef]
Figure 1. Global spatial maps of MUSES, EBR and MODIS FAPAR products in January of 2016. (a) MUSES, black-sky. (b) MUSES, white-sky. (c) MUSES, blue-sky. (d) EBR, black-sky. (e) EBR, white-sky. (f) EBR, blue-sky. (g) MODIS, black-sky.
Remotesensing 14 03304 g001
Figure 2. Global spatial maps of MUSES, EBR, MODIS FAPAR products in July of 2016. (a) MUSES, black-sky. (b) MUSES, white-sky. (c) MUSES, blue-sky. (d) EBR, black-sky. (e) EBR, white-sky. (f) EBR, blue-sky. (g) MODIS, black-sky.
Remotesensing 14 03304 g002aRemotesensing 14 03304 g002b
Figure 3. Global maps of differences between black-sky and white-sky FAPAR values of MUSES (top) and EBR (bottom) products in January (left) and July (right) of 2016. (a) MUSES, January. (b) MUSES, July. (c) EBR, January. (d) EBR, July.
Remotesensing 14 03304 g003
Figure 4. Histograms of the MODIS, MUSES and EBR FAPAR products in July of 2016 in the northern hemisphere (NH) (top) and southern hemisphere (SH) (bottom). (a) NH, black-sky. (b) NH, white-sky. (c) NH, blue-sky. (d) SH, black-sky. (e) SH, white-sky. (f) SH, blue-sky.
Remotesensing 14 03304 g004
Figure 5. Histogram of black-sky (left), white-sky (middle) and blue-sky (right) FAPAR values of the MODIS, MUSES and EBR products in July of 2016 for different biome types. (a) Grasses/cereal crops. (b) Broadleaf crops. (c) Shrubs. (d) Savannas. (e) Evergreen broadleaf forests. (f) Deciduous broadleaf forests. (g) Evergreen needleleaf forests. (h) Deciduous needleleaf forests.
Remotesensing 14 03304 g005
Figure 6. Time series of the black-sky (1), white-sky (2) and blue-sky (3) FAPAR values from the MODIS, MUSES and EBR products for (a) Zhangbei, (b) Urgons, (c) 25de_Mayo, (d) Larose, (e) Counami, (f) Collelongo and (g) Albufera sites from 2002 to 2017.
Remotesensing 14 03304 g006aRemotesensing 14 03304 g006b
Figure 7. Scatterplots of the MODIS, MUSES and EBR black-sky FAPAR values versus the FAPAR values derived from the high-resolution FAPAR reference maps.
Remotesensing 14 03304 g007
Table 1. Main characteristics of the selected sites and their mean FAPAR values of a 500 × 500 m region (DOY, day of year).
Site NameCountryLat (°)Lon (°)Biome TypeDOY/YearMean FAPAR
Les_Alpilles *France43.8104.715Broadleaf crops204/20020.350
Barrax *Spain39.057−2.104Broadleaf crops194/20030.083
Camerons *Australia−32.598116.254Savannas63/20040.455
Concepcion *Chile−37.467−73.470Deciduous broadleaf forests9/20030.801
Counami *French5.347−53.238Evergreen broadleaf forests286/20020.889
Fundulea *Romania44.40626.583Grasses/cereal crops151/20030.347
Gilching *Germany48.08211.320Grasses/cereal crops199/20020.714
Gnangara *Australia−31.534115.882Savanna61/20040.258
Haouz *Morocco31.659−7.600Shrubs71/20030.295
Laprida *Argentina−36.990−60.553Broadleaf crops292/20020.608
Larose *Canada45.380−75.217Savanna219/20030.871
Plan-de-Dieu *France44.1994.948Broadleaf crops189/20040.245
Sonian *Belgium50.7684.411Deciduous broadleaf forests174/20040.921
Sud_Ouest *France43.5061.238Broadleaf crops189/20020.634
Turco *Bolivia−18.239−68.193Shrubs240/20020.025
105/20030.050
Zhangbei *China41.279114.688Grasses/cereal crops221/20020.594
Pshenichne #Ukraine50.07730.232Grasses/cereal crops134/20130.218
166/20130.721
196/20130.871
SouthWest_1 #France43.5511.089Grasses/cereal crops173/20130.774
191/20130.135
207/20130.201
230/20130.224
247/20130.277
SouthWest_2 #France43.4471.145Grasses/cereal crops173/20130.662
191/20130.306
207/20130.434
230/20130.409
247/20130.368
Mayo_Alfalfa #Argentina−37.907−67.746Grasses/cereal crops40/20140.376
Mayo_Shurb #Argentina−37.939−67.789Shrubs40/20140.186
Rosasco #Italy45.2538.562Grasses/cereal crops184/20140.840
LaReina #Spain37.819−4.862Grasses/cereal crops140/20140.076
140/20140.577
Barrax #Spain39.054−2.101Broadleaf crops149/20140.674
Albufera #Spain39.274−0.316needleleaf forests158/20140.186
175/20140.441
196/20140.648
219/20140.724
234/20140.816
Pshenichne #Ukraine50.07730.232Grasses/cereal crops163/20140.562
212/20140.885
Capitanata #Italy41.46415.487Grasses/cereal crops77/20140.802
Barrax #Spain39.054−2.101Broadleaf crops145/20150.489
203/20150.354
Pshenichne #Ukraine50.07730.232Grasses/cereal crops174/20150.623
188/20150.735
204/20150.785
Peyrousse #France43.6660.220Grasses/cereal crops174/20150.195
Urgons #France43.640−0.434Broadleaf crops174/20150.585
Creón #France43.994−0.047Evergreen broadleaf forests175/20150.641
Condom #France43.9740.336Grasses/cereal crops176/20150.354
Savenès #France43.8241.175Grasses/cereal crops176/20150.262
Collelongo #Italy41.85013.590Deciduous broadleaf forests189/20150.893
266/20150.896
Capitanata #Italy41.46415.487Grasses/cereal crops113/20150.907
UpperTana #Kenya−0.77236.974Grasses/cereal crops68/20160.544
* VALERI; # IMAGINES.
Publisher’s Note: MDPI stays neutral with regard to jurisdictional claims in published maps and institutional affiliations.

