Article

Dense Oil Tank Detection and Classification via YOLOX-TR Network in Large-Scale SAR Images

1
Key Laboratory of Digital Earth Science, Aerospace Information Research Institute, Chinese Academy of Sciences, Beijing 100094, China
2
International Research Center of Big Data for Sustainable Development Goals, Beijing 100049, China
3
College of Resources and Environment, University of Chinese Academy of Sciences, Beijing 100049, China
*
Author to whom correspondence should be addressed.
Remote Sens. 2022, 14(14), 3246; https://doi.org/10.3390/rs14143246
Submission received: 13 May 2022 / Revised: 29 June 2022 / Accepted: 4 July 2022 / Published: 6 July 2022
(This article belongs to the Section Remote Sensing Image Processing)

Abstract

:
Oil storage tank detection and classification in synthetic aperture radar (SAR) images play a vital role in monitoring energy distribution and consumption. Due to the SAR side-looking imaging geometry and multibouncing scattering mechanism, dense oil tank detection and classification tasks have faced more challenges, such as overlapping, blurred contours, and geometric distortion, especially for small-sized tanks. To address the above issues, this paper proposes YOLOX-TR, an improved YOLOX based on the Transformer encoder and structural reparameterized VGG-like (RepVGG) blocks, to achieve end-to-end oil tank detection and classification in densely arranged areas of large-scale SAR images. Based on YOLOX, the Transformer encoder, a self-attention-based architecture, is integrated to enhance the representation of feature maps and capture the region of interest of oil tanks in densely distributed scenarios. Furthermore, RepVGG blocks are employed to reparameterize the backbone with multibranch typologies to strengthen the distinguishable feature extraction of multi-scale oil tanks without increasing computation in inference time. Eventually, comprehensive experiments based on a Gaofen-3 1 m oil tank dataset (OTD) demonstrated the effectiveness of the Transformer encoder and RepVGG blocks, as well as the performance superiority of YOLOX-TR with a mAP and mAP0.5 of 60.8% and 94.8%, respectively.

Graphical Abstract

1. Introduction

Oil tanks are common energy storage devices for the bulk containment of petroleum products, such as crude oil, all over the world. The most commonly used ones are the vertical, cylindrical storage tanks above the ground, which can be divided into floating-roof tanks and fixed-roof tanks for storing different types of oils. Fixed-roof tanks are generally used for oil products with a vapor pressure of less than 1.5 Pisa, and floating-roof tanks are often used for storing crude oil with a stabilized vapor pressure of less than 11.1 Pisa [1]. Detecting the number and types of tanks is of great significance in monitoring the distribution and energy consumption of regional energy storage systems [2].
Remote sensing has become a convenient and effective way to detect oil tanks, which appear with typical circular features as artificial targets in captured images. In optical and thermal infrared images, the contours of oil tanks are relatively clear, and the detection method has been more mature. Traditional methods mainly based on man-made features achieve tank detection by extracting features such as shape, color, and texture through algorithms based on an improved Hough transform [3,4], saliency detection [5,6], template matching [3], image segmentation [7], etc. In contrast, deep-learning-based methods can automatically learn advanced features, have better generalization capability, and enable end-to-end and real-time object detection, which is the mainstream method at present. For example, Yu et al. [8] proposed Res2-Unet+ to achieve end-to-end oil tank detection in large-scale optical images that occupy the whole scene. Jiang et al. [9] combined an improved fast radial symmetry transform (FRST) algorithm with a CNN to achieve the accurate localization of oil tanks with floating roofs.
As an alternative means of Earth observation, synthetic aperture radar (SAR) has the advantage that it can capture images at night and see right through clouds and smoke, such that it can provide 24 h all-weather Earth observation. However, oil tank detection on SAR images mostly adopts a similar method as optical images in previous studies. Specifically, traditional methods mainly focus on the intensity, texture, structure, and distribution of oil tanks to construct target extractors. Among them, saliency-driven detection methods are adopted most frequently, which are usually based on other traditional feature extractors to obtain the visual salient parts such as the intensity specificity and texture distribution of oil tanks [10,11,12]. Additionally, methods based on the scattering characteristics of oil tanks on SAR images are also commonly adopted. Liu et al. [13] proposed a coastal oil tank detection method via the segmentation of strong scattering targets and the classifier of H/α in polarimetric SAR images. Villamillopez and Stilla [14] proposed a method for the automatic estimation of the maximum capacity and classification of a given oil tank using coherent scatters. Xu et al. [15] proposed a method that combines quasicircular shadows and highlighting arcs to detect oil tanks with higher precision and fewer false alarms. However, traditional methods for oil tank detection are only suitable for manually cropped areas instead of whole-scene images, which greatly limits the practical application value of these methods.
It is well-known that oil tanks are densely arranged for transportation and further processing, bringing more challenges for detection and classification. In high-resolution (HR) SAR images, oil tanks show more overlapping and discrete strong scattering centers, and the circumferential contour is inconsistent [16]. An isolated cylindrical tank shows relatively clear geometric and radiometric characteristics on well-focused SAR images. However, in densely distributed areas, the imaging features of tanks show high spatial correlation and are easily interfered with by more factors, such as overlapping, multipath scattering, side lobes, shadow, etc., which affect the integrity of tanks’ imaging. As a result, the contour of the oil tank is blurred and the geometry is distorted, making it more challenging to distinguish and extract the features of oil tanks.
The traditional methods for tanks’ detection in SAR images mentioned above need to design feature extractors manually, which cannot meet the needs of multiclass and multiscale oil tank detection in densely distributed areas of large-scale SAR images because of their low level of automation, poor robustness, and high false alarm rates. In contrast, deep-learning-based methods can automatically learn the discriminative features of oil tanks and have been introduced to studies on the oil tank detection of SAR images. Zhang et al. [17] proposed an improved Unet network based on edge-aware and cross-coupling attention, which improves the performance of multiscale oil tank detection in complex backgrounds in SAR images. Ma et al. [18] proposed an improved model based on an end-to-end Transformer network, achieving the 3D detection of oil tanks with floating roofs from a single SAR image. The existing studies on oil tank detection mainly focus on floating-roof oil tanks of a medium and large size, and there is a lack of research on the automatic classification of different types of oil tanks. It is still a great challenge to locate and classify oil tanks accurately in densely distributed areas on SAR images, especially those of a small size, due to the severe scattering overlapping, blurred contours, and geometry distortion.
In object detection tasks, the YOLO (you only look once) series [19,20,21,22,23] are excellent one-stage detectors that have a good balance between speed and accuracy and are widely adopted in industrial applications. The baseline YOLOX adopted in this paper is an anchor-free detector that presents some improvements to the YOLO series, such as replacing YOLO’s head with a decoupled one and switching YOLO detectors to an anchor-free manner. Anchor-free-based methods do not need to manually preset the scales and aspect ratios of anchors and are more suitable for multiscale oil tank detection. Moreover, YOLOX has several different standard models, including YOLOXs, YOLOXm, YOLOXl, etc. The coverage of high-resolution SAR images is relatively small, and the image resources are limited. The YOLOXs model requires the smallest computational cost and contains the least number of layers among the standard models of YOLOX. Therefore, we choose YOLOXs as the baseline to further optimize the whole architecture and pursue the best detection and classification performance of dense oil tanks in large-scale SAR images.
In response to the difficulties and problems of localization and classification caused by the blurred features and geometric distortion of dense oil tanks, a novel framework of dense oil tank detection and classification in large-scale SAR images named YOLOX-TR, an improved YOLOX based on the Transformer encoder and RepVGG blocks, is proposed in this paper. In order to assess the effectiveness and conduct a further experimental validation of our method, this paper builds a multiscale dataset (OTD) based on the Chinese Gaofen-3 (GF-3) satellite for oil tank detection and classification in SAR images, containing the two most common types of tanks. Ablation experiments and comparison experiments based on the OTD prove that, by taking advantage of the Transformer encoder and RepVGG blocks, YOLOX-TR can reach the best detection accuracy of dense oil tanks with a mAP and mAP0.5 of 60.8% and 94.8%, respectively, and can better deal with oil tank classification tasks.
The main contributions of this paper are summarized as follows:
(1)
To enhance the representation of feature maps and focus on the region of interest of oil tanks, the Transformer encoder is integrated into the YOLOX-TR, which can improve the localization accuracy of oil tanks in high-density areas.
(2)
To augment the extraction of discriminative features between the two types of multiscale oil tanks, YOLOX-TR employs structural reparameterized VGG-like (RepVGG) blocks to reparameterize the backbone with multi-branch typologies without increasing computation in inference time, which can help distinguish the two types of tanks and improve the classification accuracy.
(3)
To realize end-to-end detection in large-scale SAR images automatically, a slicing detection module based on sliding window detection and non maximum suppression (NMS) is employed to the detect layer of YOLOX-TR, which facilitates the deployment of the model in practical applications.
The remaining sections of this paper are organized as follows: Dataset construction and the proposed framework are introduced in Section 2. Section 3 shows the experimental results. A discussion follows in Section 4. Finally, our conclusions are drawn in Section 5.

2. Materials and Methods

For dense oil tank detection and classification in large-scale SAR images, the framework used in this study is shown in Figure 1, which includes four parts: (1) the construction of the oil tank dataset (OTD); (2) data augmentation for training; (3) the architecture of YOLOX-TR; (4) end-to-end inference of large-scale SAR images.

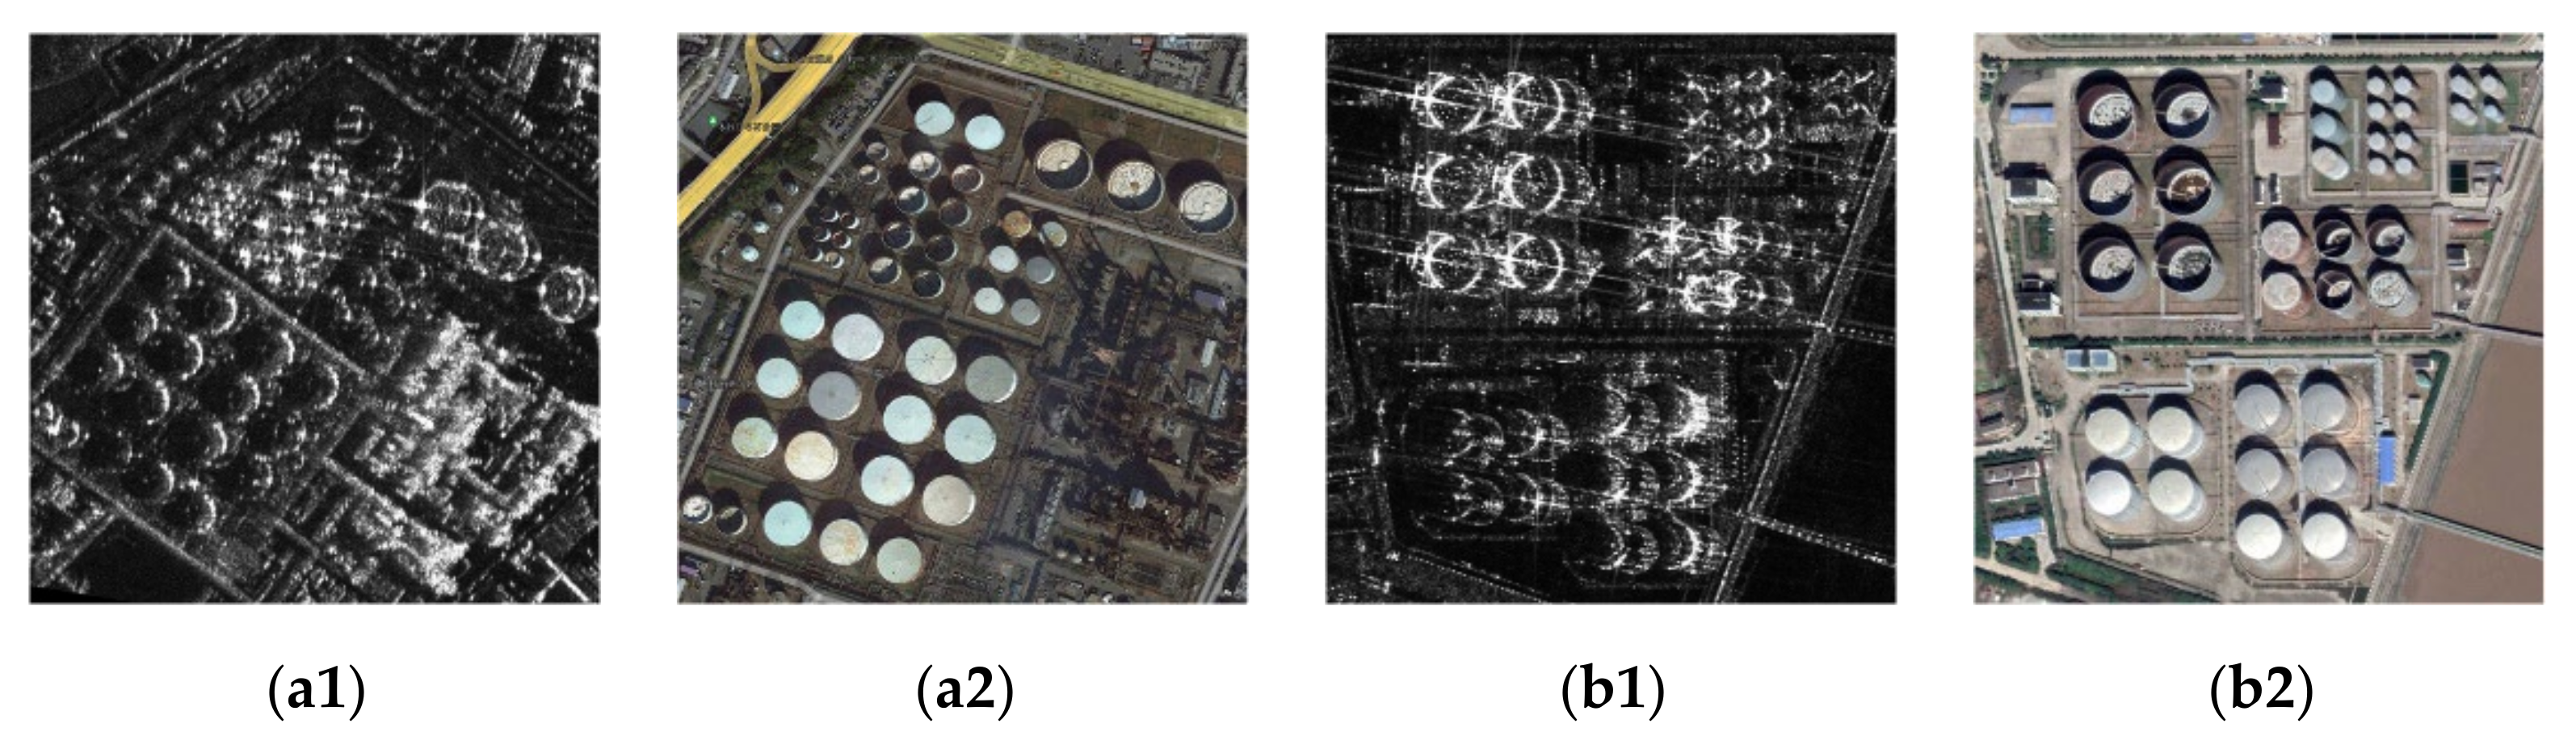
2.1. Dataset Construction

In order to realize oil tank classification and evaluate the effectiveness of the proposed model, we construct a multiscale oil tank dataset (OTD) from 27 scenes of Gaofen-3 SAR images with 1 m resolutions in spotlight (SL) mode from China, the United States, and Japan. Their incidence angles range from about 22° to 48°, with 8 ascending orbit images and 19 descending orbit images. Samples in the OTD contain two types of vertical and cylindrical oil tanks of various sizes: floating-roof tanks and fixed-roof tanks.
Oil storage tanks come in all sizes. Gross capacities range from 100 barrels (bbl) to over 1.5 MMbbl in a single storage tank. Corresponding tank sizes range from approximately 3 m to over 125 m in diameter and from 3 m to 15 m high. As shown in Figure 2, the scattering characteristics of oil tanks of different sizes are diverse in SAR images. The contours of the small-size oil tanks in Figure 2(a3,b3) are blurred, making them difficult to detect, especially in densely arranged areas. The largest oil tank scattering area in the OTD occupies approximately 200 × 200 pixels on GF-3 1 m SAR images, which is smaller than the size of the slices in the OTD, 640 × 640. When preparing the dataset, to maintain the robustness of our model in feature learning, incomplete oil tanks in the edge areas of the slices are marked as oil tank objects when the area in the slice exceeds 30% of the entire area of that oil tank. It should be mentioned that, since the geometric features of oil tanks with diameters smaller than 10 m almost completely disappear on GF-3 1 m SAR images and appear only as a strong scattering point, oil tanks with diameters less than 10 m are not considered in this paper.
Floating-roof tanks and fixed-roof tanks exhibit varied scattering characteristics on SAR images. As shown in Figure 3(a1–a3), for an isolated oil tank with a fixed roof, its components can be recognized. The highlighted and discontinuous circular structure as well as the strong scattering points A1, A2, and B1 are formed by the edge of the tank top and the edge of the tank bottom, and the circular shadow is formed by the tank body, which blocks the SAR signal. As shown in Figure 3(b1–b3), floating-roof tanks are designed with a roof that floats on the top of the liquid. The floating roof moves up and down as the liquid storage volume changes, forming a unique circle containing discrete scattering centers. The highlighted and discontinuous circular structures as well as the strong scattering points A1, A2, B1, and B2 are formed by the single reflection and multipath reflection of the top circumferential edge, the floating roof, and the bottom circumferential edge.
As shown in Figure 3(a2,b2), the isolated oil tank shows relatively clear geometric and radiometric characteristics on well-focused SAR images. However, because of the side-looking imaging geometry and multibouncing scattering mechanism, it is more challenging to locate and classify consecutive oil tanks in densely arranged areas. The majority of the slices of our dataset show a dense distribution of oil tanks. As we can see in Figure 4(a1,b1), there is a lot of side lobes interference on the GF-3 SL SAR images, and the unique SAR imaging technique causes more overlapping and geometric distortion among the adjacent tanks, which significantly increases the difficulty of locating and classifying oil tanks.
Based on the properties of the oil tanks on the SAR images, we construct an OTD with a diverse sample set, containing 1231 slices with a total of 7236 labeled dense oil tanks, to explore the potential of deep learning in dense oil tank detection and classification.

2.2. Construction of the YOLOX-TR Model

The entire architecture of YOLOX-TR is illustrated in Figure 1. We modify the original YOLOX to make it specialized for the detection and classification of dense oil tanks in large-scale SAR images. Compared to the original YOLOX, in order to improve the feature extraction in densely arranged areas, we applied the Transformer encoder to the backbone and the neck to enhance the representation of feature maps and the ability to find the region of interest of dense oil tanks in large region coverage. Then, to augment the discriminative feature extraction between the two types of multiscale oil tanks, in the backbone part we replace the original convolutional base layers with structural reparameterized VGG-like (RepVGG) blocks to convert the model to a decoupling of training time and inference time architecture, which enables the training-time model to have a multibranch topology without increasing computations of the inference-time model. We name the new backbone network RepCSP. Lastly, to realize the end-to-end detection of large-scale SAR images automatically, we employ a slicing detection module to the detect layer of the proposed model.

2.2.1. Overview of YOLOX-TR

The architecture of YOLOX-TR can be divided into three parts: (1) a RepCSP backbone for feature extraction; (2) a path aggregation feature pyramid network (PAFPN) [24] neck for feature aggregation; and (3) a decoupled YOLOX head [23] for prediction and regression.
As shown in Figure 1, the complete training process of our model mainly contains three parts. Firstly, input images with a size of 640 × 640 to the RepCSP backbone for feature extraction to obtain three effective feature layers with resolutions of 80 × 80, 40 × 40, and 20 × 20 from dark3, dark4, and dark5, respectively. Then, input the three effective feature layers with different levels to the PAFPN neck for feature fusion to obtain the enhanced effective feature layers P3, P4, and P5 with resolutions of 80 × 80, 40 × 40, and 20 × 20, respectively. Specifically, the PAFPN realizes feature fusion by upsampling and downsampling the feature maps of different sizes, which can effectively enhance the ability of our network to capture the features of small-size oil tanks. Finally, the enhanced feature layers, P3, P4, and P5, obtained from the PAFPN are passed into the YOLOX head to obtain the prediction results.
The decoupled head divides the classification and localization into two parts, which are integrated together in the final prediction step. As shown in Figure 5, for each feature layer, we can obtain three prediction results, i.e., reg, obj, and cls. Specifically, reg represents the regression parameters of predictions, and the position of the bounding box can be obtained from regression parameters. Obj denotes the probability of containing objects of each predicted bounding box. Cls represents the probability of objects in predictions belonging to a certain class. YOLOX-TR uses the leading label optimal transport assignment (SimOTA) [23] strategy to match the positive and negative samples dynamically for loss calculation. Firstly, SimOTA calculates the loss for each prediction–ground truth (GT) pair, after which it selects the top predictions with the least loss within a fixed center region as its positive samples. Finally, the corresponding grids of those positive predictions are assigned as positives, while the rest of the grids are negatives. We use binary cross entropy (BCE) loss for training the cls and obj branches in addition to Intersection over Union (IoU) loss for training the reg branch. After obtaining the final prediction results, score ranking and the non maximum suppression (NMS) algorithm [22] are utilized to filter out the prediction box that satisfies the confidence score and remove duplicative bounding boxes.
In order to realize the end-to-end detection of large-scale SAR images automatically, we add a slicing detection module based on sliding window detection and NMS to the end of the detect layer of YOLOX-TR. As shown in the inference module of Figure 1, firstly, the large-scale SAR image that occupies the whole scene is cropped into slices by a slicing window with an overlapping ratio. The overlapping slicing can prevent the side influence of incomplete oil tanks on the edges of slices. Then, the slices are detected in turn with the trained YOLOX-TR model and the detection results are recorded. Lastly, NMS is utilized to eliminate the redundant detection boxes in the overlapping areas of all slices.

2.2.2. Transformer Encoder

By analyzing the oil tank dataset and the detection performance of the baseline YOLOX, we find that the missing targets are mainly densely distributed small-sized tanks with fixed roofs. Inspired by the successes of vision Transformer in image classification tasks [25] as well as the current Transformer-based detectors in pushing the accuracy SOTA (state of the art) in objection recognition [26], we replace some CSPLayer [22] blocks with a sequence of three Transformer encoders, the self-attention-based architecture, to the original version of YOLOX. The Transformer encoder can capture global information and abundant contextual information [27]. It can also enhance the representation of feature maps and capture the scattering distribution relationships between oil tanks with the self-attention mechanism [28].
The Transformer encoder depicted in Figure 6 consists of alternating layers of a multihead self-attention ( M S A ) mechanism and a fully connected feed-forward network. We employ residual connections around each of the two sublayers to avoid the danger of gradient disappearance. The multimechanism is used to capture the distribution relationship between oil tank features. The feed-forward network, which is practically equivalent to multilayer perceptron ( M L P ), is applied to each position separately and identically for further encoding information learning.
Given a feature map, X R H × W × C , from the SPP module in dark5 or the P4 module in the PAFPN neck, we first reshape it to a 1D sequence, X p R N × C , where ( H , W ) is the resolution of the feature map, N = H × W , and C is the number of channels. Then, we use standard learnable 1D position embedding [29] to add a position vector ( P V ) to each input element, considering the inputs as a sequence, and the resulting sequence of the embedding vector serves as an input, Z , to the Transformer encoder:
Z = x p 1 + P V 1 , x p 2 + P V 2 , , x p N + P V N R N × C
The P V contains the relative position information of oil tanks in SAR images and keeps the spatial information after reshaping the dimension. For each element in the input sequence Z R N × C , we calculate the query, key, and value metrics by multiplying them by the weight metrics. Then, we obtain a triple of ( Q , K , V ) R N × d :
Q = Z W Q , K = Z W K , V = Z W V
where W Q , W K , W V R C × d denote the learnable linear transformation parameters of the d dimension triplet ( Q , K , V ) . The self-attention function of M S A can be described as mapping a query and a set of key–value pairs to an output. We compute the outputs of the self-attention layers as:
S A ( Z ) = S o f t max Q K T d V
This paper utilizes multihead self-attention to further expand the model’s ability to focus on different features of multiscale oil tanks with different roofs. Additionally, multiheaded attention provides the attention layer with multiple representation subspaces. We use four attention heads for each Transformer encoder. M S A is calculated by:
M S A ( Z ) = S A 1 Z ; S A 2 Z ; ; S A h Z W O
where W O R h N × d stands for the learnable weights metrics of h self-attentions. Then, the result of M S A adds the original input, Z , and goes through the feed-forward layer:
Z l = M S A ( Z ) + Z l 1
Z l = M L P ( Z l ) + Z l
where M L P contains two layers with a ReLU nonlinearity. As shown in Figure 6, considering the high computation and memory cost of the Transformer encoder, we only apply this module to the end of the backbone and the end of the neck of the baseline YOLOX. Specifically, the layers combined with Transformer encoders are high-level, low-resolution feature maps that contain richer global and semantic information and require less computation and memory costs.

2.2.3. Reparameterized Backbone RepCSP

Enhancing the distinguishable feature extraction of multiscale dense oil tanks is the key to improving detection and classification performance. To achieve this goal, we reparameterize the convolutional base layers of the backbone with multibranch typologies by RepVGG. RepVGG is a simple but powerful VGG-style ConvNets that decouples the training time multibranch topology and inference time architecture of the model using structural reparameterization. It has an excellent performance on ImageNet classification and shows a favorable speed–accuracy trade-off [30]. Inspired by the reparameterization technique, we replace the convolutional base blocks of each dark with RepVGG blocks in the original CSPdarknet53 backbone and name the redesigned backbone RepCSP.
As shown in Figure 7, the training time RepVGG uses the identity and the 1 × 1 branches for each 3 × 3 convolutional layer, which is inspired by ResNet, but in a different way the branches can be removed by structural reparameterization in inference time. Therefore, the training time information flow of the RepVGG block is y = x + g x + f x , where g x is a convolutional shortcut implemented by a 1 × 1 convolutional layer, and f x is a ResNet-like identity. In the inference process, transformation is performed to convert the multibranch structure to a single-path structure consisting of only 3 × 3 convolutional layers and SiLU layers.
Formally, we use C o n v 3 R C 2 × C 1 × 3 × 3 to denote the kernel of a 3 × 3 convolutional layer with C 1 input channels and C 2 output channels, and C o n v 1 R C 2 × C 1 for the kernel of a 1 × 1 branch. We use μ 3 , σ 3 , γ 3 , and β 3 as the accumulated mean, standard deviation, and learned scaling factor and bias, respectively of the batch normalization (BN) layer following 3 × 3 convolutional layer; μ 1 , σ 1 , γ 1 , and β 1 for the BN layer following a 1 × 1 convolutional layer; and μ 0 , σ 0 , γ 0 , and β 0 for the identity branch. Let M o u t R N × C 2 × H 2 × W 2 and M i n R N × C 1 × H 1 × W 1 be the output and input of a trained RepVGG block, respectively, and be the convolution operator. If C 1 = C 2 , H 1 = H 2 , and W 1 = W 2 , we have:
M o u t = b n M i n C o n v 3 , μ 3 , σ 3 , γ 3 , β 3 + b n M i n C o n v 1 , μ 1 , σ 1 , γ 1 , β 1 + b n M i n , μ 0 , σ 0 , γ 0 , β 0
where b n is the batch normalization function, formally:
b n M = γ M μ σ + β
We convert every batch normalization layer and its preceding conv layer into a conv with a bias vector. Let C o n v f u s e d , b f u s e d be the kernel and the bias be converted from C o n v , μ , σ , γ , β ; we have:
C o n v f u s e d = γ σ C o n v , b f u s e d = μ γ σ + β
b n M C o n v = M C o n v f u s e d + b f u s e d
This transformation also applies to the identity branch because an identity matrix can be viewed as a 1 × 1 C o n v with an identity matrix as the kernel. RepVGG only has one single type of operator: a 3 × 3 C o n v followed by batch normalization and an activation function, which makes RepVGG fast, memory-economical and flexible.
Moreover, although YOLOXs is the smallest model among the standard models of YOLOX, there are still redundant channels in YOLOXs for the task of oil tank detection, since the magnitude and shape of oil tanks are relatively stable on SAR images. Channel pruning [31] is performed to remove the redundant channels to make our model more memory-economical and efficient.

3. Experiments and Results

To evaluate the effectiveness of the Transformer encoder and RepVGG blocks in YOLOX-TR, we implemented a series of ablation experiments. Furthermore, the detection performance of YOLOX-TR is compared with other commonly used object detectors.

3.1. Dataset and Setting

The OTD has 1231 positive samples with a size of 640 × 640, including a total of 2704 labeled floating-roof tanks and 4532 labeled fixed-roof tanks. The linear stretching process is applied to the over-dark and over-bright images to adjust the luminance of the image slices before training. The dataset is divided into a training set, a validation set, and a test set in the ratio of 8:1:1. To enhance the generalization and robustness of the model in complex scenes, this paper employs a bag of effective data augmentation strategies to extend the diversity of the training samples.
Oil tanks are usually densely arranged in specific areas such as ports, so the background information contained in the sample slices is similar. As a result, when the inputs are large-scale SAR images instead of manually cropped areas, some artificial targets, such as circular buildings and small reservoirs, easily disturb the detection performance, increasing the false alarm ratio. Therefore, adding negative sample sets containing complex backgrounds can greatly suppress false alarms. Specifically, in this paper, negative samples containing objects of various shapes, such as buildings, vegetation, and water bodies from GF-3 1 m SAR images, are added to the training set to reduce the false alarms. In addition to random scaling, cropping, panning, and rotation, two special data augmentation techniques are provided in YOLOX-TR: mosaic [22] and mixup [32]. The mosaic technique randomly crops four images and splices them into one image to enrich the background and indirectly increase the batch size. The mixup technique generates a weighted combination of random image pairs from the training data to reduce the memorization of corrupt labels, increasing the robustness of adversarial examples.
In YOLOX-TR, we use a combination of adding negative samples, mosaic, mixup, and some traditional geometry transformations in data augmentation for training.

3.2. Implementation Details

In the training process, our settings are mostly consistent from the baseline to our proposed model. We train the YOLO models for a total of 300 epochs with 3 warmup epochs based on the OTD. We use stochastic gradient descent (SGD) for training. We use a learning rate of an initial lr = 0.01 and the cosine lr schedule. The weight decay is 0.0005 and the SGD momentum is 0.9. The batch size is 32. The main comparison experiments with other object detection algorithms are based on the mmdetection platform (https://github.com/open-mmlab/mmdetection, accessed on 15 April 2022). All experiments in this article are performed on an operating system equipped with an NVIDIA GeForce RTX 3090 and Ubuntu 18.4. During the inference phase, the large-scale SAR image is firstly cropped into slices by a sliding window of 1028 × 1028 pixels with an overlap ratio of 0.3. The outputs of all slices are stitched together with a confidence threshold of 0.5 and NMS with an IoU threshold of 0.5 is operated to obtain the final result of the large-scale SAR image.

3.3. Evaluation Metric

We use several widely adopted metrics, such as precision, recall, F 1 score, and mean average precision ( m A P ) [33], to evaluate the detection performance quantitatively.
The precision measures the model’s accuracy in classifying a sample as positive, which is calculated as the ratio between the number of positive samples correctly classified to the total number of samples classified as positive:
P = T p T p + F p
where P represents precision, T p represents the number of positive samples correctly classified and F p represents the number of negative samples misclassified as positive.
The recall measures the model’s ability to detect positive samples, which is calculated as the ratio between the number of positive samples correctly classified as positive to the total number of positive samples:
R = T p T p + F n
where R represents precision and F n represents the number of positive samples misclassified as negative.
The F 1 score measures the balance between the precision and recall appropriately. The higher the F1 score, the better the balance is between the precision and recall. F 1 score is defined as follows:
F 1 = 2 P × R P + R
The mean average precision compares the GT bounding box to the detected box and returns a score; the higher the score, the more accurate the model is in its detections. To perform the calculation of average precision ( A P ) for object detection, Intersection over Union ( I o U ) needs to be calculated first. Intersection over Union is defined as the ratio of the area of the intersection and the area of the union of the predicted bounding box and the GT bounding box:
I o U = A r e a ( B p r e B g t ) A r e a ( B p r e B g t )
where B p r e and B g t represent the predicted bounding box and ground truth bounding box, respectively. The general definition of average precision is the area under the precision–recall curve.
A P = 0 1 P R d R
The precision and recall are always between 0 and 1. Therefore, the A P also falls within 0 and 1. The mean average precision is the mean of the A P for all classes.
m A P = 1 n k = 1 k = n A P k
where A P k is the average precision of class k and n is the number of classes. In our experiments, the m A P is the COCO [34] m A P 0.5 : 0.95 , which corresponds to the average A P for I o U from 0.5 to 0.95 with a step size of 0.05. m A P 0.5 means a m A P with an I o U = 0.5 . Moreover, we use the floating point operations per second (FLOPS) to measure the computational performance of models.

3.4. Ablation Experiments

To evaluate the performance of the proposed model and analyze the influence of each designed component, we performed four sets of ablation experiments; the results are shown in Table 1 and Table 2. Without specific notes, all of the experiment settings were the same.
Effect of the Transformer encoder: The third row of Table 1 and the third row of Table 2 show the performance of the baseline with the Transformer encoder. The Transformer encoder has a gain of 1.61% in mAP and 2.01% in mAP0.5. In terms of classification performance, the Transformer encoder has a gain of 3.1% in AP0.5 and 2.7% in AP0.5:0.95 for fixed-roof oil tanks.
Furthermore, we conducted an ablation experiment to evaluate the influence of adding the Transformer encoder into different positions of our network. Since the Transformer encoder would increase the computation and memory costs and applying the Transformer encoder to low-resolution feature maps can decrease the expensive computation and memory costs, we only tested the performance of adding the Transformer encoder to the end of the backbone and the end of the neck. The experimental results are shown in Table 3. Adding the Transformer encoders to both the end of the backbone and the end of the neck improves mAP by 0.76% compared to adding transformer encoders at the end of the backbone only. Although adding the Transformer encoder increases the computation and memory costs of the network, the detection performance of the network is improved.
Effect of RepVGG blocks: The second row of Table 1 and the second row of Table 2 show the result of the baseline combining RepVGG blocks. The RepVGG block has a gain of 1.18% in mAP, 1.66% in mAP0.5, and a gain of 2.6% in AP0.5 and 2% in AP0.5:0.95 for fixed-roof oil tanks.
Overall, both the Transformer encoder and the RepVGG block have effectively improved the detection performance of dense oil tanks. YOLOX-TR reaches 60.80% mAP, an improvement of 2.45% compared to the baseline YOLOX. Furthermore, in Table 2, the AP0.5:0.95 of floating-roof tanks of the baseline YOLOX is 68.3%, which is higher than that of fixed-roof tanks by about 20%. Therefore, in our dataset, it is more challenging to detect fixed-roof tanks than floating-roof oil tanks. The proposed model, YOLOX-TR, which improves the AP0.5:0.95 of fixed-roof tanks by about 4%, can better deal with the task of detecting oil tanks in densely arranged areas.
To further investigate the performance of the proposed model, YOLOX-TR, a large-scale SAR image test is carried out to visualize the detection improvements of the proposed model. The test image is a GF-3 SL SAR image of Yokohama, Japan, with 1 m resolution, an incident angle of 43.8°, and containing 12,786 × 12,487 pixels. In this scene, there are a large number of small- and medium-sized tanks densely arranged in the port, and most of them are fixed-roof tanks. The detection result of the full SAR image is shown in Figure 8. We selected three densely arranged regions to further compare the detection results of the original YOLOX and the redesigned model, YOLOX-TR. According to the visualization results in Figure 9, the missing targets of the baseline YOLOX are mainly dense oil tanks of small size, and YOLOX-TR can better deal with the task of detecting dense oil tanks and small oil tanks.

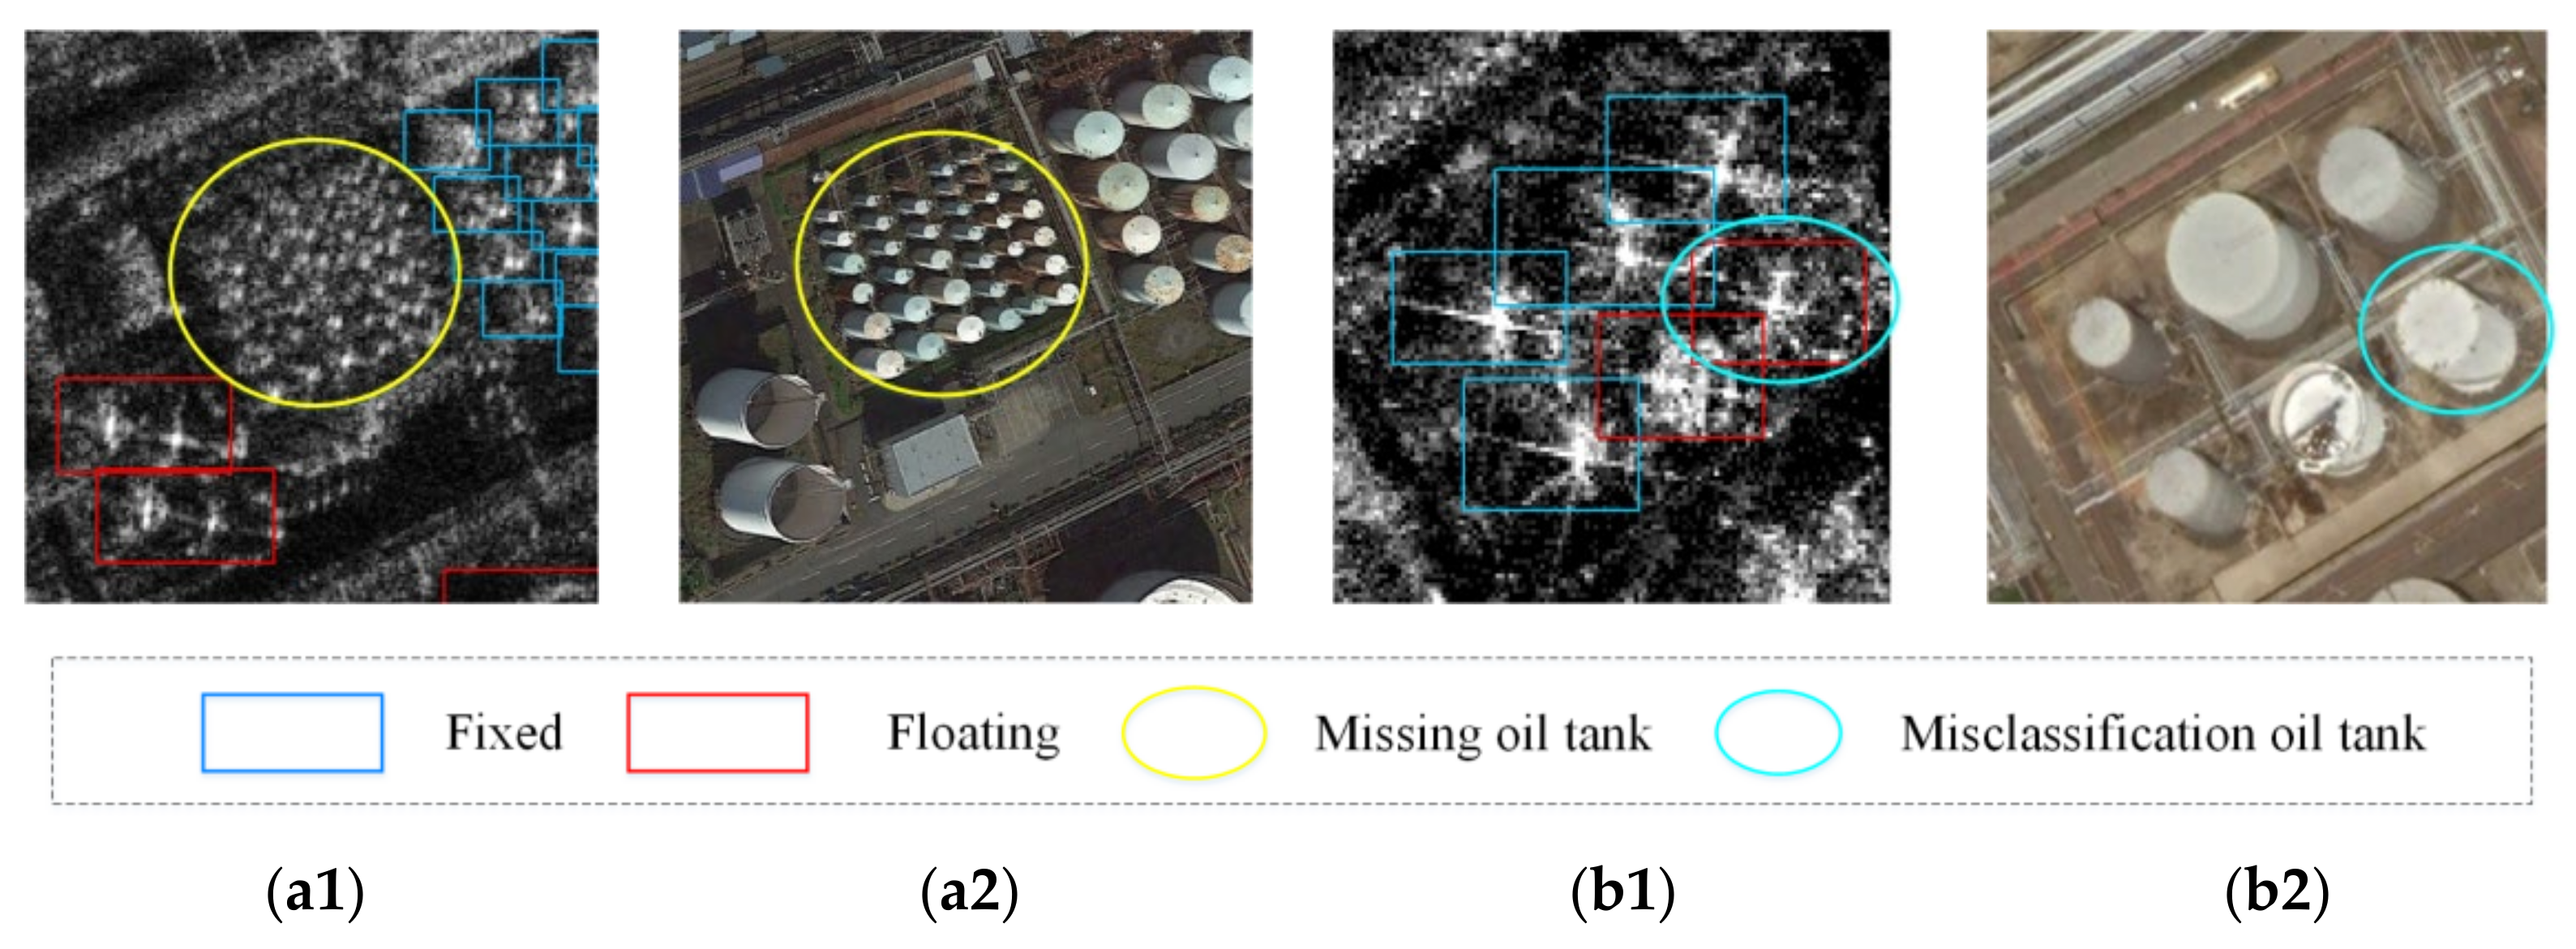
3.5. Comparison with Other Detectors

To further verify our method, we compared it with several other detectors commonly used in the natural scene, optical remote sensing, and SAR images. As shown in Table 4, we use one-stage detectors, including RetinaNet [35], SSD [36], and YOLOv5, and a two-stage detector: Faster R-CNN [37]. The results show that the proposed model, YOLOX-TR, has the best mAP0.5 compared with the other models. Specifically, the mAP0.5 of YOLOX-TR is 94.8%, which is 14.1%, 10.4%, 9.8%, and 3% higher than RetinaNet, Faster RCNN, SSD, and YOLOv5, respectively. The GFLOPS of SSD are the highest, and those of YOLOv5 are the lowest. As shown in the first row of Table 1, the GFLOPS of the baseline YOLOX are 26.6, which is larger than YOLOv5 because of the decoupled head and SimOTA strategy adopted in YOLOX. YOLOX-TR has relatively few GFLOPS totaling 26.1.
To visually demonstrate the detection performance of YOLOX-TR compared to other detectors, Figure 10 shows the comparative results for different methods based on the OTD. As can be seen from the second column of Figure 10, RetinaNet has the worst detection performance, can only detect medium- and large-sized oil tanks, and has the highest false alarm rate, incorrectly detecting several buildings as fixed-roof oil tanks. From the third and fourth columns, it can be seen that Faster RCNN and SSD can detect most of the tanks but perform poorly in detecting dense groups of small-sized fixed-roof tanks, and easily misclassify small floating-roof tanks as fixed-roof tanks. From the fourth and last column, it can be seen that both YOLOv5 and YOLOX-TR can correctly classify oil tanks, but YOLOv5 has a few false alarms and missing detections compared to YOLOX-TR.

4. Discussion

The results of the ablation experiments show that the Transformer encoder and RepVGG block can effectively improve the performance of YOLOX-TR in locating and classifying continuous oil tanks in high-density areas. The Transformer encoder can learn the distribution relationship and find the region of interest of oil tanks via the self-attention mechanism. It can also enhance the representation of feature maps. The results in Table 1, Table 2 and Table 3 demonstrate the effectiveness of the Transformer encoder in improving detection accuracy and classification accuracy. The RepVGG block can augment the discriminative features extraction of the two types of oil tanks in various sizes by the structural reparameterization mechanism. The results in Table 1 and Table 2 show that the RepVGG block can help distinguish the two types of oil tanks and improve the detection performance. Additionally, experimental results of comparison with other commonly used detectors show the performance superiority of YOLOX-TR in dense oil tank detection and classification in large-scale SAR images with a mAP0.5 of 94.8%.
From the perspective of the model’s applicability and detection performance, YOLOX-TR balances the accuracy and computation FLOPS of the network. As shown in the first row and last row of Table 1, YOLOX-TR has smaller GFLOPS while showing improved mAP by 2.45% compared with the baseline YOLOX. In detail, the layers that the Transformer encoders applied are high-level, low-resolution feature maps that facilitate the capturing of richer global information and require less computation and memory cost. Meanwhile, the reparameterization mechanism of RepVGG enables the model to infer in a single-path structure that would not increase computation cost in inference time. For application in large-scale SAR image detection, we employ a slicing detection module to the detection layer to realize end-to-end detection. Therefore, compared with the traditional methods mentioned in the introduction, YOLOX-TR can better meet the needs of practical applications. Lastly, it is worth mentioning that we build a multiscale dataset based on the GF-3 SL SAR images (OTD) to realize oil tank detection and classification, containing the two most common types of tanks.
Although we have achieved promising results in dense oil tank detection and classification, as shown in Figure 11(a1), this paper does not consider oil tanks less than 10 m in diameter, which may lead to missed detections and false alarms in areas where small-sized tanks are densely aligned. In addition, the high spatial correlation between SAR image pixels makes the scattering features of adjacent objects mixed, especially on poorly focused SAR images, leading to incomplete tank imaging and affecting the detection results. For example, in Figure 11(b1), when floating-roof tanks and fixed-roof tanks in the same area are distributed too close to each other, the overlapping features can easily lead to misclassification.

5. Conclusions

Oil tank detection and classification is a popular application of high-resolution SAR and optical remote sensing images. Unlike optical images, adjacent oil tanks in SAR images exhibit more overlap and geometric distortion due to the side-looking imaging geometry and multibouncing scattering mechanism, making it a challenging task to detect and classify oil tanks in densely distributed areas, especially for small-sized oil tanks. To meet the needs of practical applications, an end-to-end dense oil tank detection and classification method for large-scale SAR images named YOLOX-TR, an improved YOLOX, is proposed. To improve the detection performance of dense oil tanks, we employ the Transformer encoder, a self-attention-based architecture to the baseline YOLOX, which can enhance the representation of feature maps and capture the region of interest of oil tanks in densely distributed scenarios. Moreover, we replace the original convolutional base layers of the backbone with structural reparameterized VGG-like (RepVGG) blocks to enable the training time model to have a multibranch topology that can augment the extraction of the discriminative feature of multiscale oil tanks without increasing computation in inference time. The results of ablation experiments demonstrate the effectiveness of both the Transformer encoder and RepVGG blocks. Additionally, compared with the other commonly used methods, YOLOX-TR shows performance superiority in detection and classification, with a mAP and mAP0.5 of 60.8% and 94.8%, respectively.
Enhancing discriminative feature extraction is the key to the object detection and classification of SAR images. The application of YOLOX-TR in dense oil tank detection and classification is potentially applicable to other dense object detection in large-scale SAR images, such as ship detection and aircraft detection. In further research, we will continue to verify the performance of YOLOX-TR applied to other dense object detection in large-scale SAR images.

Author Contributions

Conceptualization, Q.W. and B.Z.; methodology, Q.W.; software, Q.W. and C.X.; validation, Q.W., B.Z., H.Z. and C.W.; formal analysis, Q.W.; investigation, C.X., B.Z., H.Z. and C.W.; resources, C.W.; data curation, C.W.; writing—original draft preparation, Q.W.; writing—review and editing, B.Z., C.X., H.Z. and C.W.; visualization, Q.W.; supervision, B.Z.; project administration, C.W.; funding acquisition, C.W. All authors have read and agreed to the published version of the manuscript.

Funding

This research was partially funded by the National Natural Science Foundation of China (Grant No. 41930110) and Basic Research Project (514010503-204).

Data Availability Statement

Not applicable.

Acknowledgments

We sincerely thank the China Center for Resources Satellite Data and Application for providing Gaofen-3 SAR images.

Conflicts of Interest

The authors declare no conflict of interest.

References

  1. Pullarcot, S. Above Ground Storage Tanks: Practical Guide to Construction, Inspection, and Testing; Taylor & Francis Group, LLC: Amsterdam, The Netherlands, 2015. [Google Scholar]
  2. Semadeni, M. Storage of Energy, Overview. Encyclopedia of Energy; Cleveland, C.J., Ed.; Elsevier: New York, NY, USA, 2004; pp. 719–738. [Google Scholar]
  3. Zhang, W.S.; Wang, C.; Zhang, H.; Wu, F.; Tang, Y.X.; Mu, X.P. An Automatic Oil Tank Detection Algorithm Based on Remote Sensing Image. J. Astronaut. 2006, 6, 1298–1301. [Google Scholar]
  4. Han, X.W.; Fu, Y.L.; Li, G. Oil Depots Recognition Based on Improved Hough Transform and Graph Search. J. Electron. Inf. Technol. 2011, 33, 66–72. [Google Scholar] [CrossRef]
  5. Wang, W.; Zhao, D.; Jiang, Z. Oil Tank Detection via Target-Driven Learning Saliency Model. In Proceedings of the 2017 4th IAPR Asian Conference on Pattern Recognition (ACPR), Nanjing, China, 26–29 November 2017. [Google Scholar]
  6. Jing, M.; Zhao, D.; Zhou, M.; Gao, Y.; Jiang, Z.; Shi, Z. Unsupervised Oil Tank Detection by Shape-Guide Saliency Model. IEEE Geosci. Remote Sens. Lett. 2019, 16, 477–481. [Google Scholar] [CrossRef]
  7. Wang, T.; Li, Y.; Yu, S.; Liu, Y. Estimating the Volume of Oil Tanks Based on High-Resolution Remote Sensing Images. Remote Sens. 2019, 11, 793. [Google Scholar] [CrossRef] [Green Version]
  8. Yu, B.; Chen, F.; Wang, Y.; Wang, N.; Yang, X.; Ma, P.; Zhou, C.; Zhang, Y. Res2-Unet+, a Practical Oil Tank Detection Network for Large-Scale High Spatial Resolution Images. Remote Sens. 2021, 13, 4740. [Google Scholar] [CrossRef]
  9. Jiang, H.; Zhang, Y.; Guo, J.; Li, F.; Hu, Y.; Lei, B.; Ding, C. Accurate Localization of Oil Tanks in Remote Sensing Images via FGMRST-Based CNN. Remote Sens. 2021, 13, 4646. [Google Scholar] [CrossRef]
  10. Zhang, L.B.; Liu, C.Y. A Novel Saliency-Driven Oil Tank Detection Method for Synthetic Aperture Radar Images. In Proceedings of the 2020 IEEE International Conference on Acoustics, Speech, and Signal Processing, Barcelona, Spain, 4–8 May 2020; pp. 2608–2612. [Google Scholar]
  11. Zhang, L.B.; Wang, S.; Liu, C.; Wang, Y. Saliency-Driven Oil Tank Detection Based on Multidimensional Feature Vector Clustering for SAR Images. IEEE Geosci. Remote Sens. Lett. 2019, 16, 653–657. [Google Scholar] [CrossRef]
  12. Zhang, L.; Liu, C. Oil Tank Detection Using Co-Spatial Residual and Local Gradation Statistic in Sar Images. In Proceedings of the 2019 IEEE International Conference on Image Processing (ICIP), Taipei, Taiwan, 22–25 September 2019; pp. 2000–2004. [Google Scholar]
  13. Liu, C.; Xie, C.; Yang, J.; Xiao, Y.; Bao, J. A method for coastal oil tank detection in polarimetric SAR images based on recognition of T-shaped harbor. J. Syst. Eng. Electron. 2018, 29, 499–509. [Google Scholar]
  14. Lopez, C.V.; Stilla, U. Monitoring of Oil Tank Filling With Spaceborne SAR Using Coherent Scatterers. IEEE J. Sel. Top. Appl. Earth Obs. Remote Sens. 2021, 14, 5638–5655. [Google Scholar] [CrossRef]
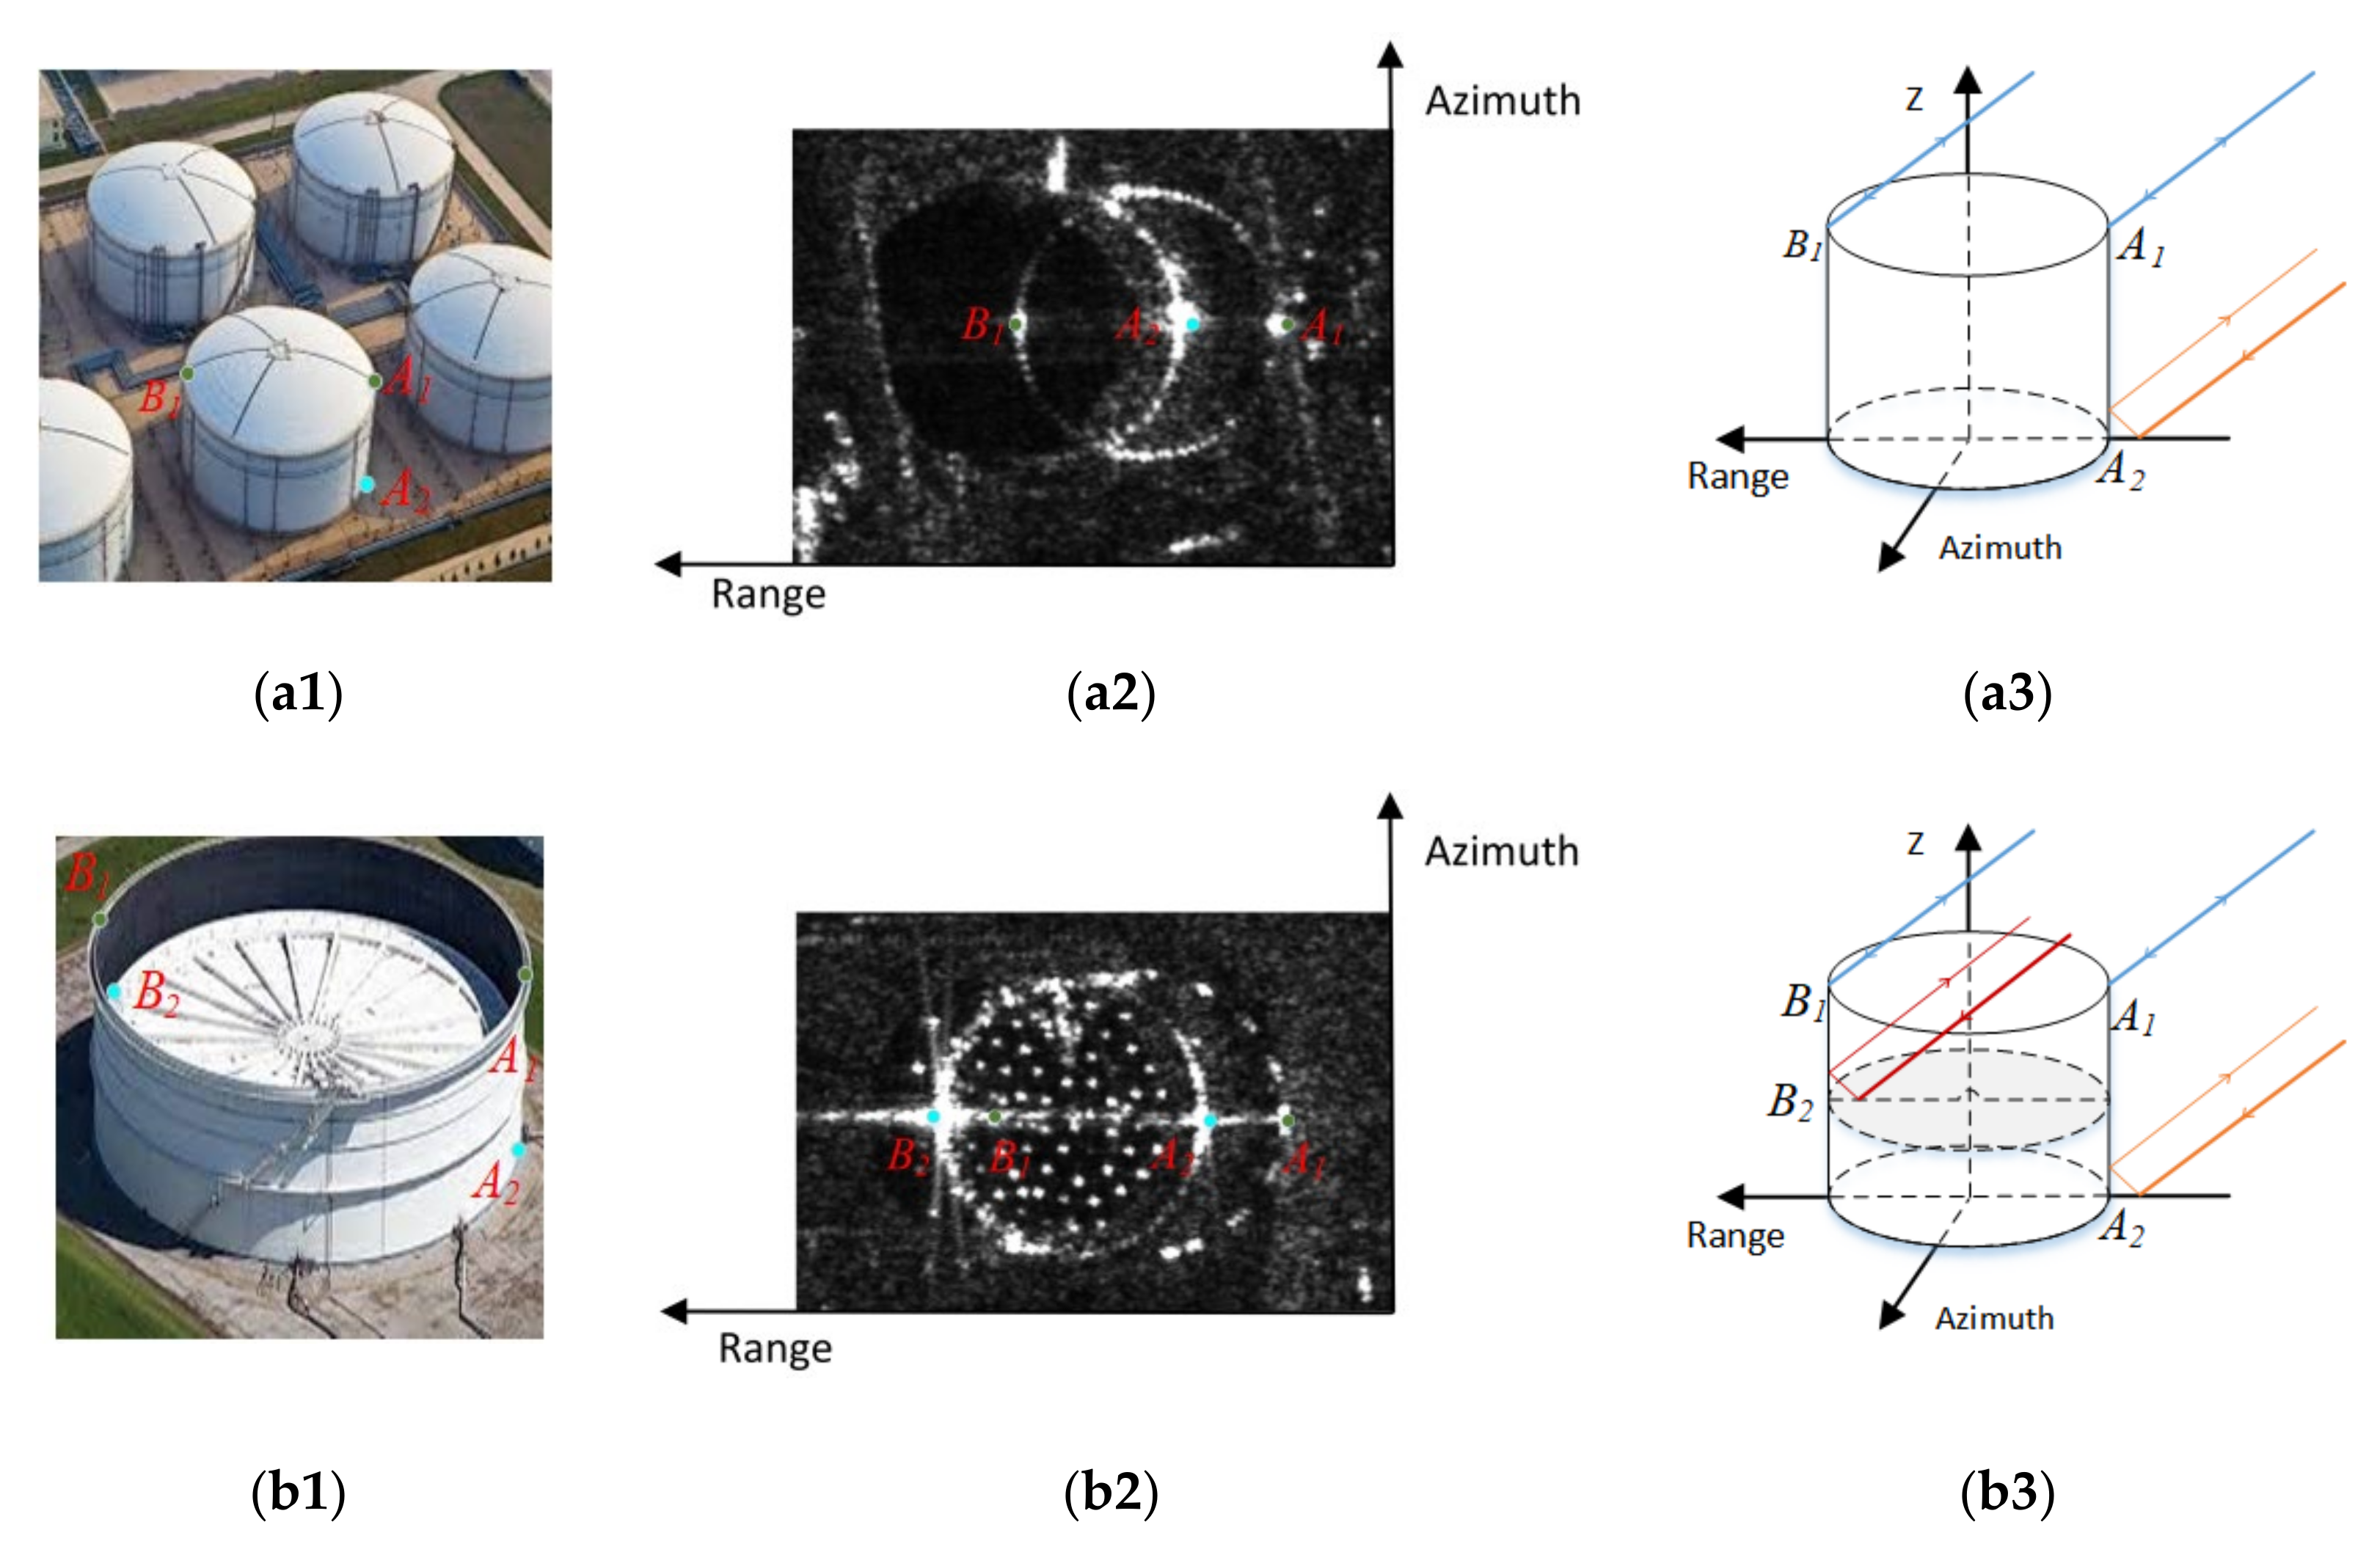
  15. Xu, H.P.; Chen, W.; Sun, B.; Chen, Y.; Li, C. Oil tank detection in synthetic aperture radar images based on quasi-circular shadow and highlighting arcs. J. Appl. Remote Sens. 2014, 8, 083689. [Google Scholar] [CrossRef]
  16. Zhang, Y.T.; Chen, H.Z.; Ding, C.B.; Wang, H.Q. The multi-path scattering characteristics and the geometry extraction of cylinder tanks in SAR image. J. Infrared Millim. Waves 2012, 31, 379–384. [Google Scholar] [CrossRef]
  17. Zhang, L.; Zhang, L.; Zhu, W. Target Detection Based on Edge-Aware and Cross-Coupling Attention for SAR Images. IEEE Geosci. Remote Sens. Lett. 2022, 19, 1–5. [Google Scholar] [CrossRef]
  18. Ma, C.; Zhang, Y.; Guo, J.; Hu, Y.; Geng, X.; Li, F.; Lei, B.; Ding, C. End-to-End Method with Transformer for 3D Detection of Oil Tank from Single SAR Image. IEEE Trans. Geosci. Remote Sens. 2021, 60, 1–19. [Google Scholar]
  19. Redmon, J.; Divvala, S.; Girshick, R.; Farhadi, A. You Only Look Once: Unified, Real-Time Object Detection. In Proceedings of the 2016 IEEE Conference on Computer Vision and Pattern Recognition (CVPR), Las Vegas, NV, USA, 27–30 June 2016. [Google Scholar]
  20. Redmon, J.; Farhadi, A. YOLO9000: Better, Faster, Stronger. In Proceedings of the 2017 IEEE Conference on Computer Vision and Pattern Recognition (CVPR), Honolulu, HI, USA, 21–26 July 2017. [Google Scholar]
  21. Redmon, J.; Farhadi, A. YOLOv3: An Incremental Improvement. arXiv 2018, arXiv:1804.02767. [Google Scholar]
  22. Bochkovskiy, A.; Wang, C.Y.; Liao HY, M. YOLOv4: Optimal Speed and Accuracy of Object Detection. arXiv 2020, arXiv:2004.10934. [Google Scholar]
  23. Ge, Z.; Liu, S.; Wang, F.; Li, Z.; Sun, J. YOLOX: Exceeding YOLO Series in 2021. arXiv 2021, arXiv:2107.08430. [Google Scholar]
  24. Liu, S.; Qi, L.; Qin, H.; Shi, J.; Jia, J. Path Aggregation Network for Instance Segmentation. In Proceedings of the 2018, IEEE/CVF Conference on Computer Vision and Pattern Recognition (CVPR), Salt Lake City, UT, USA, 18–23 June 2018. [Google Scholar]
  25. Dosovitskiy, A.; Beyer, L.; Kolesnikov, A.; Weissenborn, D.; Zhai, X.; Unterthiner, T. An Image is Worth 16x16 Words: Transformers for Image Recognition at Scale. arXiv 2020, arXiv:2010.11929. [Google Scholar]
  26. Liu, Z.; Lin, Y.; Cao, Y.; Hu, H.; Wei, Y.; Zhang, Z.; Lin, S.; Guo, B. Swin Transformer: Hierarchical Vision Transformer using Shifted Windows. arXiv 2021, arXiv:2103.14030. [Google Scholar]
  27. Zhu, X.; Lyu, S.; Wang, X.; Zhao, Q. TPH-YOLOv5: Improved YOLOv5 Based on Transformer Prediction Head for Object Detection on Drone-captured Scenarios. In Proceedings of the IEEE/CVF International Conference on Computer Vision (ICCV) Workshops, Montreal, BC, Canada, 11–17 October 2021. [Google Scholar]
  28. Vaswani, A.; Shazeer, N.; Parmar, N.; Uszkoreit, J.; Jones, L.; Gomez, A.N. Attention Is All You Need. arXiv 2017, arXiv:1706.03762. [Google Scholar]
  29. Devlin, J.; Chang, M.W.; Lee, K.; Toutanova, K. BERT: Pre-training of Deep Bidirectional Transformers for Language Understanding. arXiv 2018, arXiv:1810.04805. [Google Scholar]
  30. Ding, X.; Zhang, X.; Ma, N.; Han, J.; Ding, G.; Sun, J. RepVGG: Making VGG-style ConvNets Great Again. In Proceedings of the IEEE/CVF Conference on Computer Vision and Pattern Recognition, Virtual, 19–25 June 2021. [Google Scholar]
  31. Liu, Z.; Li, J.; Shen, Z.; Huang, G.; Yan, S.; Zhang, C. Learning Efficient Convolutional Networks through Network Slimming. In Proceedings of the IEEE International Conference on Computer Vision, Venice, Italy, 22–29 October 2017. [Google Scholar]
  32. Zhang, H.; Cisse, M.; Dauphin, Y.N.; Lopez-Paz, D. mixup: Beyond Empirical Risk Minimization. arXiv 2017, arXiv:1710.09412. [Google Scholar]
  33. Everingham, M.; Van Gool, L.; Williams, C.K.I.; Winn, J.; Zisserman, A. The Pascal Visual Object Classes (VOC) Challenge. Int. J. Comput. Vis. 2010, 88, 303–338. [Google Scholar] [CrossRef] [Green Version]
  34. Lin, T.Y.; Maire, M.; Belongie, S.; Bourdev, L.; Girshick, R.; Hays, J.; Perona, P.; Zitnick, C.L.; Dollár, P. Microsoft COCO: Common Objects in Context; Springer International Publishing: Berlin/Heidelberg, Germany, 2014. [Google Scholar]
  35. Tsung, Y.; Lin, P.; Goyal, R. Focal Loss for Dense Object Detection. IEEE Trans. Pattern Anal. Mach. Intell. 2017, 2999–3007. [Google Scholar] [CrossRef] [Green Version]
  36. Liu, W.; Anguelov, D.; Erhan, D.; Szegedy, C.; Reed, S.; Fu, C.Y.; Berg, A.C. SSD: Single Shot MultiBox Detector; Springer: Cham, Switzerland, 2016. [Google Scholar]
  37. Ren, S.; He, K.; Girshick, R.; Sun, J. Faster R-CNN: Towards Real-Time Object Detection with Region Proposal Networks. IEEE Trans. Pattern Anal. Mach. Intell. 2017, 39, 1137–1149. [Google Scholar] [CrossRef] [Green Version]
Figure 1. Framework showing the overall methods used in this study.
Remotesensing 14 03246 g001
Figure 2. (a1a3) The appearance of floating-roof tanks in different diameters of GF-3 1 m SAR images; (b1b3) The appearance of fixed-roof tanks in different diameters of GF-3 1 m SAR images.
Remotesensing 14 03246 g002
Figure 3. The appearance of a single oil tank with a fixed roof. (a1) An optical image from Google Earth, (a2) an SAR image acquired with the GF-3 SL mode showing the strong scattering centers A1, A2, and B1, and (a3) the SAR geometric imaging mode of the tank. The appearance of a single oil tank with a floating roof (b1) An optical image from Google Earth, (b2) an SAR image acquired with the GF-3 SL mode showing the strong scattering centers A1, A2, B1, and B2, and (b3) the SAR geometric imaging mode of the tank.
Remotesensing 14 03246 g003
Figure 4. The appearance of oil tank slices of the OTD in densely distributed areas. (a1,b1) The SAR images acquired with the GF-3 SL imaging mode and (a2,b2) the optical images from Google Earth.
Remotesensing 14 03246 g004
Figure 5. The structure of the decoupled head in YOLOX-TR.
Remotesensing 14 03246 g005
Figure 6. The architecture of the Transformer encoder. It has two sub-layers, a multihead self-attention mechanism, and a multilayer perceptron block.
Remotesensing 14 03246 g006
Figure 7. The structure of the RepCSP backbone and RepVGG block. RepVGG contains a multibranch structure in training time and a single-path structure in inference time.
Remotesensing 14 03246 g007
Figure 8. The detection and classification result in a large-scale SAR image of Yokohama via Yolox-TR. Boxes numbered 1–3 are three densely arranged regions selected to further compare the detection results of the original YOLOX and the redesigned model YOLOX-TR.
Remotesensing 14 03246 g008
Figure 9. The visual detection results of the ablation experiments of the three densely arranged areas numbered 1–3 from Figure 8. The first column shows the ground truth (GT); the second column shows the detection results of the baseline YOLOX; and the third column shows the detection results of YOLOX-TR.
Remotesensing 14 03246 g009
Figure 10. The visual detection result of the comparison experiments of RetinaNet, Faster RCNN, SSD, YOLOv5, and YOLOX-TR.
Remotesensing 14 03246 g010
Figure 11. (a1) Missing detections of oil tanks less than 10 m in diameter on an SAR image. (a2) Optical image from Google Earth of (a1). (b1) Misclassification of oil tanks on a poorly focused SAR image. (b2) Optical image from Google Earth of (b1).
Remotesensing 14 03246 g011
Table 1. Results of the ablation experiments.
RepCSPTransformermAP%mAP0.5%Precision%Recall%F1%GFLOPS
××58.3592.1292.1889.2290.6826.6
×59.5393.7893.8590.6192.2025.3
×59.9694.1394.9790.8992.8927.3
60.8094.8295.6491.9193.7426.1
Table 2. Classification results of the ablation experiments.
RepCSPTransformerAP0.5%AP0.5:0.95%
FloatingFixedFloatingFixed
××96.487.868.348.4
×97.290.468.750.4
×97.490.968.651.1
97.791.969.152.5
Table 3. Results of the ablation experiments of the Transformer encoder added in different parts.
BackboneNeckmAP%mAP0.5%Parameters (M)GFLOPS
××58.3592.128.9426.6
×59.2093.8110.1227.0
59.9694.1311.3027.3
Table 4. Comparative results of different detectors.
MethodRoof Type (AP0.5%)mAP0.5%GFLOPSParameters (M)
FloatingFixed
RetinaNet89.372.180.781.8736.13
Faster RCNN90.378.584.491.0141.13
SSD(300)90.079.985.0137.3123.88
Yolov5-s95.288.491.815.97.3
Yolox-TR97.791.994.826.18.48
Publisher’s Note: MDPI stays neutral with regard to jurisdictional claims in published maps and institutional affiliations.

